Article

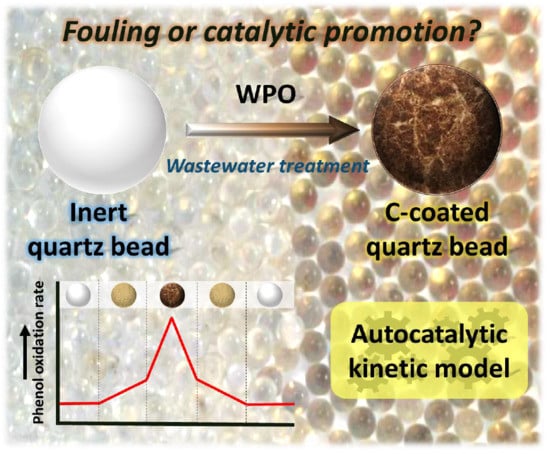
Condensation By-Products in Wet Peroxide Oxidation: Fouling or Catalytic Promotion? Part I. Evidences of an Autocatalytic Process

by
Asunción Quintanilla
1,
Jose L. Diaz de Tuesta
2,3,
Cristina Figueruelo
1,
Macarena Munoz
1,* and
Jose A. Casas
1
1
Chemical Engineering Department, Universidad Autónoma de Madrid, Ctra. Colmenar km 15, 28049 Madrid, Spain
2
Centro de Investigação de Montanha (CIMO), Instituto Politécnico de Bragança, 5300-253 Bragança, Portugal
3
Laboratório de Processos de Separação e Reação - Laboratório de Catálise e Materiais (LSRE-LCM), Faculdade de Engenharia, Universidade do Porto, 4200-465 Porto, Portugal
*
Author to whom correspondence should be addressed.
Catalysts 2019, 9(6), 516; https://doi.org/10.3390/catal9060516
Submission received: 22 May 2019 / Accepted: 6 June 2019 / Published: 11 June 2019
(This article belongs to the Special Issue Trends in Catalytic Wet Peroxide Oxidation Processes)

Abstract

:
The present work is aimed at the understanding of the condensation by-products role in wet peroxide oxidation processes. This study has been carried out in absence of catalyst to isolate the (positive or negative) effect of the condensation by-products on the kinetics of the process, and in presence of oxygen, to enhance the oxidation performance. This process was denoted as oxygen-assisted wet peroxide oxidation (WPO-O2) and was applied to the treatment of phenol. First, the influence of the reaction operating conditions (i.e., temperature, pH0, initial phenol concentration, H2O2 dose and O2 pressure) was evaluated. The initial phenol concentration and, overall, the H2O2 dose, were identified as the most critical variables for the formation of condensation by-products and thus, for the oxidation performance. Afterwards, a flow reactor packed with inert quartz beads was used to facilitate the deposition of such species and thus, to evaluate their impact on the kinetics of the process. It was found that as the quartz beads were covered by condensation by-products along reaction, the disappearance rates of phenol, total organic carbon (TOC) and H2O2 were increased. Consequently, an autocatalytic kinetic model, accounting for the catalytic role of the condensation by products, provides a well description of wet peroxide oxidation performance.

Graphical Abstract

1. Introduction

The decline of water quality is a global concern issue as it is crucial to the environment and human health, but also to our social and economic development. Over the last hundred years, the use of water grew by a factor of seven and it is expected to increase by around 55% by 2050, including a 400% rise in industry water demand [1]. This sector is not only one of the major water consumers but also the main group responsible for its pollution by a wide variety of hazardous substances, particularly persistent organic pollutants. These effluents must be treated prior to discharge, or involve recycling in the process. Biological treatment is usually not feasible for industrial wastewater treatment as they commonly contain highly toxic and non-biodegradable substances. Thermal treatments such as incineration can lead to the generation of even more hazardous substances, like dioxins or furans [2]. Adsorption is a non-destructive process and requires dealing with the resulting saturated adsorbent. Compared to these technologies, catalytic wet air oxidation (CWAO) represents an interesting alternative for industrial wastewater treatment. In fact, it is a well-established technology for such goals [3]. A number of commercial CWAO units such as LOPROX, Ciba-Geigy, ORCAN, WPO and ATHOS can be found [3]. This process involves the oxidation of the pollutants using a gaseous source of oxygen, commonly air, in the presence of a catalyst (mainly precious metals) under relatively severe conditions (150–300 °C, 10–200 bar) [3]. The use of H2O2 as an oxidant precursor instead of air, in the so-called catalytic wet peroxide oxidation (CWPO), is another well-known oxidation treatment that allows the process to operate under considerably milder operating conditions (25–120 °C, <10 bar), and thus, it represents a more environmentally-friendly alternative, although the high cost of hydrogen peroxide limits its application to highly polluted wastewaters.
The main limitation for a widespread application of CWPO at an industrial scale is related to the relatively fast deactivation of the Fe-bearing solid catalysts usually employed in this process [4,5,6]. Catalyst deactivation is a complex phenomenon but five main reasons are usually behind it: metal leaching, fouling, poisoning, thermal sintering and mechanical damage. Among them, metal leaching and fouling have been usually identified as the most important catalyst deactivation mechanisms in CWPO [4] while fouling is the major deactivation cause of CWAO catalysts [7]. Metal leaching is an irreversible process associated with the presence of organic acids in the reaction medium, refractory species commonly formed upon the oxidation of organic pollutants, which promote the complex formation and mobilization of iron [5]. Fe supported on Al2O3 or robust iron minerals appear as the most resistant catalysts to iron leaching [4,8,9] but, unfortunately, it cannot be completely avoided, especially with highly-polluted wastewaters, where organic acids will be formed in significant amounts. In this context, the use of metal-free catalysts has gained great importance in recent years. In particular, carbon materials like activated carbon, graphite, carbon black, carbon nanotubes and carbon xerogels have been postulated as promising CWAO/CWPO catalysts due to their outstanding donor-acceptor properties [10,11,12,13]. In any case, both metal-based and metal-free catalysts can suffer fouling, i.e., blocking of the catalytic active sites by carbonaceous deposits, mainly by condensation/polymerization products formed by oxidative coupling reactions.
The generation of condensation by-products along the oxidation of persistent organic pollutants by both CWPO and CWAO processes has been evidenced in the literature in a number of works [7,14,15,16,17,18,19,20]. Poerschmann et al. (2009) [15] deeply characterized for the first time the polymeric species generated along the wet peroxide oxidation of phenol with dissolved iron. They demonstrated the formation of different dimers such as biphenyls and diphenylethers, which ultimately resulted in the formation of a dark brown solid oligomer that remained in suspension in the aquatic environment. When a solid catalyst is used, those condensation by-products are adsorbed onto its surface, this phenomenon is usually described as fouling. Commonly, it is a reversible process and the catalyst can be regenerated by applying more efficient oxidation conditions, i.e., increasing H2O2 concentration or operating temperature; or by direct catalyst calcination at temperatures around 350 °C [10], threshold value assigned to the burn-off of these polymeric species, although it can also occur at lower temperatures if supported-metal catalysts are used [21]. The deposition of those condensation by-products has been usually regarded as a catalyst deactivation cause (coking) but recent studies have demonstrated that there are many cases like oxidative dehydrogenation, hydrogenation, isomerization and Fischer-Tropsch reactions where such deposits can even improve the catalytic performance [22]. In particular, it has been proved that coke can promote the activity of the catalyst [23], enhance the selectivity to the desired product [24] or even act as a new reaction site [25,26]. It is clear that a deep understanding of the mechanisms by which carbon deposits cause catalyst deactivation or promote catalytic activity is essential to optimize the efficiency of a given process. Nevertheless, the role of these species on CWPO and CWAO processes remains unclear in the literature. In most studies, the adsorption of such species on the catalyst surface was identified as the main reason to explain the loss of activity of the catalysts [10,21,27,28,29,30]. Nevertheless, Delgado et al. (2012) [20] found that the covering of the catalyst by carbonaceous deposits was actually the preliminary step for the CWAO of phenol. On the other hand, little is known about the nature of the carbonaceous deposits although it is widely accepted that they are formed through condensation reactions of aromatic radical species [20,30]. Only in a few works, catalyst regeneration by thermal oxidation treatments within the range 200–350 °C in air atmosphere was investigated [10,20,27,29].
Inspired by the recent review of Collet et al. (2016) [22], where the beneficial role of carbonaceous deposits in a number of catalytic processes has been summarized, this work aims to clarify the role of those condensation by-products in wet oxidation. As industrial wastewater treatment is the target of this study and given the wide commercial application of CWAO for such goal, the oxygen-assisted wet peroxide oxidation process (WPO-O2) has been investigated in order to maximize the efficiency of the system while operating under mild conditions. Phenol has been chosen as the target pollutant given its toxicity and persistency as well as its regular use in research, which facilitates comparison purposes. A complete operating condition study was initially performed in the absence of catalyst to clarify the possible synergic effect between H2O2 and O2 as well as to learn on the formation of condensation by-products in the homogeneous phase. Once selected the optimum operating conditions, a flow reactor packed with inert quartz beads was used in order to facilitate the deposition of those condensation by-products and thus, to evaluate their impact on the oxidation performance. On the basis of the obtained results, the reaction pathway for phenol oxidation was proposed and a complete kinetic model accounting for the activity promoted by the condensation by-products was developed to describe the experimental data (temporal concentration of phenol, total organic carbon (TOC) and H2O2).

2. Results and Discussion

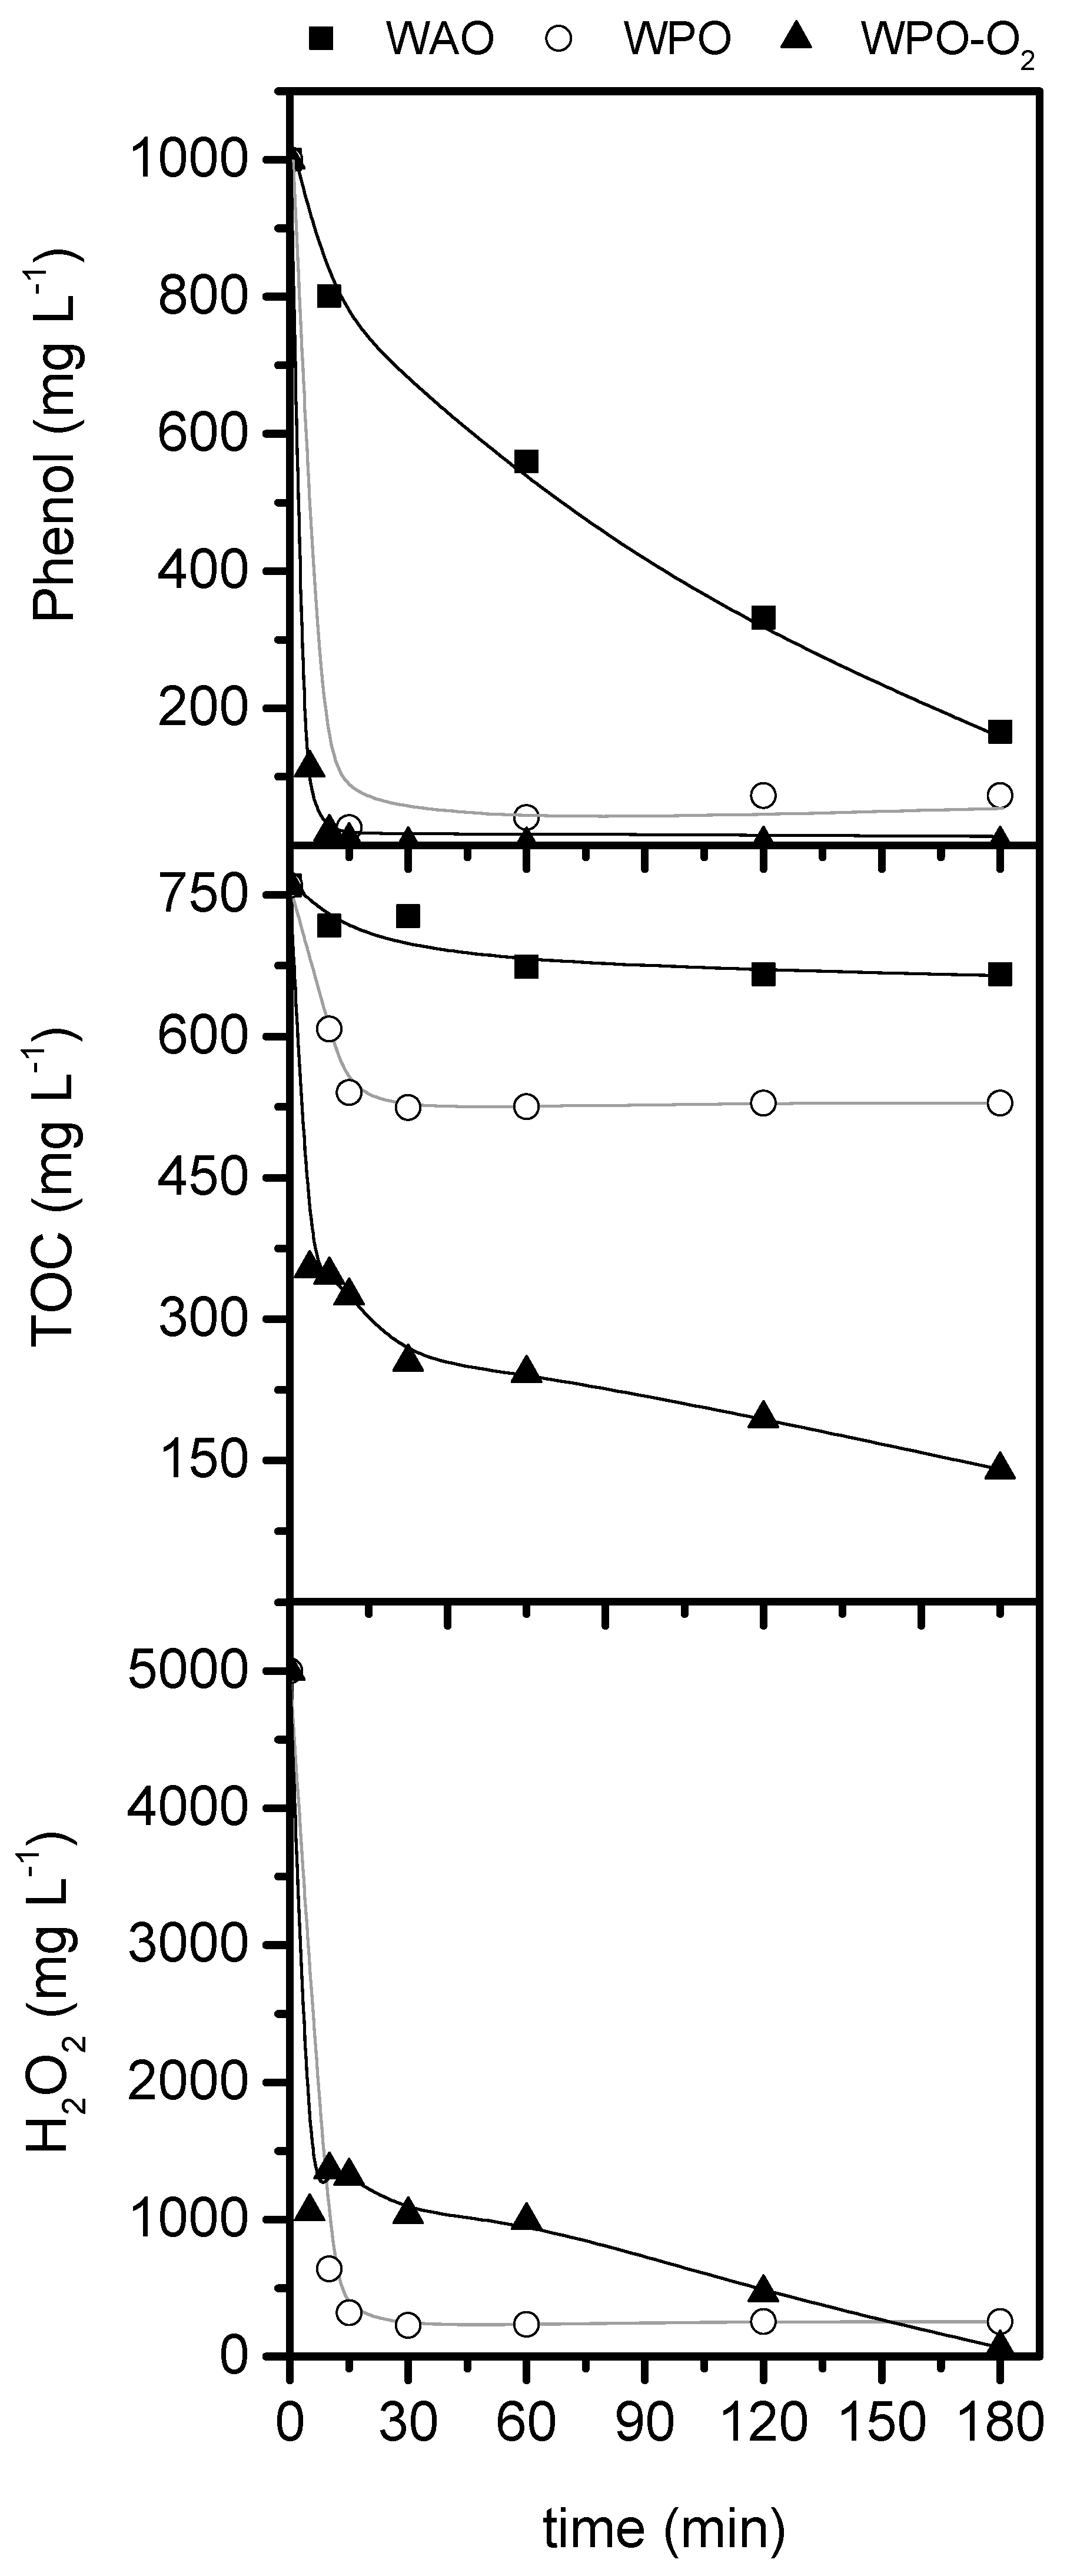
2.1. Preliminary Study

The first set of experiments was focused on the comparison between wet air oxidation (WAO), wet peroxide oxidation (WPO) and oxygen-assisted wet peroxide oxidation (WPO-O2) in the degradation of phenol ([Phenol]0 = 1000 mg L−1) under moderate operating conditions ([H2O2]0 = 5000 mg L−1, T = 127 °C, PO 2= 8 bar, QO2 = 92 NmL min−1, natural pH0). Figure 1 shows the evolution of the target pollutant, TOC and H2O2 reactions, with the three treatment systems. It is clear that the presence of H2O2 played a key role in the oxidation process. In this sense, both WPO-O2 and WPO systems allowed to reach the complete conversion of phenol in 10 min reaction time, whereas only 20% phenol removal was achieved upon WAO at the same reaction time. Accordingly, the initial phenol oxidation rates with the former processes were around 100 mgphenol L−1 min−1 and that of the latter was 60 mgphenol L−1 min−1. The synergic effect between oxygen and hydrogen peroxide was more clearly evidenced in the mineralization of TOC. The mineralization yield, i.e., the percentage of TOC completely oxidized to CO2, was calculated by the difference between the TOC measured in the final reaction samples and the initially present in the starting solution (1000 mg L−1 phenol). Up to 80% mineralization yield was reached with the WPO-O2 process, whereas only 30% and 15% were achieved with WPO and WAO, respectively. The initial TOC abatement rates were 44, 15 and 4 mgTOC L−1 min−1 for WPO-O2, WPO and WAO, respectively. On the other hand, the consumption of H2O2 along reaction was slightly slower in the presence of oxygen (WPO-O2), giving rise to a higher efficiency on the use of this reagent (η) –calculated as the ratio between the conversion of TOC and that of H2O2 (82% and 32% for WPO and WPO-O2, respectively).
The kind of oxidation treatment system used also showed a significant impact on the distribution of intermediates generated along the process. As can be seen in Figure 2, the WPO-O2 process warranted the complete removal of the cyclic compounds, being the final oxidation products short-chain organic acids, which represented 18% of the initial TOC. The remaining 82% of the initial TOC was mineralized. The amount of CO2 was calculated as the difference between the TOC of the target solution (1000 mg L−1 phenol) and the TOC of the final reaction effluent. Therefore, in this case, the carbon balance was closed at almost 100% after 3 h reaction time. On the contrary, WPO and WAO processes, which showed significantly lower mineralization yields (30% and 15%, respectively), led to a significant amount of aromatic intermediates (9% and 27%, respectively) and non-identified products (47% and 53%, respectively), calculated by the difference between the TOC measured and the calculated from the identified compounds, usually associated with condensation/polymerization compounds [14,15]. Consequently, the presence of short-chain organic acids was of very low relevance (9% and 7%, respectively). The evolution of the cyclic compounds (hydroquinone, resorcinol, catechol and benzoquinone) along reaction as well as the amount of short-chain organic acids (maleic, malonic, oxalic, acetic and formic) present in the final effluents are provided in Figures S1 and S2 of the Supplementary Material, respectively.
According to the obtained results, it is clear that the WPO-O2 process operated under moderate conditions represents an interesting non-catalytic oxidation process in terms of degradation rate, mineralization yields, H2O2 consumption efficiency and products distribution. Therefore, it represents a suitable starting point to evaluate the role of condensation by-products on the oxidation performance.

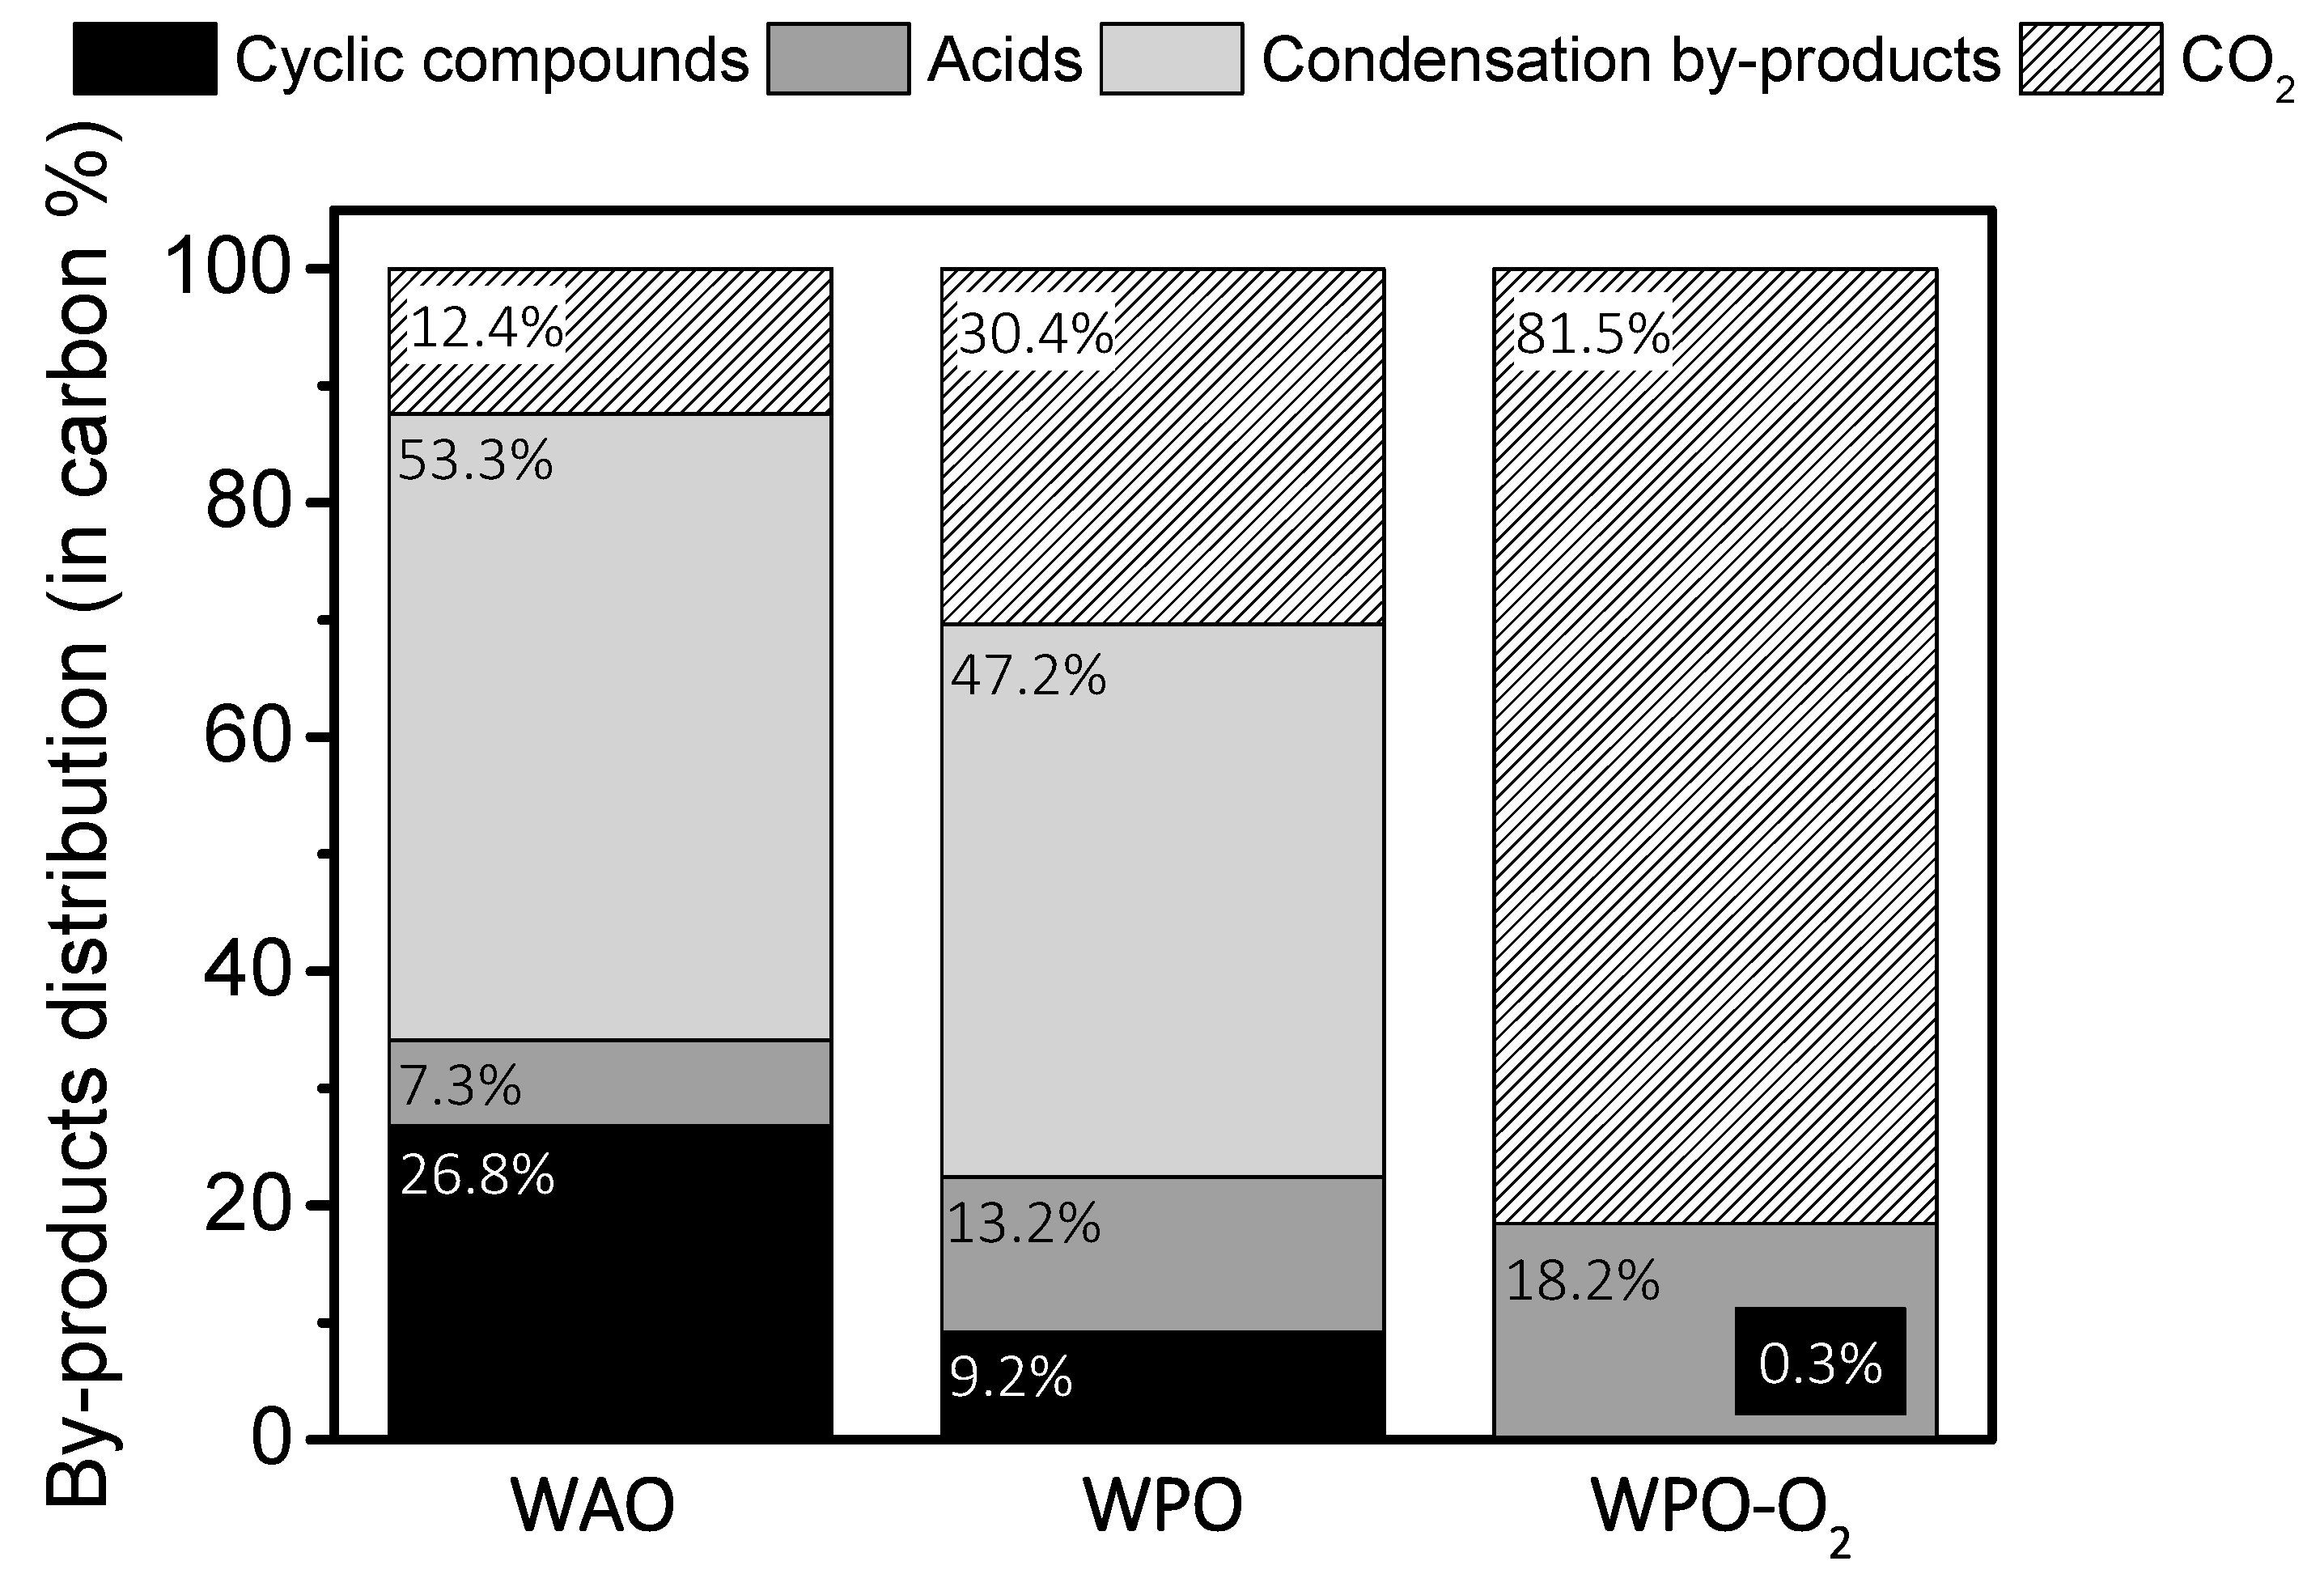
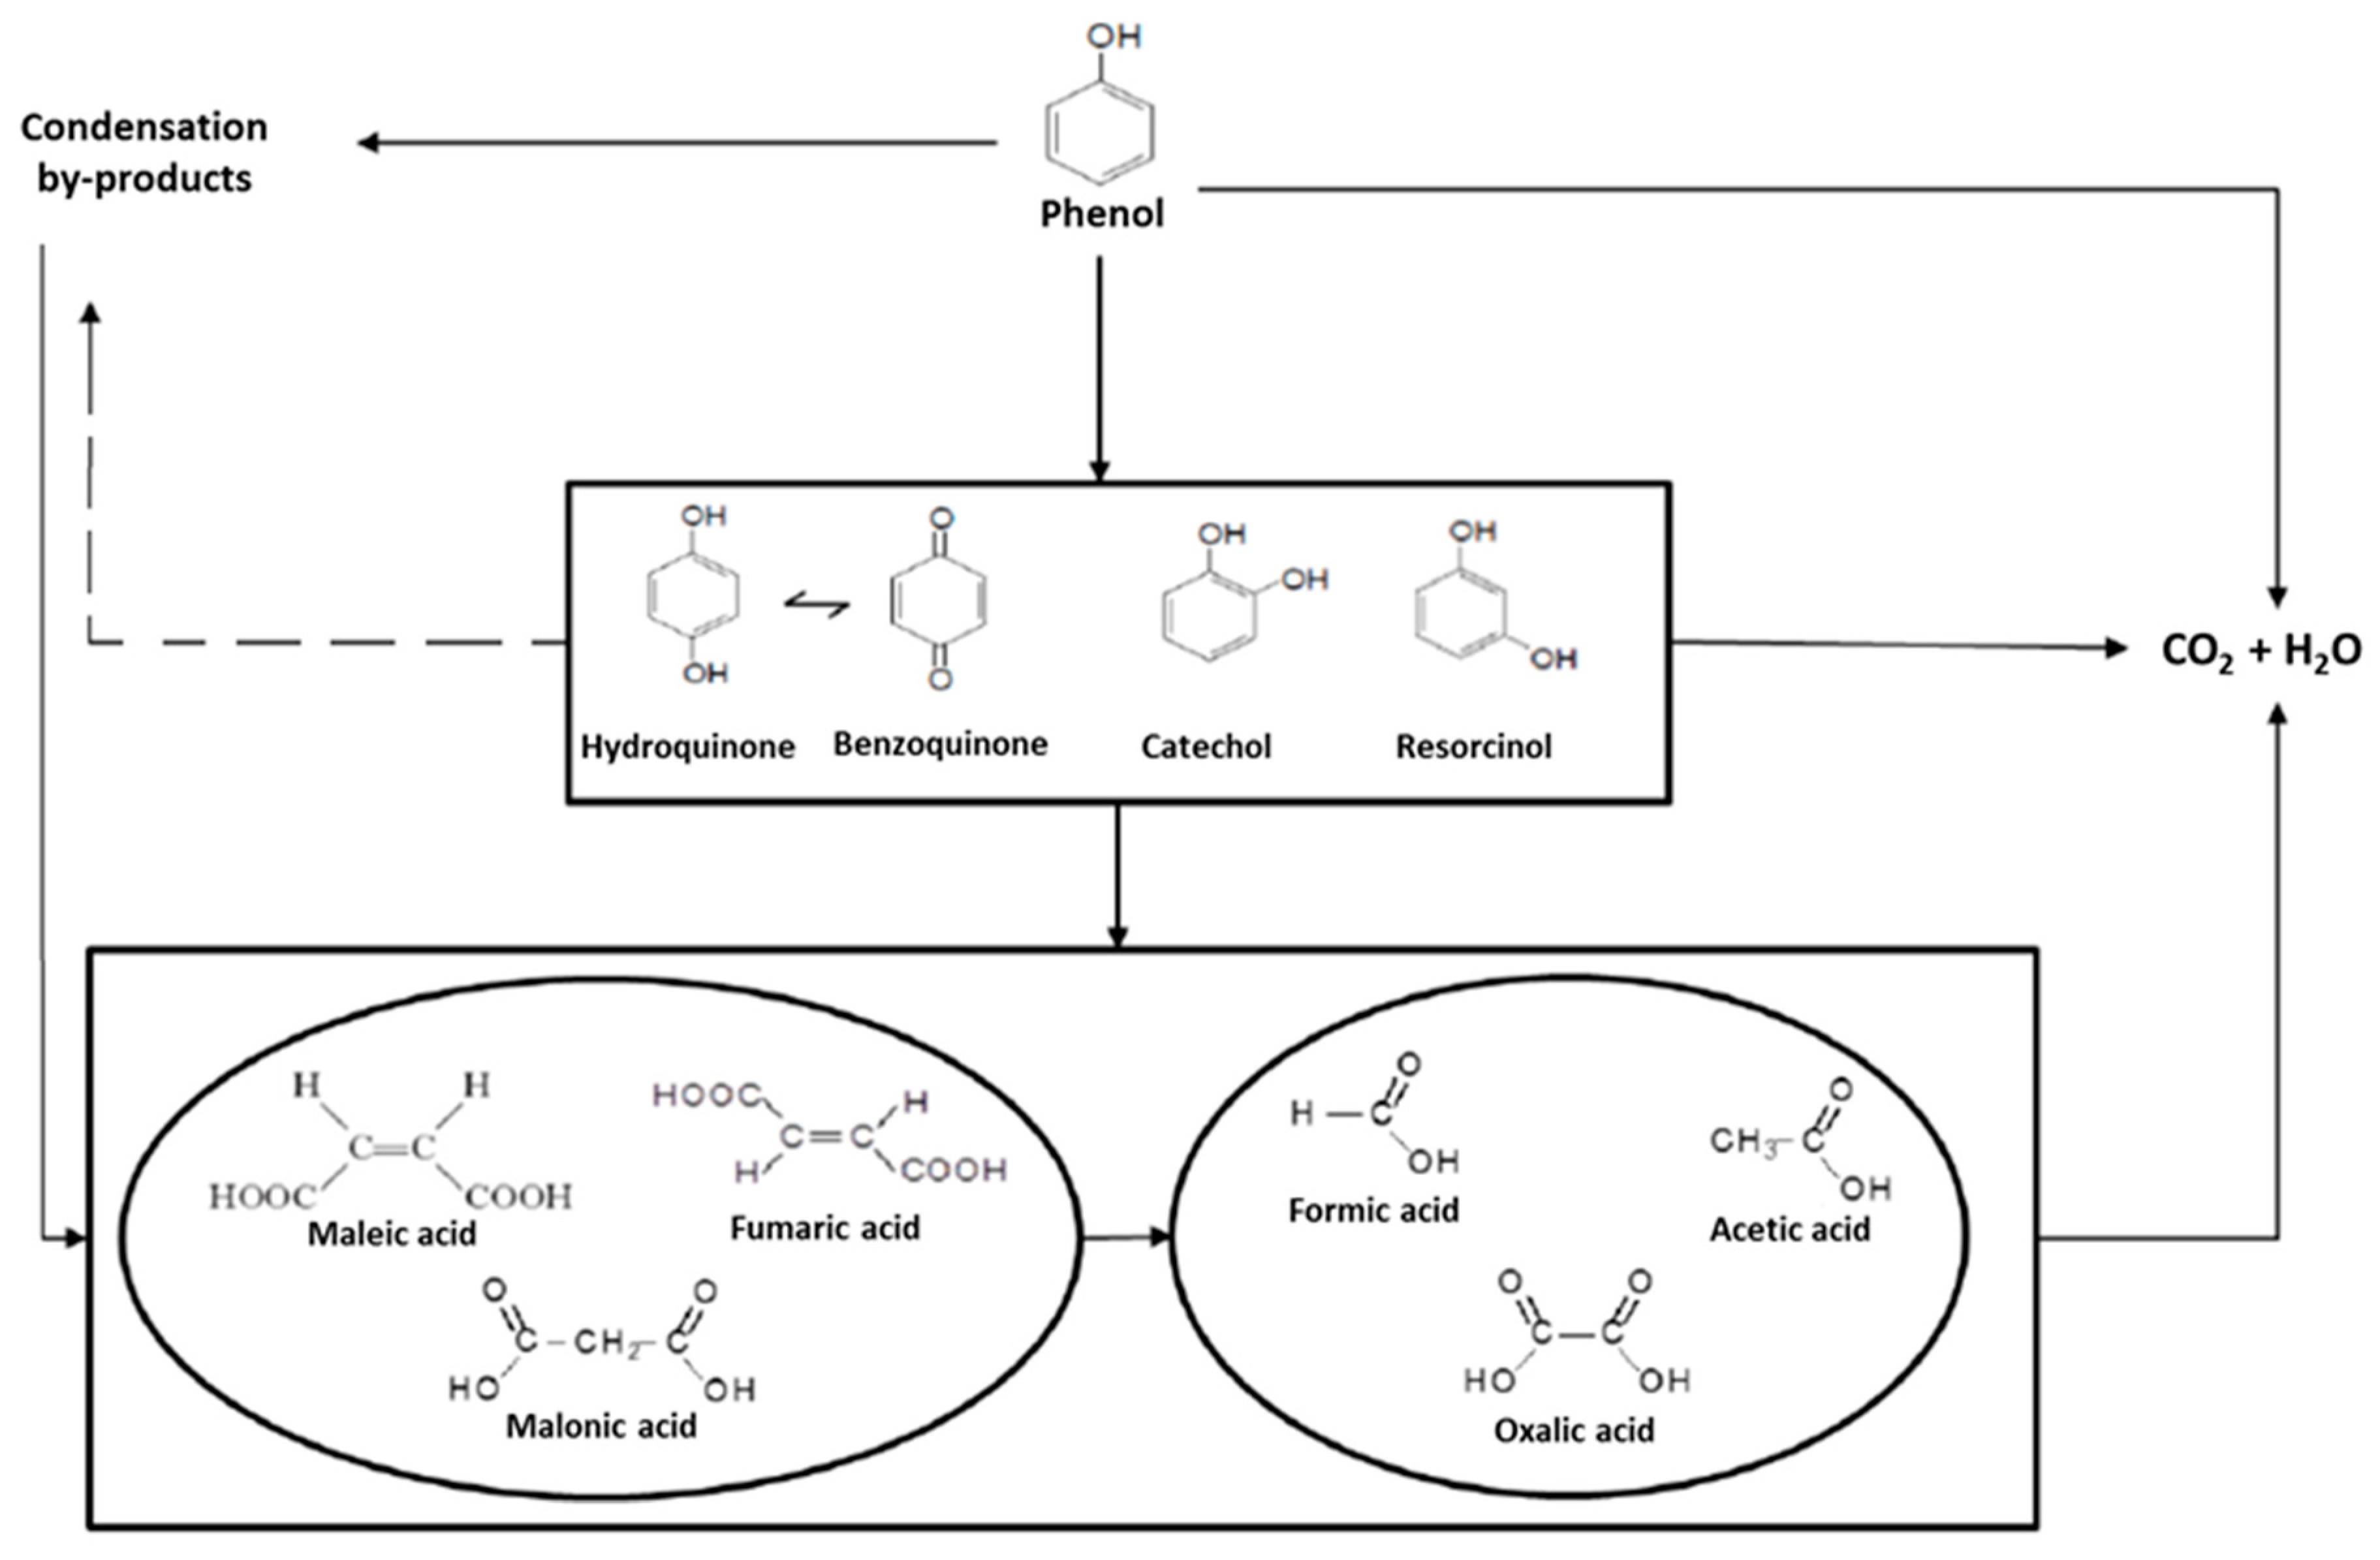
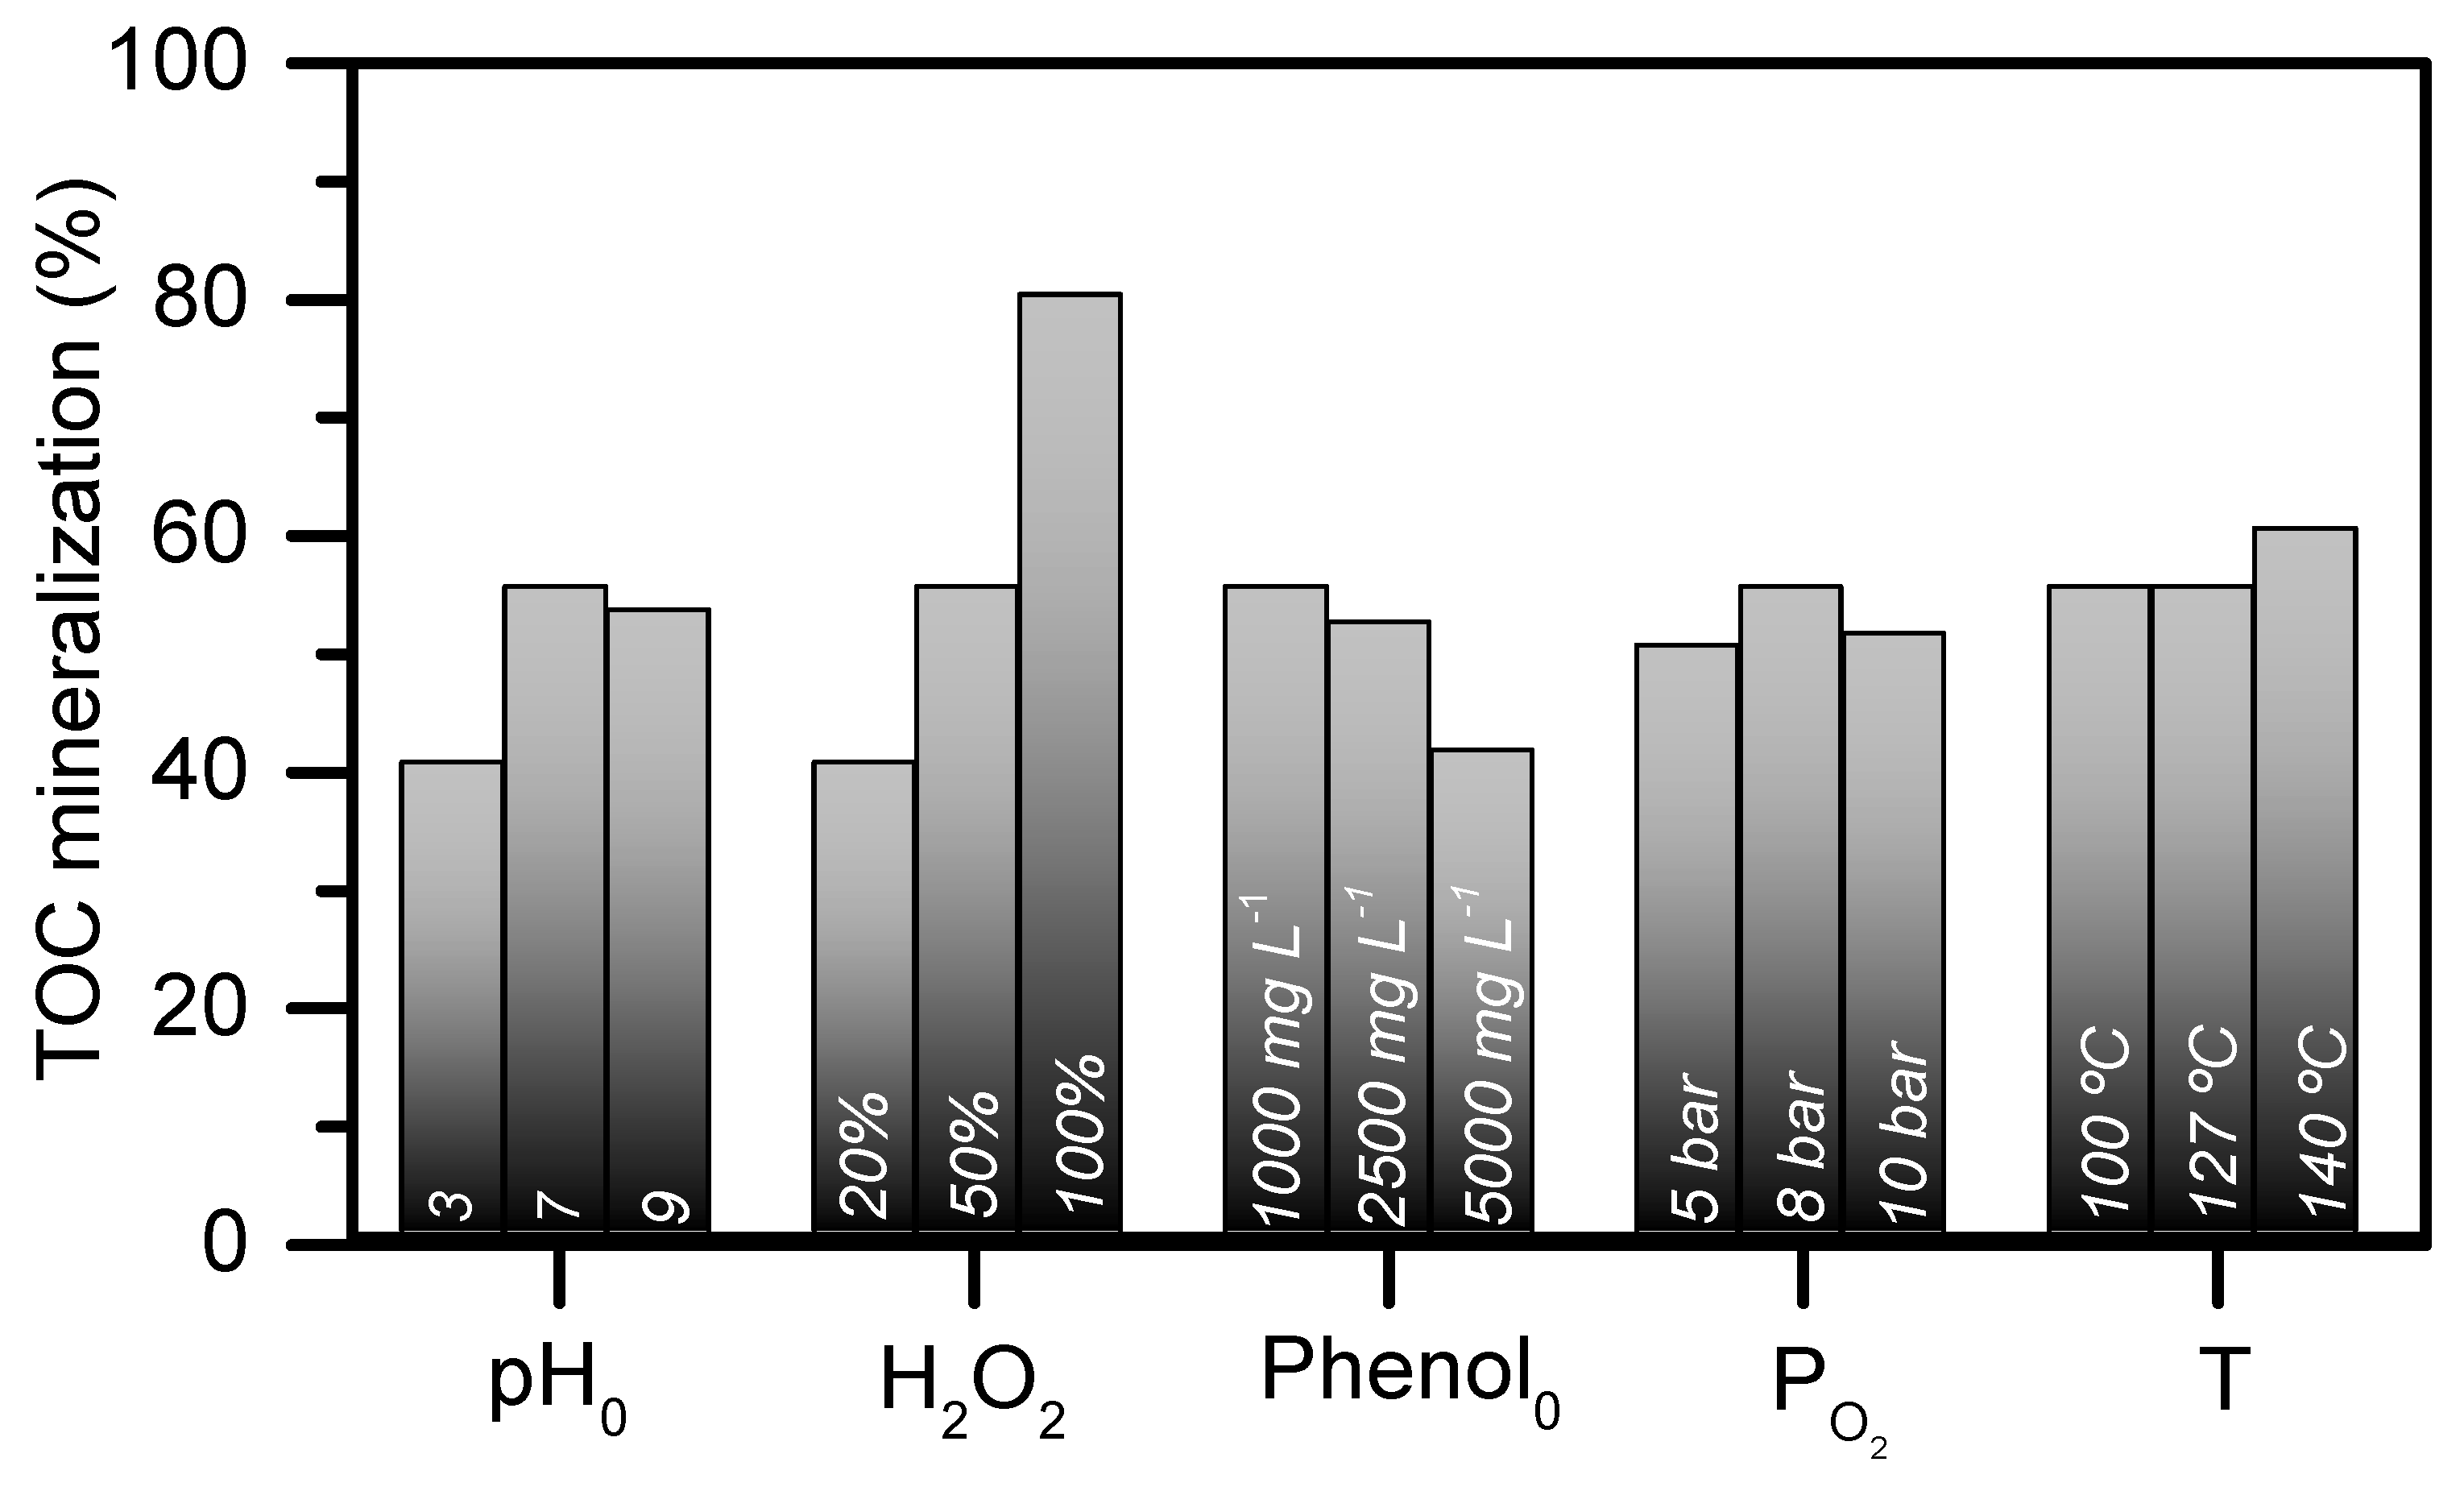
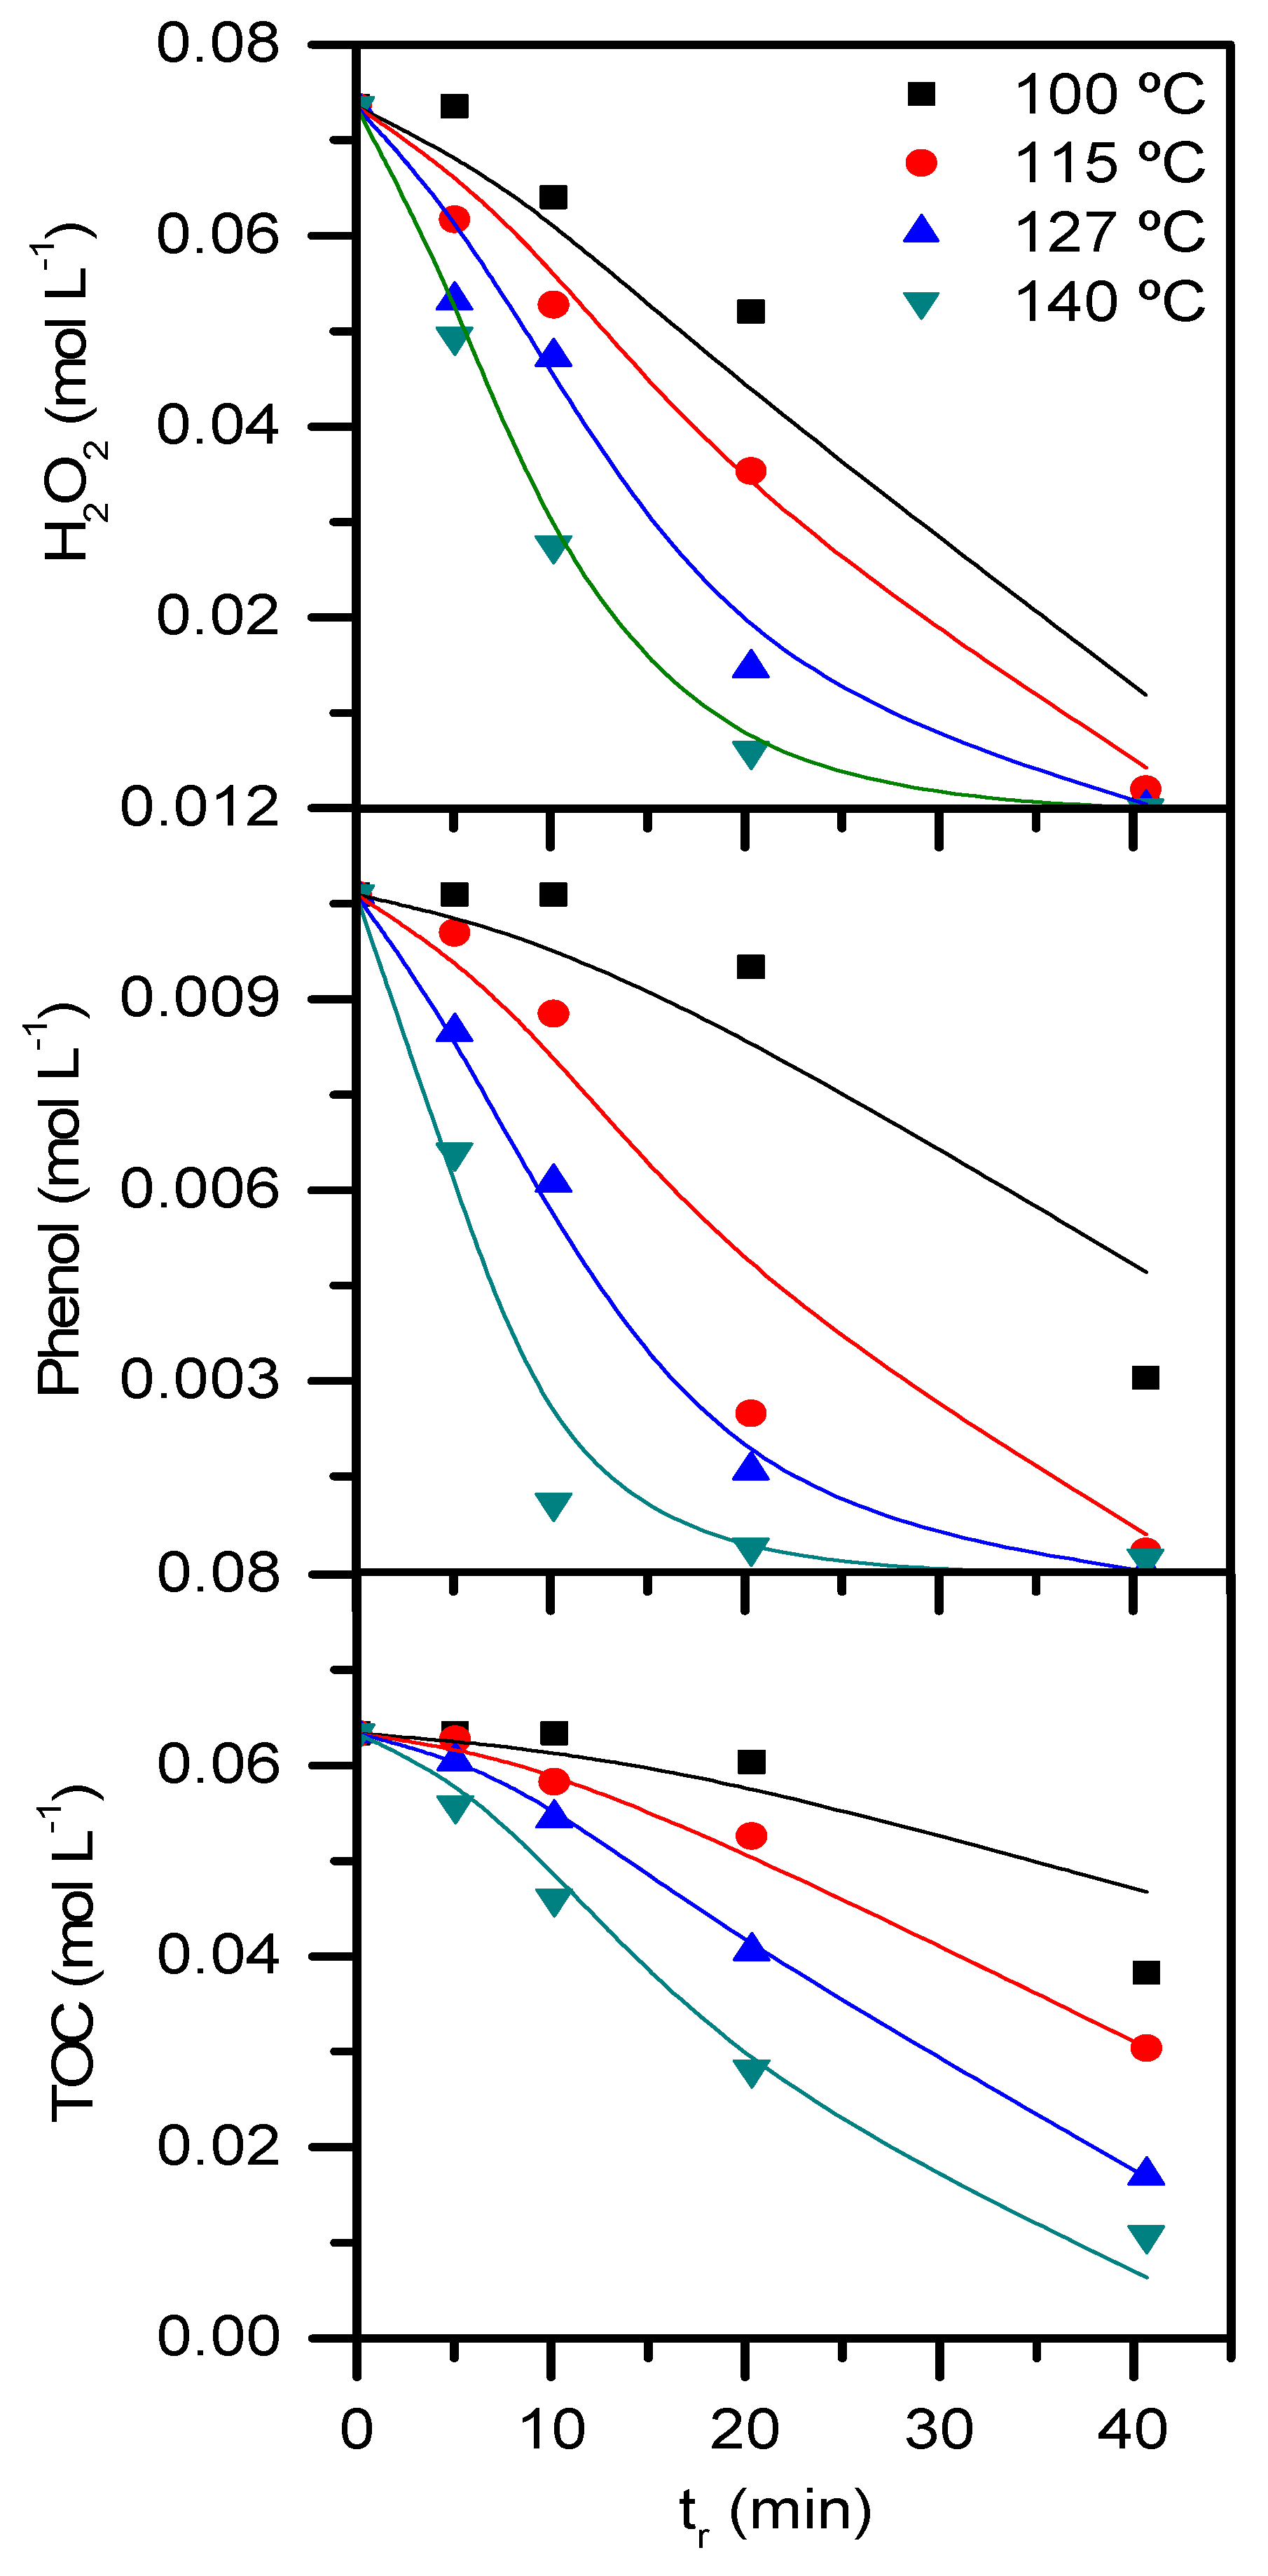
2.2. Operating conditions study: Formation of condensation by-products

A complete operating condition study was performed, analyzing the effect of pH0 (3–9), initial phenol concentration (1000–5000 mg L−1), H2O2 dose (20–100% of the stoichiometric amount), O2 pressure (5–10 bar) and operating temperature (100–140 °C). A summary of the obtained results in terms of TOC mineralization can be seen in Figure 3 (see Figures S3–S7 of the Supplementary Material for all experimental data). As observed, the major impact on TOC mineralization was related to the H2O2 dose, an essential variable to be optimized in the WPO-O2 process given its significant weight on the economy of the process. On the other hand, the pressure of O2 did not show a relevant influence on the oxidation performance, demonstrating the prominent role of hydroxyl radicals from H2O2 as oxidant. Nevertheless, it should be noted that mineralization yields higher than the expected by only H2O2-promoted oxidation were obtained with substoichiometric H2O2 doses, which confirms that oxygen acted as supplemental oxidant. A neutral pH0 value led to a higher extension of the reaction. At higher pH0, the decomposition of H2O2 follows another pathway and only a small fraction of H2O2 leads to oxidants able to degrade the pollutants [31,32]. In the same line, at acidic conditions, hydroxyl radicals interact with protons, leading to lower reactive species [33]. With regard to the temperature, it presented a significant effect on the oxidation rate (initial phenol abatement rates of 100, 150 and 180 mgPhenol L−1 min−1 were obtained at 100, 127 and 140 °C, respectively) but it did not increase remarkably the extension of the reaction, which depends on the amount of oxidant (see Figure S8 of the Supplementary Material for experimental data). Finally, the initial concentration of phenol also showed an important influence on the mineralization yield, which can be explained by the different efficiency on the consumption of H2O2 achieved with increasing phenol concentration. The presence of higher H2O2 amounts from the beginning of the reaction unavoidably led to the appearance of parasitic reactions, being especially important with an initial phenol concentration of 5000 mg L−1. Furthermore, the presence of high amounts of phenol also led to the formation of high quantities of organic radicals, leading to the formation of higher concentrations of condensation products. In this case, the distribution of the H2O2 dose along reaction would be required to achieve higher mineralization yields. On the basis of these results, a neutral pH0 value, an initial phenol concentration of 1000 mg L−1, an O2 pressure of 8 bar and 127 °C were the operating conditions selected for further experiments while the effect of H2O2 was evaluated in more detail.
The operating condition study allowed to confirm the critical role of H2O2 on the performance of the WPO-O2 process. On the other hand, taking into account previous works [14,15,34], it is expected that this variable will be intimately related to the formation of condensation by-products. To better understand the effect of H2O2 on the reaction, Figure 4 shows the evolution of this reagent as well as the resulting mineralization yield along the treatment using different H2O2 doses. The evolution of color, was also evaluated. As observed, after 3 h of reaction, the effluent color varied from dark-brown to colorless depending on the H2O2 dose and therefore on the TOC conversion achieved (from 40 to 80%, respectively). The change in color upon phenol oxidation have been previously described in the literature [12,14,15,20,34,35], not being attributed to low significance trace components but to the main reaction intermediates, mostly condensation products. These species are formed by oxidative coupling reactions of the highly reactive phenolic radical derivatives [36].
The results allowed the confirmation that the formation of condensation by-products was actually a primary step on the oxidation reaction and that they could be completely eliminated along the process when the stoichiometric amount of H2O2 was used. Accordingly, the color of the reaction mixture can be seen as a direct indication of the oxidation level achieved. In fact, almost 40% TOC mineralization was achieved in only a three minute reaction time (brown solution color), when the stoichiometric amount of H2O2 was used. That mineralization yield was similar to the achieved when 20% of the stoichiometric amount of H2O2 was employed. In the same line, the light brown color was associated with a mineralization yield around 55% while the colorless effluent showed a TOC reduction above 80%.
In addition to the condensation by-products, aromatic species such as hydroquinone, catechol and in lower amounts p-benzoquinone and resorcinol were detected upon the WPO-O2 at the operating conditions of Figure 4b. Acids such as maleic, fumaric, oxalic, malonic, acetic and formic were also identified. The aromatic species were completed oxidized after 3 h of reaction at the 100% H2O2 stoichiometric dose. Only, oxalic, acetic and formic acids were detected in the reactor effluent at those operating conditions. Based on these findings, the reaction pathway of Figure 5 is proposed for the WPO-O2 of phenol.

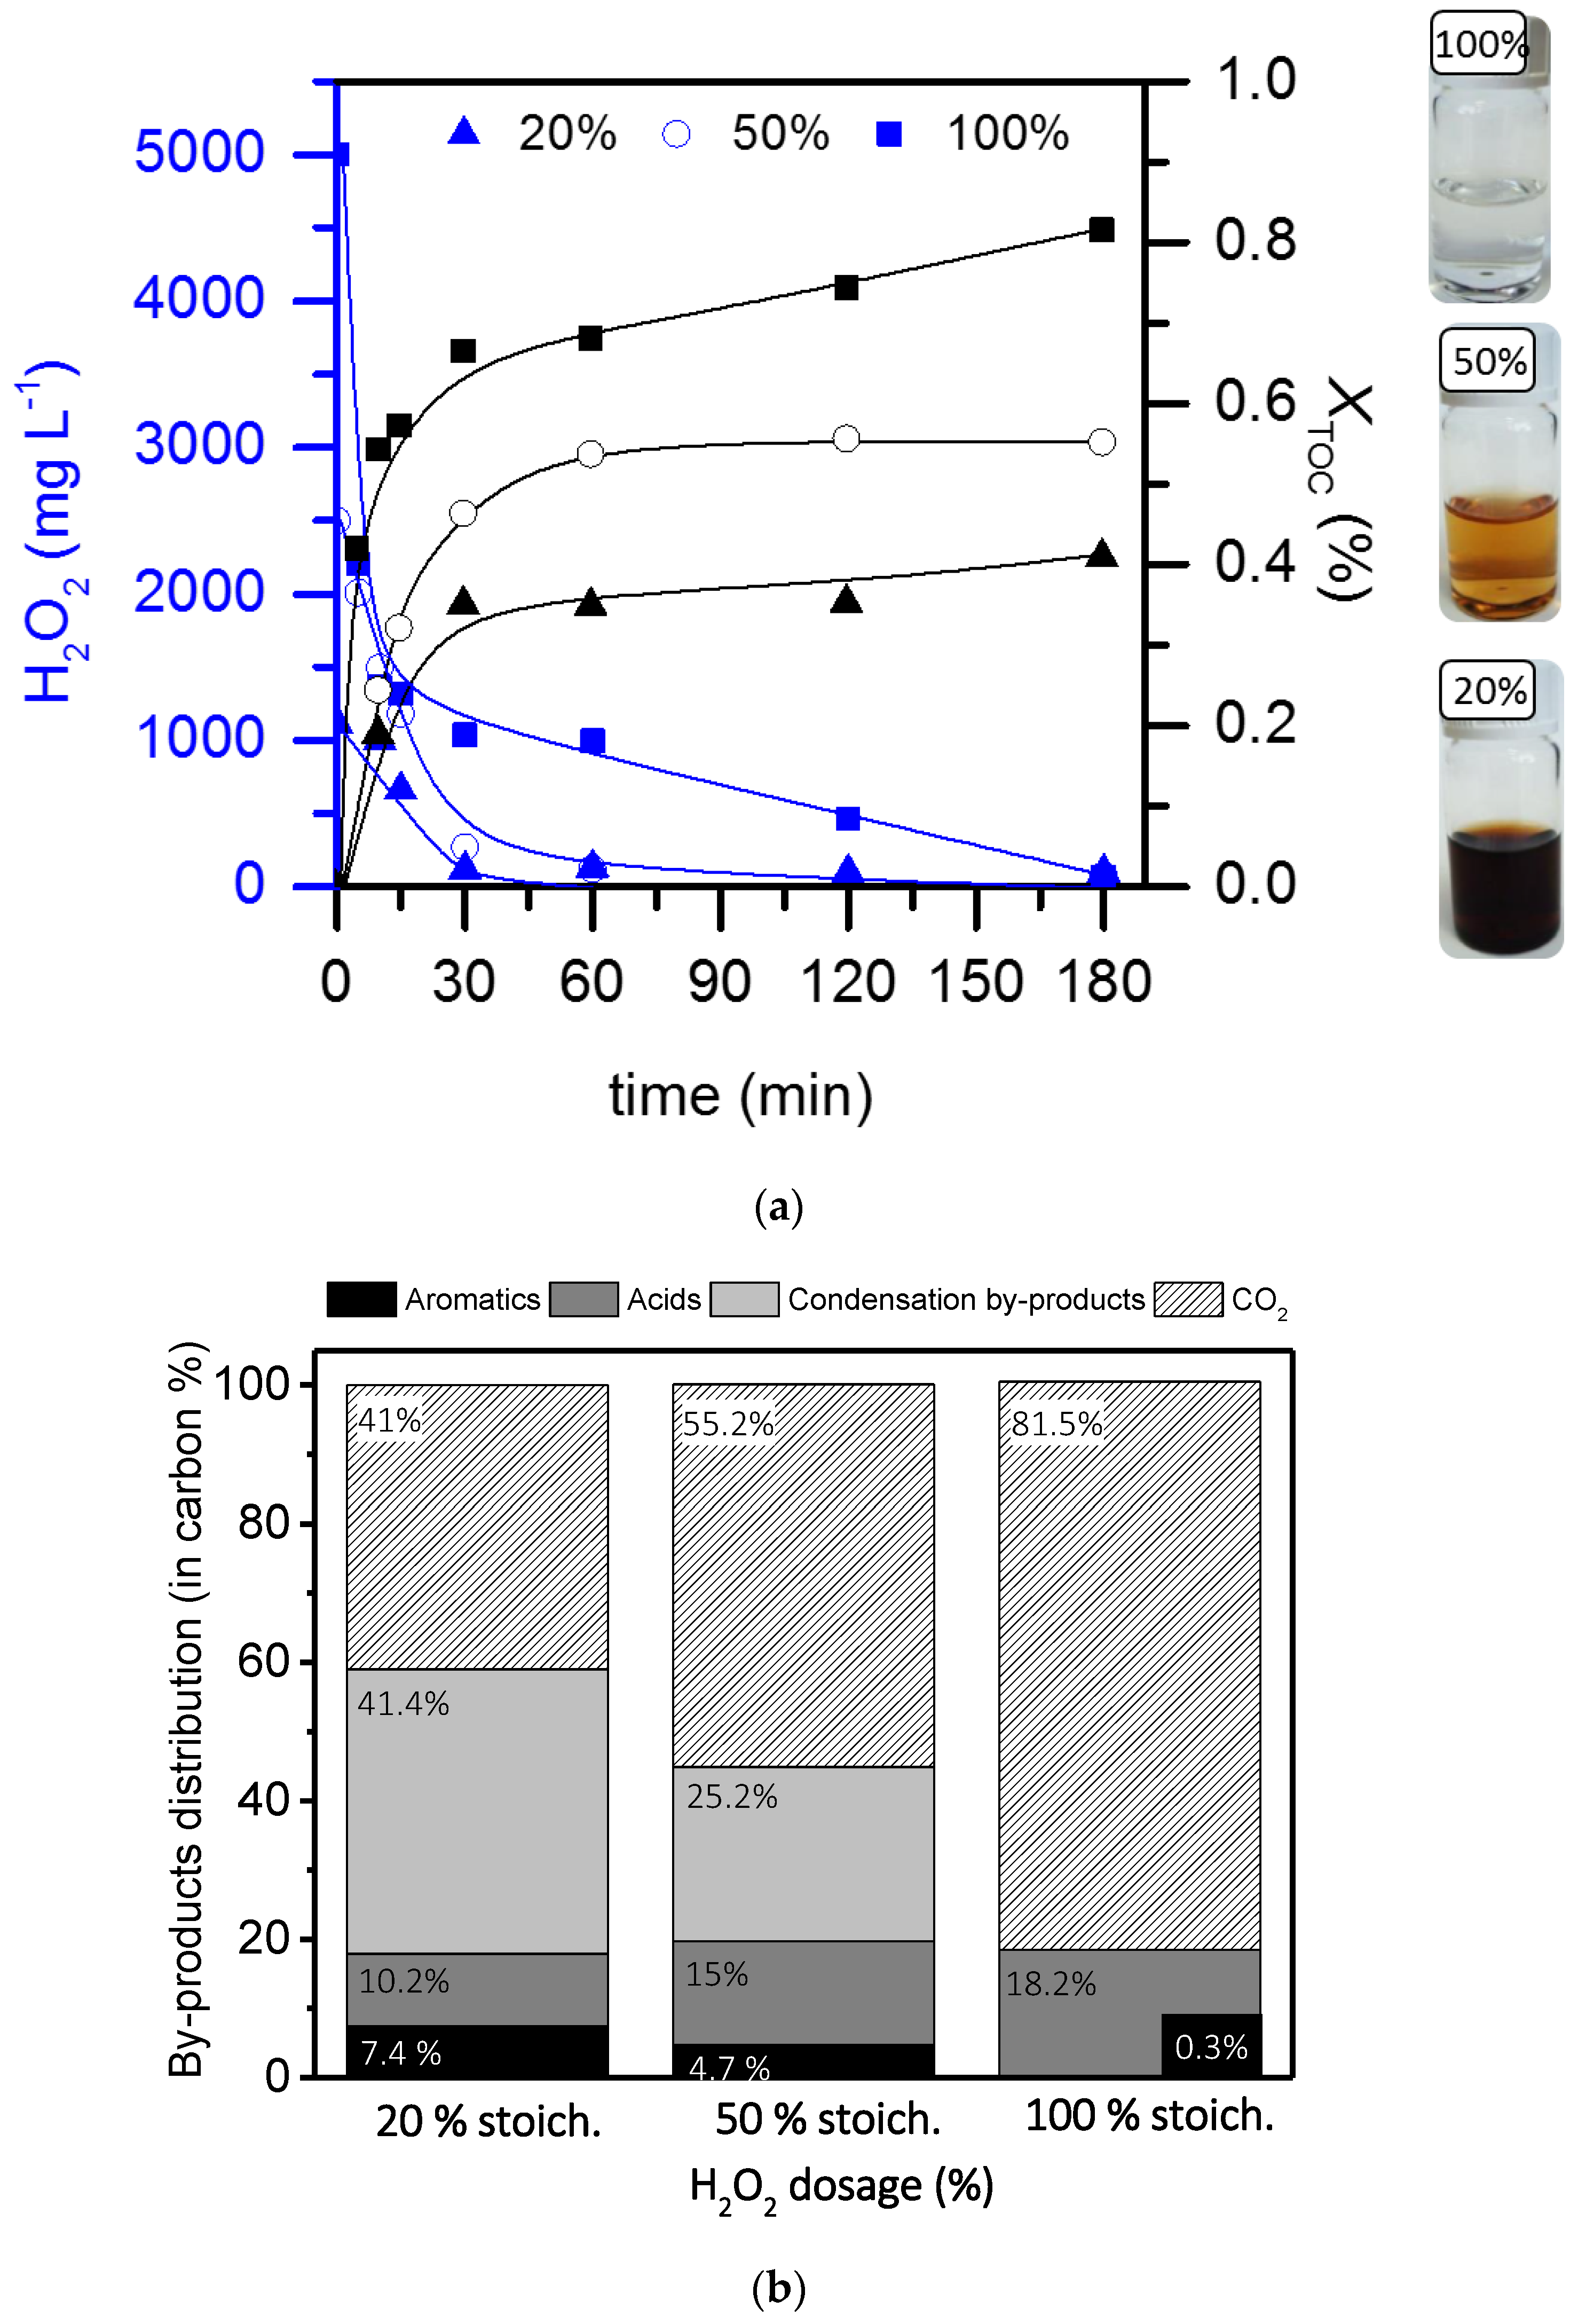
2.3. Role of condensation by-products on the kinetics of the process

In order to elucidate the role of the condensation by-products upon the WPO-O2 process, the kinetics were investigated in a flow reactor. The reactor was packed with inert quartz beads (mass: W = 29 g, particle diameter: ϕbeads= 2 mm, and bed porosity: εL= 0.32) to provide an available surface for the deposition of condensation by-products. The oxidation runs were performed in concurrent up-flow under the operating conditions previously selected: [Phenol]0 = 1000 mg L−1, PO2 = 8 bar and neutral pH0. The dose of H2O2 was established at 50% of the stoichiometric amount (2500 mg L−1) to warrant the presence of condensation by-products. The temperature was varied within the range of 100–140 °C.
The concentration profiles of phenol, TOC and H2O2 vs. residence time (tr) at the different operating conditions are shown in Figure 6 (in symbols).
Assuming isothermal plug-flow reactor, the mass balance of a given compound in liquid-phase (i) can be expressed as:
Q L · d C i = ( r i ) · d V L
where Ci is the molar concentration of the i species in mol· L−1, (−ri) the reaction rate of i reactant in mol L−1 s−1 and VL the liquid volume in the reactor, in L, calculated as εL•VR.
Considering that the flow rate (QL) remains constant, the residence time (tr) is defined as VL/QL, then Equation (2) can be obtained from Equation (1):
d C i d t r = ( r i )
Accordingly, the corresponding mass balances for phenol disappearance, H2O2 consumption and TOC abatement can be expressed as:
d C H 2 O 2 d t r = ( r H 2 O 2 )  
d C P h e n o l d t r = ( r p h e n o l )
d C T O C d t r = ( r T O C )
Different reaction rate equations have been proposed to fit the experimental data (Figure 6), viz. pseudo-first order for each species, Langmuir-Hinshelwood-Hougen-Watson (LHHW) and autocatalytic rate equations. The numerical integration of the rate equations in the plug-flow reactor with the initial conditions CPhenol= CPhenol,0, CH2O2= CH2O2,0 at t = 0 was solved by using the Microsoft Excel Solver (Microsoft Office, 2010, MicrosoftCorp., Redmond, WA, USA) based on the Generalized Reduced Gradient (GRG) algorithm for least squares minimization. The equations were fitted at all temperatures simultaneously considering the Arrhenius equation to determine activation energy (Ea), the pre-exponential factor (k0) and hence the kinetic constants (k).
The pseudo-first order and LHHW models failed to describe the experimental data (see Figures S9 and S10, respectively, of Supplementary Material to compare the experimental and predicted values). None of them consider the presence of an induction period in the concentration profiles of the three species (phenol, H2O2 and TOC), which was particularly significant at 100 °C. On the contrary, the autocatalytic model takes into account this phenomenon. This model considers that the catalyst is formed during the reaction, as in the case of the condensation by-products. As it has been above demonstrated, they are formed in the first stages of the reaction and afterwards, they are progressively degraded. Therefore, it is proposed that the increase in the concentration of condensation by-products in the beginning of the reaction enhances the decomposition of H2O2, and thus, the oxidation of phenol and TOC. The scheme proposed to describe the autocatalysis of H2O2 decomposition into radical species and the reaction of those radical species with phenol and TOC is the following:
H 2 O 2   O 2 / T   H O +   O H
Phenol + HOPhenol + H2O
Phenol + PhenolCP
H 2 O 2   C P   H O +   O H
where CP represents the condensation by-products.
The corresponding rate equations are:
( r H 2 O 2 ) = k H 2 O 2 · C H 2 O 2 · C C P = k H 2 O 2 · C H 2 O 2 · ( C H 2 O 2 , 0 C H 2 O 2 )
( r P h e n o l ) = k P h e n o l · C P h e n o l · C C P = k P h e n o l · C P h e n o l · ( C H 2 O 2 , 0 C H 2 O 2 )
( r T O C ) = k T O C · C T O C · C C P = k T O C · C T O C · ( C H 2 O 2 , 0 C H 2 O 2 )
where the CP concentration is proportional to the decomposed H2O2 amount.
The resulting differential equations of this autocatalytic model are:
( r H 2 O 2 ) = 925 · exp ( 4100 T ) · C H 2 O 2 · ( 0.074 C H 2 O 2 )
( r P h e n o l ) = 8.5 · 10 4 · exp ( 9500 T ) · C P h e n o l · ( 0.074 C H 2 O 2 )
( r T O C ) = 1.5 · 10 4 · exp ( 5700 T ) · C H 2 O 2 · ( 0.074 C H 2 O 2 )
The good agreement found between the experimental and calculated values (in Figure 6) allows to validate the autocatalytic model proposed and to demonstrate the catalytic role of condensation by-products in the WPO process. The parity plot in Figure 7 finally compare the calculated and measured concentrations of phenol, H2O2 and TOC evolution upon WPO-O2 of phenol over quartz beads within the temperature range 100–140 °C using the autocatalytic kinetic model. The initial low-activity period can be then explained by the formation of such species in the reaction medium with the consequent coverage of the quartz beads, which is considerably slower at low temperatures. For instance, at 10 min of residence time and 100 °C, no significant phenol conversion was observed whereas up to 90% phenol removal was achieved at 140 °C. It is important to mention that only 50% of the stoichiometric amount of H2O2 was used and thus, complete removal of the condensation by-products was not completely achieved, as evidenced by the brown color of the used quartz beads (Figure 8). Nevertheless, a higher degradation of these species at higher reaction temperatures is expected.
The results obtained in this work allow us to demonstrate that the condensation by-products formed with wet oxidation can catalyze the process. These results are in line of other studies where the beneficial role of carbon deposits has been also proved in different reactions [22]. For instance, Teschner et al. (2006) [24] found that the palladium-carbon surface formed in the early stages of alkyne hydrogenation was actually the active phase responsible for the highly selective hydrogenation of 1-pentyne to 1-pentene. In the same line, Gornay et al. (2010) [23] demonstrated that the coke formed on the walls of the reactor had an “accelerating” effect on the octanoic acid pyrolisis. All in all, the catalytic effect promoted by the condensation by-products in the wet oxidation of phenol was not previously demonstrated in the literature to the best of our knowledge. In fact, the coverage of the catalyst by those species was usually associated to its loss of activity. For that reason, this study was performed in the absence of catalyst. In fact, the obtained results are of the same order of magnitude as those achieved with metal-free catalysts of relatively low-activity, such as carbon black [12]. An initial TOC abatement rate of 8 mgTOC L−1 min−1 was obtained in the CWPO of phenol under similar operating conditions ([Phenol]0 = 1000 mg L−1; [H2O2]0 = 5000 mg L−1; 130 °C), using a catalyst concentration of 5 g L−1, while 12 mgTOC L−1 min−1 was obtained in the current work. Obviously, the activity of metal-free and metal-based catalysts cannot lead to comparable yields. In fact, when a metal-based catalyst such as Fe/AC or Fe/Al2O3 is used, the activity is much higher (up to one order of magnitude). In this sense, initial TOC abatement rates of 72 mgTOC L−1 min−1 and 32 mgTOC L−1 min−1, were obtained with those catalysts, respectively, in the CWPO of phenol under similar operating conditions [37]. It is clear that in these cases, the coverage of the active sites even with catalytically active condensation by-products would unavoidably lead to lower catalytic activities.

3. Experimental

3.1. Oxidation experiments

Oxidation experiments were carried out in a 75 mL autoclave reactor (Berghof). The reactor consisted of a stainless-steel pressure vessel (PTFE) placed on a magnetic stirrer and surrounded by an electric resistance heating block run by the corresponding control system. Pressure was measured by a transducer. Six ports Valco valve VICI with two positions allowing the gas flow to pass through the reactor or bypass it. The inlet gas flow-rate (92 NmL min−1 of pure N2 or O2) bubbling into the liquid was adjusted by mass flow controllers (Hi-Tec Bronkhorst, Ruurlo, the Netherlands). In a typical oxygen-assisted wet peroxide oxidation (WPO-O2), 70 mL of phenol solution at natural pH was charged to the vessel. Then, the reactor was stoppered, heated and pressurized under nitrogen atmosphere and a stirring rate of 750 rpm. After stabilization, the N2 flow was switched into O2. The O2 stream flushed 5 mL of H2O2 aqueous solution of the appropriate concentration into the reactor. This was considered the starting reaction time. In the wet peroxide oxidation experiments (WPO), H2O2 was flushed with the N2 stream, the only gas employed in the experiment. In the wet air oxidation (WAO), the experimental procedure was similar to the first described but H2O2 was not flushed to the reactor and 75 mL of phenol solution was charged from the beginning.
The standard selected conditions for WPO-O2, WPO and WAO were natural pH0, 1000 mg L−1 of phenol, 127 °C and 0.8 bar. If necessary, 5000 mg L−1 H2O2 was added (100% of the stoichiometric amount relative to the initial phenol concentration). Also, WPO-O2 was performed in a wide range of operating conditions: pH0 = 3–9, 1000–5000 mg L−1 of initial phenol, 20–100% stoichiometric dose of H2O2, 100–140 °C and 0.5–1 bar to study the formation of condensation by-products.
WPO-O2 experiments were also conducted in a fixed-bed reactor consisting of a titanium tube with a 0.91 cm internal diameter and 30 cm long (reactor volume, VR = 4 cm3), loaded with 29 g of quartz beads (ϕbeads = 2mm and εL = 0.32). The temperature was measured by a thermocouple located in the bed. The liquid and gas phases were passed through the bed in concurrent up-flow. Detailed information about the components and operation procedure of this setup has been reported elsewhere [38]. A 92 NmL min−1 pure oxygen was continuously passed in all the experiments. The oxidation runs were performed at different temperatures (100–140 °C) and 0.8 bar of total pressure. An aqueous solution of phenol at natural pH0 was continuously fed to the reactor at 1000 mg L−1 and 50% stoichiometric dose of H2O2 at different flow rates (QL) = 1–0.125 mL min−1 to cover the experimental range of residence time (tr) = 5–41 min), calculated as the ratio of the liquid volume (VL) and flow rate (QL). VL was equal to εL•VR.
Liquid samples were periodically withdrawn from the reactors and immediately injected in a vial (submerged in crushed ice) containing a known volume of cold distilled water. The diluted samples were filtered (0.45 μm Nylon filter) and subsequently analyzed by different techniques.

3.2. Analytical methods

Phenol and aromatic intermediates evolution along oxidation reactions was followed by high performance liquid chromatography (Ultimate 3000, Thermo Scientific, Waltham, MA, USA) using a C18 5 μm column (Kinetex from Phenomenex, 4.6 mm diameter, 15 cm long) and a 4 mM H2SO4 aqueous solution as stationary and mobile phases, respectively. The quantification was performed at wavelengths of 210 and 246 nm. The measurement of short-chain organic acids was carried out by means of chromatography (Personal IC mod. 790, Metrohm). A mixture of Na2CO3 (3.2 mM) and NaHCO3 (1 mM) aqueous solutions and a Metrosep A sup 5–250 column (4 mm diameter, 25 cm long) were used. Total organic carbon (TOC) was quantified with a TOC analyzer (Shimadzu TOC VSCH, Kyoto, Japan). H2O2 concentration was obtained by colorimetric titration TiOSO4 method [39] using a UV2100 Shimadzu UV–vis spectrophotometer.

4. Conclusions

The results obtained in this work allowed us to demonstrate that the condensation by-products formed along wet peroxide oxidation can act as catalytic promoters. It was found that as reactions proceeded, the inert quartz beads were covered with condensation by-products and the disappearance rates of phenol, TOC and H2O2 were significantly increased. An initial low-period activity was clearly observed at low operating temperatures, especially 100 °C. The experimental data, obtained in the range of 100–140 °C, could not be described by conventional kinetic models like first order or Langmuir-Hinshelwood-Hougen-Watson. On the opposite, a good fit was reached by an autocatalytic kinetic model, which accounted for the activity promoted by the condensation by-products formed during the reaction. Interestingly, the activity of these species was found to be of the same order of magnitude as the reported with metal-free catalysts such as carbon black. Nevertheless, it was clearly lower than the achieved with metal-based catalysts, which explains that condensation by-products are usually seen as catalyst deactivators in the literature.

Supplementary Materials

The following are available online at https://www.mdpi.com/2073-4344/9/6/516/s1, Figure S1. Temporal concentration profiles of hydroquinone, resorcinol, catechol and benzoquinone upon the treatment of phenol by WPO-O2. Operating conditions: [Phenol]0 = 1000 mg L1, [H2O2]0 = 5000 mg L−1, PO2 = 8 bar (92 N mLO2 min−1), T = 127 °C and natural pH0.; Figure S2. Short-chain organic acid distribution upon the WAO, WPO and WPO-O2 of phenol after 3 h of reaction. Operating conditions: [Phenol]0 = 1000 mg L−1, [H2O2]0 = 5000 mg L−1, PO2 = 8 bar (92 N mLO2 min−1), T = 127 °C and natural pH0; Figure S3. Effect of the pH0 on the phenol WPO-O2. Operating conditions: [Phenol]0 = 1000 mg L−1, [H2O2]0 = 2500 mg L−1, T = 127 °C and PO2 = 8 bar; Figure S4. Effect of the H2O2 dose on the phenol WPO-O2. Operating conditions: [Phenol]0 = 1000 mg L−1, T = 127 °C, PO2 = 8 bar and natural pH0; Figure S5. Effect of the initial phenol concentration on the phenol WPO-O2. Operating conditions: T = 127 °C, PO2 = 8 bar and natural pH0; Figure S6. Effect of the oxygen pressure on the phenol WPO-O2. Operating conditions: [Phenol]0 = 1000 mg L−1, [H2O2]0 = 2500 mg L−1, T = 127 °C, PO2 = 8 bar and natural pH0; Figure S7. Effect of the temperature on the phenol WPO-O2. Operating conditions: [Phenol]0 = 1000 mg L−1, [H2O2]0 = 2500 mg L−1, PO2 = 8 bar and natural pH0; Figure S8. Effect of the operating conditions on the initial TOC abatement rate upon WPO-O2 process. Standard conditions: [Phenol]0 = 1000 mg L−1, [H2O2]0 = 2500 mg L−1, PO2 = 8 bar, T = 127 °C and natural pH0; Figure S9. Experimental (symbols) and predicted (lines) concentrations of H2O2, phenol and TOC by the pseudo-first order kinetic model of the phenol WPO-O2 over quartz beads at different temperatures. Operating conditions: [Phenol]0 = 1000 mg L−1, [H2O2]0 = 2500 mg L−1, PO2 = 8 bar, natural pH0 and Wquartz beads = 29 g; Figure S10. Experimental (symbols) and predicted (lines) concentrations of H2O2, phenol and TOC by the LHHW kinetic model of the phenol WPO-O2 over quartz beads at different temperatures. Operating conditions: [Phenol]0 = 1000 mg L−1, [H2O2]0 = 2500 mg L−1, PO2 = 8 bar, natural pH0 and Wquartz beads = 29 g.

Author Contributions

Conceptualization, J.A.C. and A.Q.; Data curation, J.L.D.d.T. and C.F.; Formal analysis, A.Q., J.L.D.d.T., C.F. and M.M.; Funding acquisition, J.A.C.; Investigation, A.Q., J.L.D.d.T., C.F. and M.M.; Methodology, A.Q., J.L.D.d.T. and C.F.; Project administration, J.A.C.; Supervision, J.A.C. and A.Q.; Validation, J.L.D.d.T. and C.F.; Writing – original draft, A.Q. and M.M.; Writing – review & editing, A.Q., M.M. and J.A.C.

Funding

This research was funded by the Spanish MINECO, through the project CTM-2016-76454-R and by the CM, through the project P2018/EMT-4341. M. Munoz thanks the Spanish MINECO for the Ramón y Cajal postdoctoral contract (RYC-2016-20648).

Conflicts of Interest

The authors declare no conflict of interest.

References

  1. UN-Water 2015, Compendium of Water Quality Regulatory Frameworks: Which Water for Which Use? Available online: http://www.unwater.org/app/uploads/2017/05/Compendium-of-Water-Quality-Main-Report_4.pdf (accessed on 16 February 2019).
  2. Ryu, J.Y. Formation of chlorinated phenols, dibenzo-p-dioxins, dienzofurans, benzenes, benzoquinones and perchloroethylenes from phenols in oxidative and copper(II) chloride-catalyzed thermal process. Chemosphere 2008, 71, 1100–1109. [Google Scholar] [CrossRef] [PubMed]
  3. Levec, J.; Pintar, A. Catalytic wet-air oxidation processes: A review. Catal. Today 2007, 124, 172–184. [Google Scholar] [CrossRef]
  4. Munoz, M.; de Pedro, Z.M.; Casas, J.A.; Rodriguez, J.J. Preparation of magnetite-based catalysts and their application in heterogeneous Fenton oxidation – A review. Appl. Catal. B 2015, 176–177, 249–265. [Google Scholar] [CrossRef]
  5. Zazo, J.A.; Casas, J.A.; Mohedano, A.F.; Rodríguez, J.J. Catalytic wet peroxide oxidation of phenol with a Fe/active carbon catalyst. Appl. Catal. B 2006, 65, 261–268. [Google Scholar] [CrossRef]
  6. Rey, A.; Faraldos, M.; Casas, J.A.; Zazo, J.A.; Bahamonde, A.; Rodríguez, J.J. Catalytic wet peroxide oxidation of phenol over Fe/AC catalysts: Influence of iron precursor and activated carbon surface. Appl. Catal. B 2009, 86, 69–77. [Google Scholar] [CrossRef]
  7. Keav, S.; de los Monteros, A.E.; Barbier, J.; Duprez, D. Wet Air Oxidation of phenol over Pt and Ru catalysts supported on cerium-based oxides: Resistance to fouling and kinetic modelling. Appl. Catal. B 2014, 150–151, 402–410. [Google Scholar] [CrossRef]
  8. Bautista, P.; Mohedano, A.F.; Menéndez, N.; Casas, J.A.; Zazo, J.A.; Rodriguez, J.J. Highly stable Fe/γAl2O3 catalyst for catalytic wet peroxide oxidation. J. Chem. Technol. Biotechnol. 2011, 86, 497–504. [Google Scholar] [CrossRef]
  9. Munoz, M.; Domínguez, P.; de Pedro, Z.M.; Casas, J.A.; Rodriguez, J.J. Naturally-occurring iron minerals as inexpensive catalysts for CWPO. Appl. Catal. B 2017, 203, 166–173. [Google Scholar] [CrossRef] [Green Version]
  10. Domínguez, C.M.; Ocón, P.; Quintanilla, A.; Casas, J.A.; Rodriguez, J.J. Highly efficient application of activated carbon as catalyst for wet peroxide oxidation. Appl. Catal. B 2013, 140–141, 663–670. [Google Scholar] [CrossRef]
  11. Domínguez, C.M.; Ocón, P.; Quintanilla, A.; Casas, J.A.; Rodriguez, J.J. Graphite and carbon black materials as catalysts for wet peroxide oxidation. Appl. Catal. B 2014, 144, 599–606. [Google Scholar] [CrossRef]
  12. Diaz de Tuesta, J.L.; Quintanilla, A.; Casas, J.A.; Rodriguez, J.J. Kinetic modeling of wet peroxide oxidation with a carbon black catalyst. Appl. Catal. B 2017, 209, 701–710. [Google Scholar] [CrossRef]
  13. Ribeiro, R.S.; Fathy, N.A.; Attia, A.A.; Silva, A.M.T.; Faria, J.L.; Gomes, H.T. Activated carbon xerogels for the removal of the anionic azo dyes Orange II and Chromotrope 2R by adsorption and catalytic wet peroxide oxidation. Chem. Eng. J. 2012, 195–196, 112–121. [Google Scholar] [CrossRef]
  14. Munoz, M.; de Pedro, Z.M.; Casas, J.A.; Rodriguez, J.J. Assessment of the generation of chlorinated byproducts upon Fenton-like oxidation of chlorophenols at different conditions. J. Hazard. Mater. 2011, 190, 993–1000. [Google Scholar] [CrossRef] [PubMed]
  15. Poerschmann, J.; Trommler, U.; Górecki, T.; Kopinke, F.D. Formation of chlorinated biphenyls, diphenyl ethers and benzofurans as a result of Fenton-driven oxidation of 2-chlorophenol. Chemosphere 2009, 75, 772–780. [Google Scholar] [CrossRef] [PubMed]
  16. Poerschmann, J.; Trommler, U.; Górecki, T. Aromatic intermediate formation during oxidative degradation of Bisphenol A by homogeneous sub-stoichiometric Fenton reaction. Chemosphere 2010, 79, 975–986. [Google Scholar] [CrossRef] [PubMed]
  17. Vallejo, M.; Fernández-Castro, P.; San Román, M.F.; Ortiz, I. Assessment of PCDD/Fs formation in the Fenton oxidation of 2-chlorophenol: Influence of the iron dose applied. Chemosphere 2015, 137, 135–141. [Google Scholar] [CrossRef]
  18. Vallejo, M.; Fresnedo San Román, M.; Ortiz, I.; Irabien, A. Overview of the PCDD/Fs degradation potential and formation risk in the application of advanced oxidation processes (AOPs) to wastewater treatment. Chemosphere 2015, 118, 44–56. [Google Scholar] [CrossRef]
  19. Delgado, J.J.; Pérez-Omil, J.A.; Rodríguez-Izquierdo, J.M.; Cauqui, M.A. The role of the carbonaceous deposits in the Catalytic Wet Oxidation (CWO) of phenol. Catal. Comm. 2006, 7, 639–643. [Google Scholar] [CrossRef]
  20. Delgado, J.J.; Chen, X.; Pérez-Omil, J.A.; Rodríguez-Izquierdo, J.M.; Cauqui, M.A. The effect of reaction conditions on the apparent deactivation of Ce–Zr mixed oxides for the catalytic wet oxidation of phenol. Catal. Today 2012, 180, 25–33. [Google Scholar] [CrossRef]
  21. Lee, D.K.; Kim, D.S.; Kim, T.H.; Lee, Y.K.; Jeong, S.E.; Le, N.T.; Cho, M.J.; Henam, S.D. Deactivation of Pt catalysts during wet oxidation of phenol. Catal. Today 2010, 154, 244–249. [Google Scholar] [CrossRef]
  22. Collett, C.H.; McGregor, J. Things go better with coke: the beneficial role of carbonaceous deposits in heterogeneous catalysis. Catal. Sci. Technol. 2016, 6, 363–378. [Google Scholar] [CrossRef]
  23. Gornay, J.; Coniglio, L.; Billaud, F.; Wild, G. Octanoic acid pyrolysis in a stainless-steel tube: What is the role of the coke formed on the wall? J. Anal. Appl. Pyrol. 2010, 87, 78–84. [Google Scholar] [CrossRef]
  24. Teschner, D.; Vass, E.; Hävecker, M.; Zafeiratos, S.; Schnörch, P.; Sauer, H.; Knop-Gericke, A.; Schlögl, R.; Chamam, M.; Wootsch, A.; et al. Alkyne hydrogenation over Pd catalysts: A new paradigm. J. Catal. 2006, 242, 26–37. [Google Scholar] [CrossRef]
  25. Vrieland, G.E.; Menon, P.G. Nature of the catalytically active carbonaceous sites for the oxydehydrogenation of ethylbenzene to styrene: A brief review. Appl. Catal. 1991, 77, 1–8. [Google Scholar] [CrossRef]
  26. Fiedorow, R.; Przystajko, W.; Sopa, M.; Dalla Lana, I.G. The nature and catalytic influence of coke formed on alumina: Oxidative dehydrogenation of ethylbenzene. J. Catal. 1981, 68, 33–41. [Google Scholar] [CrossRef]
  27. Hamoudi, S.; Larachi, F.; Adnot, A.; Sayari, A. Characterization of Spent MnO2/CeO2 Wet Oxidation Catalyst by TPO–MS, XPS, and S-SIMS. J. Catal. 1999, 185, 333–344. [Google Scholar] [CrossRef]
  28. Kim, S.; Ihm, S. Nature of carbonaceous deposits on the alumina supported transition metal oxide catalysts in the wet air oxidation of phenol. Top. Catal. 2005, 33, 171–179. [Google Scholar] [CrossRef]
  29. Catrinescu, C.; Teodosiu, C.; Macoveanu, M.; Miehe-Brendlé, J.; Le Dred, R. Catalytic wet peroxide oxidation of phenol over Fe-exchanged pillared beidellite. Water Res. 2003, 37, 1154–1160. [Google Scholar] [CrossRef]
  30. Yadav, A.; Verma, N. Carbon bead-supported copper-dispersed carbon nanofibers: An efficient catalyst for wet air oxidation of industrial wastewater in a recycle flow reactor. J. Ind. Eng. Chem. 2018, 67, 448–460. [Google Scholar] [CrossRef]
  31. Huang, H.; Lu, M.; Chen, J. Catalytic Decomposition of hydrogen peroxide and 2-chlorophenol with iron oxides. Water Res. 2001, 35, 2291–2299. [Google Scholar] [CrossRef]
  32. Pham, A.L.; Lee, C.; Doyle, F.M.; Sedlak, D.L. A silica-supported iron oxide catalyst capable of activating hydrogen peroxide at neutral pH values. Environ. Sci. Technol. 2009, 43, 8930–8935. [Google Scholar] [CrossRef]
  33. Kwon, B.G.; Lee, D.S.; Kang, N.; Yoon, J. Characteristics of p-chlorophenol oxidation by Fenton’s reagent. Water Res. 1999, 33, 2110–2118. [Google Scholar] [CrossRef]
  34. Munoz, M.; de Pedro, Z.M.; Casas, J.A.; Rodriguez, J.J. Combining efficiently catalytic hydrodechlorination and wet peroxide oxidation (HDC–CWPO) for the abatement of organochlorinated water pollutants. Appl. Catal. B 2014, 150–151, 197–203. [Google Scholar] [CrossRef]
  35. Mijangos, F.; Varona, F.; Villota, N. Changes in solution color during phenol oxidation by Fenton reagent. Environ. Sci. Technol. 2006, 40, 5538–5543. [Google Scholar] [CrossRef] [PubMed]
  36. McDonald, P.D.; Hamilton, G.A. CHAPTER II - Mechanisms of phenolic oxidative coupling reactions. Org. Chem. 1973, 5, 97–134. [Google Scholar]
  37. Garcia-Costa, A.L.; Zazo, J.A.; Rodriguez, J.J.; Casas, J.A. Microwave-assisted catalytic wet peroxide oxidation. Comparison of Fe catalysts supported on activated carbon and -alumina. Appl. Catal. B 2017, 218, 637–642. [Google Scholar] [CrossRef]
  38. Quintanilla, A.; Casas, J.A.; Zazo, J.A.; Mohedano, A.F.; Rodríguez, J.J. Wet air oxidation of phenol at mild conditions with a Fe/activated carbon catalyst. Appl. Catal. B 2006, 62, 115–120. [Google Scholar] [CrossRef]
  39. Eisenberg, G.M. Colorimetric determination of hydrogen peroxide. Ind. Eng. Chem. Res. 1943, 15, 327–328. [Google Scholar] [CrossRef]
Figure 1. Temporal concentration profiles of H2O2, phenol and TOC upon the treatment of phenol by WAO, WPO and WPO-O2 processes. Operating conditions: [Phenol]0 = 1000 mg L−1, [H2O2]0 = 5000 mg L−1, PO2 = 8 bar (92 N mLO2 min−1), T = 127 °C and natural pH0.
Catalysts 09 00516 g001
Figure 2. By-product distribution upon the WAO, WPO and WPO-O2 of phenol after 3 h of reaction. Operating conditions: [Phenol]0 = 1000 mg L−1, [H2O2]0 = 5000 mg L−1, PO2 = 8 bar (92 N mLO2 min−1), T = 127 °C and natural pH0.
Catalysts 09 00516 g002
Figure 3. Effect of the operating conditions on the phenol mineralization after 3 h of reaction upon WPO-O2 process. Standard conditions: [Phenol]0 = 1000 mg L−1, [H2O2]0 = 2500 mg L−1, PO2 = 8 bar, T = 127 °C and natural pH0.
Catalysts 09 00516 g003
Figure 4. Effect of the H2O2 dose on the H2O2 consumption and mineralization (a) and by-product distribution at 3 h of reaction (b) upon phenol WPO-O2. Operating conditions: [Phenol]0 = 1000 mg L−1, PO2 = 8 bar (92 N mLO2 min−1), T = 127 °C and natural pH0. The inset images in (a) show the aspect of the liquid effluent after 3 h of reaction.
Catalysts 09 00516 g004
Figure 5. Proposed reaction pathway for the degradation of phenol by WPO-O2.
Catalysts 09 00516 g005
Figure 6. Experimental (symbols) and predicted (lines) concentrations of H2O2, phenol and TOC by the autocatalytic kinetic model of the phenol WPO-O2 over quartz beads at different temperatures. Operating conditions: [Phenol]0 = 1000 mg L−1, [H2O2]0 = 2500 mg L−1, PO2 = 8 bar, natural pH0 and Wquartz = 29 g.
Catalysts 09 00516 g006
Figure 7. Parity plot for phenol, H2O2 and TOC evolution upon WPO-O2 of phenol over quartz beads within the temperature range 100 – 140 °C using the autocatalytic kinetic model. Operating conditions: [Phenol]0 = 1000 mg L−1, [H2O2]0 = 2500 mg L−1, PO2 = 8 bar, natural pH0 and Wquartz = 29 g.
Catalysts 09 00516 g007
Figure 8. Image of the quartz beads before and after the WPO-O2 process under the operating conditions of Figure 6.
Catalysts 09 00516 g008

