Article

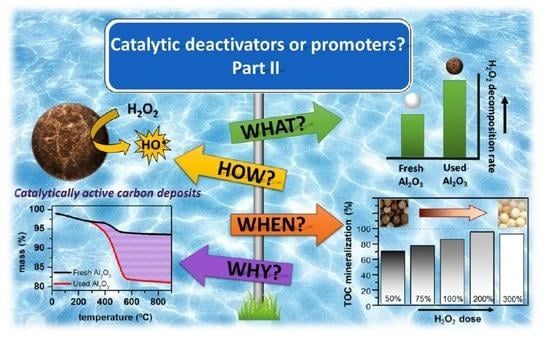
Condensation By-Products in Wet Peroxide Oxidation: Fouling or Catalytic Promotion? Part II: Activity, Nature and Stability

by
Asunción Quintanilla
1,
Jose L. Diaz de Tuesta
2,3,
Cristina Figueruelo
1,
Macarena Munoz
1,* and
Jose A. Casas
1
1
Chemical Engineering Department, Universidad Autónoma de Madrid, Ctra. Colmenar km 15, 28049 Madrid, Spain
2
Centro de Investigação de Montanha (CIMO), Instituto Politécnico de Bragança, 5300-253 Bragança, Portugal
3
Laboratório de Processos de Separação e Reação-Laboratório de Catálise e Materiais (LSRE-LCM), Faculdade de Engenharia, Universidade do Porto, 4200-465 Porto, Portugal
*
Author to whom correspondence should be addressed.
Catalysts 2019, 9(6), 518; https://doi.org/10.3390/catal9060518
Submission received: 29 April 2019 / Revised: 21 May 2019 / Accepted: 6 June 2019 / Published: 11 June 2019
(This article belongs to the Special Issue Trends in Catalytic Wet Peroxide Oxidation Processes)

Abstract

:
The deposition of condensation by-products onto the catalyst surface upon wet peroxide and wet air oxidation processes has usually been associated with catalyst deactivation. However, in Part I of this paper, it was demonstrated that these carbonaceous deposits actually act as catalytic promoters in the oxygen-assisted wet peroxide oxidation (WPO-O2) of phenol. Herein, the intrinsic activity, nature and stability of these species have been investigated. To achieve this goal, an up-flow fixed bed reactor packed with porous Al2O3 spheres was used to facilitate the deposition of the condensation by-products formed in the liquid phase. It was demonstrated that the condensation by-products catalyzed the decomposition of H2O2 and a higher amount of these species leads to a higher degree of oxidation degree The reaction rates, conversion values and intermediates’ distribution were analyzed. The characterization of the carbonaceous deposits on the Al2O3 spheres showed a significant amount of condensation by-products (~6 wt.%) after 650 h of time on stream. They are of aromatic nature and present oxygen functional groups consisting of quinones, phenols, aldehydes, carboxylics and ketones. The initial phenol concentration and H2O2 dose were found to be crucial variables for the generation and consumption of such species, respectively.

Graphical Abstract

1. Introduction

The treatment of wastewater containing aromatic compounds by oxidizing radicals, like those generated in catalytic wet peroxide oxidation (CWPO) and catalytic wet air oxidation (CWAO) processes, unavoidably involve oxidative coupling or polymerization reactions [1,2,3,4]. In these reactions, the aromatic molecules polymerize leading to a complex mixture of intermediates usually known as condensation by-products, which remain adsorbed onto the porous catalyst surface. By using the appropriate operating conditions, such as H2O2 dose [5] or temperature [1,6], and also by the integration of different treatments [7], these species can be further oxidized to CO2.
The presence of such carbonaceous deposits or “coke” on the catalyst has been recognized as a major cause of its deactivation as these deposits can cover the catalytic active sites and thus, block the redox cycle [1,3,8,9,10,11,12,13]. However, recent studies have shown that the presence of those species enhances the catalytic performance in a number of processes such as oxidative dehydrogenation, hydrogenation, isomerization and Fischer-Tropsch [14]. In fact, the poly-aromatic structure of condensation by-products could also have a positive effect in CWPO and CWAO processes since it could facilitate the electron transfer to the oxidants initiating the radical reaction mechanism, as if it was a carbocatalyst surface. However, to the best of our knowledge, this theory has not been addressed in the literature so far.
Table 1 presents a brief summary of the studies which have considered the formation of condensation by-products during aromatic-polluted wastewater treatment using both CWAO and CWPO processes. As can be seen, in all studies the deposition of carbonaceous deposits was identified as the main reason for the deactivation of the catalysts. However, it is not possible to generalize the results since this mechanism depends on the nature of the catalyst and the operating conditions, in particular temperature, initial pollutant concentration and oxidant dose. On the other hand, it must be noted that the deactivation was significantly more pronounced when metal-based catalysts were used [1,11,12], whereas carbocatalysts were much more resistant [3]. In the same line, the regeneration of solids by calcination treatments allowed the complete recovery of the initial activity of the carbocatalysts [3]. Although the regeneration of some metal-based catalysts by calcination has also been demonstrated [1,15], it is not so straightforward in this case because the metal nanoparticles would also be oxidized, which could be counterproductive for the process, for instance, if the popular magnetic catalysts are used. On the other hand, as shown in Table 1, the nature of condensation by-products deposited onto the catalyst surface upon CWAO and CWPO reactions has not been deeply investigated and many questions remain.
In our previous contribution, Part I of this study [16], it was demonstrated that the carbonaceous materials deposited on the surface of inert quartz beads during the WPO-O2 of phenol were able to catalyze the oxidation process. That is, the disappearance rates of phenol, total organic carbon (TOC) and H2O2 were progressively increased during the reaction as the quartz beads were covered by the condensation by-products, which was successfully described by an autocatalytic kinetic model. Here, the activity, nature and stability of those species have been more deeply investigated. To achieve this goal, inert Al2O3 spheres were used instead of quartz beads in the fixed bed reactor as they provide a significantly higher surface area for the deposition of the condensation by-products. The effect of these deposits on the kinetics of the process were investigated in the decomposition of H2O2 and also in the WPO-O2 of phenol. The amount of condensation by-products deposited onto the Al2O3 spheres were measured and their nature was fully characterized by several techniques. Finally, the stability of these species was evaluated under different process operating conditions.

2. Results and Discussion

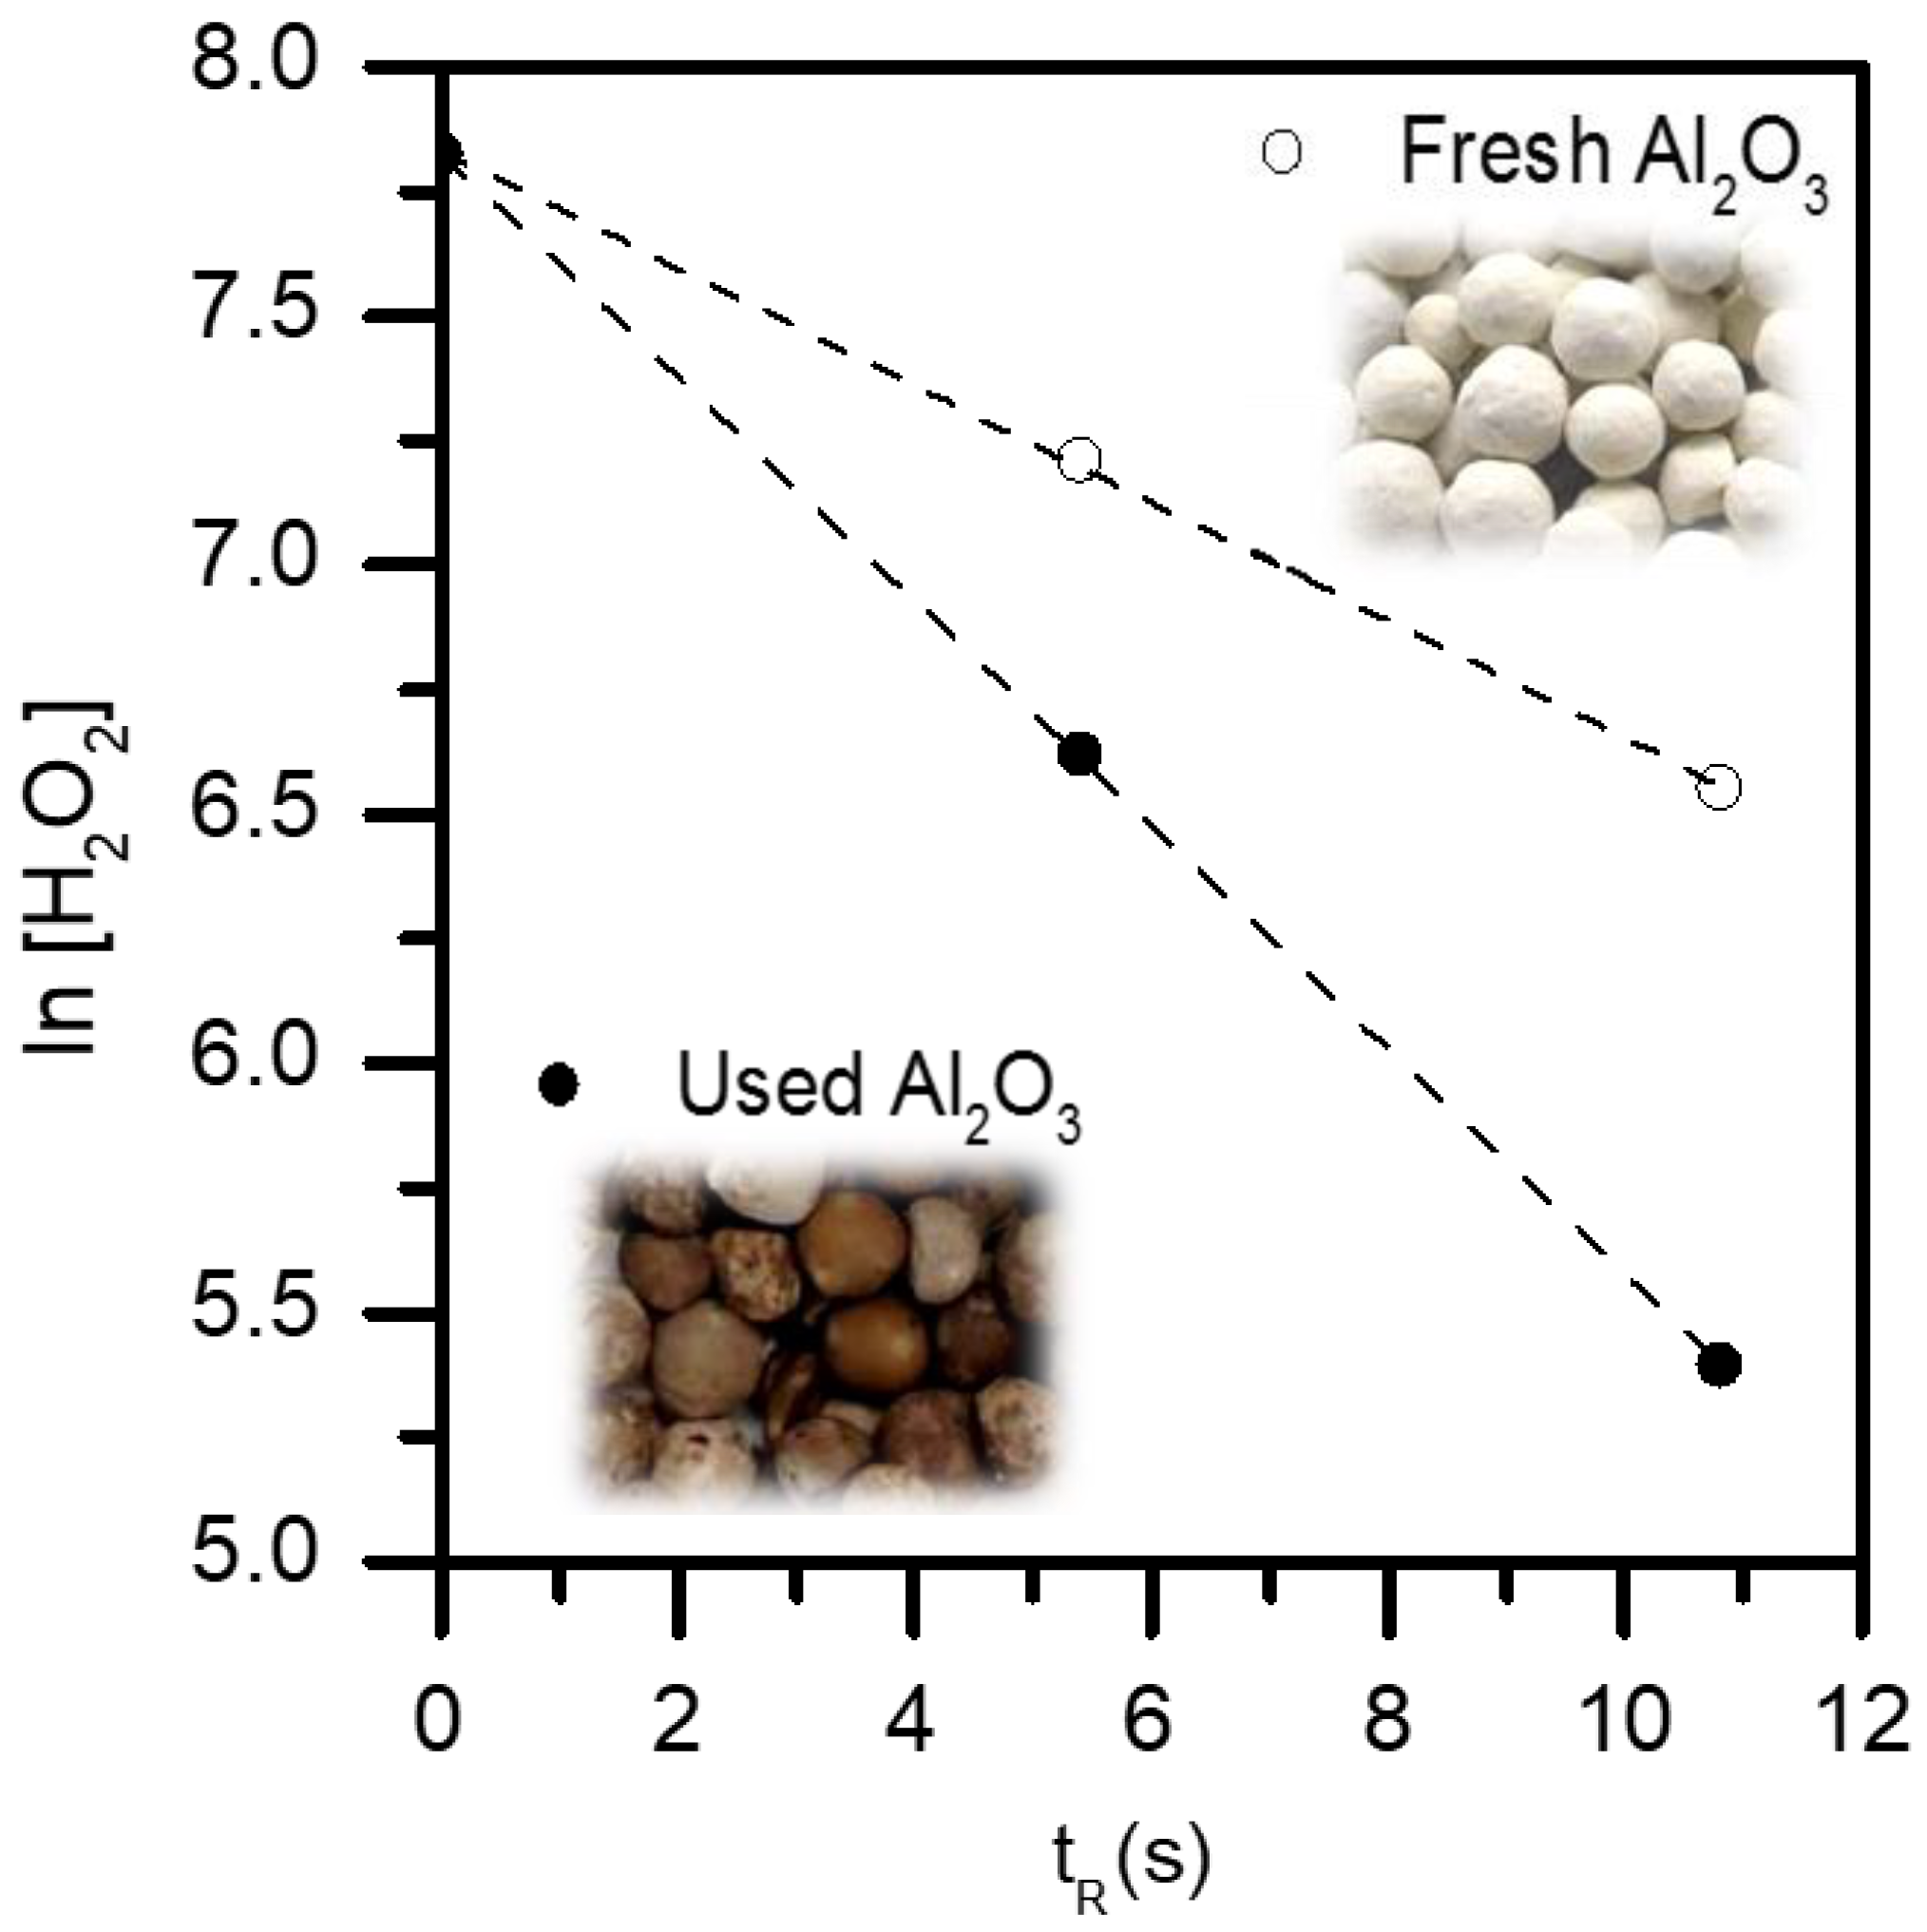
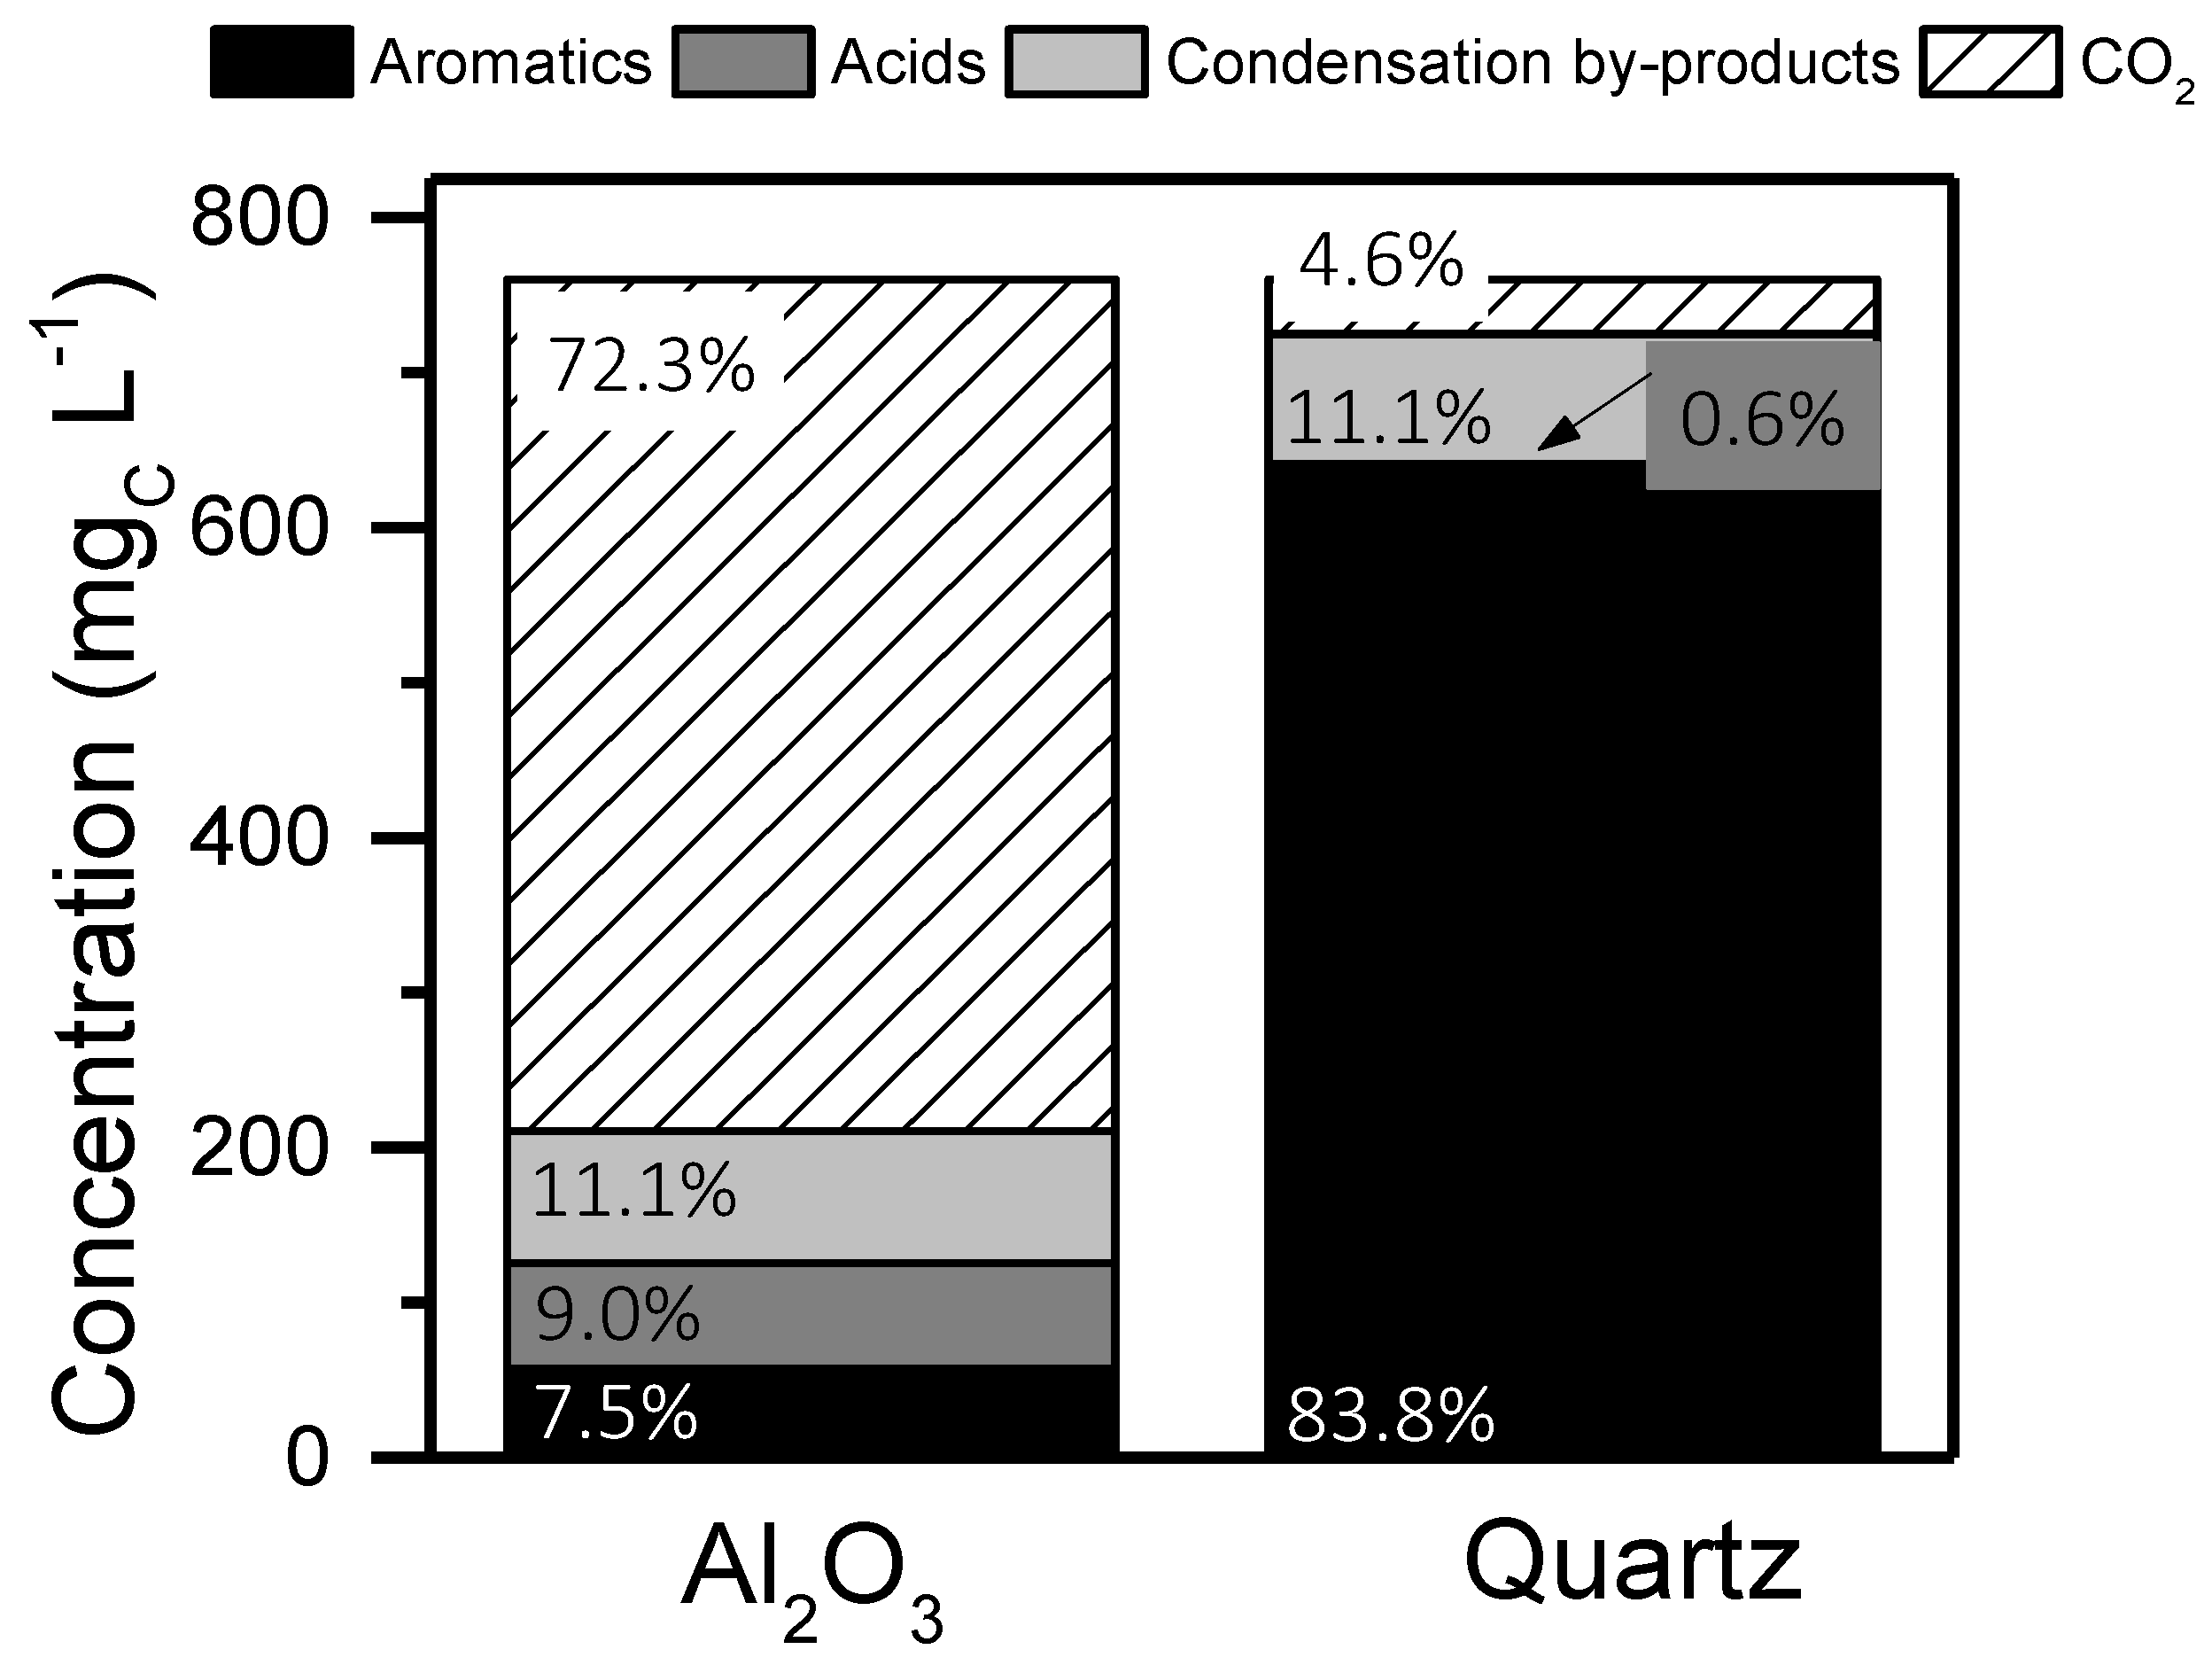
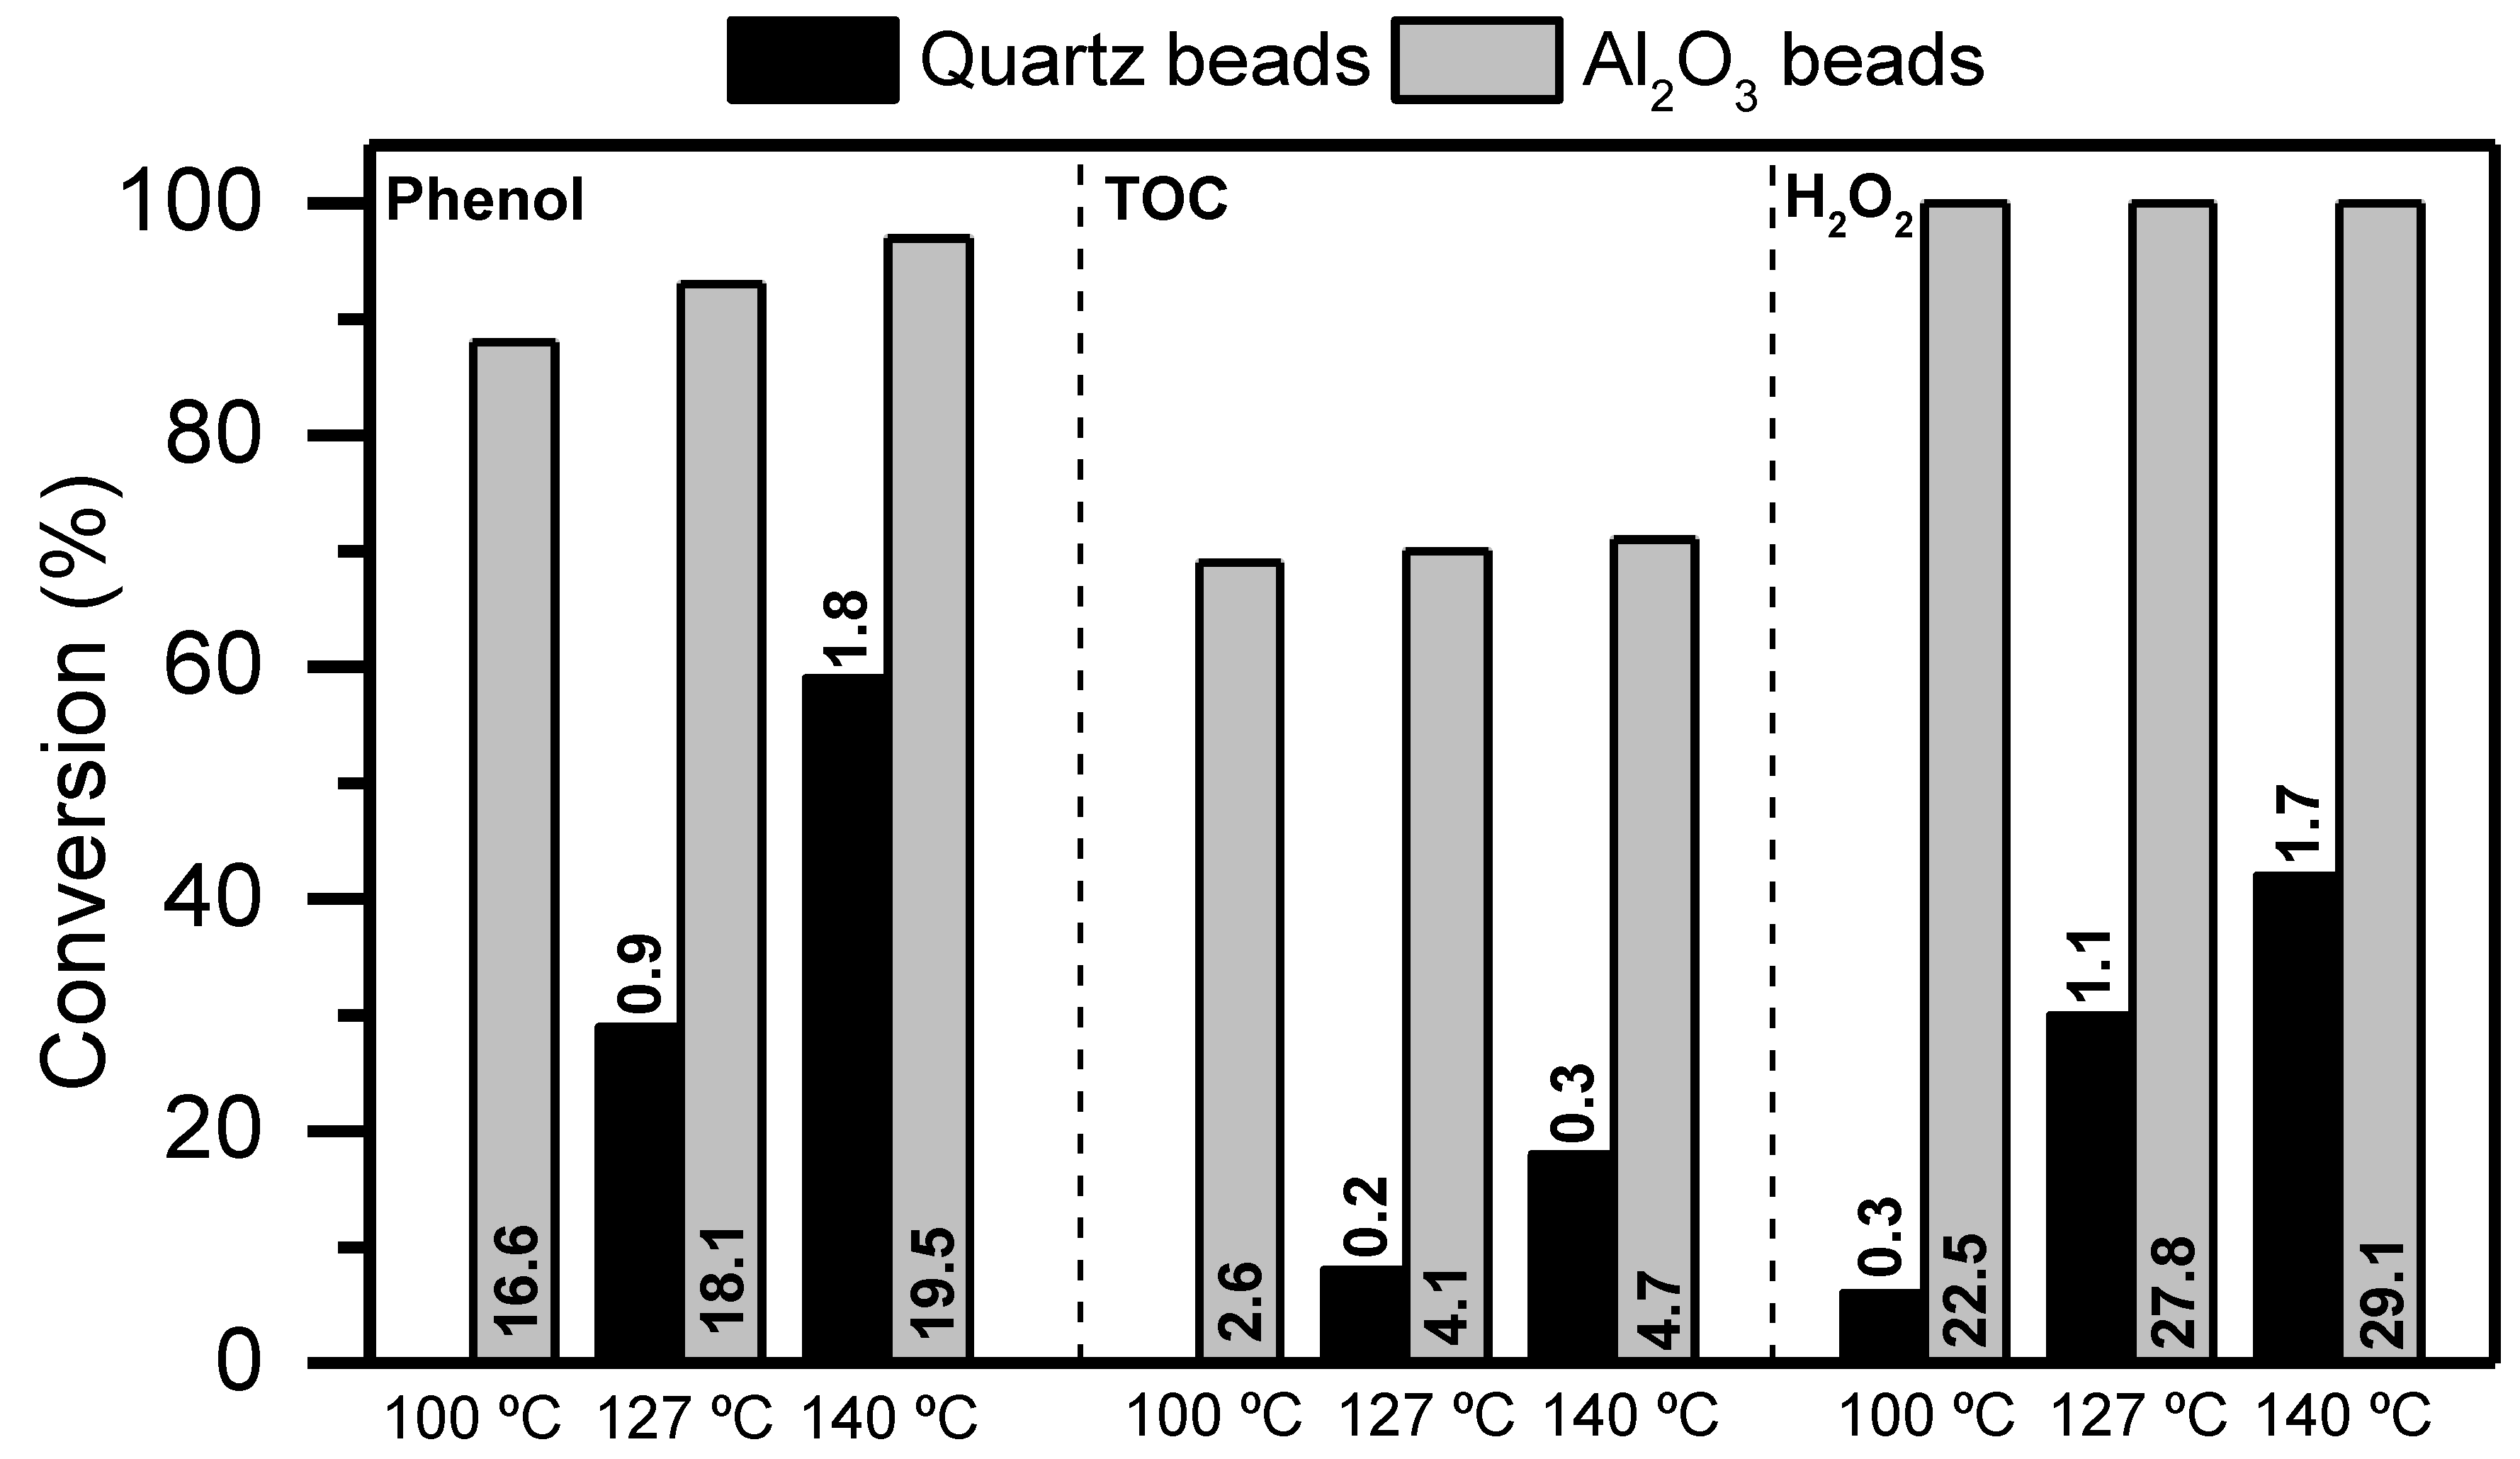
2.1. Catalytic Activity Promoted by Condensation By-Products Deposits

In a first approach to directly assess the activity promoted by the carbonaceous by-products deposited on the surface of inert solids in a fixed bed reactor during the WPO-O2 of phenol, their ability to decompose H2O2 was investigated. The decomposition of H2O2 over fresh Al2O3 spheres and those used in the WPO-O2 of phenol during 145 h on stream were assessed. Al2O3 spheres were used instead of quartz beads in this work because they are also catalytically inert particles for the decomposition of H2O2 but provide higher available specific surface area (SBET = 275 m2 g−1) for the deposition of condensation by-products formed in the liquid phase. The concentration of H2O2 tested was established at the same amount used in the WPO-O2 of phenol (2500 mg L−1) [16]. The rest of the operating conditions were fixed at PO2 = 8 bar (100 N mLO2 min−1), T = 150 °C and neutral pH0.
The obtained results can be seen in Figure 1. It should be noted that the used Al2O3 spheres showed a dark brown color according to the presence of carbonaceous deposits on their surface [16]. Although H2O2 was decomposed in both cases, significant differences were found in the oxidation rate. The resulting pseudo-first order rate constant values for H2O2 decomposition were 0.181 and 0.345 L gcat−1 h−1 with fresh and used Al2O3 spheres, respectively. The C-coated Al2O3 solid (Al2O3 covered by condensation by-products) decomposed H2O2 about two times faster than the fresh one, confirming the important role of condensation by-products on the kinetics of the process. These results are consistent with those of Part I of this study [16], the condensation by-products are catalytic species able to promote the redox reactions to decompose H2O2 into hydroxyl and hydroperoxyl radicals. Therefore, the formation of condensation by-products is the preliminary step in the phenol wet peroxide oxidation. To the best of our knowledge, the activity promoted by the typical carbonaceous deposits formed upon the CWPO, and also CWAO of organic pollutants has not been previously reported in the literature. On the contrary, the catalyst coverage by those species has commonly been identified as an important reason for the loss of its activity [9,10,11,12,13]. Clearly, when highly active metal-based catalysts are covered by condensation by-products, the activity of the solid is unavoidably decreased as the activity promoted by those species cannot compete with that of metal particles. Accordingly, to prove the intrinsic activity of the carbonaceous deposits, the process must be carried out in the absence of catalyst with an inert solid, as demonstrated in this work.
To get a better insight into the catalytic performance of condensation by-products, the WPO-O2 performance was studied over a Al2O3 fixed bed, and the results were compared to those obtained over quartz beads, as reported in Part I of this work [16]. It was expected that the amount of the condensation by-products deposited would be different in both beds due to the highest specific surface area of the porous Al2O3. The results in terms of phenol, TOC and H2O2 conversion at the following operating conditions: [phenol]0 = 1000 mg L−1, [H2O2]0 = 2500 mg L−1, T = 100–140 °C, PO2 = 8 bar, natural pH0 and tR= 7 min, are summarized in Figure 2. The resulting initial oxidation rate values (gi gsolid−1 h−1) are also included. In all cases, the conversion values were significantly higher in the presence of Al2O3 spheres. Accordingly, the reaction proceeded much faster with Al2O3, obtaining rate values around one order of magnitude higher. Also, higher extension of the reaction was reached, as indicated in the intermediate distribution obtained with both systems at given operating conditions (Figure 3). In this sense, the mineralization yield (or TOC conversion) was around 72% with the Al2O3 fixed bed while only 5% was obtained with the quartz one. In the same line, dissolved aromatic compounds (mainly p-benzoquinone, catechol and hydroquinone) were almost completely eliminated in the presence of Al2O3 while they were the main reaction products (representing 84% of the initial TOC) with quartz beads. Taking into account that both quartz and Al2O3 are inert materials, the only difference among them can be attributed to the available surface area provided for the deposition of condensation by-products, which is remarkably higher in the case of Al2O3 area (SBET = 275 m2 g−1). Accordingly, the catalytic activity promoted by condensation by-products is significantly stronger with this solid.

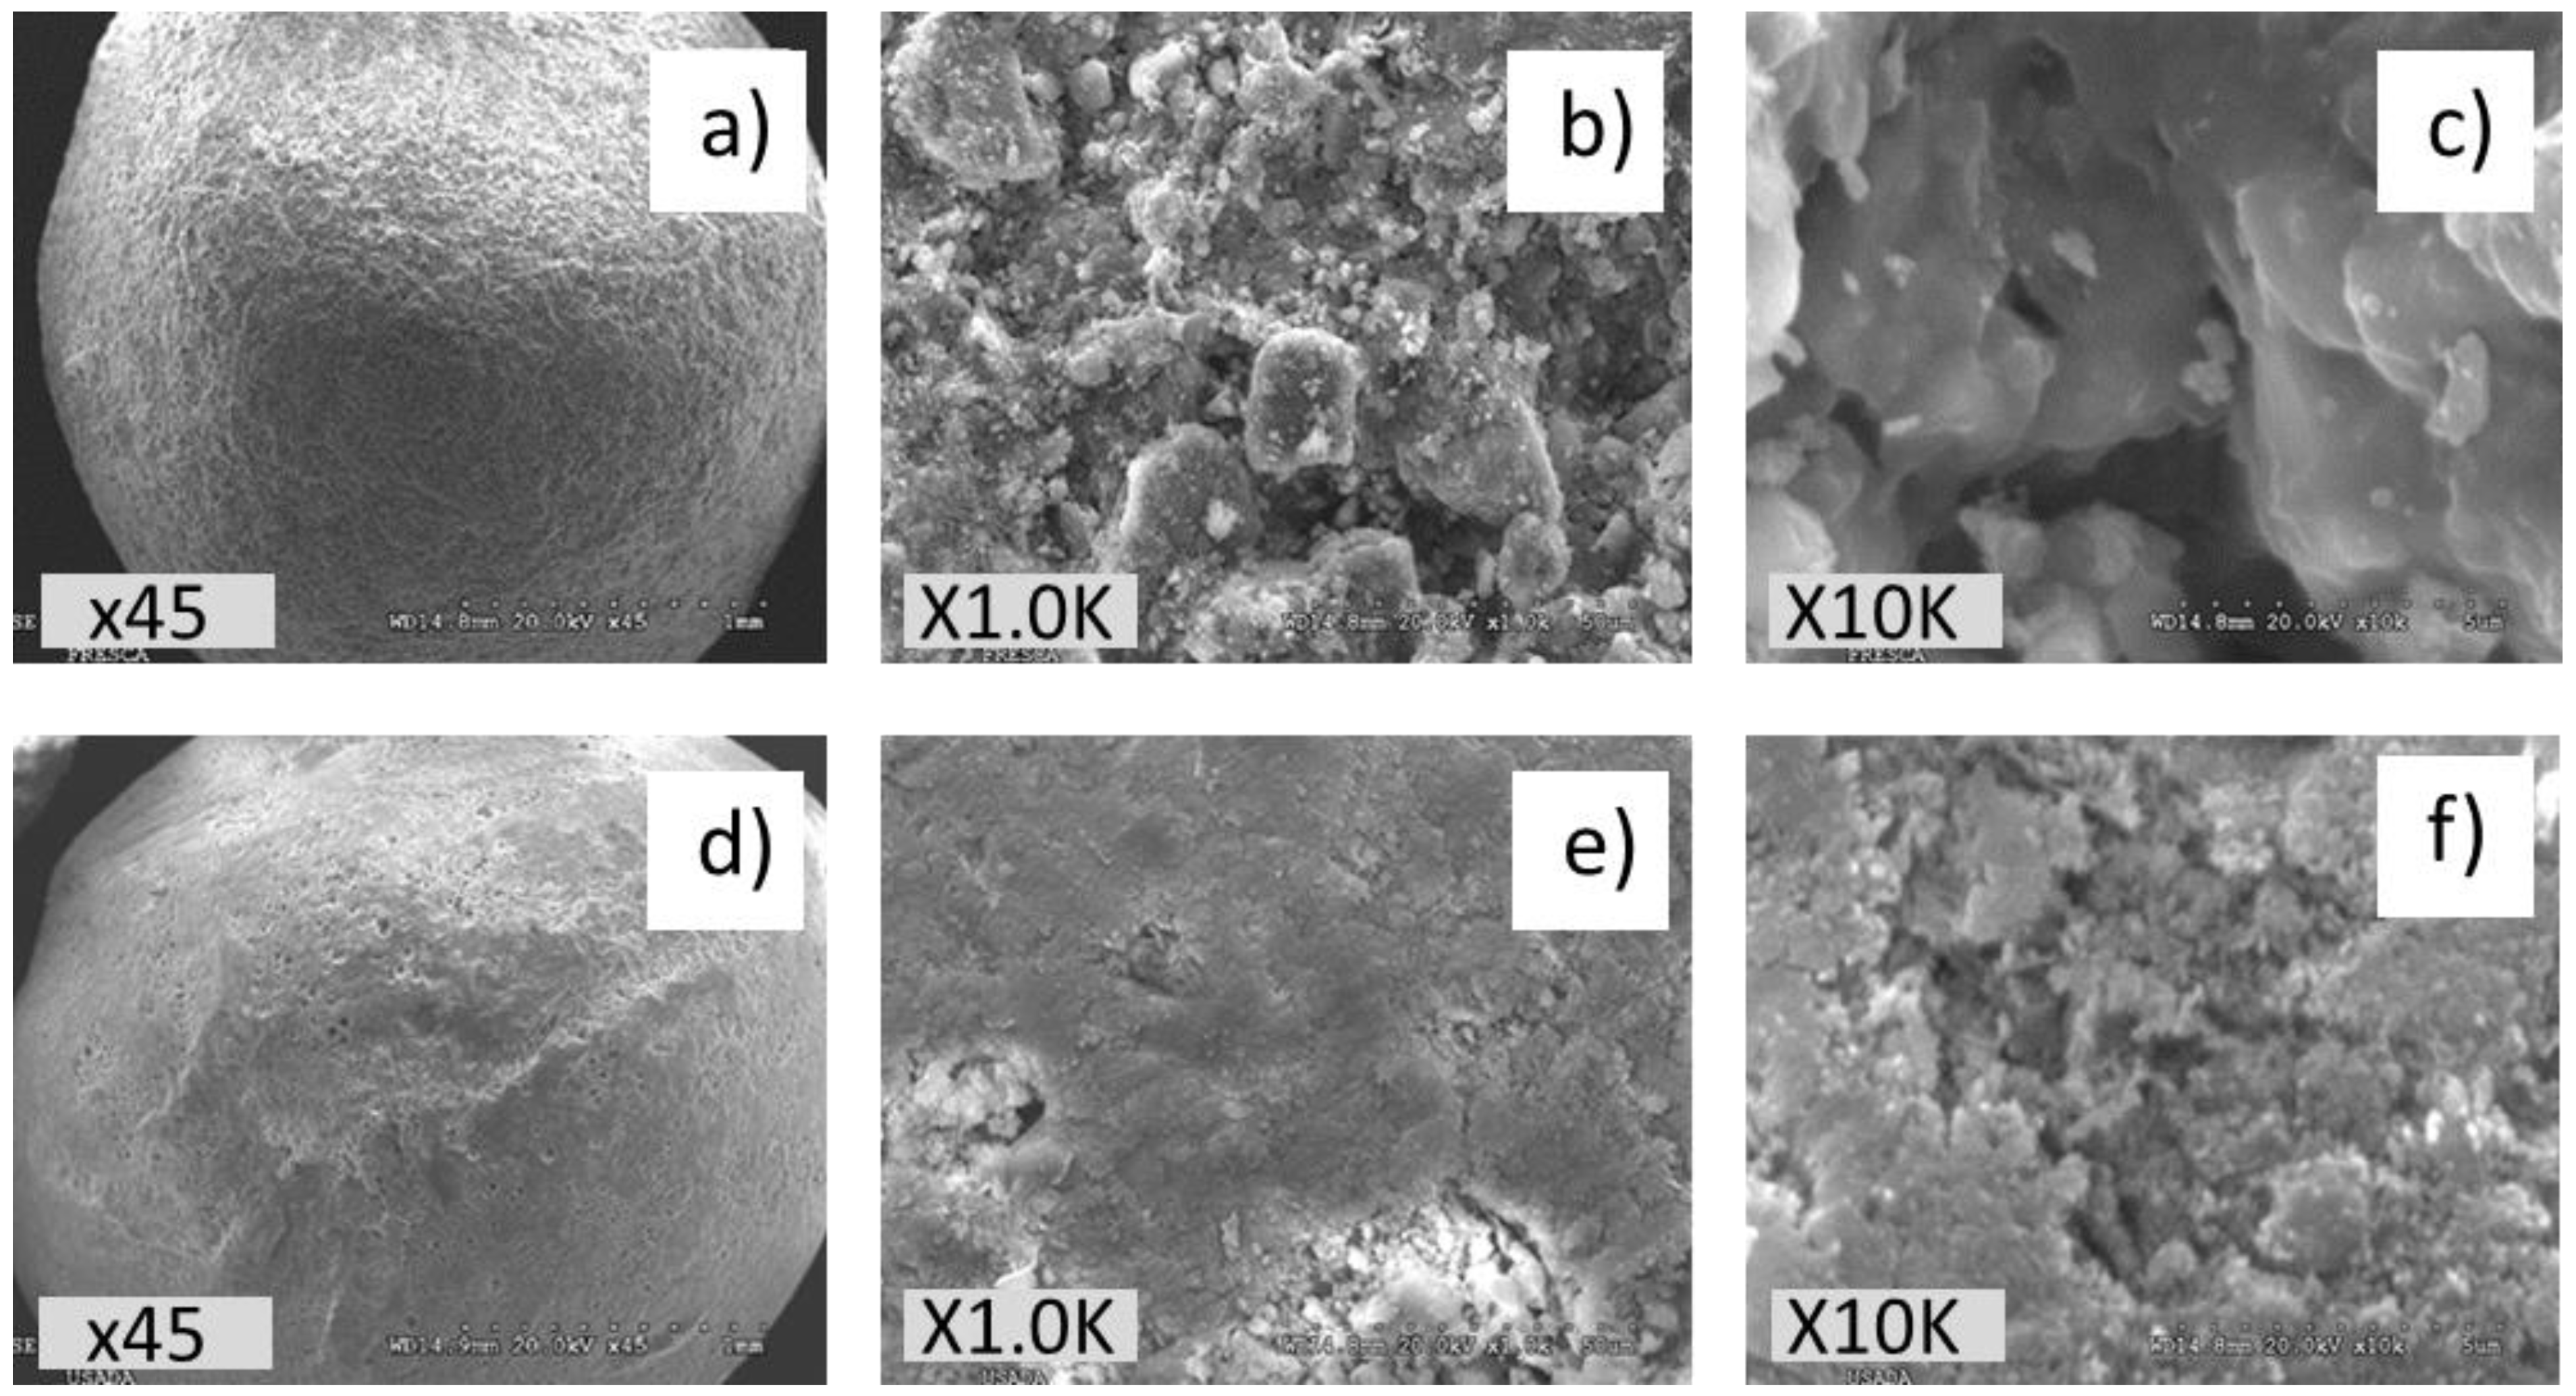
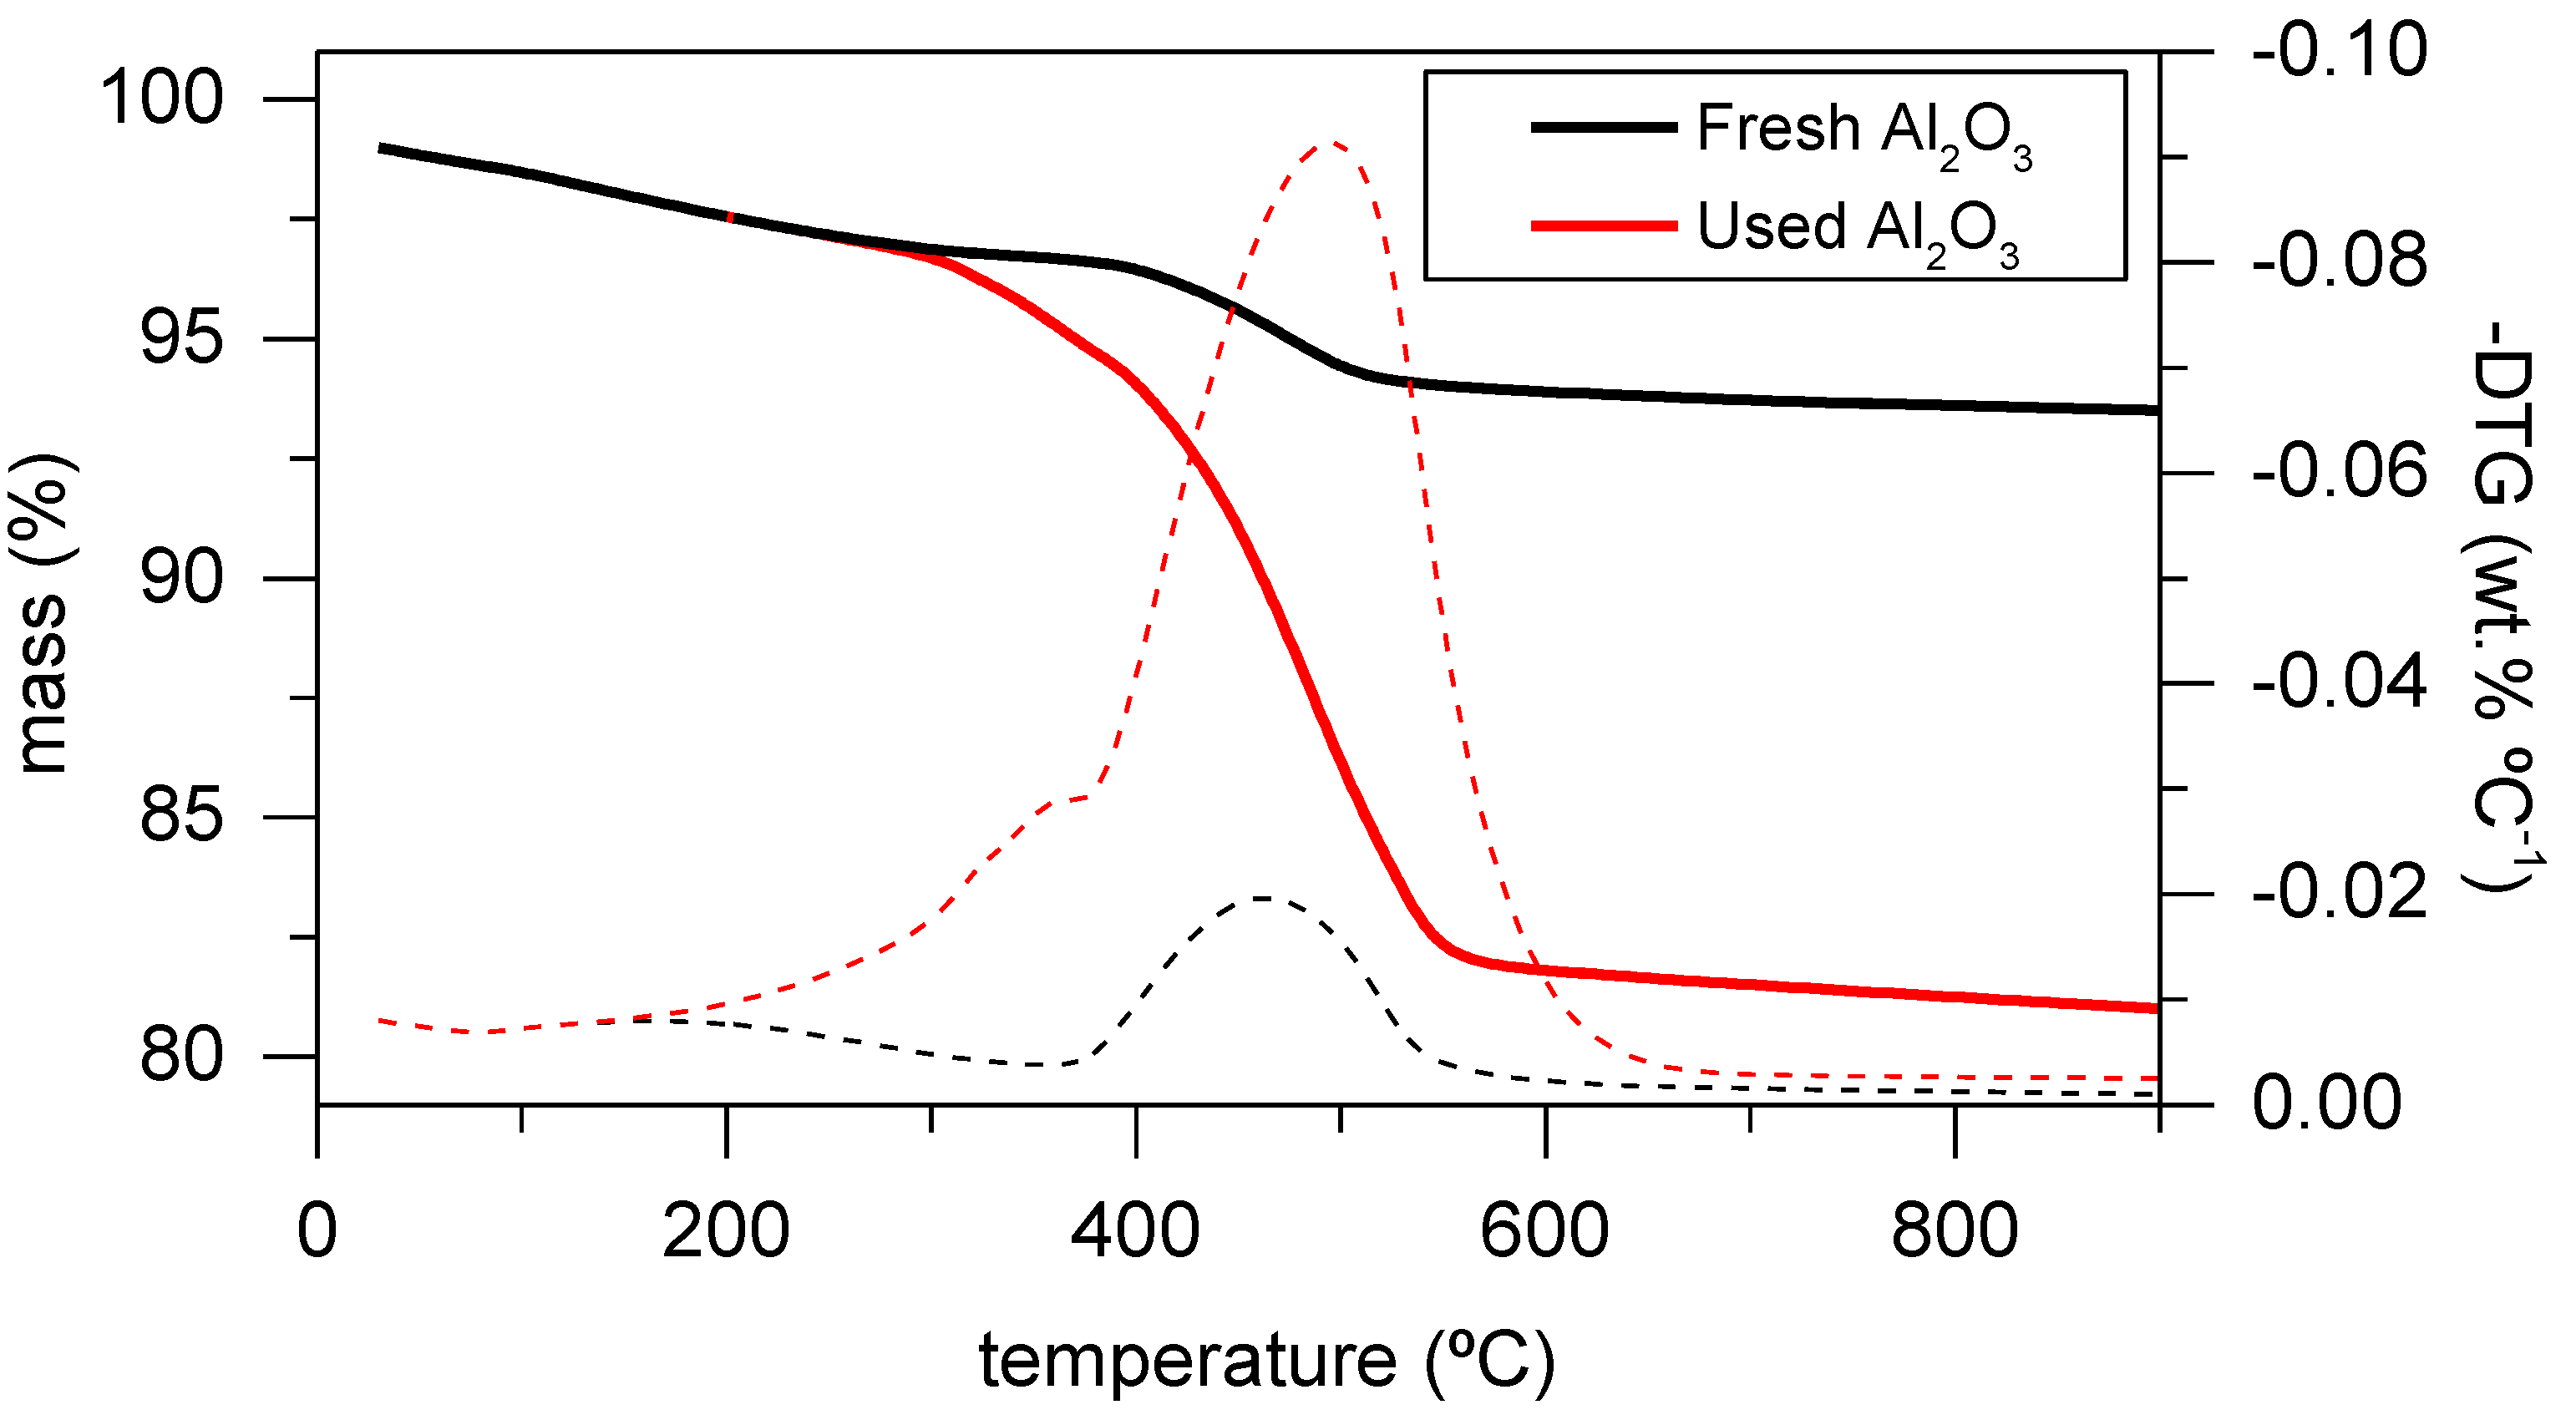
2.2. Nature of the Condensation By-Product Deposits

Once it was demonstrated that the condensation by-products deposited on the surface of an inert solid (Al2O3 or quartz beads) were able to decompose H2O2 and thus, to autocatalyze the WPO-O2 of phenol, an in-depth characterization of the solids before and after being used in the reaction was carried out. Given the significantly higher specific surface area of Al2O3 for the deposition of the by-product species, this solid was selected for the characterization study. The main goals were to learn about the amount, composition and nature of the deposited carbonaceous by-products.
The textural properties of both fresh and used Al2O3 spheres (after 650 h in stream) were first determined. Up to 70% fall on the SBET was observed, from 275 to 84 m2 g−1, which seems to be due to the presence of carbonaceous deposits, although the possible hydration of Al2O3 under the WPO-O2 operating conditions should also be considered, as was further confirmed by thermogravimetric analysis (TGA) and Fourier transform infrared spectroscopy (FTIR). Also, the mesopore volume was reduced from 0.32 to 0.15 cm3 g−1. Scanning Electron Microscope (SEM) images of the Al2O3 spheres before and after being used in the WPO-O2 of phenol can be seen in Figure 4. As observed, the fresh sphere presents a clearly rough surface, consistent with the porosity of the solid, while the used one shows a smooth aspect, which could be indicative of the coverage of the material by carbonaceous deposits. This effect can be better appreciated in the images taken at high resolution (x1K, x10K). These results are consistent with the decrease of SBET and porosity previously described. The bright areas that are observed in some images, i.e., Figure 4e, correspond to the presence of metals, mainly iron (Fe) and titanium (Ti), as was confirmed by Energy Dispersive X-ray spectroscopy (EDX) (Figure S1 in the Supplementary Material shows the EDX spectra). These metals come from the leaching of the tubes and reactor, respectively. Their total content is less than 0.2 wt.% (measured by inductively coupled plasma mass spectrometry, ICP-MS), therefore their effect on the reaction can be considered negligible.
The presence of carbonaceous deposits on the Al2O3 spheres was further confirmed by thermogravimetric analysis (TGA) of the solids in air atmosphere. The obtained results are depicted in Figure 5. Al2O3 suffered dehydration and a consequent phase transformation at temperatures around 450–500 °C [17,18,19], which can be clearly observed in both fresh and used samples. Nevertheless, in the latter, there was a shoulder at 350 °C and the weight loss from 300 to 600 °C was significantly higher than that observed in the fresh material. This peak at 350 °C was ascribed to the carbonaceous deposits, which were removed during the thermal treatment as indicated by the white color of the resulting Al2O3 spheres. By integrating the curves corresponding to the fresh and used samples, the weight loss due to the condensation by-products burned-off was calculated to be around 6% within the temperature range of 30–900 °C, which is consistent with the results of the ICP (provided above).
The characterization of the fresh and used Al2O3 spheres by different techniques such as elemental analysis (EA) and ICP-MS allowed us to get an insight on the composition of the condensation. The content of carbon and hydrogen increased from 0.11 to 2.90 wt.% and 1.61 to 2.07 wt.%, for the fresh and spent Al2O3, respectively. The high content of hydrogen in the fresh Al2O3 spheres (1.61 wt.%) could indicate the presence of bohemite phase AlO(OH). In fact, X-Ray Diffraction (XRD) confirmed the coexistence of both phases, bohemite and γ-Al2O3, the spectrum is shown in Figure S2 in the Supplementary Material. Taking into account that the sum of carbon and hydrogen content in the used Al2O3 spheres is lower than the 6 wt.% of reaction products, identified as the condensation by TGA, it is expected that the carbonaceous by-products contain oxygen in their structure. The amount of Al (measured by IPC-MS) decreased from 46.1 to 43.1 wt.%, which corresponds to the 6 wt.% of the condensation deposits.
To learn more about the functionalization of the condensation by-products deposited on the Al2O3 spheres, FTIR and X-Ray photoelectron spectroscopy (XPS) analyses were performed on the fresh and used Al2O3. FTIR spectra are given in Figure 6. The characteristic bands of fresh Al2O3 appear in the range of 1070–1150 cm−1, which are typical of bohemite (AlO(OH)) [20,21], and also in the range of 3093–3295 cm−1, which correspond to the vibration of OH bonds. These bands were of greater intensity in the used Al2O3 sample, in line with the hydration of the alumina upon the oxidation process, as observed by TGA. Nevertheless, the band at around 3100 cm−1 can also be assigned to the = C–H stretch in the aromatics [9], which could indicate that carbonaceous deposits show an aromatic character. On the other hand, by comparing both spectra, the appearance of some new bands in the used solid can be clearly seen. In fact, the new band in the range between 1025 and 1250 cm−1 can also be assigned to the C–H in-plane banding of the phenyl group [9]. The aromatic nature of the carbonaceous deposits is consistent with previous works where the precipitation of a solid polymer following the CWPO of phenol was observed [4,5]. Poerschmann et al. (2009) [4] postulated that carbonaceous solids showed features of humic acids, as they were formed by the oxidative coupling reactions of phenolic rings. The band at 1427 cm−1 revealed the presence of C–O and OH groups in carboxylic acids, while those at 1698 and 1718 cm−1 indicated the occurrence of C=O groups and C=O from quinones, aldehydes and ketones, respectively. The bands in the range of 2100–2300 cm−1 could be due to C C stretch [22]. Therefore, the carbonaceous deposits exhibit a complex composition of phenols, carboxylic acids, aldehydes, ketones, aromatic carbon rings and aliphatic carbons.
In line with the previous characterization analyses, XPS spectrum of the used Al2O3 spheres also allowed us to confirm the presence of carbonaceous deposits on the solid surface, as indicated by the strong C1s peak observed (Figure 7). Its asymmetric shape, with decreasing intensity towards higher binding energies indicate that there is a contribution from oxygenated functional groups [23]. The C1s spectrum was fitted to three peaks: a peak for polyaromatic carbons (284.8 eV, C–C and C–H), for carbon singly bonded to one oxygen atom (285.8 eV, C–O) and for carboxylate groups (288.5, O–C=O) [24].

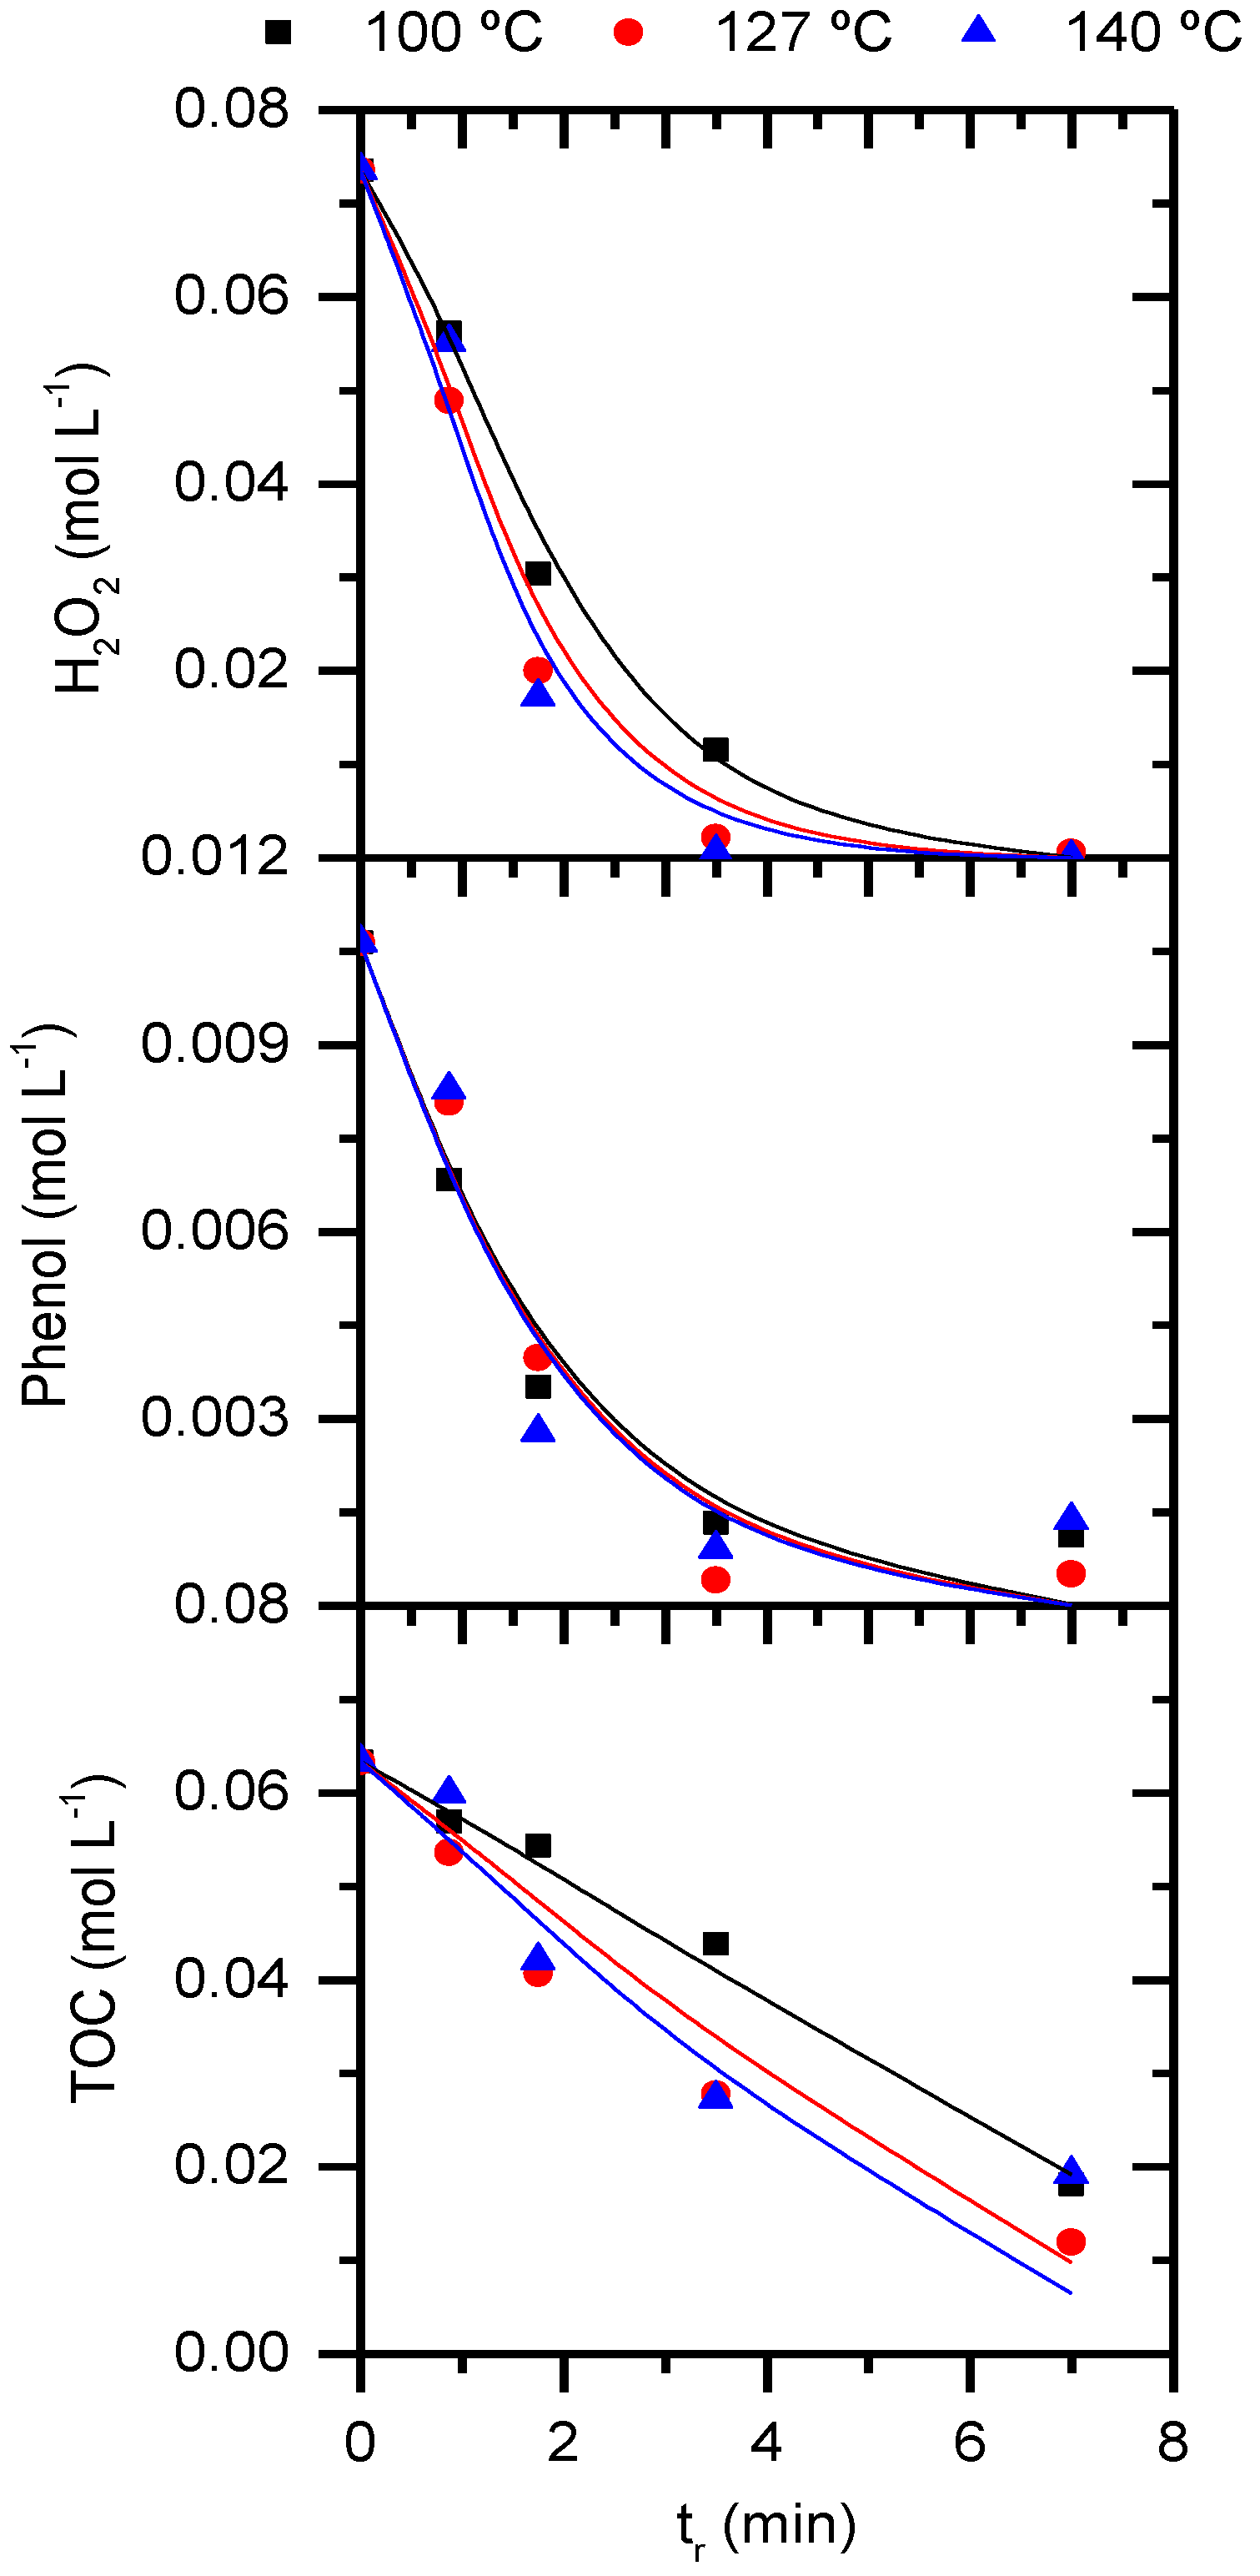
2.3. Kinetic Modeling

The kinetic model developed in Part I of this work [16] for phenol WPO-O2 in the presence of quartz beads explained that the condensation by-products catalyzed the decomposition of H2O2 into oxidizing radicals able to degrade the organic pollutant, according to the following autocatalytic rate equations:
( r H 2 O 2 ) ( m o l L · m i n ) = k H 2 O 2 · C H 2 O 2 · ( C H 2 O 2 , 0 C H 2 O 2 )
( r P h e n o l ) ( m o l L · m i n ) = k P h e n o l · C P h e n o l · ( C H 2 O 2 , 0 C H 2 O 2 )
( r T O C ) ( m o l L · m i n ) = k T O C · C T O C · ( C H 2 O 2 , 0 C H 2 O 2 )
The concentration profiles of phenol, TOC and H2O2 vs. residence time (tr) obtained in the presence of Al2O3 at different temperatures are shown in Figure 8 (in symbols). As observed, the disappearance of phenol is not significantly affected by the temperature, the same for TOC and H2O2 decomposition at temperatures above 127 °C.
The numerical integration of the rate equations of Equations (1–3) assuming plug-flow reactor, with the initial conditions [Phenol] = [Phenol]0, [H2O2] = [H2O2]0 at t = 0 was solved by using the Microsoft Excel Solver (Microsoft Office, 2010, Microsoft Corp., Redmond, WA, USA) based on the Generalized Reduced Gradient (GRG) algorithm for least squares minimization. The equations were solved at all temperatures simultaneously considering the Arrhenius equation to determine activation energy and the pre-exponential factor.
The resulting differential equations of this autocatalytic model are:
( r H 2 O 2 ) ( m o l L · m i n ) = 17.8 · 10 3 · exp ( 1095 T ) · C H 2 O 2 · ( 0.074 C H 2 O 2 )    ( R 2   =   0.99 )
( r P h e n o l ) ( m o l L · m i n ) = 267 · exp ( 20.5 T ) · C P h e n o l · ( 0.074 C H 2 O 2 )     ( R 2   =   0.96 )
( r T O C ) ( m o l L · m i n ) = 21.1 · 10 3 · exp ( 1949 T ) · C T O C · ( 0.074 C H 2 O 2 )    ( R 2   =   0.94 )
The good agreement found between the experimental (symbols) and calculated values (lines) validates this model, as can be seen in Figure 8. Nevertheless, it must be noted that the values obtained for the pre-exponential factor (L mol−1 min−1) and activation energy (Ea/R) are actually a lumping of different reactions including H2O2 decomposition, CP production and phenol or TOC evolution rate. The existence of these various phenomena occurring simultaneously but with opposite effects makes it difficult to assign a physical meaning to those values.

2.4. Stability of the Condensation By-Product Deposits

The condensation by-products generated upon reaction can also be consumed, depending on the operating conditions. It is then clear that reaching a stable concentration of these species is a key issue to ensure the efficiency and reproducibility of the results. The main aspects that are expected to determine the generation and consumption of condensation by-products during reactions are the initial target pollutant concentration and the dose of H2O2, respectively [16]. Both process variables are analyzed below.
Figure 9 shows the initial oxidation rate values obtained for phenol disappearance, TOC removal and H2O2 consumption when the initial concentration of phenol was evaluated within 100–5000 mg L−1, maintaining the dose of H2O2 at 50% of the stoichiometric amount for its complete mineralization. As observed, the highest initial oxidation rate was achieved with the highest phenol concentration tested (5000 mg L−1). The difference was quite significant, around one and even two orders of magnitude higher, when comparing 5000 mg L−1 to 1000 and 100 mg L−1, respectively. This is indicative of a higher amount of “catalytic” carbonaceous deposits formed by increasing the initial concentration of phenol. On the other hand, it should be mentioned that the efficiency of the consumption of H2O2 (calculated as the ratio between the conversion of TOC and that of H2O2) also increased with the amount of phenol, from 15 to 60%, when the concentration was varied from 100 to 5000 mg L−1. Therefore, the amount of condensation by-products deposited on the Al2O3 spheres not only affected the kinetics but also the extension of the reaction. In fact, the intermediate distribution was strongly dependent on the initial concentration of phenol tested (see Figure S3 in the Supplementary Material for experimental data). Notably, the amount of dissolved condensation by-products increased with the initial concentration of phenol (from 1 to 13% of the initial TOC was attributed to dissolved condensation by-products with 100 and 5000 mg L−1 initial phenol concentration, respectively). This is consistent with the fact that those species are generated by condensation of phenolic radicals, which would be in significantly higher amounts at higher initial phenol concentrations.
The results obtained in terms of TOC conversion at different H2O2 doses (from 50–300% of the stoichiometric amount for complete phenol oxidation), maintaining the initial phenol concentration at 1000 mg L−1, are summarized in Figure 10. It should be noted that at the residence time established for all experiments (7 min), complete phenol degradation and total H2O2 consumption was reached. As observed, the increase in H2O2 concentration resulted in higher mineralization yields, even above 90% when two-times the stoichiometric amount of H2O2 was used. Nevertheless, a further increase in the amount of H2O2 did not lead to a higher degree of mineralization, which could be due to the inefficient consumption of this reagent by the radical auto-scavenging reactions, and also to the fact that the amount of carbonaceous deposits present to catalyze the reaction would be significantly lower as they would be oxidized due to the harsher operating conditions. The images of the Al2O3 spheres at the exit of the reactor with the lowest and highest H2O2 doses tested confirmed this hypothesis (Figure 10). While the used solids showed a brown color when H2O2 doses below the stoichiometric amount were used, Al2O3 spheres recovered their original white color at or above that threshold value, which proved that the condensation by-products deposits were completely removed. It should also be noted that the efficiency of H2O2 consumption (calculated as the ratio between the conversion of TOC and that of H2O2) was progressively decreased with increasing the H2O2 dose. Values of the efficiency of 43, 31, 26, 14 and 9.3% were obtained with H2O2 doses of 50%, 75%, 100%, 200% and 300% of the stoichiometric amount, respectively.

3. Experimental Methods

3.1. Al2O3 Spheres and Characterization

Commercial Al2O3 spheres (ϕp = 24 mm) supplied by Sigma Aldrich (ref.: 414069, Kyoto, Japan) were used as inert material to arrange a bed to adsorb the condensation by-products formed during the WPO-O2 process.
Al2O3 spheres before and after the WPO-O2 experiments (fresh and used Al2O3) were characterized by different techniques. The porous structure of the catalysts was characterized from the 77 K N2 adsorption/desorption using a Micromeritics Tristar apparatus. The samples were first outgassed overnight at 150 °C to a reduced pressure < 10−3 Torr in order to ensure a dry clean surface. The morphology of the Al2O3 spheres was observed by scanning electron microscopy (SEM) using a Hitachi S-3000N apparatus at an accelerating voltage of 20 kV. Evidence for the presence of carbonaceous deposits on the spent Al2O3 spheres were obtained by thermogravimetric analysis (TGA/SDTA851e thermobalance, Mettler-Toledo) coupled to a Thermostat (model GSD 301 TC) from Pfeiffer Vacuum MS. The samples were heated in helium from room temperature to 900 °C at 10 °C min−1. Besides, the chemical composition of the condensation by-products was investigated by EA and ICP-MS. EA for carbon and hydrogen were carried out with a LECO Model CHNS-932 analyzer. Aluminum quantification by ICP-MS in a PerkinElmer’s NexION 2000. The samples were prepared by closed microwave digestion in acid solution, containing H3PO4 and HF, at 270 °C for 2 h. XRD was performed with a PANalytical X’Pert Pro Theta/2Theta diffractometer with CuK radiation on Al2O3 spheres previously crushed into powder. Data were collected from 10° to 100° (2θ), with steps of 0.0167°. Information about the functionalization of the condensation by-products was obtained by the FTIR (Bruker IFS66v spectrophotometer, 4 cm−1 resolution, 250 scans in normal conditions, 7000–550 cm−1) and XPS analyses (Physical Electronics, mod. ESCA 5701, equipped with a monochromatic Mg Ka X-ray excitation source, hʋ = 1253.6 eV). The deconvolution of the C 1s profile at 284.6 eV was carried out with the provided software ‘Multipak v8.2b’, which obtains the relative amounts of the different surface groups. The procedure involves smoothing, background subtraction and mixed Gaussian–Lorentzian peak shape by a least-squared method curve fitting.

3.2. Oxidation Experiments

Oxidation experiments were conducted in a fixed-bed reactor consisting of a titanium tube with a 0.91 cm internal diameter and 30 cm long (reactor volume, VR = 4 cm3), loaded with 2 g of glass beads (ϕbeads = 2.4 mm and εL = 0.45). The temperature was measured by a thermocouple located in the bed. The liquid and gas phases were passed through the bed in concurrent up-flow. Detailed information about the components and operation procedure of this setup has been reported elsewhere [25]. An aqueous solution of H2O2 with or without phenol at natural pH0 was continuously fed to the reactor along with a 92 NmL min−1 pure oxygen stream. H2O2 decomposition reactions were performed with fresh and used Al2O3. The same results were obtained in the presence and absence of Al2O3, which demonstrated that it is an inert material for the decomposition of H2O2. The runs were conducted at [H2O2]0 = 2500 mg L−1, PO2 = 8 bar (92 N mLO2 min−1), T = 150 °C, natural pH0 and at different flow rates (QL) = 10 and 5 mL min−1 equivalent to residence times (tr) of c.a. 5.5 and 11 s. This tr is calculated as the ratio of the liquid volume (VL) and flow rate (QL). VL was equal to εL·VR. The used Al2O3 was obtained after 145 h on stream upon phenol WPO-O2 at the following operating conditions: [phenol]0 = 1000 mg L−1, [H2O2]0 = 2500 mg L−1, PO2 = 8 bar (92 N mLO2 min−1), T = 140 °C, natural pH0 and tr = 4.5 min.
The phenol WPO-O2 runs were conducted in a wide range of operating conditions: [phenol]0 = 100–5000 mg L−1, [H2O2]0 = 250–12500 mg L−1 (from 50 to 300% stoichiometric dose of H2O2, depending on the initial phenol concentration), PO2 = 8 bar (92 N mLO2 min−1), T = 100–140 °C and QL = 1–0.125 mL min−1 to cover the experimental range of tr = 0.9–7 min.
Liquid samples were periodically withdrawn from the reactors and immediately injected in a vial (submerged in crushed ice) containing a known volume of cold distilled water. The diluted samples were filtered (0.45 μm Nylon filter) and subsequently analyzed by different techniques.

3.3. Analytical Methods

High performance liquid chromatography (Ultimate 3000, Thermo Scientific, Waltham, MA, USA) was used to follow the evolution of phenol and aromatic intermediates during WPO-O2 reactions. A C18 5 μm column (Kinetex from Phenomenex, 4.6 mm diameter, 15 cm long) and a 4 mM H2SO4 aqueous solution were employed as stationary and mobile phases, respectively. Wavelengths of 210 and 246 nm were used for the quantification. Short-chain organic acids were analyzed by means of chromatography (Personal IC mod. 790, Metrohm). A mixture of Na2CO3 (3.2 mM) and NaHCO3 (1 mM) aqueous solutions and a Metrosep A sup 5–250 column (4 mm diameter, 25 cm long) were used. A TOC analyzer (Shimadzu TOC VSCH, Kyoto, Japan) was used to quantify total organic carbon (TOC).

4. Conclusions

This work demonstrates that the condensation by-products formed during the WPO process promote H2O2 decomposition into radical species. This is achieved by the electron donor-acceptor groups in the condensation species (which are represented as aromatic carbon functionalized with quinone, phenolic, aldehyde, carboxylic and ketones groups) that make the electron-transfer to the H2O2 molecules and vice versa possible. Their beneficial effect on the oxidation process can be described through an autocatalytic kinetic model.
The oxidation rate and the extension of the reaction is determined by the amount of the condensation by-product deposits. In the presence of porous Al2O3 spheres in a packed bed, the oxidation rate values were one order of magnitude higher than the quartz beads, the mineralization yield was also significantly greater (XTOC = 72% vs. 5%, respectively), and the intermediate distribution was very different, with a 90% less concentration of aromatic by-products in the media.
The amount of the deposits is a trade-off between the initial concentration of phenol (which favors the polycondensation reactions and therefore the production of condensation by-products) and the dose of H2O2 (which mineralizes the condensation by-products when used at high enough concentrations).

Supplementary Materials

The following are available online at https://www.mdpi.com/2073-4344/9/6/518/s1, Figure S1. EDX spectra of the Al2O3 spheres after being used in the WPO-O2 of phenol; Figure S2. XRD spectra of the fresh Al2O3; Figure S3. Influence of the initial phenol concentration on the by-product distribution in the WPO-O2 process.

Author Contributions

Conceptualization, J.A.C. and A.Q.; Data curation, J.L.D.T. and C.F.; Formal analysis, A.Q., J.L.D.T., C.F. and M.M.; Funding acquisition, J.A.C.; Investigation, A.Q., J.L.D.T., C.F. and M.M.; Methodology, A.Q., J.L.D.T. and C.F.; Project administration, J.A.C.; Supervision, J.A.C. and A.Q.; Validation, J.L.D.T. and C.F.; Writing—original draft, A.Q. and M.M.; Writing—review & editing, A.Q., M.M. and J.A.C.

Funding

This research was supported by the Spanish MINECO through the project CTM-2016-76454-R and by the CM through the project P2018/EMT-4341. M. Munoz thanks the Spanish MINECO for the Ramón y Cajal postdoctoral contract (RYC-2016-20648).

Conflicts of Interest

The authors declare no conflict of interest.

References

  1. Delgado, J.J.; Chen, X.; Pérez-Omil, J.A.; Rodríguez-Izquierdo, J.M.; Cauqui, M.A. The effect of reaction conditions on the apparent deactivation of Ce–Zr mixed oxides for the catalytic wet oxidation of phenol. Catal. Today 2012, 180, 25–33. [Google Scholar] [CrossRef]
  2. Vallejo, M.; Fernández-Castro, P.; San Román, M.F.; Ortiz, I. Assessment of PCDD/Fs formation in the Fenton oxidation of 2-chlorophenol: Influence of the iron dose applied. Chemosphere 2015, 137, 135–141. [Google Scholar] [CrossRef] [PubMed]
  3. Domínguez, C.M.; Ocón, P.; Quintanilla, A.; Casas, J.A.; Rodriguez, J.J. Highly efficient application of activated carbon as catalyst for wet peroxide oxidation. Appl. Catal. B 2013, 140–141, 663–670. [Google Scholar] [CrossRef]
  4. Poerschmann, J.; Trommler, U.; Górecki, T.; Kopinke, F.D. Formation of chlorinated biphenyls, diphenyl ethers and benzofurans as a result of Fenton-driven oxidation of 2-chlorophenol. Chemosphere 2009, 75, 772–780. [Google Scholar] [CrossRef] [PubMed]
  5. Munoz, M.; de Pedro, Z.M.; Casas, J.A.; Rodriguez, J.J. Assessment of the generation of chlorinated byproducts upon Fenton-like oxidation of chlorophenols at different conditions. J. Hazard. Mater. 2011, 190, 993–1000. [Google Scholar] [CrossRef] [PubMed]
  6. Diaz de Tuesta, J.L.; Quintanilla, A.; Casas, J.A.; Rodriguez, J.J. Kinetic modeling of wet peroxide oxidation with a carbon black catalyst. Appl. Catal. B 2017, 209, 701–710. [Google Scholar] [CrossRef]
  7. Munoz, M.; de Pedro, Z.M.; Casas, J.A.; Rodriguez, J.J. Combining efficiently catalytic hydrodechlorination and wet peroxide oxidation (HDC–CWPO) for the abatement of organochlorinated water pollutants. Appl. Catal. B 2014, 150–151, 197–203. [Google Scholar] [CrossRef]
  8. Hamoudi, S.; Larachi, F.; Adnot, A.; Sayari, A. Characterization of Spent MnO2/CeO2 Wet Oxidation Catalyst by TPO–MS, XPS, and S-SIMS. J. Catal. 1999, 185, 333–344. [Google Scholar] [CrossRef]
  9. Kim, S.; Ihm, S. Nature of carbonaceous deposits on the alumina supported transition metal oxide catalysts in the wet air oxidation of phenol. Top. Catal. 2005, 33, 171–179. [Google Scholar] [CrossRef]
  10. Lee, D.K.; Kim, D.S.; Kim, T.H.; Lee, Y.K.; Jeong, S.E.; Le, N.T.; Cho, M.J.; Henam, S.D. Deactivation of Pt catalysts during wet oxidation of phenol. Catal. Today 2010, 154, 244–249. [Google Scholar] [CrossRef]
  11. Keav, S.; de los Monteros, A.E.; Barbier, J.; Duprez, D. Wet Air Oxidation of phenol over Pt and Ru catalysts supported on cerium-based oxides: Resistance to fouling and kinetic modelling. Appl. Catal. B 2014, 150–151, 402–410. [Google Scholar] [CrossRef]
  12. Yadav, A.; Verma, N. Carbon bead-supported copper-dispersed carbon nanofibers: An efficient catalyst for wet air oxidation of industrial wastewater in a recycle flow reactor. J. Ind. Eng. Chem. 2018, 67, 448–460. [Google Scholar] [CrossRef]
  13. Catrinescu, C.; Teodosiu, C.; Macoveanu, M.; Miehe-Brendlé, J.; Le Dred, R. Catalytic wet peroxide oxidation of phenol over Fe-exchanged pillared beidellite. Water Res. 2003, 37, 1154–1160. [Google Scholar] [CrossRef]
  14. Collett, C.H.; McGregor, J. Things go better with coke: the beneficial role of carbonaceous deposits in heterogeneous catalysis. Catal. Sci. Technol. 2016, 6, 363–378. [Google Scholar] [CrossRef]
  15. Catrinescu, C.; Arsene, D.; Teodosiu, C. Catalytic wet hydrogen peroxide oxidation of para-chlorophenol over Al/Fe pillared clays (AlFePILCs) prepared from different host clays. Appl. Catal. B 2011, 101, 451–460. [Google Scholar] [CrossRef]
  16. Quintanilla, A.; Díaz de Tuesta, J.L.; Figueruelo, C.; Munoz, M.; Casas, J.A. Condensation by-products in wet peroxide oxidation: fouling or catalytic promotion? Part I. Evidences of an autocatalytic process. Catalysts 2019, in press. [Google Scholar]
  17. Becerra, M.E.; Arias, N.P.; Giraldo, O.H.; López-Suárez, F.E.; Illán-Gómez, M.J.; Bueno-López, A. Alumina-supported manganese catalysts for soot combustion prepared by thermal decomposition of KMnO4. Catalysts 2012, 2, 352–357. [Google Scholar] [CrossRef]
  18. Lefävre, G.; Duc, M.; Lepeut, P.; Caplain, R.; Fadoroff, M. Hydration of Î3-alumina in water and its effects on surface reactivity. Langmuir 2002, 18, 7530–7537. [Google Scholar] [CrossRef]
  19. El-Naggar, A.Y. Thermal analysis of the modified, coated and bonded alumina surfaces. J. Emer. Trends Eng. Appl. Sci. 2014, 5, 30–34. [Google Scholar]
  20. Ram, S. Infrared spectral study of molecular vibrations in amorphous, nanocrystalline and AlO(OH)·αH2O bulk crystals. Infrared Phys. Technol. 2001, 42, 547–560. [Google Scholar] [CrossRef]
  21. Nyquist, R.A.; Lengers, M.A. Handbook of infrared and ramen spectra of inorganic compounds and organic salts. Search PubMed 1997, 4, 72. [Google Scholar]
  22. Lambert, J.B.; Shurvell, H.F.; Lightner, D.A.; Cooks, R.G. Introduction to Organic Spectroscopy; Macmillan Publishing Company: London, UK, 1987. [Google Scholar]
  23. Estrade-Szwarckopf, H. XPS photoemission in carbonaceous materials: A “defect” peak beside the graphitic asymmetric peak. Carbon 2004, 42, 1713–1721. [Google Scholar] [CrossRef]
  24. Ishimaru, K.; Hata, T.; Bronsveld, P.; Meier, D.; Imamura, Y. Spectroscopic analysis of carbonization behavior of wood, cellulose and lignin. J. Mater. Sci. 2007, 42, 122–129. [Google Scholar] [CrossRef]
  25. Quintanilla, A.; Casas, J.A.; Zazo, J.A.; Mohedano, A.F.; Rodríguez, J.J. Wet air oxidation of phenol at mild conditions with a Fe/activated carbon catalyst. Appl. Catal. B 2006, 62, 115–120. [Google Scholar] [CrossRef]
Figure 1. H2O2 decomposition over fresh and 145 h-used Al2O3 upon the phenol WPO-O2. Operating conditions: [H2O2]0 = 2500 mg L−1, PO2 = 8 bar (92 N mLO2 min−1), T = 150 °C, natural pH0 and WAl2O3 = 2 g. The inset images show the Al2O3 spheres before and after being used in the WPO-O2 of phenol.
Catalysts 09 00518 g001
Figure 2. Phenol disappearance, TOC removal and H2O2 consumption upon the phenol WPO-O2 over quartz and Al2O3 beads (Wquarzt = 29 g and WAl2O3 = 2 g, respectively) at different temperatures. Operating conditions: [phenol]0 = 1000 mg L−1, [H2O2]0 = 2500 mg L−1, PO2 = 8 bar (92 N mLO2 min−1), natural pH0 and tR = 7 min. The inset numbers correspond to the initial rate values calculated in gi gsolid−1 h−1.
Catalysts 09 00518 g002
Figure 3. Comparison of the reaction products distribution using quartz and Al2O3 beads at 7 min of reaction. Operating conditions are the same as Figure 2.
Catalysts 09 00518 g003
Figure 4. SEM micrographs of the Al2O3 spheres before (a,b,c) and after (d,e,f) being used in the WPO-O2 of phenol.
Catalysts 09 00518 g004
Figure 5. Differential thermogravimetric profiles (wt.%·°C−1) of the fresh and used Al2O3 in helium atmosphere at 10 °C min−1.
Catalysts 09 00518 g005
Figure 6. FTIR spectra of the Al2O3 spheres before and after being used in the phenol WPO-O2.
Catalysts 09 00518 g006
Figure 7. Deconvolution spectrum of C1s for the Al2O3 spheres after being used in the phenol WPO-O2.
Catalysts 09 00518 g007
Figure 8. Experimental (symbols) and predicted (lines) concentrations of H2O2, phenol and TOC by the autocatalytic kinetic model of the phenol WPO-O2 over Al2O3 at different temperatures. Operating conditions: [Phenol]0 = 1000 mg L−1, [H2O2]0 = 2500 mg L−1, PO2 = 8 bar, natural pH0 and WAl2O3 = 2 g.
Catalysts 09 00518 g008
Figure 9. Effect of the initial phenol concentration on the initial rate of phenol disappearance, TOC removal and H2O2 consumption upon the phenol WPO-O2 over Al2O3 spheres. Operating conditions: [H2O2]0 equivalent to the 50% stoichiometric dose for phenol mineralization, PO2 = 8 bar (92 N mLO2 min−1), T = 140 °C, natural pH0 and WAl2O3 = 2g.
Catalysts 09 00518 g009
Figure 10. Effect of the H2O2 dose on the TOC conversion achieved upon the phenol WPO-O2 over Al2O3 at 7 min of reaction time. Operating conditions: [Phenol]0 = 1000 mg L−1, PO2 = 8 bar (92 N mLO2 min−1), T = 140 °C, natural pH0 and WAl2O3 = 2 g. The inset images show the Al2O3 spheres at the exit of the reactor.
Catalysts 09 00518 g010
Table 1. A brief summary of CWAO and CWPO studies in which the formation of condensation by-products upon wastewater treatment was considered.
ProcessCatalystTarget
Pollutant
Operating ConditionsCondensation ProductsReference
CWAOMnO2/CeO2PhenolT = 80–130 °C
PO2 = 5 bar
Ccat = 1–5 g L−1
Ccont = 1–10 g L−1
Formation: A carbonaceous overlayer was formed upon CWAO. The amount of surface carbon increased with reaction time, whereas its composition was reaction time and temperature dependent.
Characterization: TPO-MS, XPS and S-SIMS. Low polycondensation (4 condensed aromatic rings) deposits were formed. The presence of aliphatic species as well as oxygen-containing compounds from alcohol/ether origin was also evidenced.
Regeneration: oxidation in air (200–300 °C).
[8]
CWAOMn/Al2O3
Fe/Al2O3
Co/Al2O3
Ni/Al2O3
Cu/Al2O3
PhenolT = 150 °C
Pair = 20 bar
Ccat = 3 g L−1
Ccont = 1 g L−1
Formation: Used catalysts showed a darker color due to the formation of carbonaceous deposits. Mn/Al2O3 showed the highest amount of deposits.
Characterization: Specific surface area, NMR and FTIR. The carbonaceous deposits showed a microporous structure, increasing the surface area of the catalyst. They were mostly of aromatic nature, containing also oxygen-bearing groups such as carboxylic acids and alcohols.
Regeneration: N/A
[9]
CWAOPt/Al2O3
Pt/CeO2
PhenolT = 150 °C
PO2 = 14 bar
Ccat = 1–3 g L−1
Ccont = 0.5–10 g L−1
Formation: Along reaction, carbonaceous deposits were formed on the catalyst surface, leading to its deactivation, especially with Pt/Al2O3.
Characterization: TEM, EDX, XPS and TPO. The carbonaceous deposits were predominantly formed on the surface of Pt particles. The deposits were burned at 250–700 °C in Pt/Al2O3 and 250–450 °C in Pt/CeO2.
Regeneration: N/A
[10]
CWAOCe–Zr mixed oxidesPhenolT = 120–160 °C
PO2 = 5–20 bar
Ccat = 1.9–5.8 g L–1
Ccont = 0.25–3.8 g L–1
Formation: Phenolic polymers are formed and further degraded along reaction depending on the operating conditions. At 120 °C, their formation is favored, leading to a deactivation of the catalyst. At 160 °C, the deposits are completely oxidized to CO2.
Characterization: Quantification by carbon-mass balances, TPO and specific surface area. The carbon deposits amounted from 2.9% to 30% wt. They were burn-off at mild temperatures (<350 °C). The specific surface area was slightly decreased due to carbon deposits coverage (1%–13%).
Regeneration: Calcination at 350 °C.
[1]
CWAORu/Ce, ZrCe or ZrCePr
Pt/Ce, ZrCe or ZrCePr
PhenolT = 160 °C
PO2 = 20 bar
Ccat = 4 g L−1
Ccont = 2.1 g L−1
Formation: Heavy polymer species are adsorbed on the catalytic surface along reaction, leading to the blockage of the redox cycle by limiting the reoxidation of the catalytic sites. The increase in the number of catalytic oxidation sites increased the accumulation of adsorbed species, while high metal dispersion allowed their degradation.
Characterization: N/A
Regeneration: N/A
[11]
CWAOCu-PhB-CNF-K Phenol
Industrial wastewater
T = 180–230 °C
PO2 = 12–16 bar
Ccat = 0.25–1 g L−1
Ccont (phenol) = 1–1.5 g L−1
COD = 111–120 gO2 L−1
Formation: Carbonaceous deposits formation due to copolymerization of phenol, leading to coverage of catalytic active sites and the deactivation of the catalyst.
Characterization: N/A
Regeneration: N/A
[12]
CWPODissolved iron (Fe3+)4-chlorophenolT = 50 °C
pH0 = 3
Ccat = 1–20 mg L−1
CH2O2 = 20–100% stoich. dose
Ccont = 0.1–2 g L−1
Formation: At short reaction times and/or using substoichiometric doses of H2O2, the development of a brownish color in the reaction medium and the existence of a dark solid residue after evaporation were observed. Final colorless effluents were obtained when the stoichiometric dose of H2O2 was used.
Characterization: GC-MS of homogeneous condensation by-products and elemental analysis of the solid. Different dimers such as chlorinated diphenyl ethers, PCBs and even dioxins were identified in the liquid phase. The solid mainly contained carbon, oxygen and chlorine, including also iron (46.4% C, 2.6% H, 12.6% Cl, 3.6% Fe and 34.8% O).
Regeneration: N/A
[5]
CWPOFe/pillared beidellitePhenolT = 50 °C
pH0 = 3.5
Ccat =0.5 g L−1
CH2O2 = 1.25 g L−1 (stoich. dose)
Ccont = 0.25 g L−1
Formation: Organic species were deposited in the used catalyst, leading to a loss of activity upon successive runs. It recovered its initial activity after a calcination step.
Characterization: N/A
Regeneration: Calcination.
[13]
CWPOFe2O3/γ-Al2O32-chlorophenol
2,4-dichlorophenol
2,4,6-trichlorophenol
T = 50 °C
pH0 = 3
Ccat = 2 g L−1
CH2O2 = 20–100% stoich. dose
Ccont = 0.1–2 g L−1
Formation: Condensation by-products were formed in high amounts at initial reaction times and/or substoichiometric doses of H2O2. A dramatic color change of the reaction medium was observed. The used catalysts showed a brown color when doses below 75% of H2O2 were used.
Characterization: Specific surface area and elemental analysis. The former decreased due to the presence of carbonaceous deposits at H2O2 doses below 75% of the stoichiometric amount (up to 33% area reduction with a 20% H2O2 stoichiometric dose). The used catalyst with 20% H2O2 stoichiometric dose showed 7.7% C, 0.99% H and 2.74% Cl.
Regeneration: N/A
[7]
CWPOActivated carbonPhenolT = 80 °C
pH0 = 3.5
Ccat = 2.5 g L−1
CH2O2 = 100% stoichiometric dose
Ccont = 5 g L−1
Formation: Condensation by-products were adsorbed onto the carbon surface, causing a progressive deactivation upon successive uses.
Characterization: TGA and cyclic voltammetry. The burn-off of condensation products occurs at 350 °C. An important decrease of the electrochemical properties of the catalyst due to the presence of carbon deposits was observed.
Regeneration: calcination (350 °C, 24 h).
[3]
N/A, not analyzed.

