Numerical Simulation of Ice Fractures Process of the Yellow River Based on Disk Specimen


1
School of Water Conservancy Engineering, Zhengzhou University, Zhengzhou 450001, China
2
Yellow River Institute of Hydraulic Research, Zhengzhou 450003, China
3
Research Center on Levee Safety Disaster Prevention MWR, Zhengzhou 450003, China
4
State Marine Technical University of Saint-Petersburg, 190121 Saint-Petersburg, Russia
*
Author to whom correspondence should be addressed.
Crystals 2020, 10(7), 598; https://doi.org/10.3390/cryst10070598
Submission received: 27 May 2020
/
Revised: 4 July 2020
/
Accepted: 6 July 2020
/
Published: 10 July 2020
(This article belongs to the Special Issue Ice Crystals)
Abstract
:To study the influence of the changes in crystals on a micro scale as well as their effect on the macro mechanical properties of river ice and to mitigate the limitation of the objective conditions in a physical examination of river ice, it is necessary to analyze the fracture process of river ice using a micro numerical calculation method. Thus, a numerical model was established to simulate the cracking process of river ice based on disk specimen. Upon comparison with the physical experiment, the results of the numerical model show agreement with the fracture toughness and cracking process. Based on the numerical model, the obtained material parameters of Yellow River ice laid a foundation for the study of the cracking process of river ice on a macro-, meso-, and multiscale.
1. Introduction
River ice is a quasibrittle and crystal material. The material parameters and structural parameters have always been a difficult problem in river ice engineering research. Generally, a theoretical analysis, physical experiment, and numerical simulation are necessary. A theoretical analysis summarizes the basic theory and method of river ice mechanics and provides the physical basis and criteria for river ice fracture mechanics. The results of a physical experiment provide the real material properties of river ice. A numerical simulation provides a way to explain river ice performance on a macro-, meso-, and multiscale.
In the microscopic scale, the water molecules in ice can form four hydrogen bonds and regular crystal lattice. A lot of hydrogen bonds need be broken in ice fracture. Pritcha [1] and Solomentsev et al. [2] have carried out systematic research in water and ice hydrogen bonding, which provide a reference for the study of ice fracture at a microscale.
In simulating ice fracture, many methods can be adopted. The finite element method is one of the most common methods for simulating the ice fracture. Kendall [3] proposed a new failure criterion that is based on the fracture energy balance theory and explained that the force required for fracture depends on the fracture mode, the fracture surface energy of the material, and the geometry and elasticity of a specimen. Zou et al. [4] described the effects of a fracture and the spalling on ice structure interactions. According to the strain energy release rate at the crack tip, a crack with a different length and position was numerically investigated. In addition, the crack propagation in Kendall’s double cantilever theory was explored. Evans et al. [5] examined the cracking and spalling process of brittle thin plates under an edge load, and they revealed the overall crack propagation rate, the crack growth load, and peeling. Xiao et al. [6,7] established a damage calculation model of ice that is based on the nonlinear damage Burgers model of a viscoelastic body based on Kelvin and Maxwell elements. The model was verified and calibrated via the analysis of laboratory test data. Han Lei et al. [8] systematically analyzed the whole failure process of ice cone interaction with ANSYS and obtained the change law of ice force and deflection relationship curve with failure mode. The main difference between wedge beam bending failure and plate bending failure was the subsequent deformation ability and the ice force increment in the failure process.
The discrete element method is another method that is often employed in ice fracture calculation. In the 1970s, Condell [9] proposed a calculation method of discrete elements to address the fracture mechanism of discontinuous medium materials. This method has been extensively employed in many research studies. In the study of ice fracture, Korlie [10] investigated the evolution and fracture process of a three-dimensional ice crack under stress and compression and established a set of nonlinear ordinary differential equations to simulate the generation, propagation, and fracture of an ice crack. Jirasek et al. [11,12] discussed the macro fracture characteristics of random particles and proposed an iterative algorithm for solving larger systems. The algorithm applied the inelastic force of an external load instead of a change in stiffness, and it determined the macro average fracture energy of two-dimensional particles and the average size of an effective loading area with the size effect method. Ji et al. [13,14] carried out systematic research on the interaction between sea ice and offshore platform structures that are based on the discrete element model.
However, existing research results need to be further enriched regarding the structural and material characteristics as well as the evolution law of microcracks of river ice based on the microscopic mechanics theory and the numerical simulation method. The response mechanism of the macro-, meso-, and multiscale of river ice also needs be constructed. In this paper, natural river ice in the freezing period of the Yellow River was chosen as a research object, and a calculation model of the river ice fracture was established with the Brazilian disc splitting method. There are several advantages of this method: it is easy to process ice samples, it is not affected by specimen size and material properties, and more tests can be carried out in limited origin ice cubes [15,16]. The disk splitting and fracture of river ice were simulated and analyzed on a micro scale, and the fracture process of an ice disk was simulated under the conditions of different grain sizes and different ice samples. The method can reflect not only the whole process of ice crystal damage but also the influence of ice crystal shape, distribution form, interface transition area, and other micro components on the macro mechanical properties of river ice. The method can effectively avoid the influence of various objective factors—such as sampling, time, region, and environment—and the subjective factors of manual operation in the test process; it can also promote the recognition of the mechanical properties of river ice materials.
2. Ice Sampling Observation and Physical Test of the Yellow River
Natural river ice materials in the Toudaoguai reach of Inner Mongolia during the freezing period of the Yellow River were collected as test objects. According to the field ice crystal test, the obtained ice samples can be approximately divided into granular ice on the surface, columnar ice under the surface, ice flower ice, and columnar ice under the ice flower ice. The ice samples comprised columnar ice under the surface. The ice sample density was approximately 0.95 g/cm3; the sediment content ranged between 1.2% and 2.0%, and the bubble content was 1%. Based on an analysis of the advantages and disadvantages of various test methods [16,17,18,19], the Brazilian disk splitting method was selected as the test method to analyze the ice splitting tensile strength and the fracture toughness of the Yellow River. The test device is shown in Figure 1, R is the radius and H is the distance between the upper and lower loading platforms. The diameter range of the ice samples was from 60 to 100 mm, and the thickness was approximately half of the diameter. The test temperatures range were from −3 to −15 °C. The strain rate was controlled within the range of 10−5 to 10−1 s−1, and the data obtained from the test and the specific analysis results were detailed in the literature [20].
3. Numerical Simulation of River Ice
Based on the data and results of the physical test of Yellow River ice, a calculation model of Yellow River ice was constructed. To perform a comparison with the physical test results, the Brazil disk method was utilized in the numerical simulation of the river ice. The main contents include the ice crystal structure model, constitutive relation and failure criteria, model parameters, etc.
3.1. Crystal Structure Model of Yellow River Ice
The crystal microstructure of Yellow River ice was mainly composed of the ice grain size and distribution, ice crystal boundary, and initial defect at meso level.
According to the experimental results carried out by our research group in the early stage, the column ice of the Yellow River was chosen to be the simulated object. The grain diameters of column ice varied from 3 to 70 mm, among which grains with diameter larger than 30 mm were about 2%. To simulate random and irregular polycrystalline grains, Voronoi polygons were adopted to simulate grains. Based on the ANSYS Parametric Design Language (APDL) of ANSYS software, a numerical model of river ice meso structure was established, and the size and distribution of grains were simulated.
The solid element (Plane 182) was adopted to simulate the grains and the boundary between the grains; the thickness of the grain boundary was considered to be 50–150 µm (approximately 2% of the grain size). In order to control the quality and reliability of the meshes, the line element size was used to control the mesh generation, in which the line was divided into one element when its length was less than 1 mm, and the element size of the line was set to 1 mm when its length was greater than 1 mm. River ice is a crystal composite with defects, and its internal initial defects include bubbles, impurities, and microcracks. Bubbles are the most common defect, and their volume fraction is about 1% to 4% in the Toudaoguai of the Yellow River [21]. It is assumed that the bubble is the initial defect, which is simulated by a damage element. In the model, initial defects are randomly distributed on the boundary between the grains, and the number of bubbles in each damage element is no more than 1. The sketch maps are shown in Figure 2.
3.2. Constitutive Relationship and Failure Criteria
The river ice materials exhibit strong brittleness in the failure process [22]. The microstructure and micro components properties are important influence factors. To analyze the influence of the crystal structure on the mechanical performance of the river ice, the mesoscopic components were considered homogeneous linear elastic material, and the grains and grain boundaries were assumed to be elastic brittle materials and isotropic in the same cross section [21]. The maximum tensile stress criterion was applied in the failure criterion of the grain. A certain range of slides were allowed between the two grains. The range would not exceed the grain boundary. The failure of the grain boundary was considered to be tensile and shear failure. The constitutive relations and failure criteria are shown in Equations (1)–(3). For the element with initial damage, according to the element location, the corresponding failure criteria of the grain and grain boundary are adopted.
where σ is stress, E is elastic modulus, ε is the strain, σt is the tensile strength of the ice material, τb is the shear strength of the ice material, σ1 is the first principal stress of the element, and τmax is the maximum shear stress of the element.
When the element lost its bearing capacity after failure, the material properties of the element were modified, that is to say, the elastic modulus of the element after failure was considered to be the minimum value (10−5 to 10−4 of the original value), and its contribution to the stiffness matrix was disregarded.
3.3. Computational Parameters
In the numerical model of the river ice, two kinds of parameters should be identified: crystal structure parameters and crystal material parameters. The crystal structure parameters mainly include the grain size, grain distribution, grain boundary formation, and initial defects. The crystal material parameters mainly include the elastic modulus, strength, mechanical properties of grain boundary, and other parameters. The main parameters of river ice are shown in Table 1 [21].
4. Simulation Process of Disk Splitting
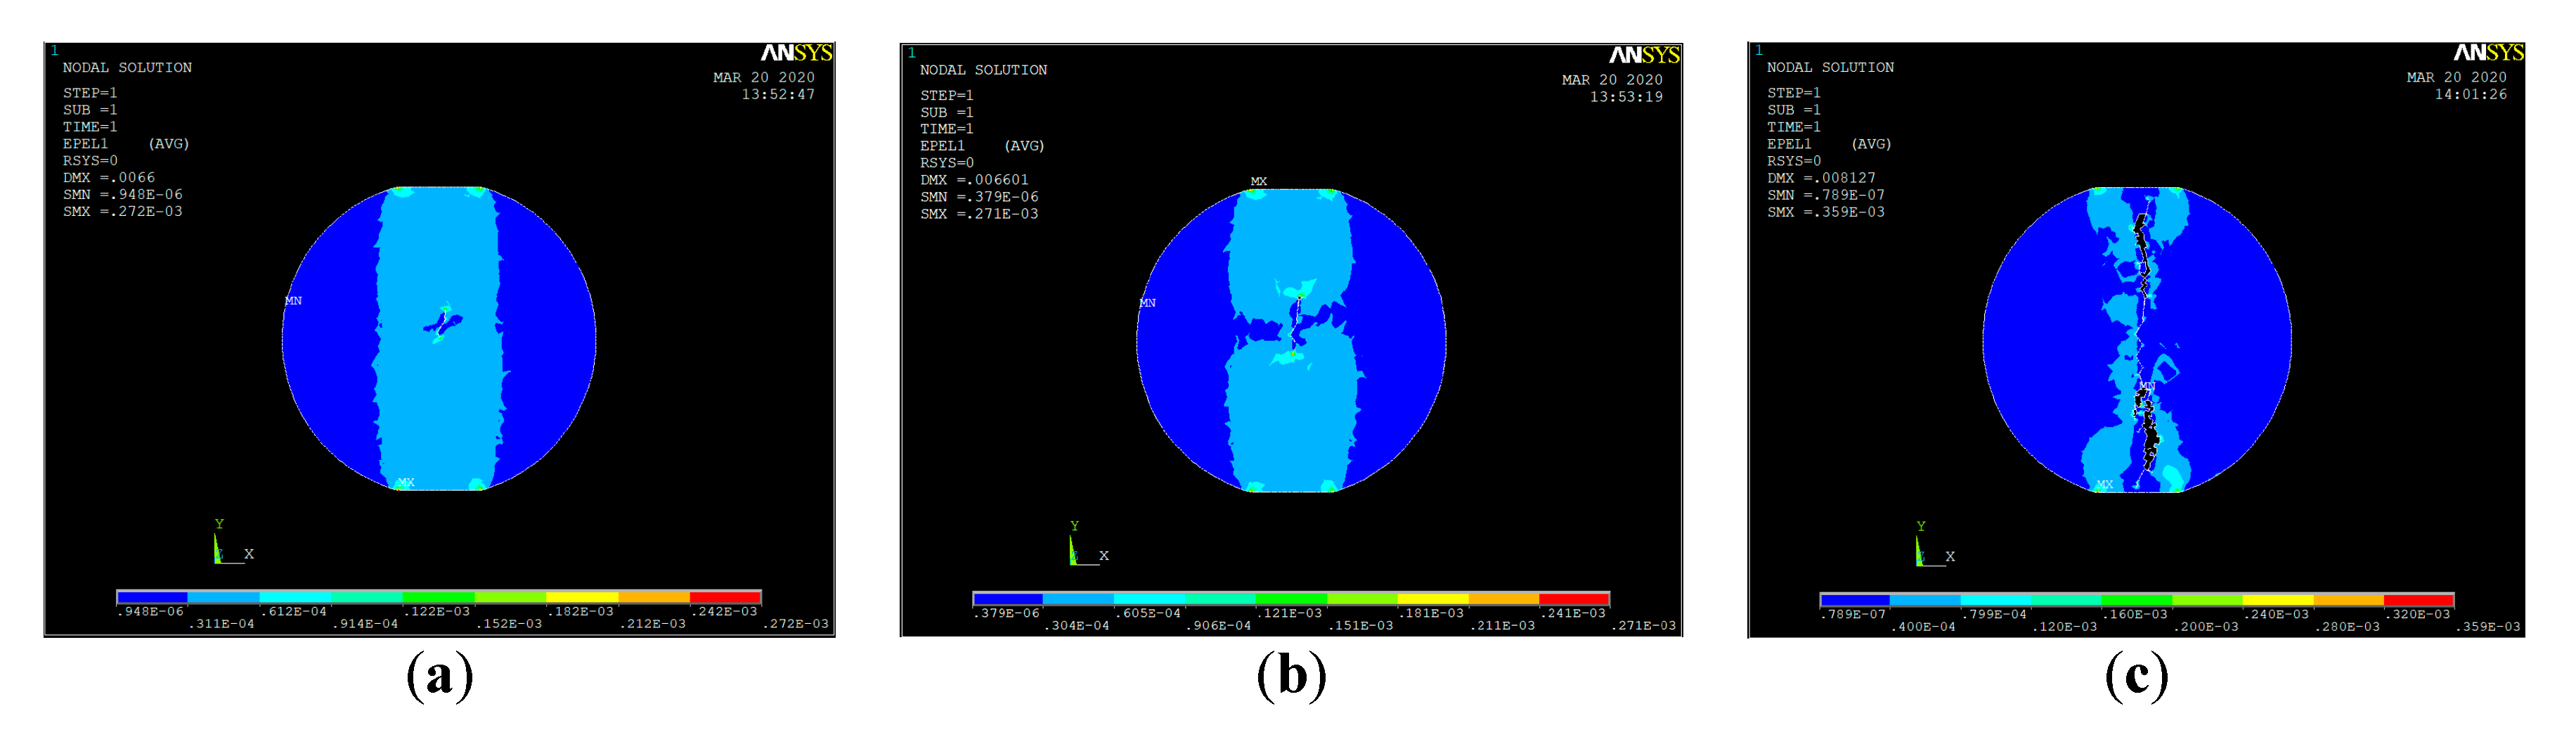
Based on the numerical calculation model of Yellow River ice, the fracture process of the river ice was simulated and analyzed in the splitting tensile load. Displacement loading was adopted. That was, the bottom of specimen was constrained, and the top surface is applied with downward displacement load. Typical failure strain cloud pictures are shown in Figure 3. Figure 3a shows that the initial crack was located on the grain boundary of the grains at the center position of the disk and gradually extended outward along the grain boundary, which was objectively in line with the initiation mode of the disk splitting tensile test. At the same time, the displacement began to occur at the loading position of the disk specimen, and the strain was the largest at the loading interface. With the increase in load, the cracks gradually increased and formed the central main crack that penetrated the ice specimen (Figure 3b). Macro cracks gradually expanded and caused the final failure (Figure 3c).
5. Simulation Results and Discussions
5.1. Simulation Results Analysis
To verify the applicability of the model, the numerical simulation of the Brazil disc test was carried out. Typical failure modes in the numerical calculation are shown in Figure 4. It can be seen from Figure 4a that the initial crack was located at the grain boundary of the grains at the center position of disk and gradually expanded along the grain boundary to penetrate the central main crack of the ice specimen (Figure 4b). This is consistent with the basic principle of Brazilian disc. When the disc platform adopts uniform load and the center angle is greater than 20 degrees, the maximum stress value of the disc center is ensured. The macroscopic fractures gradually extended and caused the ultimate failure of the ice specimen (Figure 4c). The simulated failure form was similar to the failure form of the river ice physical test (Figure 4d).
In order to analyze the fracture properties of Yellow River ice, the fracture toughness was calculated by the simulated peak load according to the method in Reference [20]. The simulation results were compared with the experimental results of the river ice, as shown in Figure 5. The calculated values showed agreement with the experimental values. The average error of both groups of data was approximately 10%.
5.2. Scale Effect of Fracture Toughness
The size effect of fracture toughness of river ice is not obvious at the test scale. Dempsey et al. performed a series of measurements on floating ice sheets of the Spray Lakes Reservoir [23] and discovered that although the fracture toughness of ice was scattered, it increased as the size increased. For the lake ice, the fracture toughness increased from 100 kPam1/2 for the smallest specimens (0.34 m) to 300 kPam1/2 for the largest specimens (28.64 m). From these results, they concluded that the fracture toughness of the ice exhibited a scale effect. However, Schulson et al. suggested that the values obtained offered a measure of resisting crack propagation when a floating ice cover was loaded rather slowly and that the results should not be taken as evidence that the fracture toughness of ice is size-dependent [24].
To further analyze the size effect of fracture toughness, the disk diameters of the model were set to 60, 70, 80, and 100 mm according to the parameters of the river ice physical test, and the platform loaded angle of 2 alpha was set to 30°. The crystal structure models of four different sizes are shown in Figure 6. The size of the four images in Figure 6 is reduced by 1/2. The influence of the specimen size on the fracture toughness is shown in Figure 5. With an increase in specimen size, the fracture toughness did not exhibit any difference. It can be deduced that the scale effect of fracture toughness is not obvious within a certain scale range for Yellow River ice, which is consistent with the physical experiment results. For larger-sized ice samples, the scale effect of fracture toughness needs further analysis.
5.3. Effect of Grain Size on Fracture Toughness
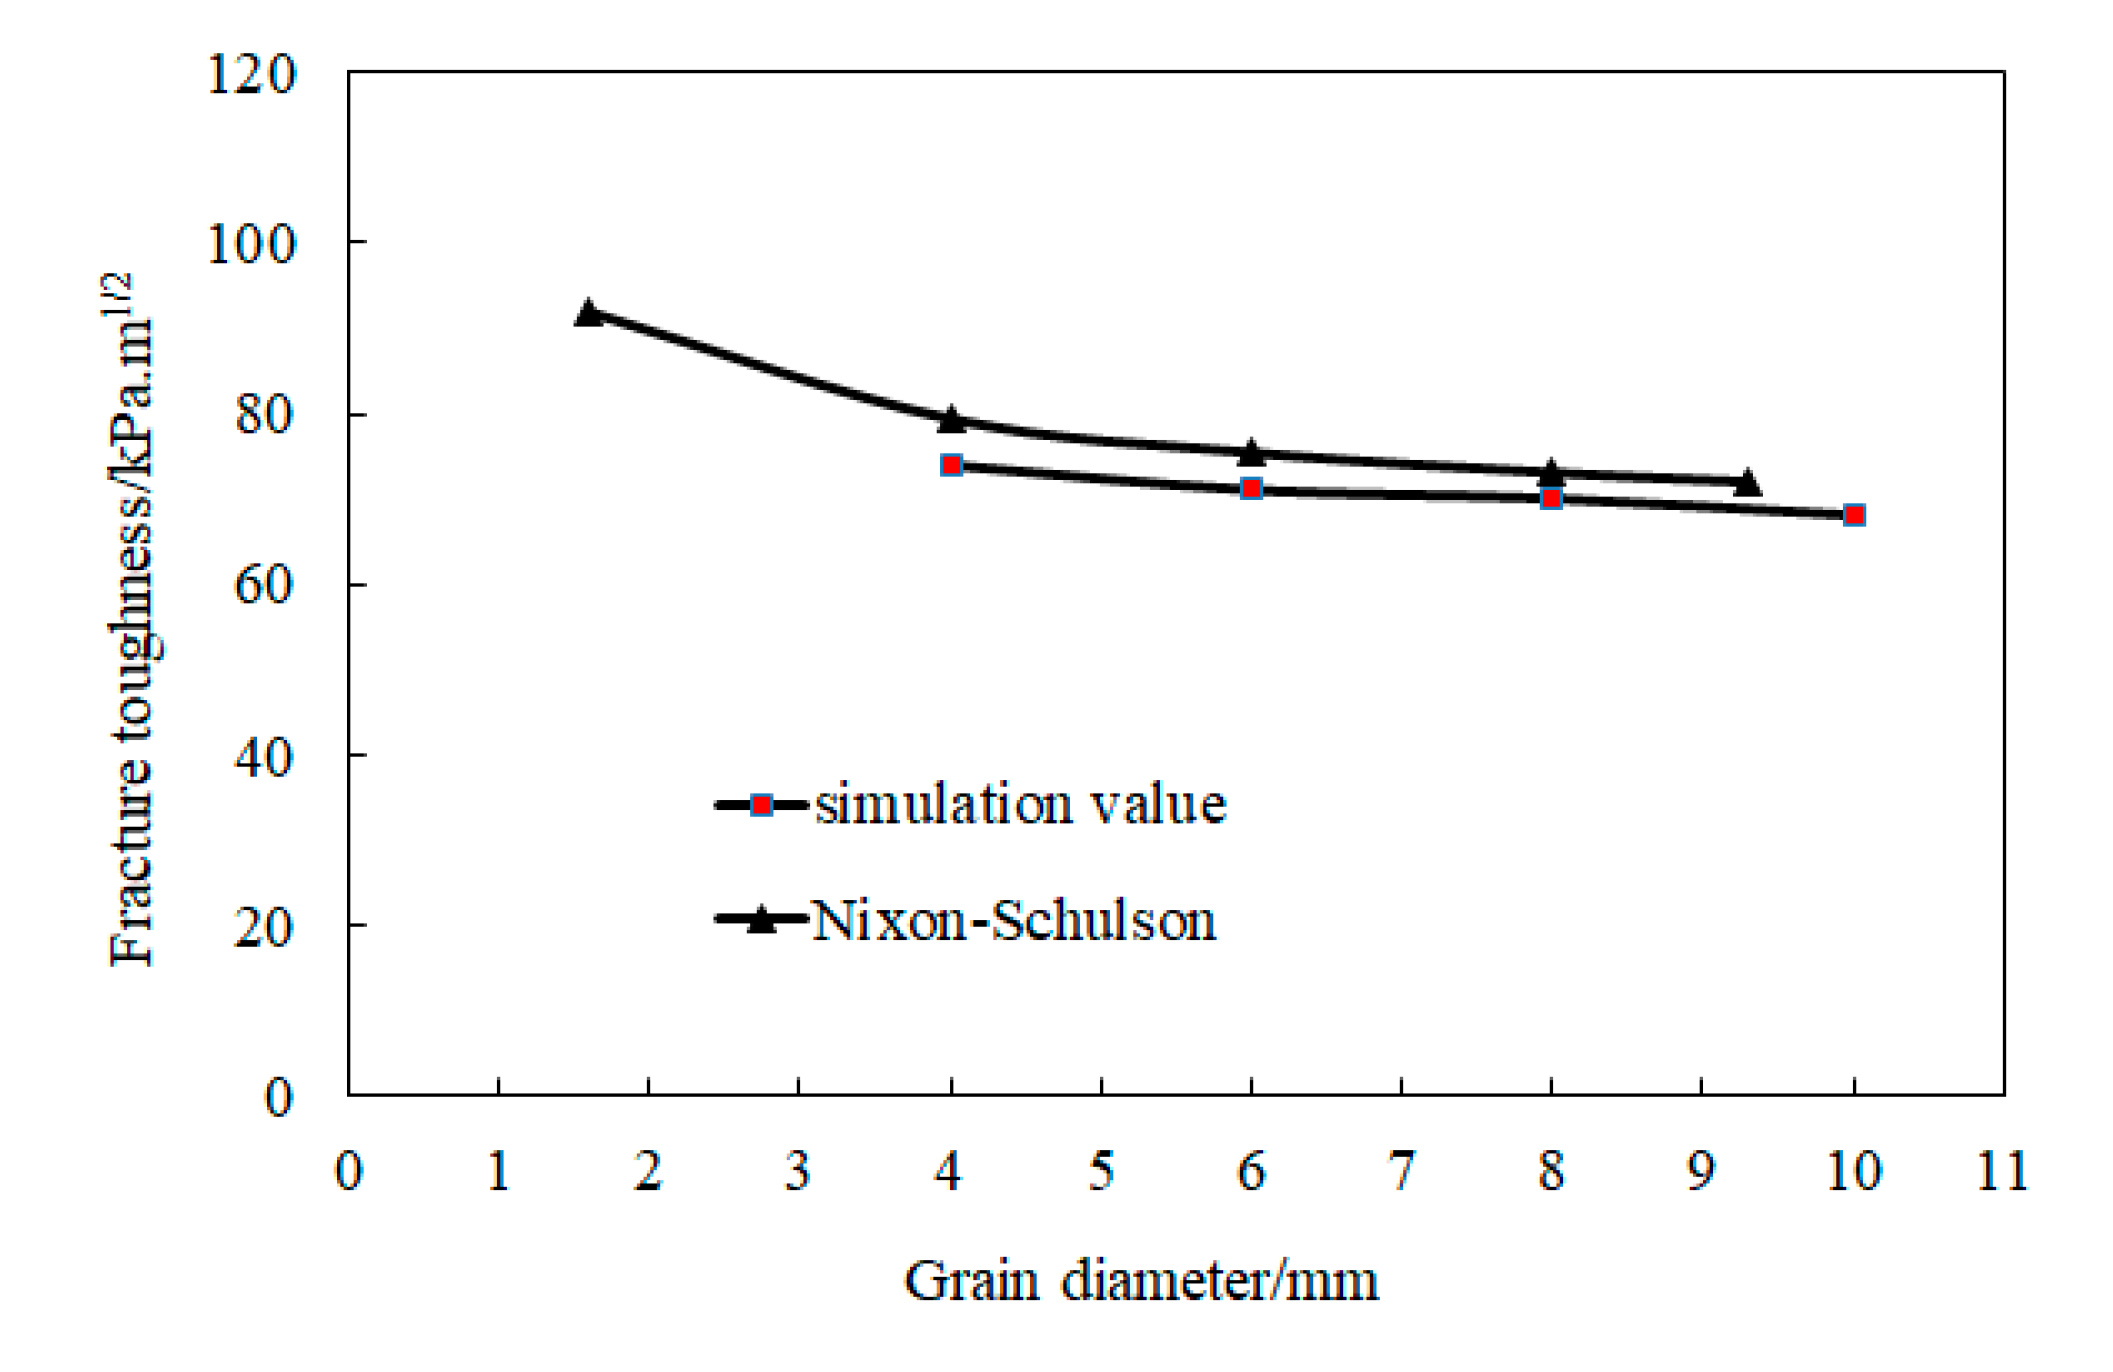
To study the effect of grain size on the fracture toughness of river ice, a finite element model of different grain sizes was established, as shown in Figure 7. The specimen diameter size is 80 mm. The effect of different grain sizes on the fracture toughness of river ice was calculated. Nixon and Schulson reported the fracture toughness of ice for a range of grain sizes. From the results of systematic experiments at −10 °C on bubble-free, granular fresh-water ice that was manufactured in a laboratory, whose grain size was varied from 1.6 to 9.3 mm, they developed the following relationship [25]:
where KIC is fracture toughness, KIO is the material constant, Φ is the size correlation coefficient, d is the grain size in millimeters, KIO = 58.3 kPam1/2, and Φ = 42.4 kPamm1/2.
Although the fracture toughness values of two kinds of ice materials are different due to their material properties, the effects of grain size on the fracture toughness are consistent. It can be seen from Figure 8 that the fracture toughness of ice decreases slightly with an increase in grain size. Thus, it can be speculated that the grain size is an influential factor for the fracture toughness of river ice, but the influence is little.
6. Conclusions
(1) Based on the physical test results for the Yellow River, the Voronoi polygon was used to simulate ice grains, and a meso numerical model of river ice that considers ice crystal grains, ice boundaries, and initial defects was established by secondary development based on ANSYS software. According to an analysis of calculating the result, the model can better simulate the fracture process of the river ice.
(2) The cracked process of the Yellow River ice using Brazilian disc splitting was simulated, and the failure form of the river ice was obtained by a simulation analysis. The disk failure form of river ice was a main crack that penetrates the center of the specimen, which was basically consistent with the physical test results of Yellow River ice, and the mean error between the simulated results of river ice and the test results is within 10%. Grain size and initial defect content are two main factors that affected the outcome of the results.
(3) In addition, the calculation results show that the fracture toughness of river ice increased with an increase in ice sample size on a certain scale. The brittleness of river ice increased with an increase in the ice grain size for the condition of a single ice grain size. The fracture toughness of river ice underwent minimal change with an increase in the ice grain size on a common scale.
Author Contributions
J.W. constructed the mathematical model; J.Z. calculated and calibrated the model parameters; Y.D. and J.W. analyzed the data and wrote the paper; G.V. and P.Z. reviewed and edited this paper. All authors have read and agreed to the published version of the manuscript.
Funding
This research was funded by the National Natural Science Foundation of China (Grant No. 51879116, 51979024), the National Key R&D Program of China (Grant No. 2018YFC1508401), and special funds for basic scientific research of the Yellow River Institute of Hydraulic Research (Grant No. HKY-JBYW-2018-05).
Acknowledgments
We thank Zhijun Li for her contributions to the field work. We are grateful to the anonymous reviewers of this manuscript for their helpful comments.
Conflicts of Interest
The authors declare no conflict of interest.
References
- Pritchard, R.B.; Lough, C.E.; Currie, D.J.; Holme, H.L. Equilibrium reactions of n-butanethiol with some conjugated heterogenous compounds. Can. J. Chem. 1968, 46, 775–781. [Google Scholar] [CrossRef]
- Solomentsev, G.Y.; English, N.J.; Mooney, D.A. Hydrogen bond perturbation in hen egg white lysozyme by external electromagnetic fields: A nonequilibrium molecular dynamics study. J. Chem. Phys. 2010, 235102, 133. [Google Scholar] [CrossRef] [PubMed]
- Kendall, K. Complexities of compression failure. Proc. R. Soc. A Math. Phys. Eng. Sci. Lond. 1978, 361, 245–263. [Google Scholar]
- Zou, B.; Xiao, J.; Jordaan, I.J. Ice fracture and spalling in ice structure interaction. Cold Reg. Sci. Technol. 1996, 24, 213–220. [Google Scholar] [CrossRef]
- Evans, A.G.; Palmer, A.C.; Goodman, D.J.; Ashby, M.F.; Hutchinson, J.W.; Ponter, A.R.S.; Williams, G.J. Indentation spalling of edge loaded ice sheets. In Proceedings of the 7th IAHR Ice Symposium 1984, Hamburg, Germany, 17 July 2017; pp. 113–121. [Google Scholar]
- Xiao, J.; Jordaan, I. Modeling of fracture and production of discrete ice pieces. In Report for Canada Oil and Gas Land Administration; Lan Jordaan and Associates Inc.: St. John’s, NL, Canada, 1991. [Google Scholar]
- Xiao, J.; Jordaan, I.J. Application of damage mechanics to ice failure in compression. Cold Reg. Sci. Technol. 1996, 24, 305–322. [Google Scholar] [CrossRef]
- Han, L.; Li, F.; Yue, Q.J. Simulation of the whole failure process by fem during ice-conical structures interaction. China Offshore Platf. 2007, 22, 22–27. [Google Scholar]
- Cundall, P.A. A computer model for simulating progressive large-scale movements in block rock systems. In Proceedings of the International Symposium on Rock Mechanics, Nancy, France, 4–6 October 1971; Volume 1, pp. 8–11. [Google Scholar]
- Korlie, M.S. 3D simulation of cracks and fractures in a molecular solid under stress and compression. Comput. Math. Appl. 2007, 54, 638–650. [Google Scholar] [CrossRef]
- Jirasek, M.; Bazant, Z.P. Macroscopic fracture characteristics of random particle systems. J. Eng. Mech. 1995, 69, 201–228. [Google Scholar] [CrossRef]
- Jirasek, M.; Bazant, Z.P. Particle model for quasibrittle fracture and application to sea ice. J. Eng. Mech. 1995, 121, 1016–1025. [Google Scholar] [CrossRef] [Green Version]
- Ji, S.; Wang, A.; Li, B.; Liu, Y.; Li, H. Modified discrete element model for sea ice dynamics and its applications in the Bohai Sea. Acta Oceanol. Sin. 2015, 37, 54–67. [Google Scholar] [CrossRef]
- Ji, S.Y.; Sun, S.; Yan, Y. Discrete element modeling of rock materials with dilated polyhedral elements. Procedia Eng. 2015, 102, 1793–1802. [Google Scholar] [CrossRef] [Green Version]
- You, M.; Su, C. Split test of flattened rock disk and related theory. Chin. J. Rock Mech. Eng. 2004, 23, 170–174. [Google Scholar]
- Ministry of Water Conservancy of China. Specification for Rock Test of Water Resources and Hydropower Development: SL264-2001; China Water Power Press: Beijing, China, 2001; pp. 32–33.
- Wang, Z.Q.; Dai, F.; Jia, X.M. Reply to the Paper’ Split test of flattened rock disc and related theory. Chin. J. Rock Mech. Eng. 2004, 23, 175–178. [Google Scholar]
- You, M.Q.; Su, C.D. Experimental study on split test with flattened disk and tensile strength of rock. Chin. J. Rock Mech. Eng. 2004, 23, 3106–3112. [Google Scholar]
- Xu, G.; Chen, F.; Xiao, J.Q. Influence of load contact condition on rock tensile strength. Chin. J. Rock Mech. Eng. 2006, 25, 168–173. [Google Scholar]
- Gao, G.M.; Yu, D.; Li, S.X. Research on splitting performance of river ice of Yellow River in the freezing period. Yellow River 2018, 40, 28–30. [Google Scholar]
- Yu, D.; Juan, W.; Zan, X. The selection of microscopic parameters in building fracture microscopic model of river ice. Yellow River 2017, 10, 27–31. [Google Scholar]
- Arakawa, M.; Maeno, N. Mechanical strength of polycrystalline ice under uniaxial compression. Cold Reg. Sci. Technol. 1997, 26, 215–229. [Google Scholar] [CrossRef]
- Dempsey, J.P.; DeFranco, S.J.; Adamson, R.M.; Mulmule, S.V. Scale effects on the in-situ tensile strength and fracture of ice Part I: Large grained freshwater ice at Spray Lakes Reservoir, Alberta. Int. J. Fract. 1999, 95, 325–345. [Google Scholar] [CrossRef]
- Schulson, E.M.; Duval, P. Fracture Toughness of Ice. Creep and Fracture of Ice; Cambridge University Press: Cambridge, UK, 2009; pp. 190–211. [Google Scholar]
- Nixon, W.A.; Schulson, E.M. Fracture toughness of ice over a range of grain sizes. J. Offshore Mech. Arct. Eng. 1988, 110, 192–196. [Google Scholar] [CrossRef]
Figure 1.
Schematic of Brazilian disc splitting test device. (a) The schematic of a sample specimen test. (b) The physical test device of Yellow River ice.
Figure 1.
Schematic of Brazilian disc splitting test device. (a) The schematic of a sample specimen test. (b) The physical test device of Yellow River ice.
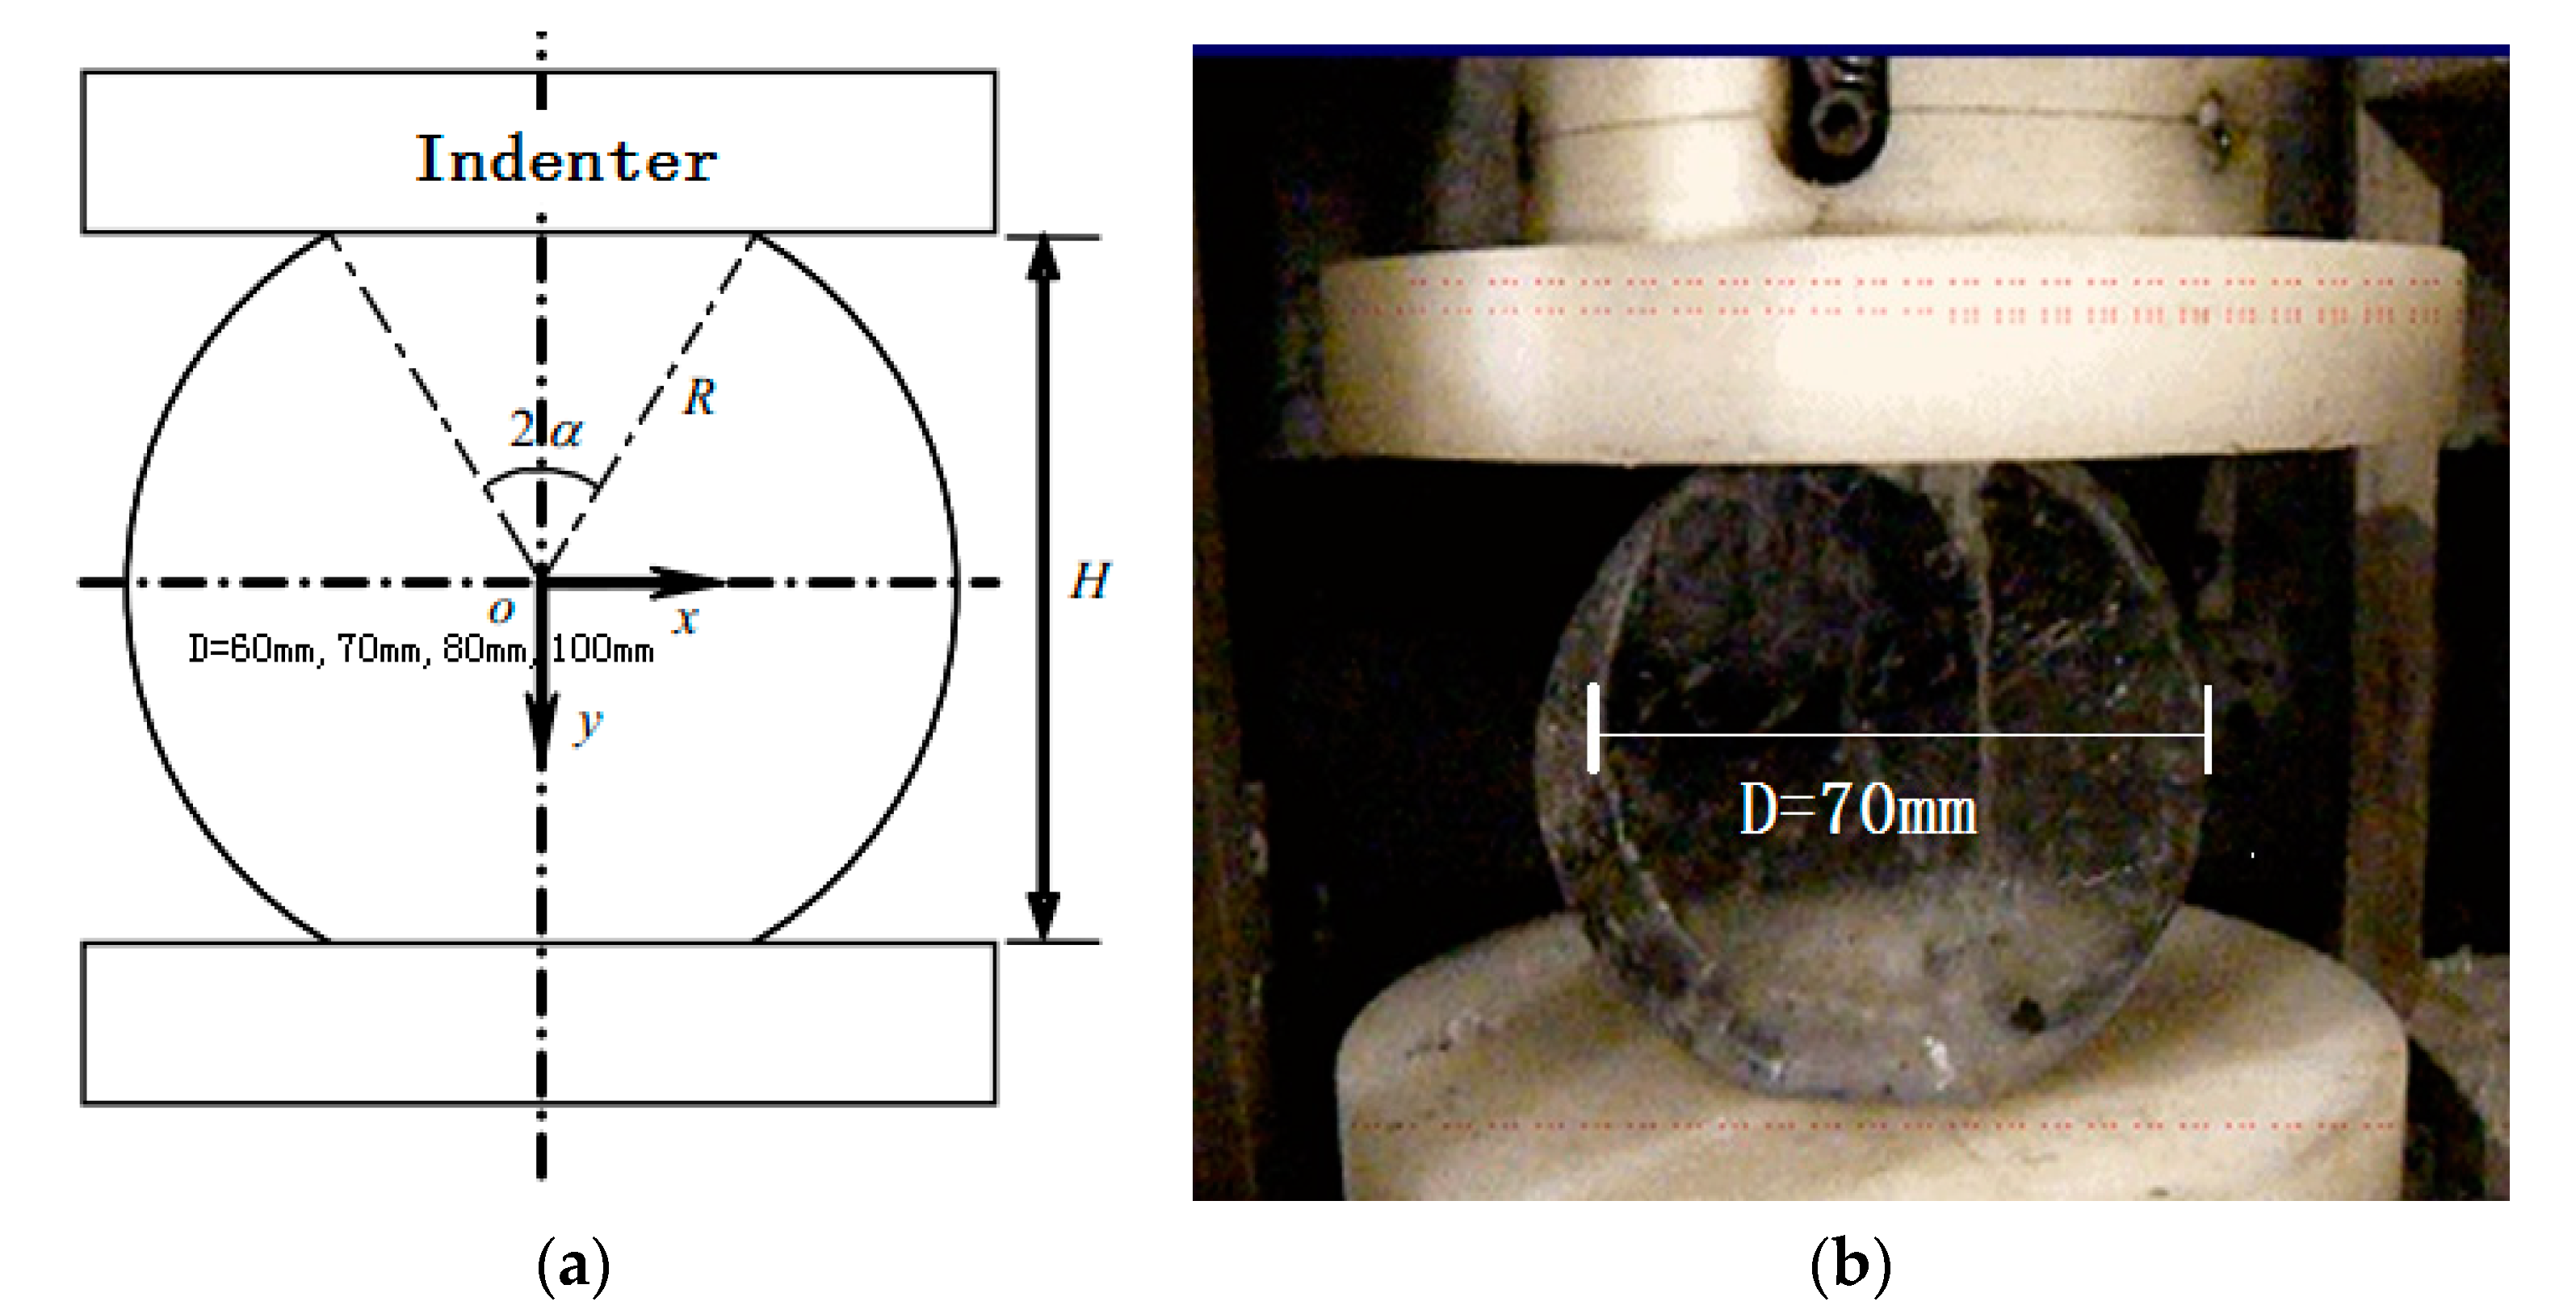
Figure 2.
Finite element model of the river ice crystal structure: (a) typical sample diagram of the ice crystal structure of Yellow River; (b) structure diagram of the numerical model of the Brazil disk specimen; (c) initial defects inside the disk; and (d) sketch map of the whole model.
Figure 2.
Finite element model of the river ice crystal structure: (a) typical sample diagram of the ice crystal structure of Yellow River; (b) structure diagram of the numerical model of the Brazil disk specimen; (c) initial defects inside the disk; and (d) sketch map of the whole model.

Figure 3.
Strain cloud picture of the disk splitting process of Yellow River ice: (a) initial crack, (b) macro main crack development, (c) final failure shape.
Figure 3.
Strain cloud picture of the disk splitting process of Yellow River ice: (a) initial crack, (b) macro main crack development, (c) final failure shape.

Figure 4.
Crack failure process of river ice by numerical simulation: (a) local amplification of initiation crack; (b) cracking appears; (c) final failure mode; (d) failure form of physical test.
Figure 4.
Crack failure process of river ice by numerical simulation: (a) local amplification of initiation crack; (b) cracking appears; (c) final failure mode; (d) failure form of physical test.
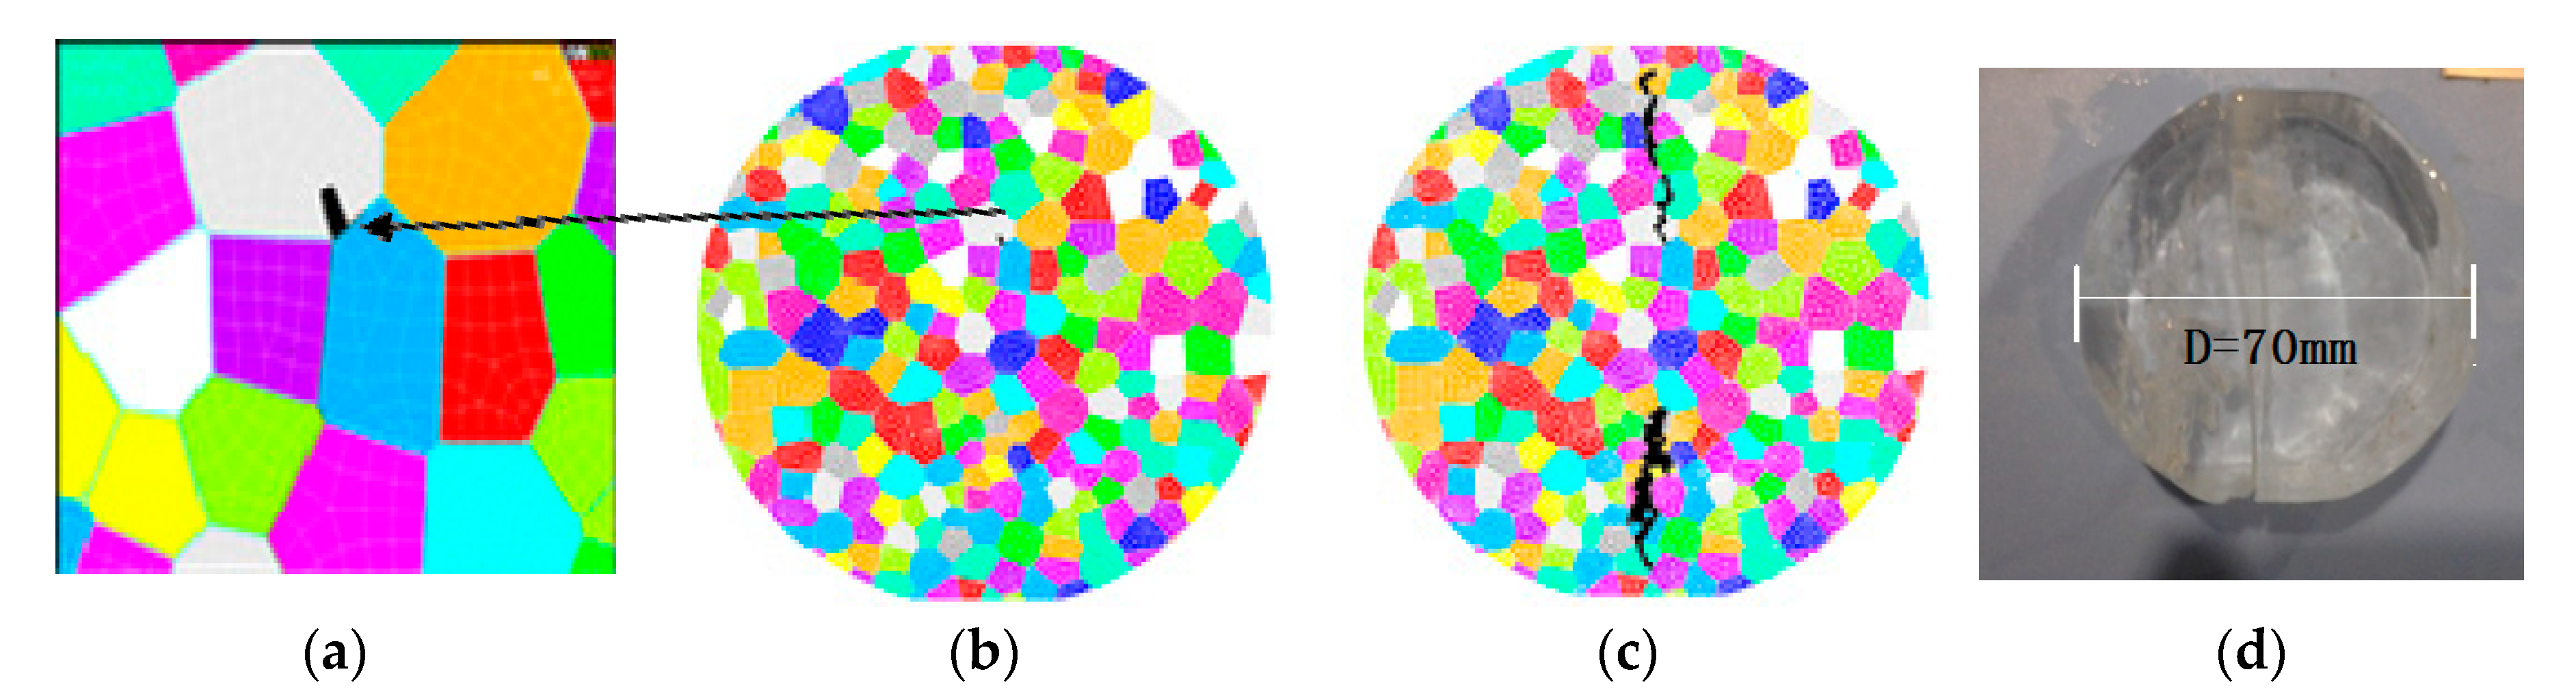
Figure 5.
Contrast diagram of simulated values and experimental values.

Figure 6.
Crystal structure models of river ice with different sizes: (a) Specimen diameter is 60 mm; (b) Specimen diameter is 70 mm; (c) Specimen diameter is 80 mm; and (d) Specimen diameter is 100 mm.
Figure 6.
Crystal structure models of river ice with different sizes: (a) Specimen diameter is 60 mm; (b) Specimen diameter is 70 mm; (c) Specimen diameter is 80 mm; and (d) Specimen diameter is 100 mm.

Figure 7.
Crystal structure models of river ice with different grain sizes: (a) grain diameter d = 4 mm; (b) grain diameter d = 6 mm; (c) grain diameter d = 8 mm; and (d) grain diameter d = 10 mm.
Figure 7.
Crystal structure models of river ice with different grain sizes: (a) grain diameter d = 4 mm; (b) grain diameter d = 6 mm; (c) grain diameter d = 8 mm; and (d) grain diameter d = 10 mm.

Figure 8.
Contrast diagram of simulated values and literature values of fracture toughness for different grain sizes.
Figure 8.
Contrast diagram of simulated values and literature values of fracture toughness for different grain sizes.

Table 1.
Main parameter values of river ice in the numerical calculation.
| Temperature (°C) | Strain Rate (s−1) | Elastic Modulus of Grain (GPa) | Strength of Grain (MPa) | Poisson’s Ratio of Grain | Elastic Modulus of Crystal Boundary (GPa) | Strength of Crystal Boundary (MPa) | Initial Defect Content (%) | Grain Size (mm) |
|---|---|---|---|---|---|---|---|---|
| −10 | 10−5–10−6 | 9 | 1 | 0.3 | 5 | 0.5 | 6 | 2–10 |
© 2020 by the authors. Licensee MDPI, Basel, Switzerland. This article is an open access article distributed under the terms and conditions of the Creative Commons Attribution (CC BY) license (http://creativecommons.org/licenses/by/4.0/).
Share and Cite
MDPI and ACS Style
Wang, J.; Zhou, J.; Deng, Y.; Vadim, G.; Zhang, P. Numerical Simulation of Ice Fractures Process of the Yellow River Based on Disk Specimen. Crystals 2020, 10, 598. https://doi.org/10.3390/cryst10070598
AMA Style
Wang J, Zhou J, Deng Y, Vadim G, Zhang P. Numerical Simulation of Ice Fractures Process of the Yellow River Based on Disk Specimen. Crystals. 2020; 10(7):598. https://doi.org/10.3390/cryst10070598
Chicago/Turabian StyleWang, Juan, Jiao Zhou, Yu Deng, Goncharov Vadim, and Peng Zhang. 2020. "Numerical Simulation of Ice Fractures Process of the Yellow River Based on Disk Specimen" Crystals 10, no. 7: 598. https://doi.org/10.3390/cryst10070598
Note that from the first issue of 2016, this journal uses article numbers instead of page numbers. See further details here.