1. Introduction
Calcium phosphates constitute a diverse family of materials that find widespread use in a variety of fields, including as medicine for bone regeneration, catalysis, sensor technology, and as foundational matrices for the development of optical materials. In the study of these materials’ optical properties, special emphasis is placed on examining the luminescent characteristics of doped phosphates. These luminescent properties are pivotal in the creation of white light sources, which are achieved by coating blue near-ultraviolet-emitting LED chips with phosphors [
1]. Furthermore, the enduring phosphorescence and thermoluminescence exhibited by phosphates hold promise for a range of applications across the energy sector, lighting, and optical visualization in the red and infrared spectral ranges [
2].
To advance the applications mentioned above, numerous studies have been conducted on the luminescent properties of phosphates. For instance, the research conducted by authors [
3] demonstrated the luminescent characteristics of
activated by
following irradiation with synchrotron radiation. It was revealed that
ions are formed in the excited state as a result of charge transfer from the matrix to the impurities
. The charge transfer from
to
requires an energy of 4.6 eV. During the relaxation process from the excited state back to the ground state, recombination emission occurs at 2.9 eV, corresponding to the
transition. Additionally, the energy gap from the excited electronic state of
to the bottom of the conduction band is estimated to be 0.4 eV.
The nature of impurity emission centers in phosphates activated by
ions was the focus of investigations by the authors of [
3,
4]. In
, it was discovered that broad emission bands at 2.17 eV, 2.08 eV, and 2.14 eV are excited by several bands at 2.48 eV, 3.1 eV, 2.95 eV, and 3.44–3.65 eV. According to the hypothesis presented by the authors in [
4], these excitation spectra are indicative of forbidden intra-center transitions of
ions situated at the cationic sites of the crystal lattice. Further, authors in [
3] identified that emission at 1.93 eV, which is not only excited by intracenter bands but also efficiently by UV emission at 5.9 eV, can be attributed to charge transfer from the matrix,
, to the
impurities
. Additionally, the observation of thermoluminescence at 240 K and between 400 and 477 K, along with phosphorescence, is linked to the creation of trap centers during X-ray excitation.
The formation of electron–hole-trapping centers in phosphates was observed during photon irradiation, with energies surpassing the band gap, leading to the creation of free electron–hole pairs. In the research conducted by authors [
5], thermoluminescence (TL) was studied in
doped with
and
(where
represents
). During the irradiation of
,
electron-trapping centers are formed by the trapping of free electrons. Simultaneously, the trapping of holes by the
ground state leads to the formation of
hole trapping centers. TL is observed because of the recombination decay of these electron–hole–trapping centers.
Phosphors doped with
impurities are utilized as sources of green radiation, which is instrumental in exciting hole-trapping centers, thereby generating stable red and infrared radiation. The photoluminescence, radioluminescence, and phosphorescence properties of these phosphors, when doped with rare earth ions, have been extensively studied by the authors in references [
6,
7,
8,
9,
10,
11,
12,
13,
14,
15,
16].
In reviews and summary articles [
17,
18,
19], the optical properties of non-rare-earth ions
and
have been investigated by the authors. Their properties were compared with the known properties of
light-emitting diodes, which emit red light in various materials. It has been demonstrated that from an economic standpoint,
ions, not being rare-earth ions, surpass
ions in terms of red-light intensity. The main comparative properties of
and
ions in various host materials have been considered. Spectral differences in emission between
and
activator ions have been demonstrated, which can provide green and orange-red emissions depending on their practical application.
In the studies by authors [
20,
21], the mechanisms for the accumulation of intrinsic and impurity electron–hole-trapping centers were explored in both pure and
-activated
. It was demonstrated that intrinsic
and impurity
trapping centers form as a result of free electrons localizing on the
anion and
impurities, through the reactions
and
.
From a brief review of the literature, several conclusions can be drawn: During the irradiation of excited anion complexes, impurity electron-trapping centers form below the conduction band; when free electrons and holes localize on rare-earth ions, electron- and hole-trapping centers are generated, whose recombination leads to thermoluminescence (TL) and phosphorescence.
This work will discuss the mechanisms of the formation of electron- and hole-trapping centers upon the excitation of the phosphor across a broad spectral (from 4 eV to 12 eV) and temperature range (15–300 K). By analyzing the excitation spectra of impurity emission from and the newly created recombination or tunneling emissions comprising electron–hole trapping centers, the study investigates the relaxation processes that facilitate energy transfer to impurities.
3. Experimental Results
In order to determine the nature of intrinsic, impurity, and recombination emissions at trapping centers in and phosphors, excitation, and emission spectra were studied upon excitation by ultraviolet and X-ray radiation over a wide temperature range from 15 K to 300 K.
The crystallinity and purity of the synthesized powders were assessed using X-ray diffraction analysis. The X-ray diffraction pattern of the
sample doped with
, after annealing at 1200 °C, is depicted in
Figure 1. The diffraction peaks closely match the standard pattern for α-
(PDF #073-0440), confirming the successful formation of the target material. A minor presence of the adjacent phase, α-
, was also observed, likely resulting from the evaporation of phosphate particles during the process.
The morphological characteristics of the synthesized powders were examined through scanning electron microscopy (SEM). Representative SEM images of the Mn-doped
sample, displayed in
Figure 2, reveal that the powders are composed of a mix of plate-like and irregularly shaped particles. Notably, the plate-like particles exhibit grains ranging in size from micrometers to sub-micrometers.
In
Figure 3, the emission spectra of the
phosphor, upon irradiation with 6.2 eV photons at 300 K, is depicted as curve 1. Additionally, the emission spectra measured at 77 K in a cryostat, following excitation with 6.2 eV (200 nm) photons, are shown as curve 2. The analysis of
Figure 3 reveals that at 300 K, there is an intracenter emission band at 2.06 eV (602 nm), attributed to the
ion within the phosphor (curve 1), alongside the emergence of new emission bands at 3.06 eV (405 nm) and 2.92 eV (425 nm) (curve 1). Notably, at 77 K, the
emission band markedly diminishes, whereas the intensity of the newly observed emission bands at 3.06 eV (405 nm) and 2.92 eV (405 nm) experiences a 1.5-fold increase.
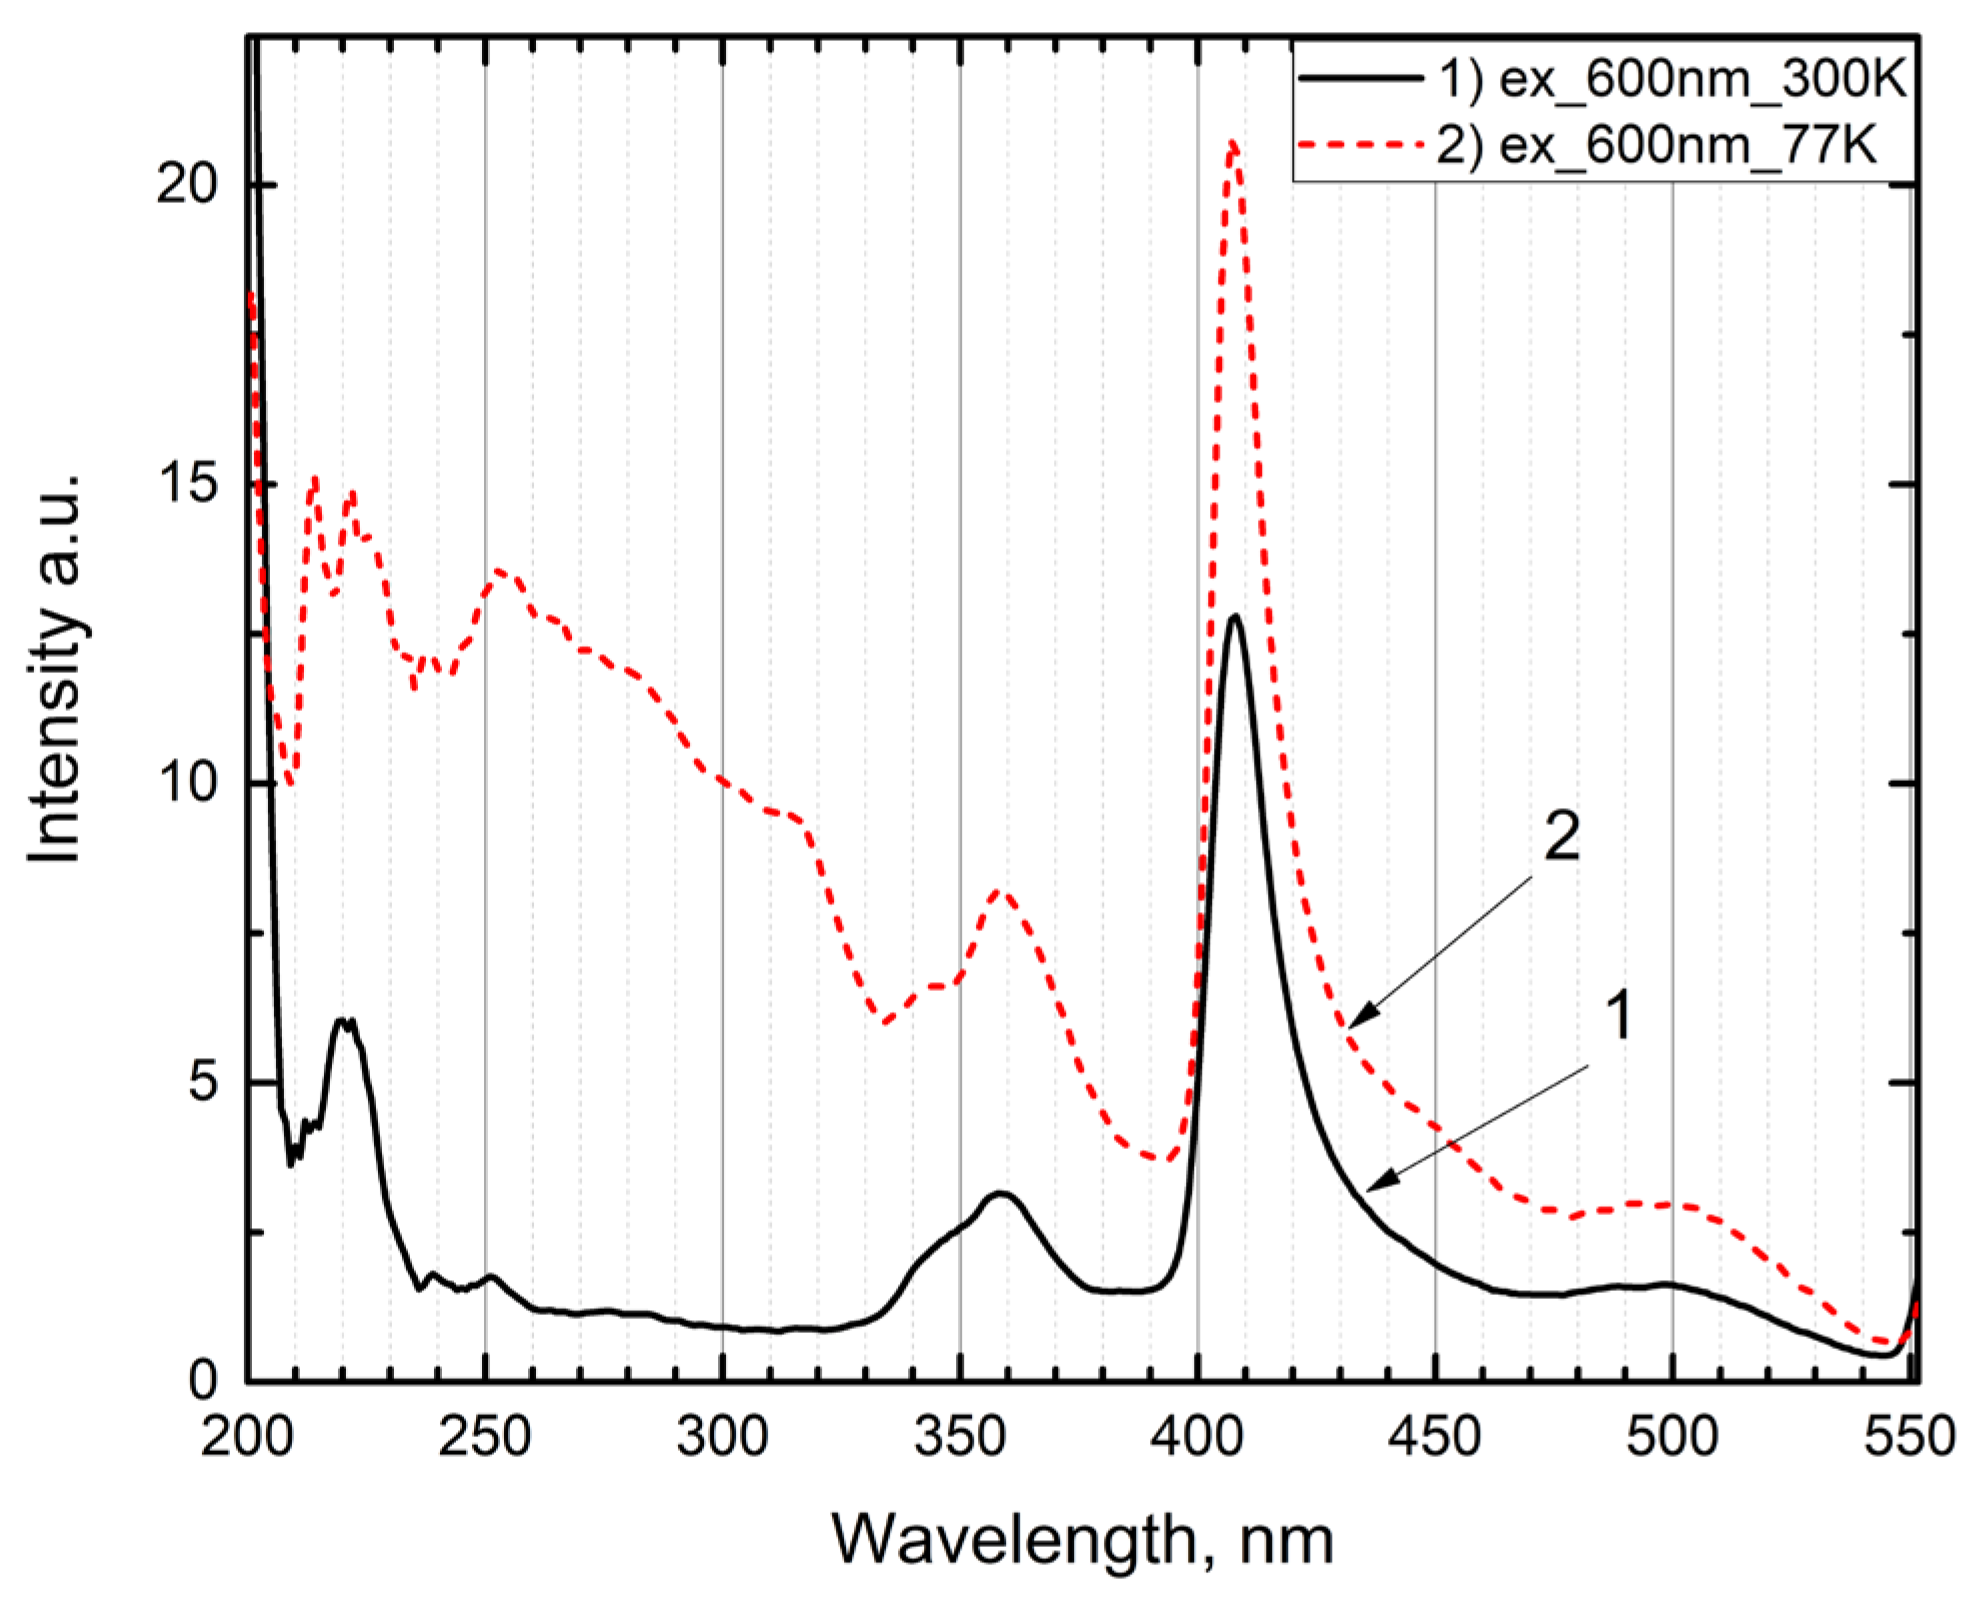
In
Figure 4, the excitation spectrum for the main intracenter emission of
at 2.06 eV (602 nm), 300 K (curve 1), and 77 K (curve 2) is presented. The analysis of the graph indicates that at 77 K, the emission band is excited at discrete energies of approximately 2.5 eV (496 nm), 3.0 eV (413 nm), 3.5 eV (354 nm), 4.0 eV (310 nm), 4.5 eV (275 nm), and within the range of 6.2 to 5.0 eV. Conversely, at 300 K, these emission bands also occur but exhibit lower intensity, particularly within the narrower range of 4.0 eV (310 nm) to 4.5 eV (275 nm).
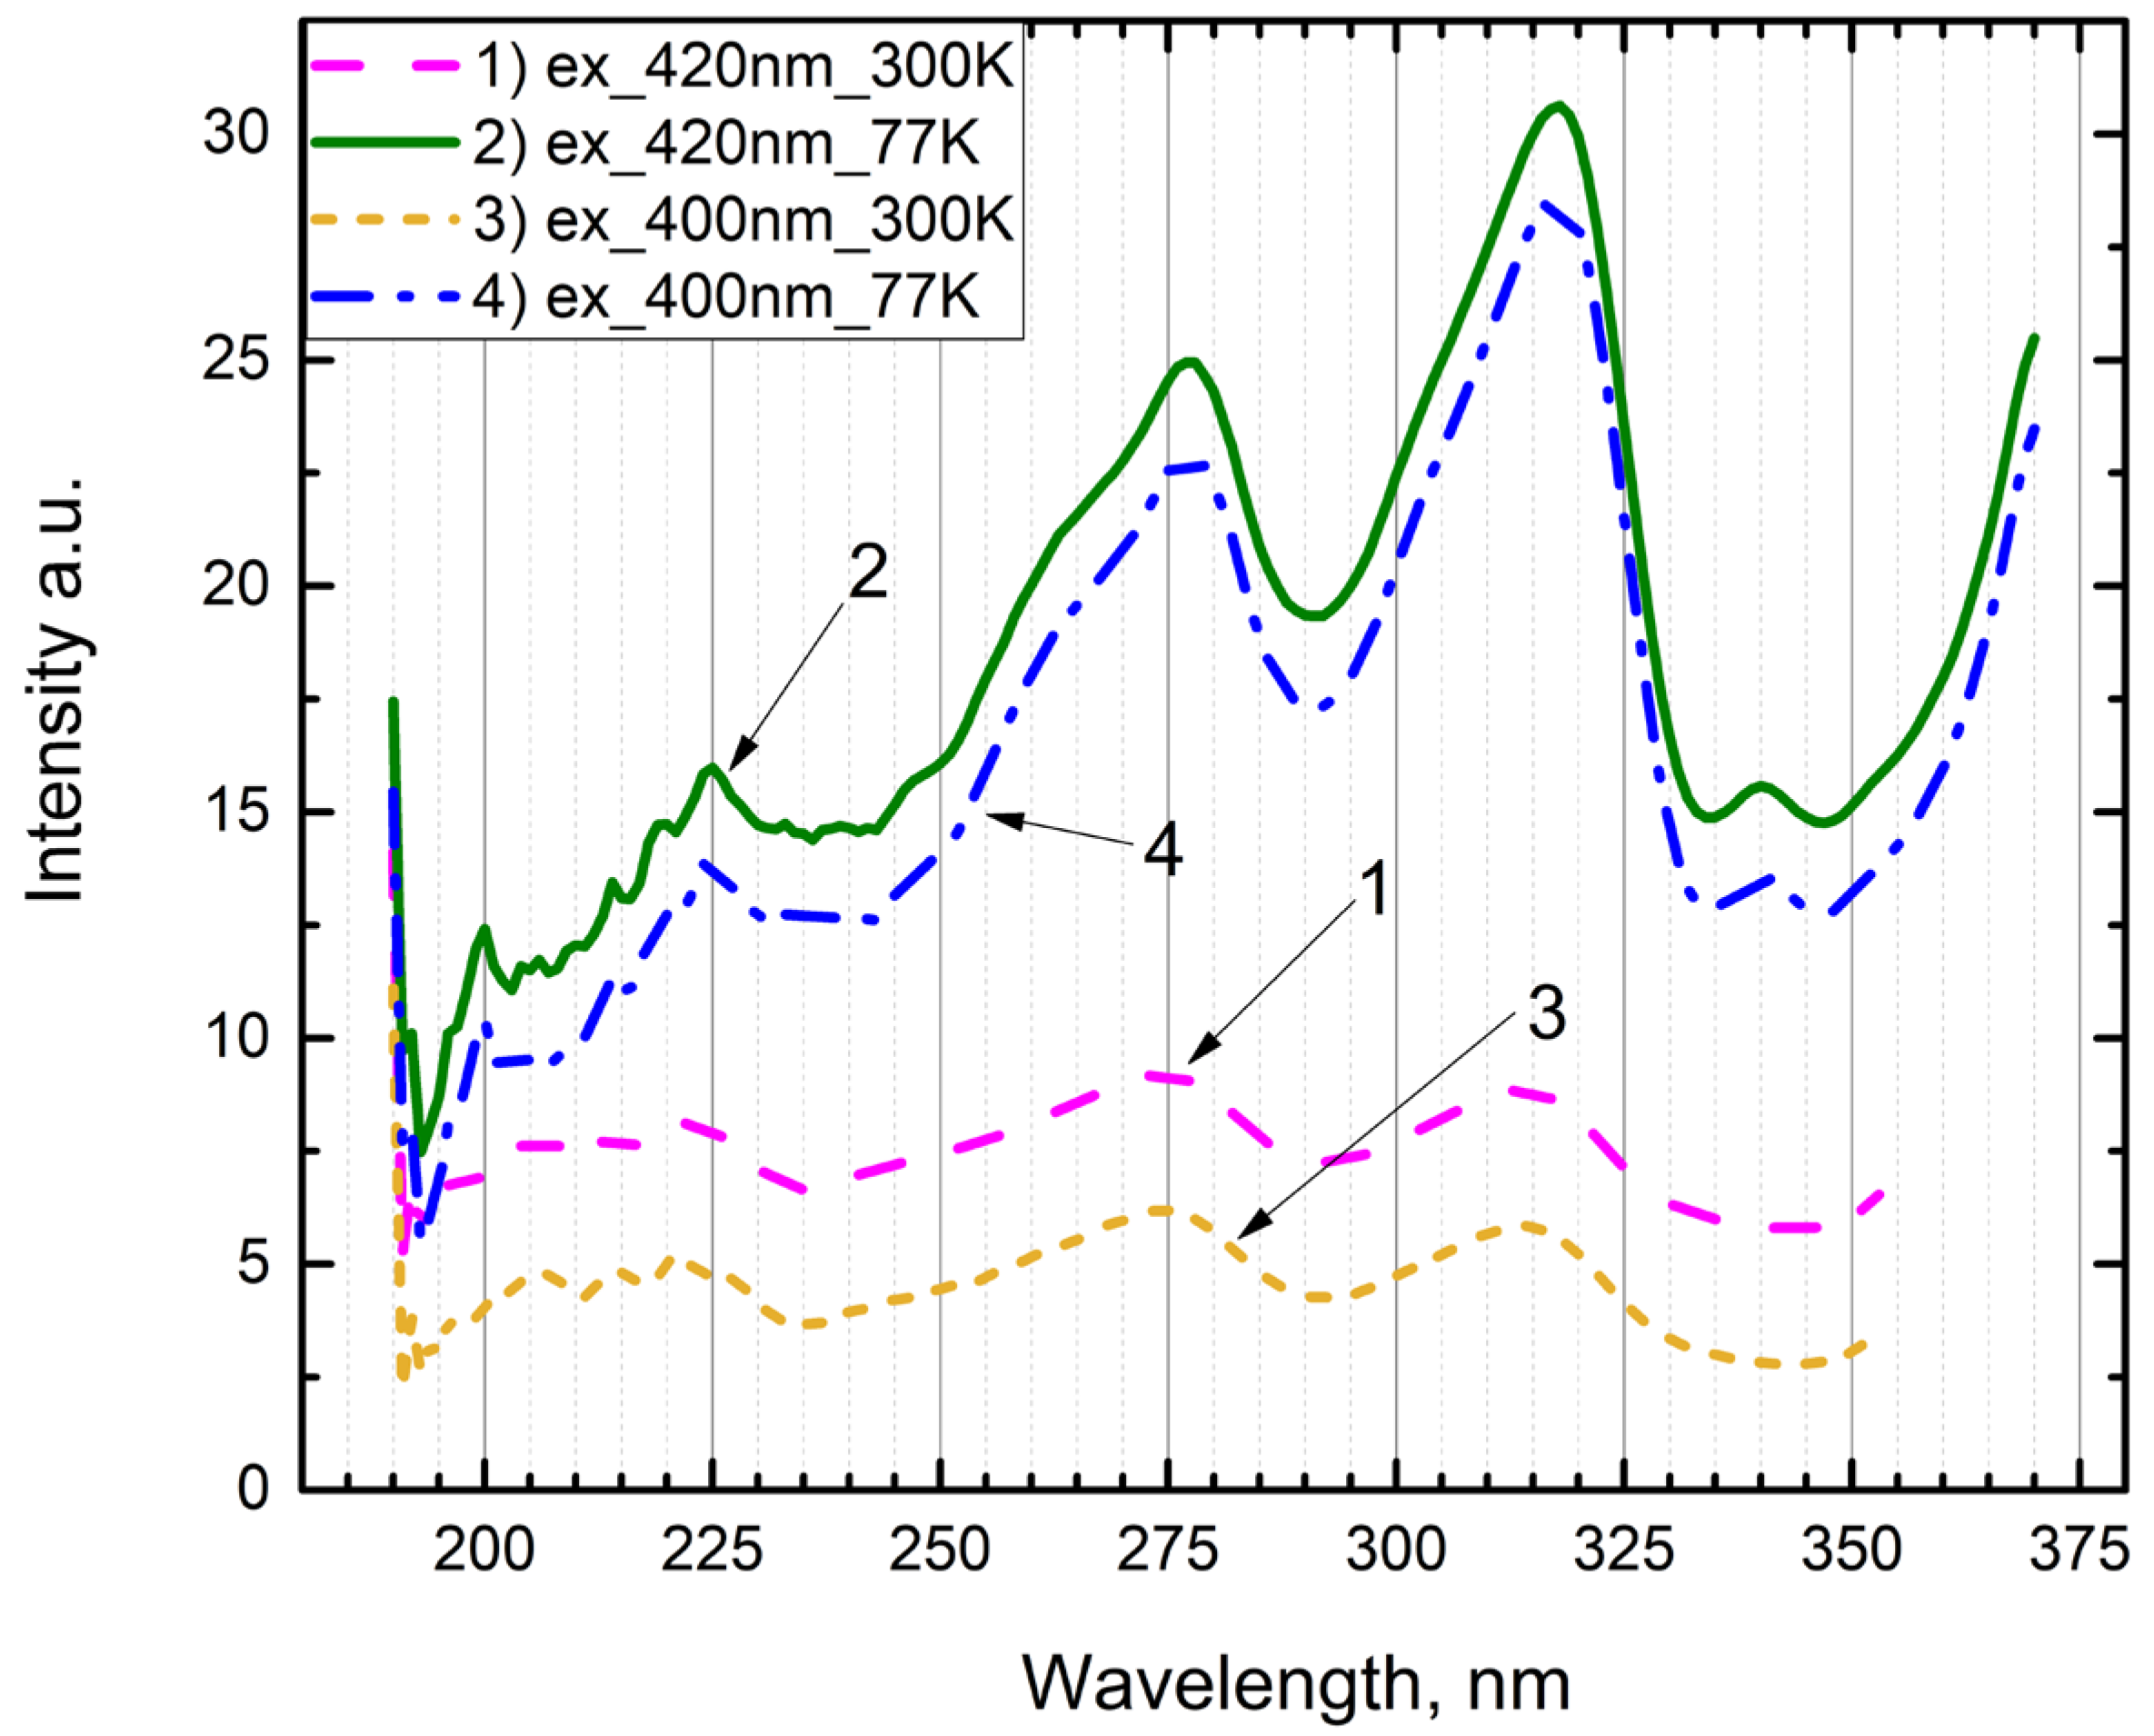
In
Figure 5, the excitation spectra for the newly identified bands at 3.06 eV (405 nm) and 2.92 eV (425 nm), following pre-irradiation of the phosphor at 6.2 eV (200 nm), are displayed at both 300 K and 77 K. Excitation bands are identified within the ranges of 3.94–4.0 eV (310–314 nm), 4.5–4.6 eV (269–275 nm), and broadly from 6.2 eV (200 nm) to 5.5 eV (225 nm). Notably, these bands are prominently observed at 77 K, indicating a stronger response to excitation at this lower temperature. Conversely, at 300 K, these same bands manifest as weak excitation bands, suggesting a diminished excitation efficiency at higher temperatures.
When measuring the excitation spectra for the intracenter emission of the
ion at 2.06 eV (602 nm), emission bands similar to those identified by authors in [
2] were observed at 2.5 eV (496 nm), 3.1 eV (400 nm), 3.0 eV (413 nm), and between 3.5 eV (354 nm) and 3.6 eV (344 nm). Additionally, alongside the main intracenter emission at 2.06 eV (602 nm) for
, the excitation spectrum revealed bands for the newly identified emissions at 3.06 eV (405 nm) and 2.92 eV (419 nm), specifically within the ranges of 3.94–4.0 eV (310–314 nm) and 4.5–4.6 eV (269–275 nm). Furthermore, excitation bands at 5.0 eV (248 nm) and 5.64 eV (220 nm) were also detected. Consequently, these newly emerged emission bands are excited by photon energies of 3.94–4.0 eV (310–314 nm), 4.5–4.6 eV (269–275 nm), 5.0 eV (248 nm), and 5.64 eV (220 nm).
Similar experiments were carried out using pure
phosphor. The emission spectrum of this phosphor, when irradiated with photons at energies of 6.2 eV (200 nm) (curves 1 and 2) and 5.64 eV (220 nm) (curves 3 and 4) at temperatures of 77 K and 300 K, is depicted in
Figure 6. It is observed that emission bands at 2.92 eV (425 nm) and 3.06 eV (344 nm) appear at both 77 K and 300 K, mirroring those in the
phosphor.
Figure 7 presents the excitation spectra of the pre-irradiated
phosphor with UV photons at an energy of 6.2 eV (200 nm) for the recombination emission bands at 2.92 eV (292 nm) (curves 1 and 2) and 3.06 eV (405 nm) (curves 3 and 4), at 300 K and 77 K respectively. In alignment with observations from the
phosphor, excitation bands are identified at 3.94–4.0 eV (310–314 nm) and 4.5–4.6 eV (269–275 nm), along with a band at 5.64 eV (220 nm). Additionally, in pure phosphates, emissions at 2.92 eV are also excited by photon energies of 4.0 eV (310 nm) and within the range of 4.45–4.6 eV (269–278 nm), occurring within the matrix’s transparency region.
Figure 8 illustrates the temperature-dependent behavior of emission intensity for bands at 2.95 eV (420 nm) (curve 1), 3.1 eV (400 nm) (curve 2), and 2.06 eV (602 nm) (curve 3). The data reveal that the intensity of the recombination emissions at 2.95 eV and 3.1 eV shows a gradual decline starting from 77 K. Moreover, it is observed that the intensity of the intracenter emission associated with the
impurity at 2.06 eV (602 nm) decreases in a monotonic fashion until reaching 350 K, beyond which it experiences a sharp increase up to 450 K.
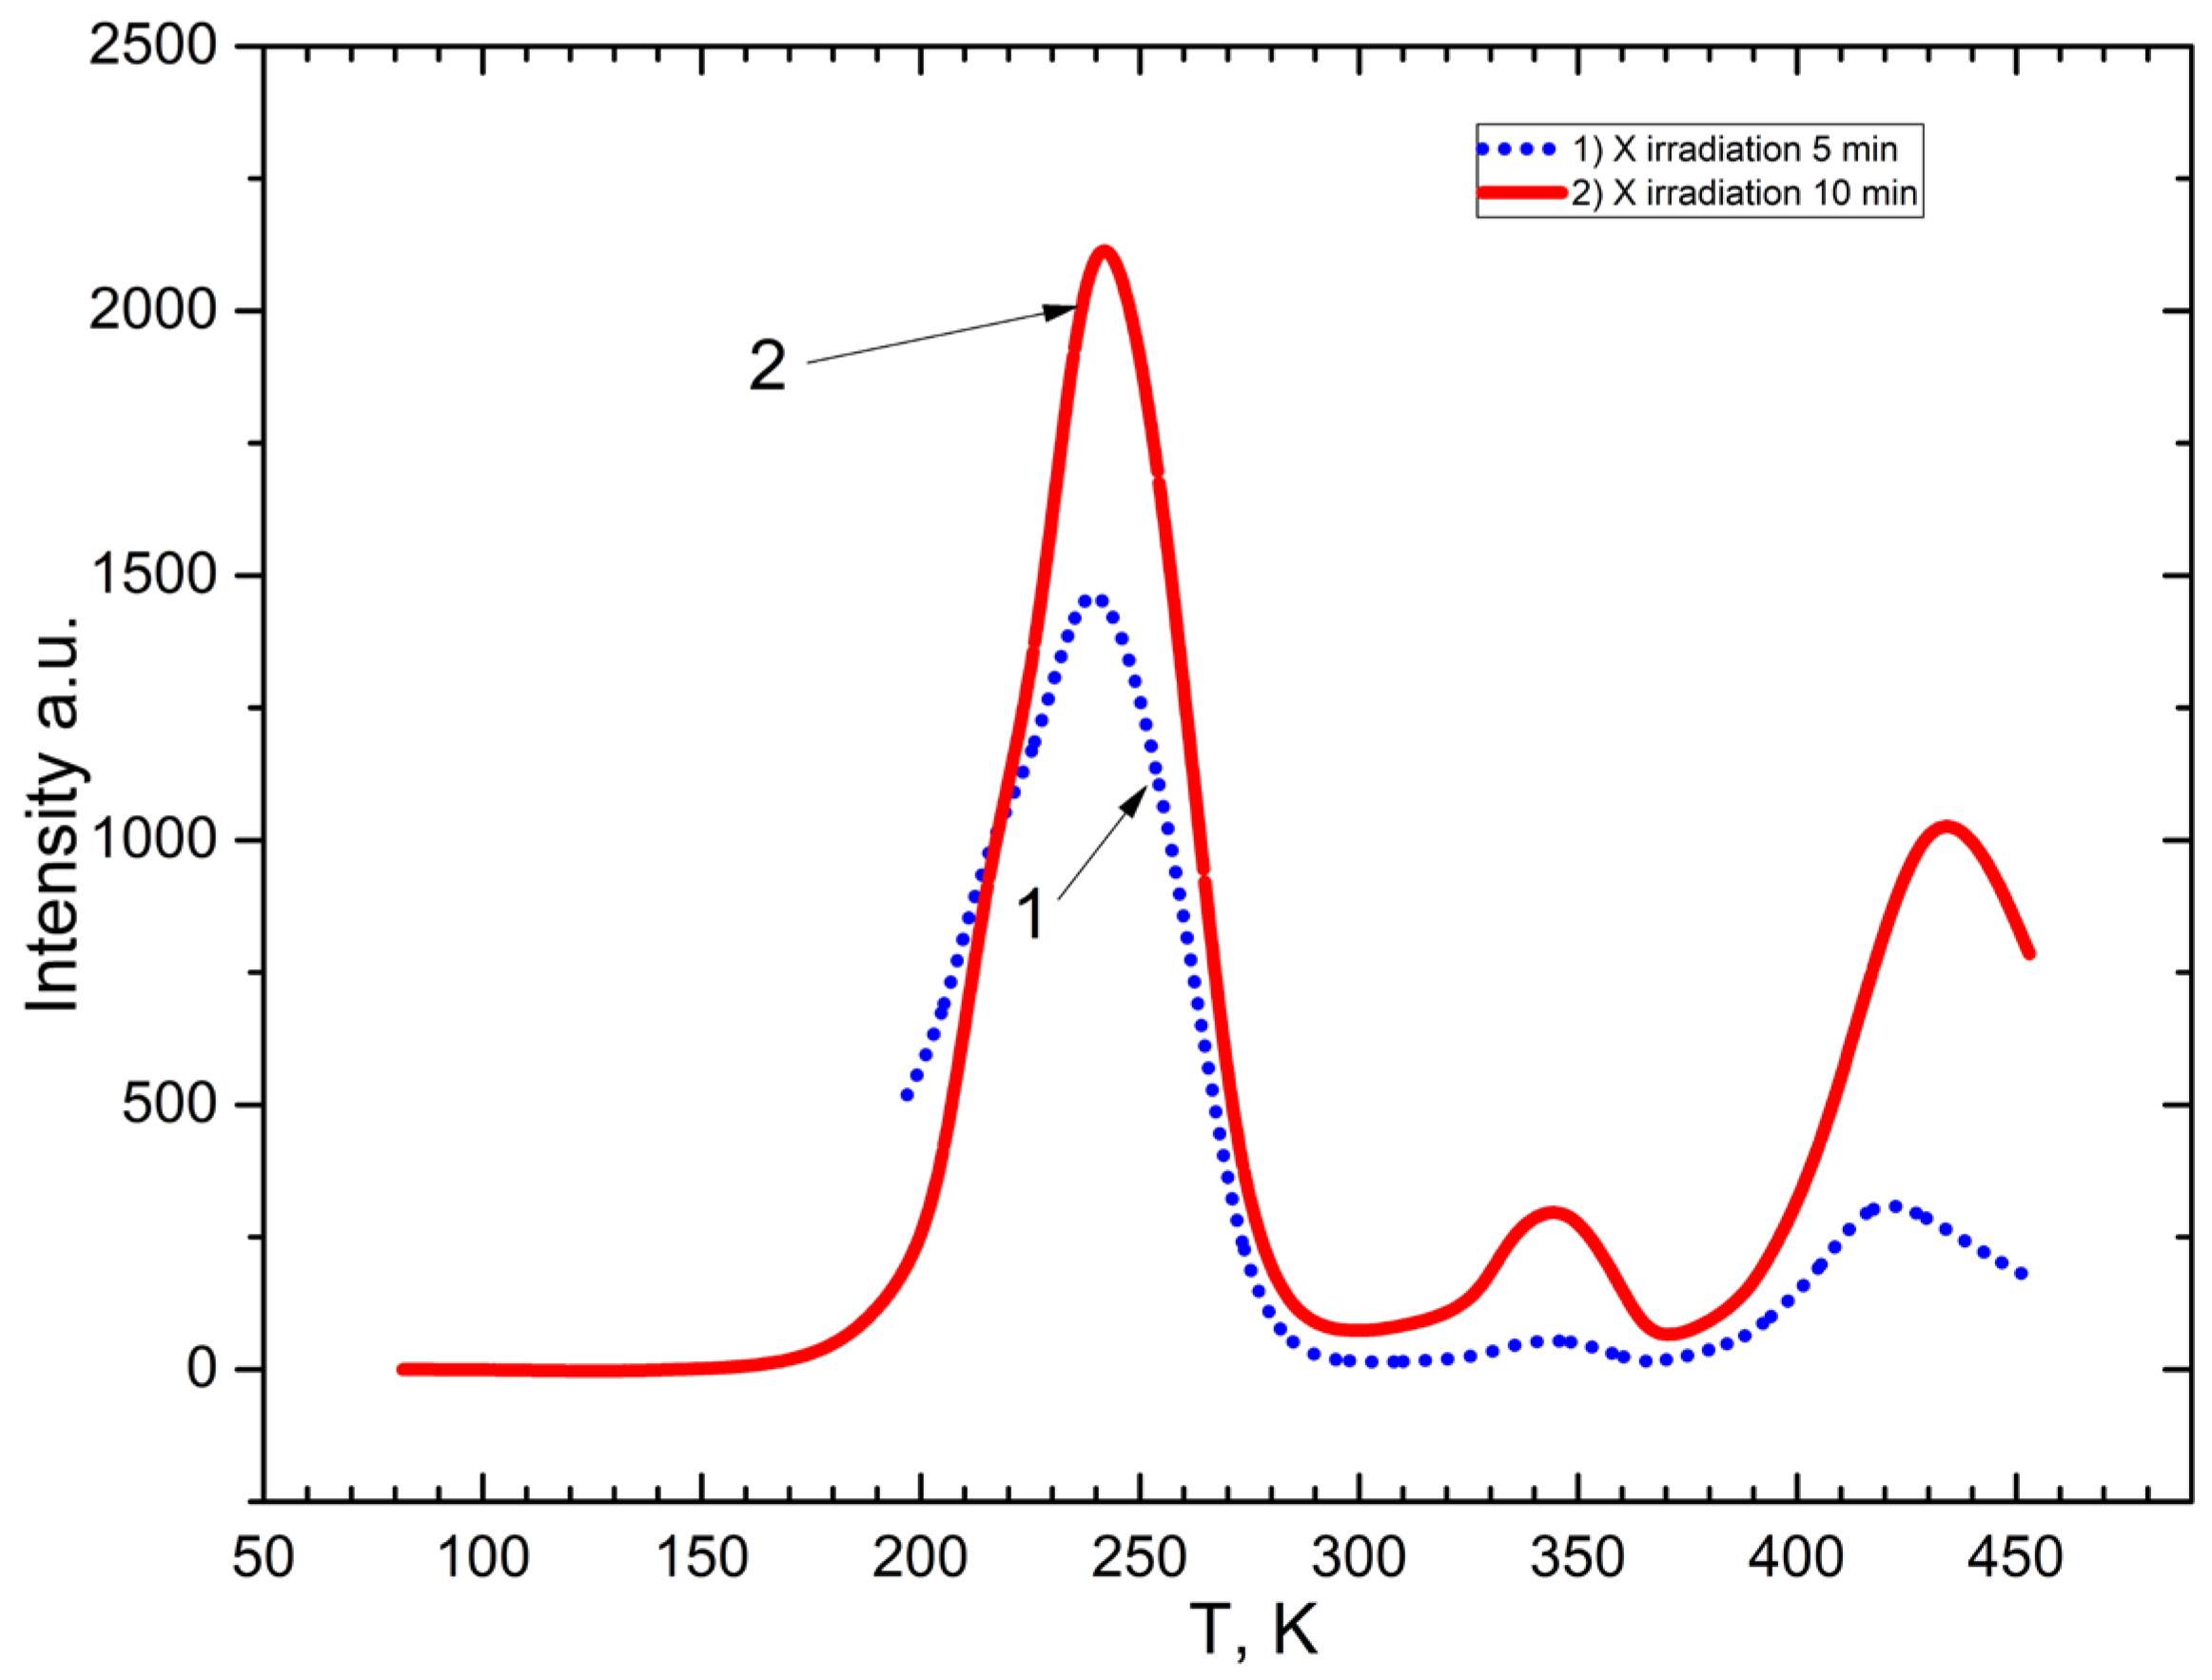
Figure 9 illustrates the TL curve of
. In the
phosphor irradiated with X-rays at 77 K, TL peaks appear at 200–270 K, 350 K, and 400–440 K. TL peaks appear in the temperature range where the intensity of the emission 2.92 eV (425 nm) and 3.06 eV of the combined radiative state of the phosphor
changes.
In our forthcoming research, we aim to delve into the formation of electron- and hole-trapping centers upon excitation within the vacuum-ultraviolet region, specifically at photon energies ranging from 6.2 eV to 12.4 eV (100–200 nm). This range is critical as it encompasses the energies at which free electron–hole pairs are predominantly formed, particularly above 8 eV (155 nm), as highlighted in the studies by authors [
22].
The findings reported by [
22] reveal that long-lasting phosphorescence and thermally stimulated luminescence are primarily linked to the creation of electron–hole-trapping centers. These centers emerge through charge transfer from the oxygen anion to the valence band during the excitation of the
state of
and the
states of rare-earth ions, specifically in transitions involving
and
complexes. Furthermore, reference [
22] correlates the fundamental absorption band observed in matrices such as
,
, and
with electron transitions from the anionic groups
and
to the conduction band.
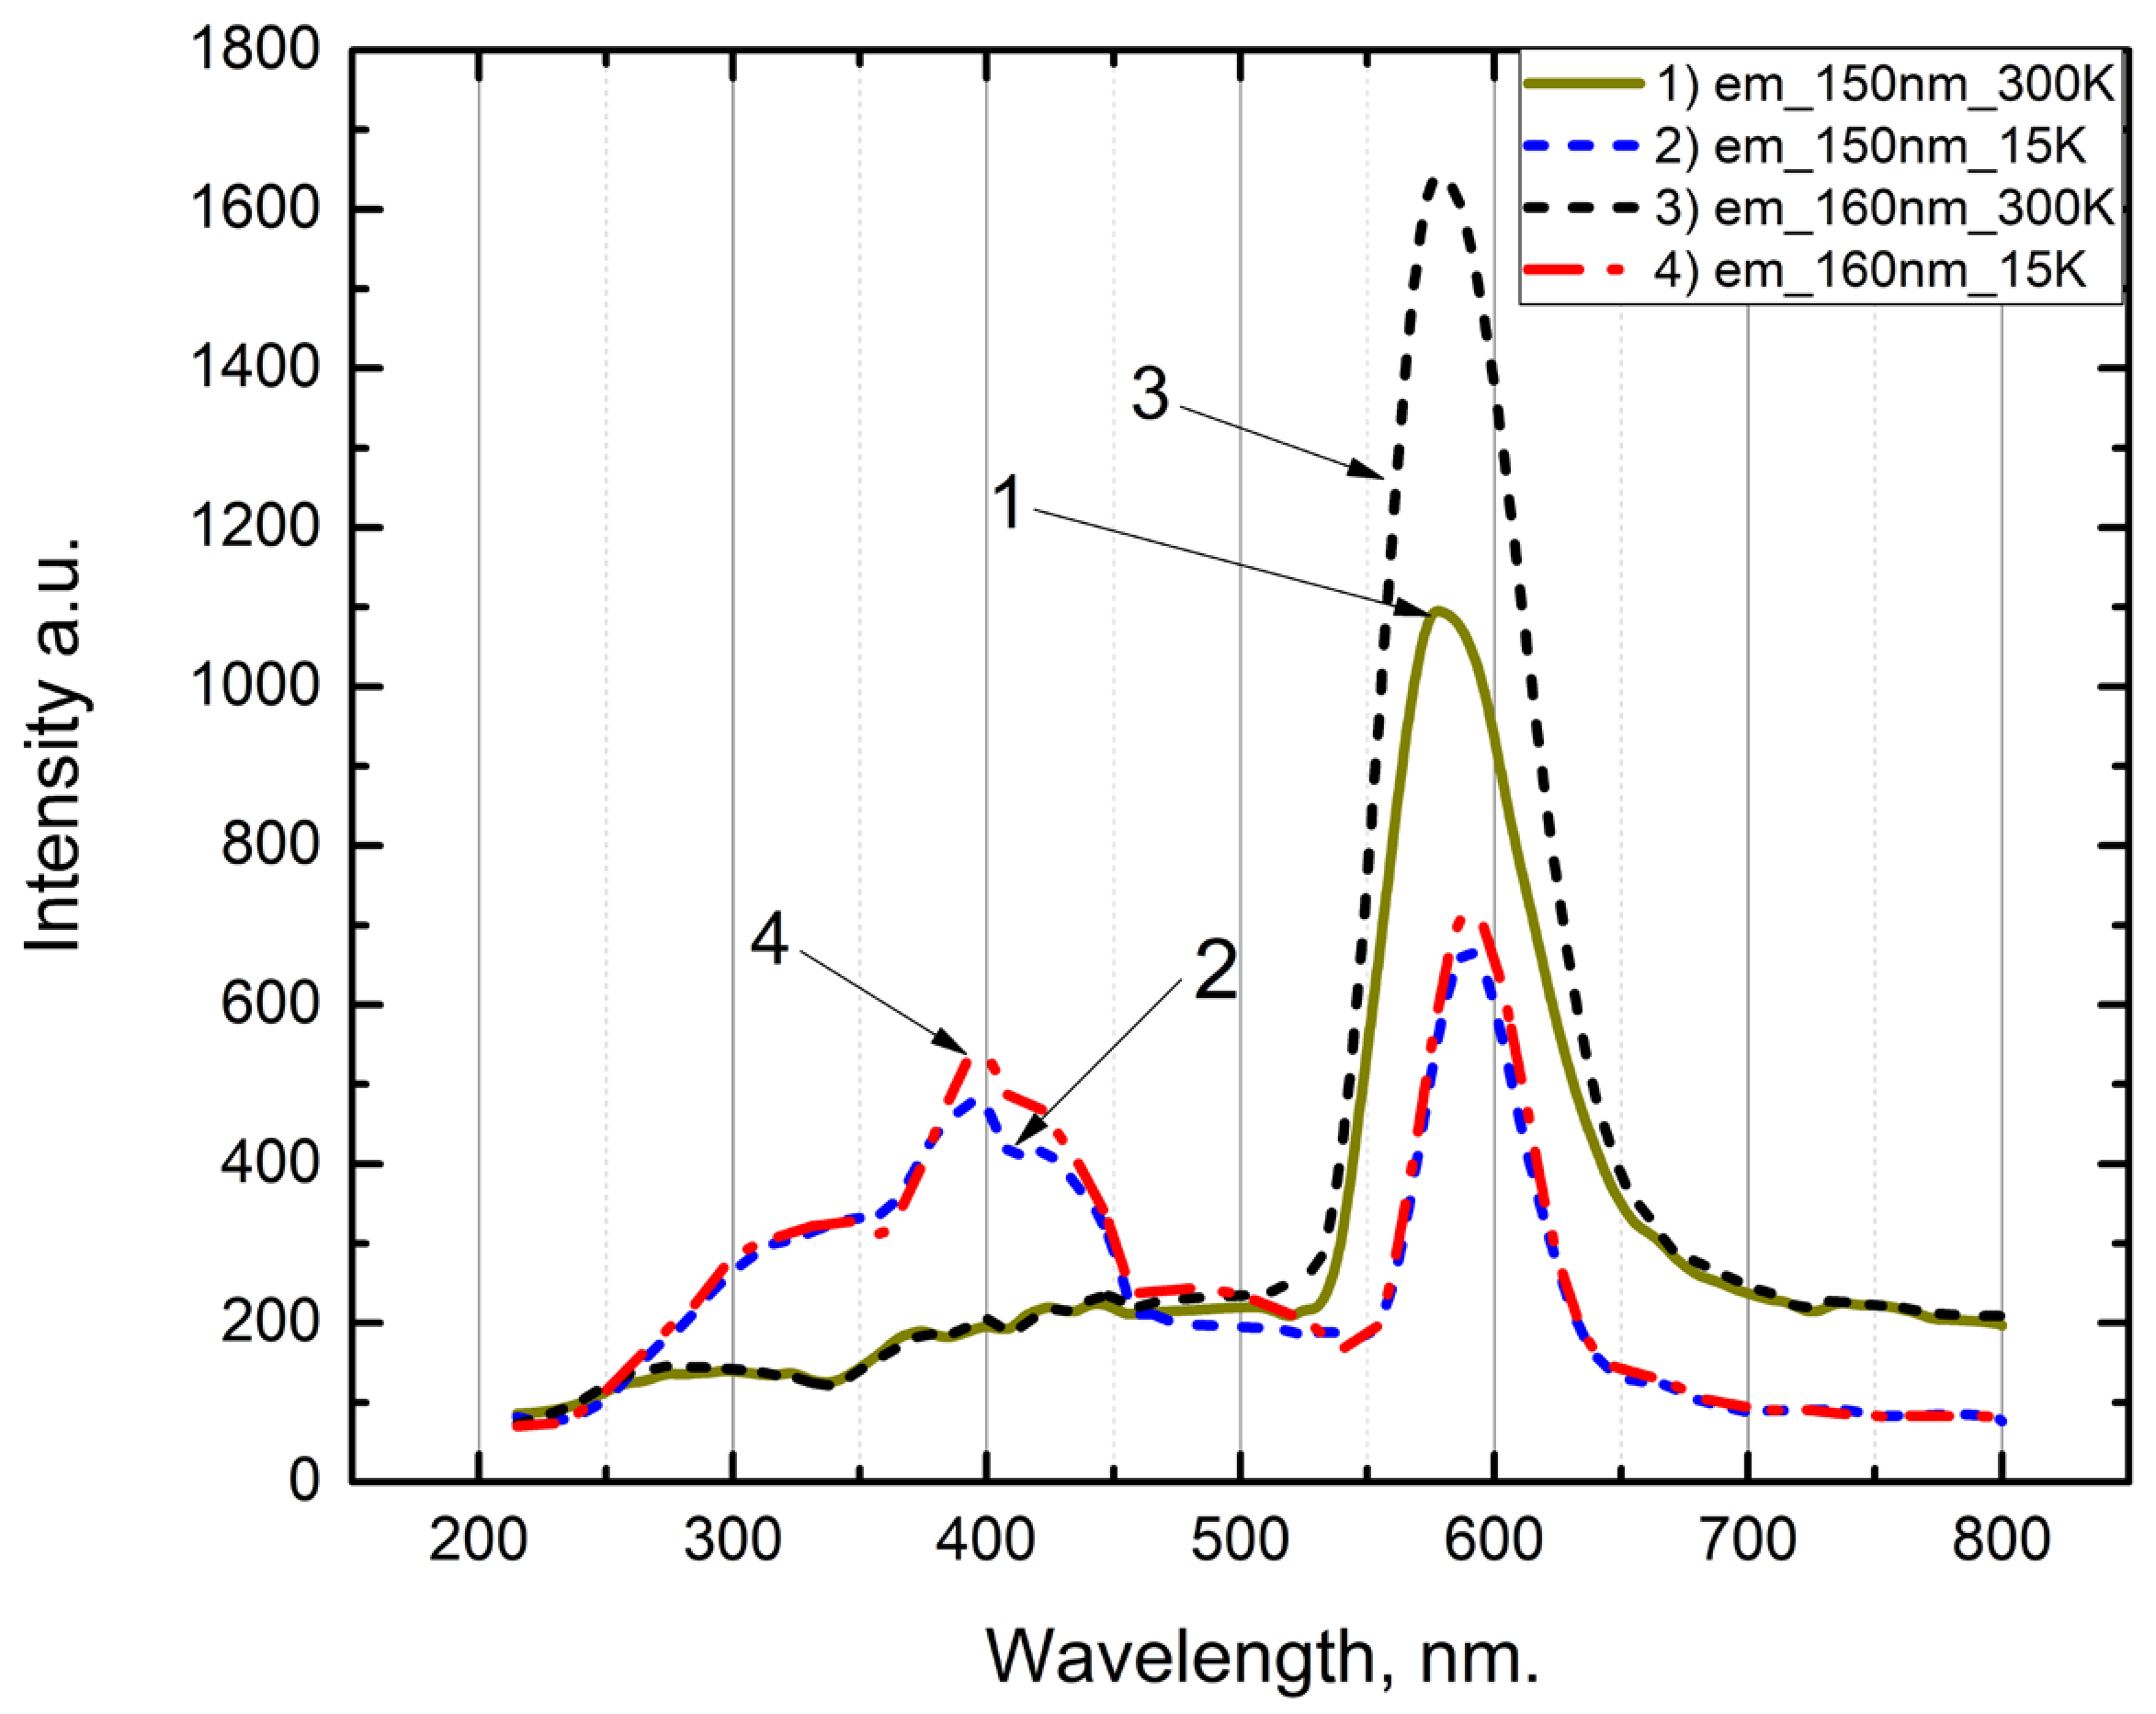
In
Figure 10, the emission spectrum of the α-
phosphor, excited by photons at energies of 8.26 eV (150 nm) and 7.75 eV (160 nm), is presented for temperatures of 300 K and 15 K. At 300 K, emissions are observed at 2.06 eV, corresponding to the intracenter emission of the
ion (curves 1 and 3). When the temperature is lowered to 15 K, the intensity of the 2.06 eV (600 nm) emission from
decreases by a factor of 2 to 2.5, and new emission bands emerge at 2.92 eV (425 nm) and 3.06 eV (405 nm) (curves 2 and 4 in
Figure 10). This pattern of emissions is consistent with the observations made under UV irradiation at 6.2 eV (200 nm) photon energy at 77 K. The reduction in the
emission band leads to the formation of new electronic trapping centers as a result of the reaction
, in conjunction with localized holes in
, forming
complexes.
Figure 11 shows the excitation spectrum of α-
emission for the 2.0 eV (620nm) and 2.1 eV (590 nm) bands at 300 and 15 K.
Figure 11 shows that the emission of the
ion is excited at photon energies of 7.85 eV (158 nm). This value is the band gap for the phosphor α-
.
4. Discussion
The experimental results highlight the following processes occurring in the phosphor upon excitation with 6.2 eV (200 nm) ultraviolet photons:
The occurrence of impurity intracenter emissions at 2.06 eV (600 nm) from the ion, observable at both 300 K and 77 K.
The generation of new induced recombination emissions at 2.95 eV (420 nm) and 3.1 eV (405 nm), resulting from charge transfer between excited matrix anions and impurities, specifically between and .
To further elucidate the characteristics of the intracenter emission at 600 nm and the newly induced emissions at 2.95 eV (420 nm) and 3.1 eV (405 nm), the excitation spectra of these emissions were meticulously measured.
Intracenter emission at 2.06 eV (600 nm) are excited:
At 3.65 eV (340 nm) and 3.4 eV (335 nm), as shown by the authors of [
5], corresponding to intra-center excitations of the
ion.
At 5.64 eV (220 nm) and 4.96 eV (251 nm) because of charge transfer from the excited anion to impurities and neighboring anions and .
~2.5 eV (496 nm) excitation of trap centers near the ion.
4.0 eV (310 nm) and 4.5 eV (275 nm) emissions arising in the transparency region of the matrix.
The newly created induced emissions at 2.95 eV (496 nm) and 3.1 eV (400 nm) are excited at photon energies of 4.0 eV (310 nm) and 4.5 eV (275 nm), as well as in the spectral range of 4.96 eV (256 nm) and 5.64 eV (220 nm), where these new induced emissions are mainly created at low temperatures of 77 K.
Next, to clarify the correlation between the above-mentioned regularities with the processes in the pure matrix , similar experimental studies on the phosphor were conducted.
When the pure phosphor was excited with photon energies ranging from 5.9 to 6.2 eV (200–210 nm), emissions at 2.95 eV (496 nm) and 3.1 eV (400 nm) were detected at both 77 K and 300 K.
These induced emissions are excited at photon energies of 4.0 eV (310 nm) and 4.5 eV (275 nm) in the transparency region of the pure matrix and more intensively so at 77 K.
The emission bands for matrix samples of
and with an admixture of Mn are listed in
Table 1.
Excitation bands of the type for samples of the matrix and with an admixture of Mn are indicated in
Table 2.
The main question of these studies is the formation of induced or combined radiative states in pure and doped phosphors in the same manner as a result of charge transfer from the matrix to impurities and neighboring anions and . As a result, intrinsic and impurity electron-trapping centers and , complementary to hole-trapping centers near impurities, are formed. During the excitation of the anion , due to the charge transfer of impurities, should be created, and the hole component is mainly localized near impurities.
It is assumed that similar induced and combined radiative states at 2.95 eV (420 nm) and 3.1 eV (400 nm) should be created upon trapping free electrons and holes by
impurities and
anions. We conducted experimental research in the vacuum ultraviolet spectral range from 12.4 eV (100 nm) to 4.96 eV (250 nm), where free electron–hole pairs are created. When irradiated with photons with energies of 8.26 eV (150 nm) and 7.75 eV (160 nm) at temperatures of 300 K and 15 K, intracenter emissions of
at 2.15 eV (577 nm) and new induced or combined radiative states at 2.95 eV (420 nm) and 3.1 eV (400 nm) are created. Impurity emissions of
at photon energies of 8.0 eV (155 nm) are excited by free electrons. It is known that the band gap of
and
phosphors are 8.26 eV (150 nm) and 7.65 eV (162 nm), respectively [
22].
The primary focus of these studies is to understand the formation of induced or combined radiative states in both pure and doped phosphors, facilitated by charge transfer from the matrix to impurities and neighboring anions, specifically and . This process results in the formation of intrinsic and impurity electron-trapping centers ( and () that complement hole-trapping centers located near impurities. It is proposed that during the excitation of the anion , charge transfer from impurities should lead to the creation of , with the hole component primarily localized near impurities. Consequently, it is hypothesized that similar induced and combined radiative states at 2.95 eV (420 nm) and 3.1 eV (400 nm) are formed by the trapping of free electrons and holes by impurities and anions.
The estimated band gap of is approximately 8.0 eV (155 nm).
Thus, the new combined radiative states are created as a result of charge transfer from the excited ion to impurities and ions .
These radiative states are generated when electrons are captured by impurities and intrinsic centers, specifically through the reactions and . This results in the formation of impurity and intrinsic – electron–hole-trapping centers. The trapping of electrons by ions and anions lead to the creation of these specific centers, facilitating the observed radiative states.
The temperature-dependent measurements of the new radiative states at 2.95 eV (420 nm) and 3.1 eV (400 nm) reveal a distinct pattern: their intensity steadily decreases from 77 K to 250 K, experiences a surge between 250 K and 300 K, and then undergoes a sharp decline from 300 K to 400 K. Concurrently, the intensity of the intracenter emission at 2.06 eV shows a slight decrease over the same temperature range, followed by a significant increase between 370 K and 450 K.
The experimental results, as illustrated in
Figure 3,
Figure 6 and
Figure 8, confirm the temperature dependence of the intensity for the newly induced emissions at 2.95 eV (420 nm) and 3.1 eV (400 nm). Notably, the efficiency of generating these induced emissions at lower temperatures, specifically at 15 K and 77 K, is found to be twice as high compared to that at higher temperatures ranging from 300 K to 350 K.
The observed temperature-dependent behavior of the radiative states at 2.95 eV (420 nm) and 3.1 eV (400 nm), particularly the flaring up and subsequent rapid decrease in intensity between 250 K and 300 K, can be attributed to ionization processes:
. This ionization leads to the generation of free electrons in the conduction band, which then recombine with localized holes near the
impurity, specifically
. The energy released during this recombination is transferred to the impurities, resulting in an observed increase in the intensity of intracenter emission at 2.06 eV (600 nm) for
. Consequently, this process facilitates energy transfer from the matrix to the impurities. In analogous research conducted by authors [
3] on
, electron ionization from the
ion into the conduction band was observed with an activation energy of 0.4 eV, illustrating a similar charge transfer mechanism.
The decrease in the intensity of the combined radiative state of 2.92 eV (425 nm) and 3.0 eV (413 nm) is associated with the decay of electron-trapping centers and the implementation of electron recombination with a hole-trapping center, which is confirmed by the appearance of TL peaks in this temperature range in the irradiated phosphor
at 80 K (
Figure 9). The presence of TL peaks confirms the formation of electron- and hole-trapping centers during irradiation with UV (6.2 eV (200 nm)) photons.
The formation of induced or combined radiative states, which include the electronic configurations of electron–hole-trapping centers
and
, is supported by experimental evidence. Specifically, new induced emissions at 2.95 eV (420 nm) and 3.1 eV (400 nm), stimulated by the irradiation of trapping centers, are excited at photon energies of 4.0 eV (310 nm) and 4.5 eV (275 nm) within the transparency region of the matrix, as shown in
Figure 5 and
Figure 6. Similarly, intracenter emissions from the
ion are excited at these same photon energies, as demonstrated in
Figure 4,
Figure 5 and
Figure 7.
The experimental evidence solidly supports that induced states arise from the electronic configurations of both intrinsic and impurity-trapping centers. Specifically, the radiative decay and relaxation processes involving the excited state
commence from a singular energy level as the temperature increases. This behavior underscores the dynamic interaction between these trapping centers under thermal variation.
Figure 12 presents a model illustrating the presumed arrangement of electronic- and hole-trapping centers, providing a visual representation of these complex interactions.
Here is the explanation of the model describing electronic transitions in irradiated at temperatures of 300 K and 77 K.
At a temperature of 300 K, irradiated with photons of 6.2 eV (200 nm) generates electron–hole pairs - . Upon the transition from to in the ion, an emission band occurs at 2.06 eV (600 nm). At temperatures of 77 K and 300 K, a free electron occurs:
Upon capture by impurities: ;
Upon capture by the matrix anions .
As a result, electronic and hole capture centers arise, i.e.,- . Hybrid or combined electronic states arise beneath the conduction band consisting of the electronic state and .
Parallel to this process, a hole localized above the valence band near the ground state of the ion is localized above the valence band . Due to the anisotropic nature of the compound, the holes formed with unpaired electrons in different crystallographic directions localize above the valence band ceiling at different energy positions: and .
The experimental data obtained by analyzing the photoluminescence decay curves of the samples reveal distinct decay times for different emission bands (
Figure 13). Specifically, the decay time for the intracenter emission at 2.06 eV (corresponding to 600 nm or 2 bands) is measured at 55 μs. In contrast, the decay time for the induced emission at 3.1 eV (corresponding to 400 nm or 1 band) is significantly shorter at 22 μs. The induced photoluminescence from
emissions is notably observed following cascade recombination processes, highlighting the complex dynamics of electron–hole recombination in these materials.
The photon energies of 4.0 eV (310 nm) and 4.5 eV (275 nm), responsible for exciting the intrinsic and impurity radiative states at 2.95 eV (420 nm) and 3.1 eV (400 nm), correspond to the absorption and excitation energies bridging the ground and excited states of both intrinsic and impurity electron–hole-trapping centers. This relationship is detailed in the band model illustrated in
Figure 12. The model elucidates how these specific photon energies facilitate transitions that result in the observed radiative states, providing a comprehensive understanding of the energy dynamics within the phosphor.

 ,
, 


