Article

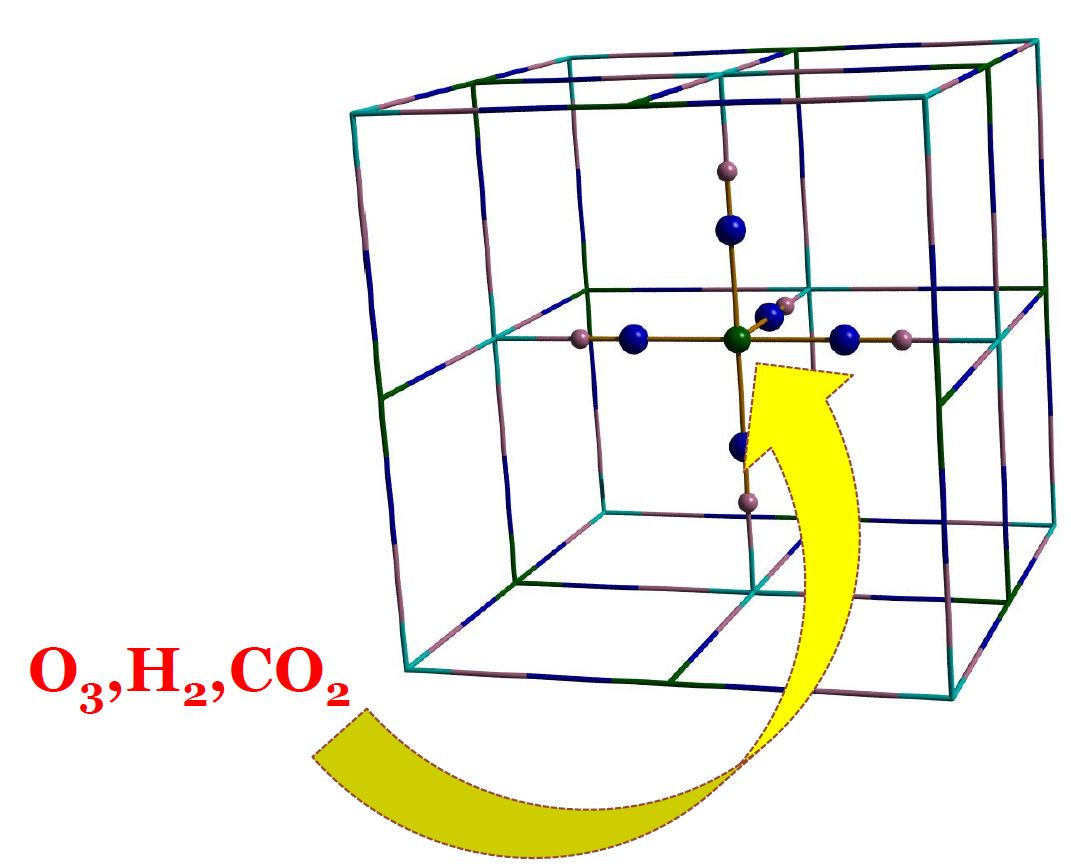
Structural and Gas Retention Changes Induced by Ozonization of Cobalt(II) and Manganese(II) Hexacyanocobaltates(III)

1
Departamento de Polímeros, Instituto de Investigaciones en Materiales, Universidad Nacional Autónoma de México, Ciudad de México 04510, Mexico
2
Departamento de Materiales Avanzados, Centro de Investigación en Química Aplicada, Blvd. Enrique Reyna No. 140, Saltillo 25294, Coahuila, Mexico
*
Author to whom correspondence should be addressed.
Crystals 2017, 7(1), 16; https://doi.org/10.3390/cryst7010016
Submission received: 9 December 2016 / Revised: 2 January 2017 / Accepted: 4 January 2017 / Published: 7 January 2017
(This article belongs to the Section Crystal Engineering)

Abstract

:
Transition metal hexacyanocobaltates are porous materials with open metal sites and a wide variety of pores. In this work, manganese(II) and cobalt(II) hexacyanocobaltates(III) have been selected to explore the interactions between the open metal sites located in their pores and the guest molecules: hydrogen, carbon dioxide, water and methanol. An experimental setup was designed and implemented to conduct post-synthesis modification of the solids with ozone. Samples were dehydrated, ozonized and saturated with methanol in situ. Ozone molecules acted on the open metal sites changing their oxidation state, causing a contraction of the unit cell and inducing a stronger interaction of the molecules of water and methanol with the lattice. This strengthening prevented the lattice from being evacuated without compromising its framework stability. The decomposition temperature decreased in all ozonized samples as a consequence of the elongation and weakening of the cobalt-carbon bond. Active infrared and Raman bands were used to monitor the interaction between the open metal sites at the framework surface and the guest molecules. The cell contraction and the presence of residual methanol molecules in the porosity reduced the hydrogen and carbon dioxide retention capacity of the samples.

Graphical Abstract

1. Introduction

Catalysis, adsorption, separation and purification are key processes in the modern global economy. A primary concern in the implementation of technological solutions for these processes is tailoring porous materials with specific storage capacity, pore size distribution and adsorption energy distribution [1,2,3,4]. Hydrogen storage and carbon dioxide capture are major areas of interest within the field of porous materials science [5,6,7,8,9] because the hydrogen molecule is a sustainable energy carrier, and anthropogenic carbon dioxide has a high environmental impact. However, a transition to a hydrogen-based economy or a significant reduction in anthropogenic carbon dioxide emissions is not currently viable. Therefore, further studies regarding the role of the adsorbents’ properties on hydrogen and carbon dioxide adsorption should be carried out.
Transitions metal hexacyanometallates represent an attractive family of porous materials with a great diversity of topologies and pore sizes [10,11,12,13,14,15,16,17,18,19]. Some members of this family also have a high density of open metal sites on their pores walls [11], and others have exchangeable metal cations [20,21,22]. Open metal sites and exchangeable metal cations are specific adsorption centers with intense field gradients to interact with quadrupole molecules of great technological interest, such as: H2 [23,24], CO2 [25], O2 [21] and N2 [21]. These features have proven to be useful in combustion exhaust gas purification [26] and oxygen and nitrogen air enrichment [21]. The same characteristics have guaranteed the adsorption and separation of light n-alkane hydrocarbons [27]. Compounds with exchange cations have also found application in sodium-ion rechargeable batteries’ development [22].
The use of transitions metal hexacyanometallates in the aforementioned applications requires a framework degassing process to remove the solvents used during the synthesis or others molecules exchanged with original solvents. This is a common step for most molecular sieve applications (see [28] and the references therein). The transitions metal hexacyanometallates precursors are salts soluble in polar solvents, such as water. That is why the vast majority of them are obtained with polar molecules in their frameworks. Polar solvents interact strongly with the framework, which is beneficial for the retention of some gases, such as ammonia, at trace level [29]. However, it becomes a high energy-consuming process when framework degassing is required. Systematic studies of solvent-framework interactions in transitions metal hexacyanometallates are rare [22,30], so further research on the subject is required.
Transitions metal hexacyanometallates are also excellent research candidates because the active vibrational modes are sensitive to the presence of guest molecules [31,32]. This feature allows monitoring the adsorption process inside the pores.
A few decades ago, Reguera et al. demonstrated that oxidation states of open metal sites in some porous cyanometallates can be modified through a reaction with ozone [33,34,35,36]. These reactions were conducted without dehydrating the material, and therefore, the water molecules were involved in the reaction. No attempt was made to conduct the experiment on dehydrated frameworks, nor to show the effect of oxidation states in gas adsorption properties. However, the possibility of modifying post-synthesis the oxidation states of metals with open coordination sites allows one to explore the effect of the metals’ oxidation state on the adsorbate-adsorbent interactions. In this paper, we have designed and implemented an experimental setup to conduct post-synthesis modification of oxidation states of open metal sites at manganese(II) and cobalt(II) hexacyanocobaltates(III) frameworks. The modifications were performed with ozone in an environment free of solvents. An experimental system was built in order to explore the effect of open metal sites oxidation states in H2, CO2, H2O and CH3OH interactions with the frameworks of manganese(II) and cobalt(II) hexacyanocobaltates(III). Herein, we report the effect of ozonization on the framework, the impact on the reversibility of H2O and CH3O adsorption and the adsorption of H2 and CO2 on partially-desolvated frameworks.

2. Results and Discussion

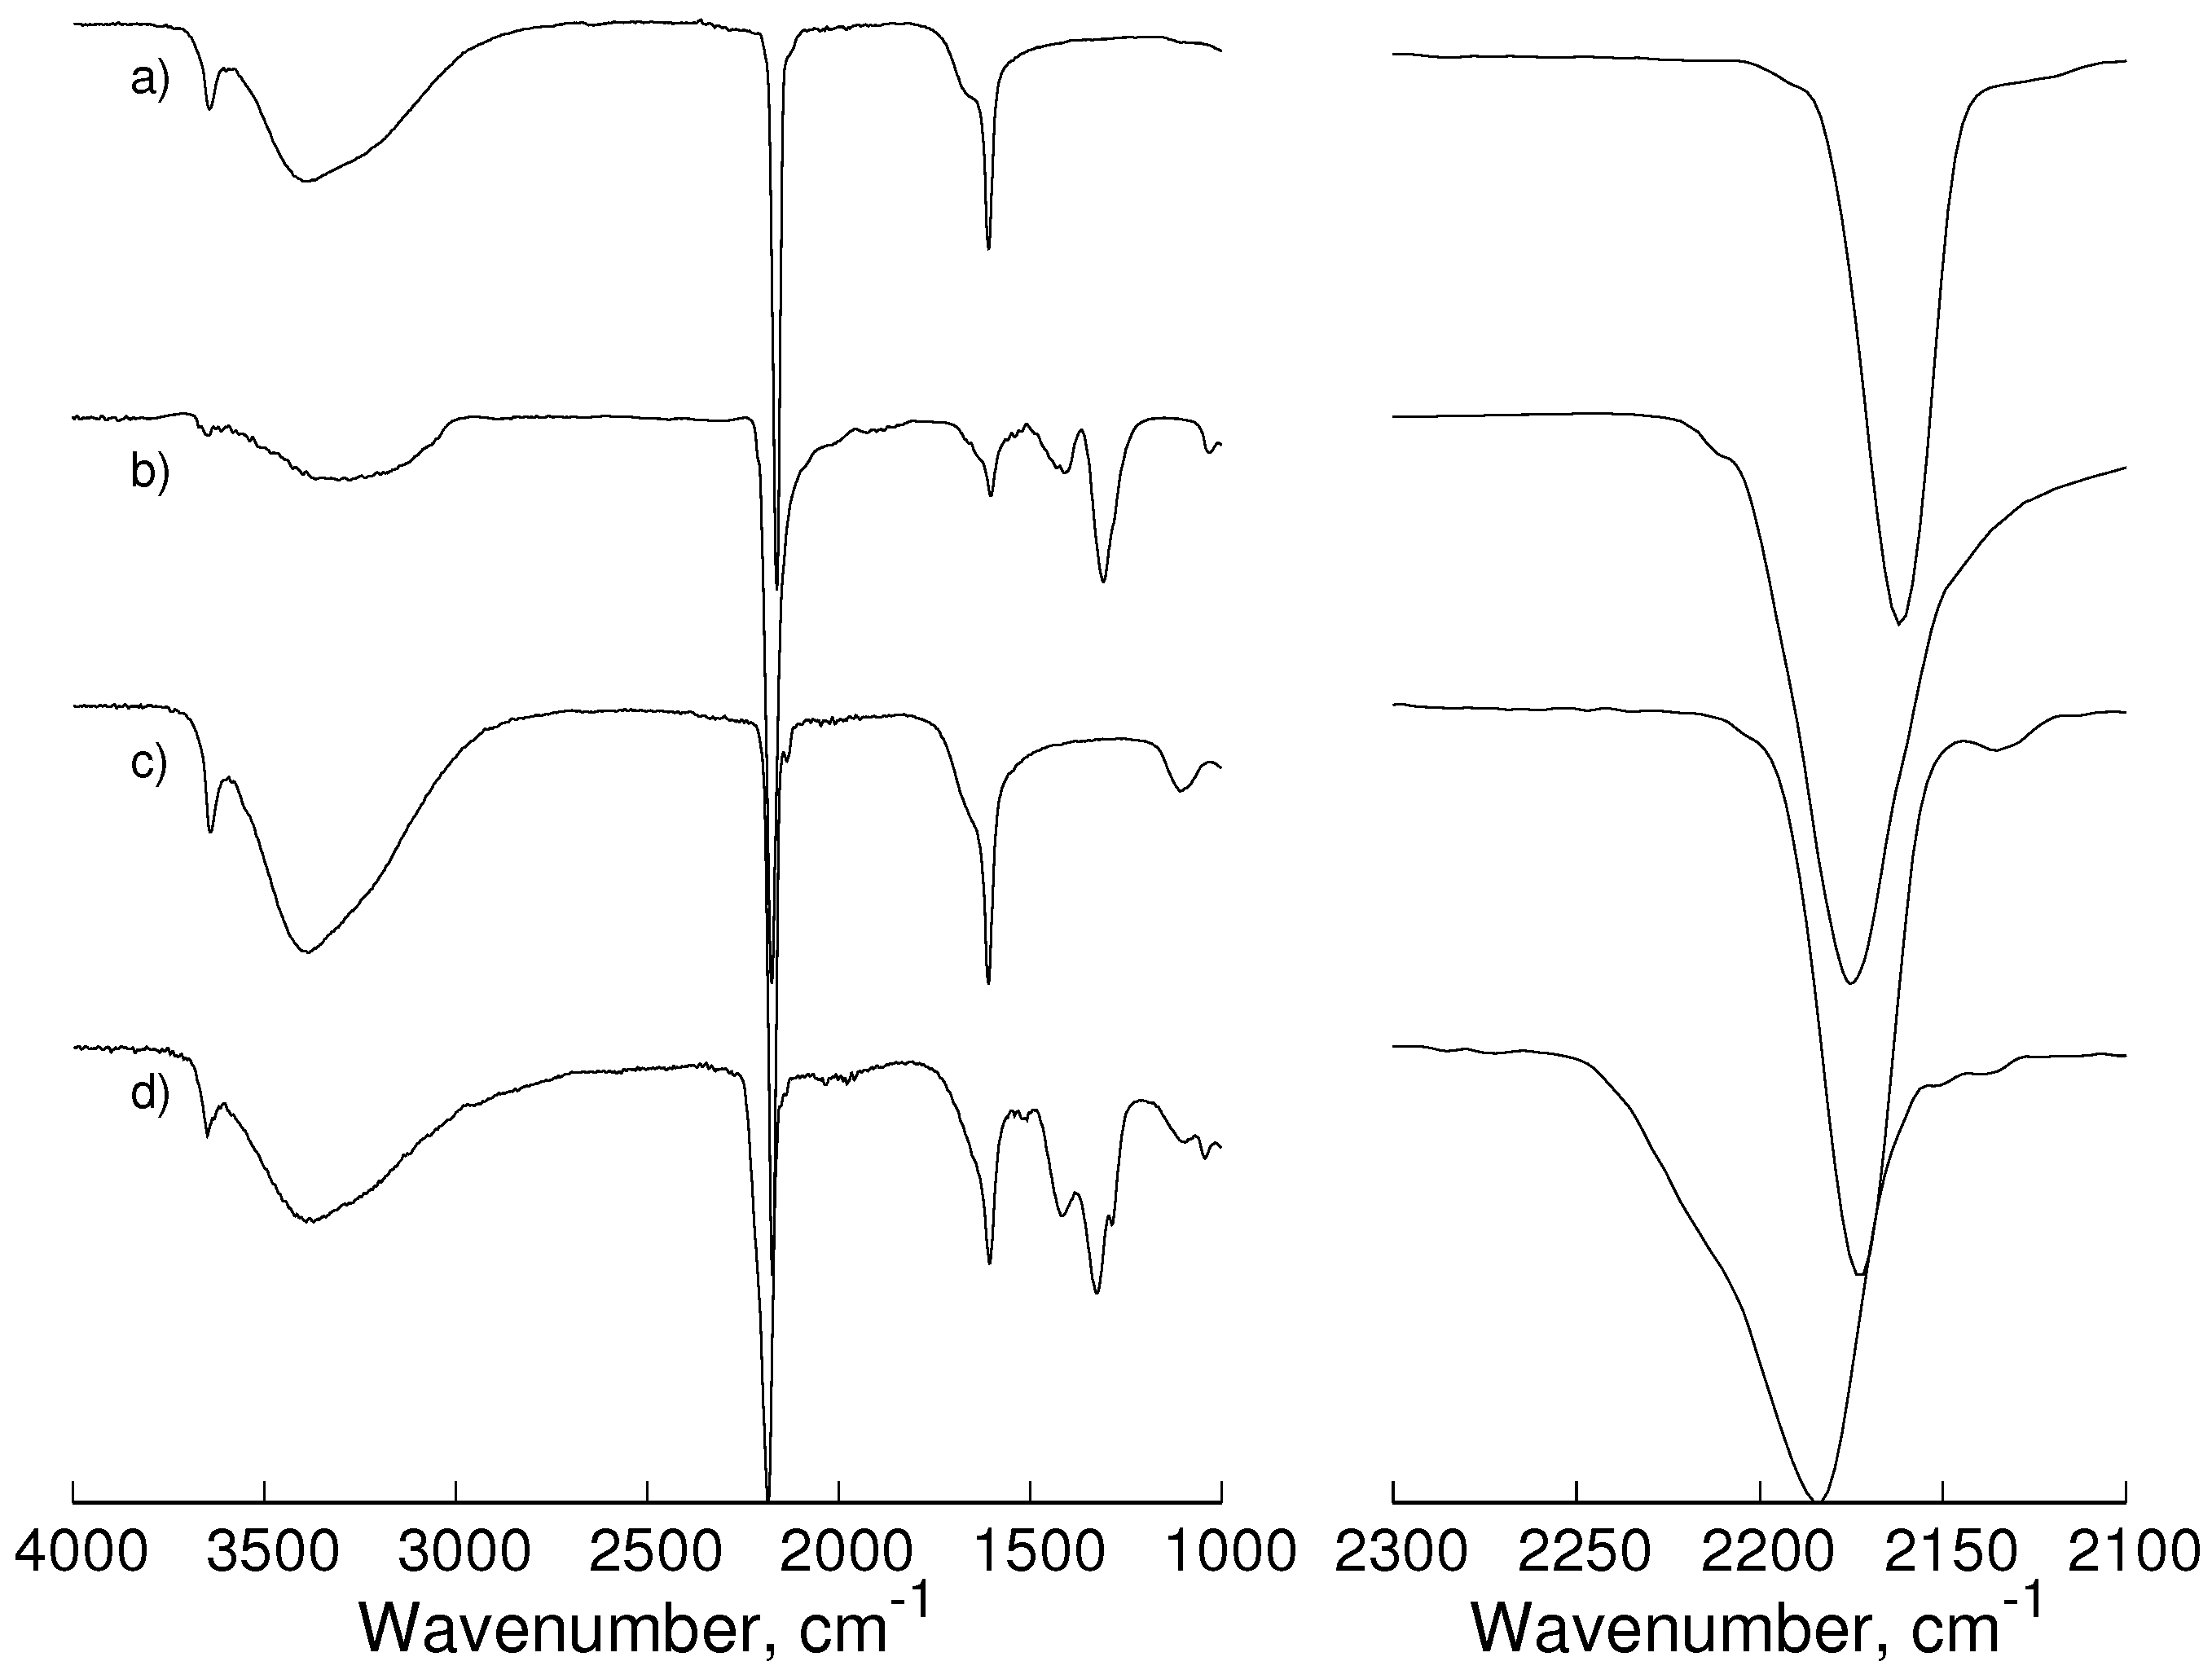
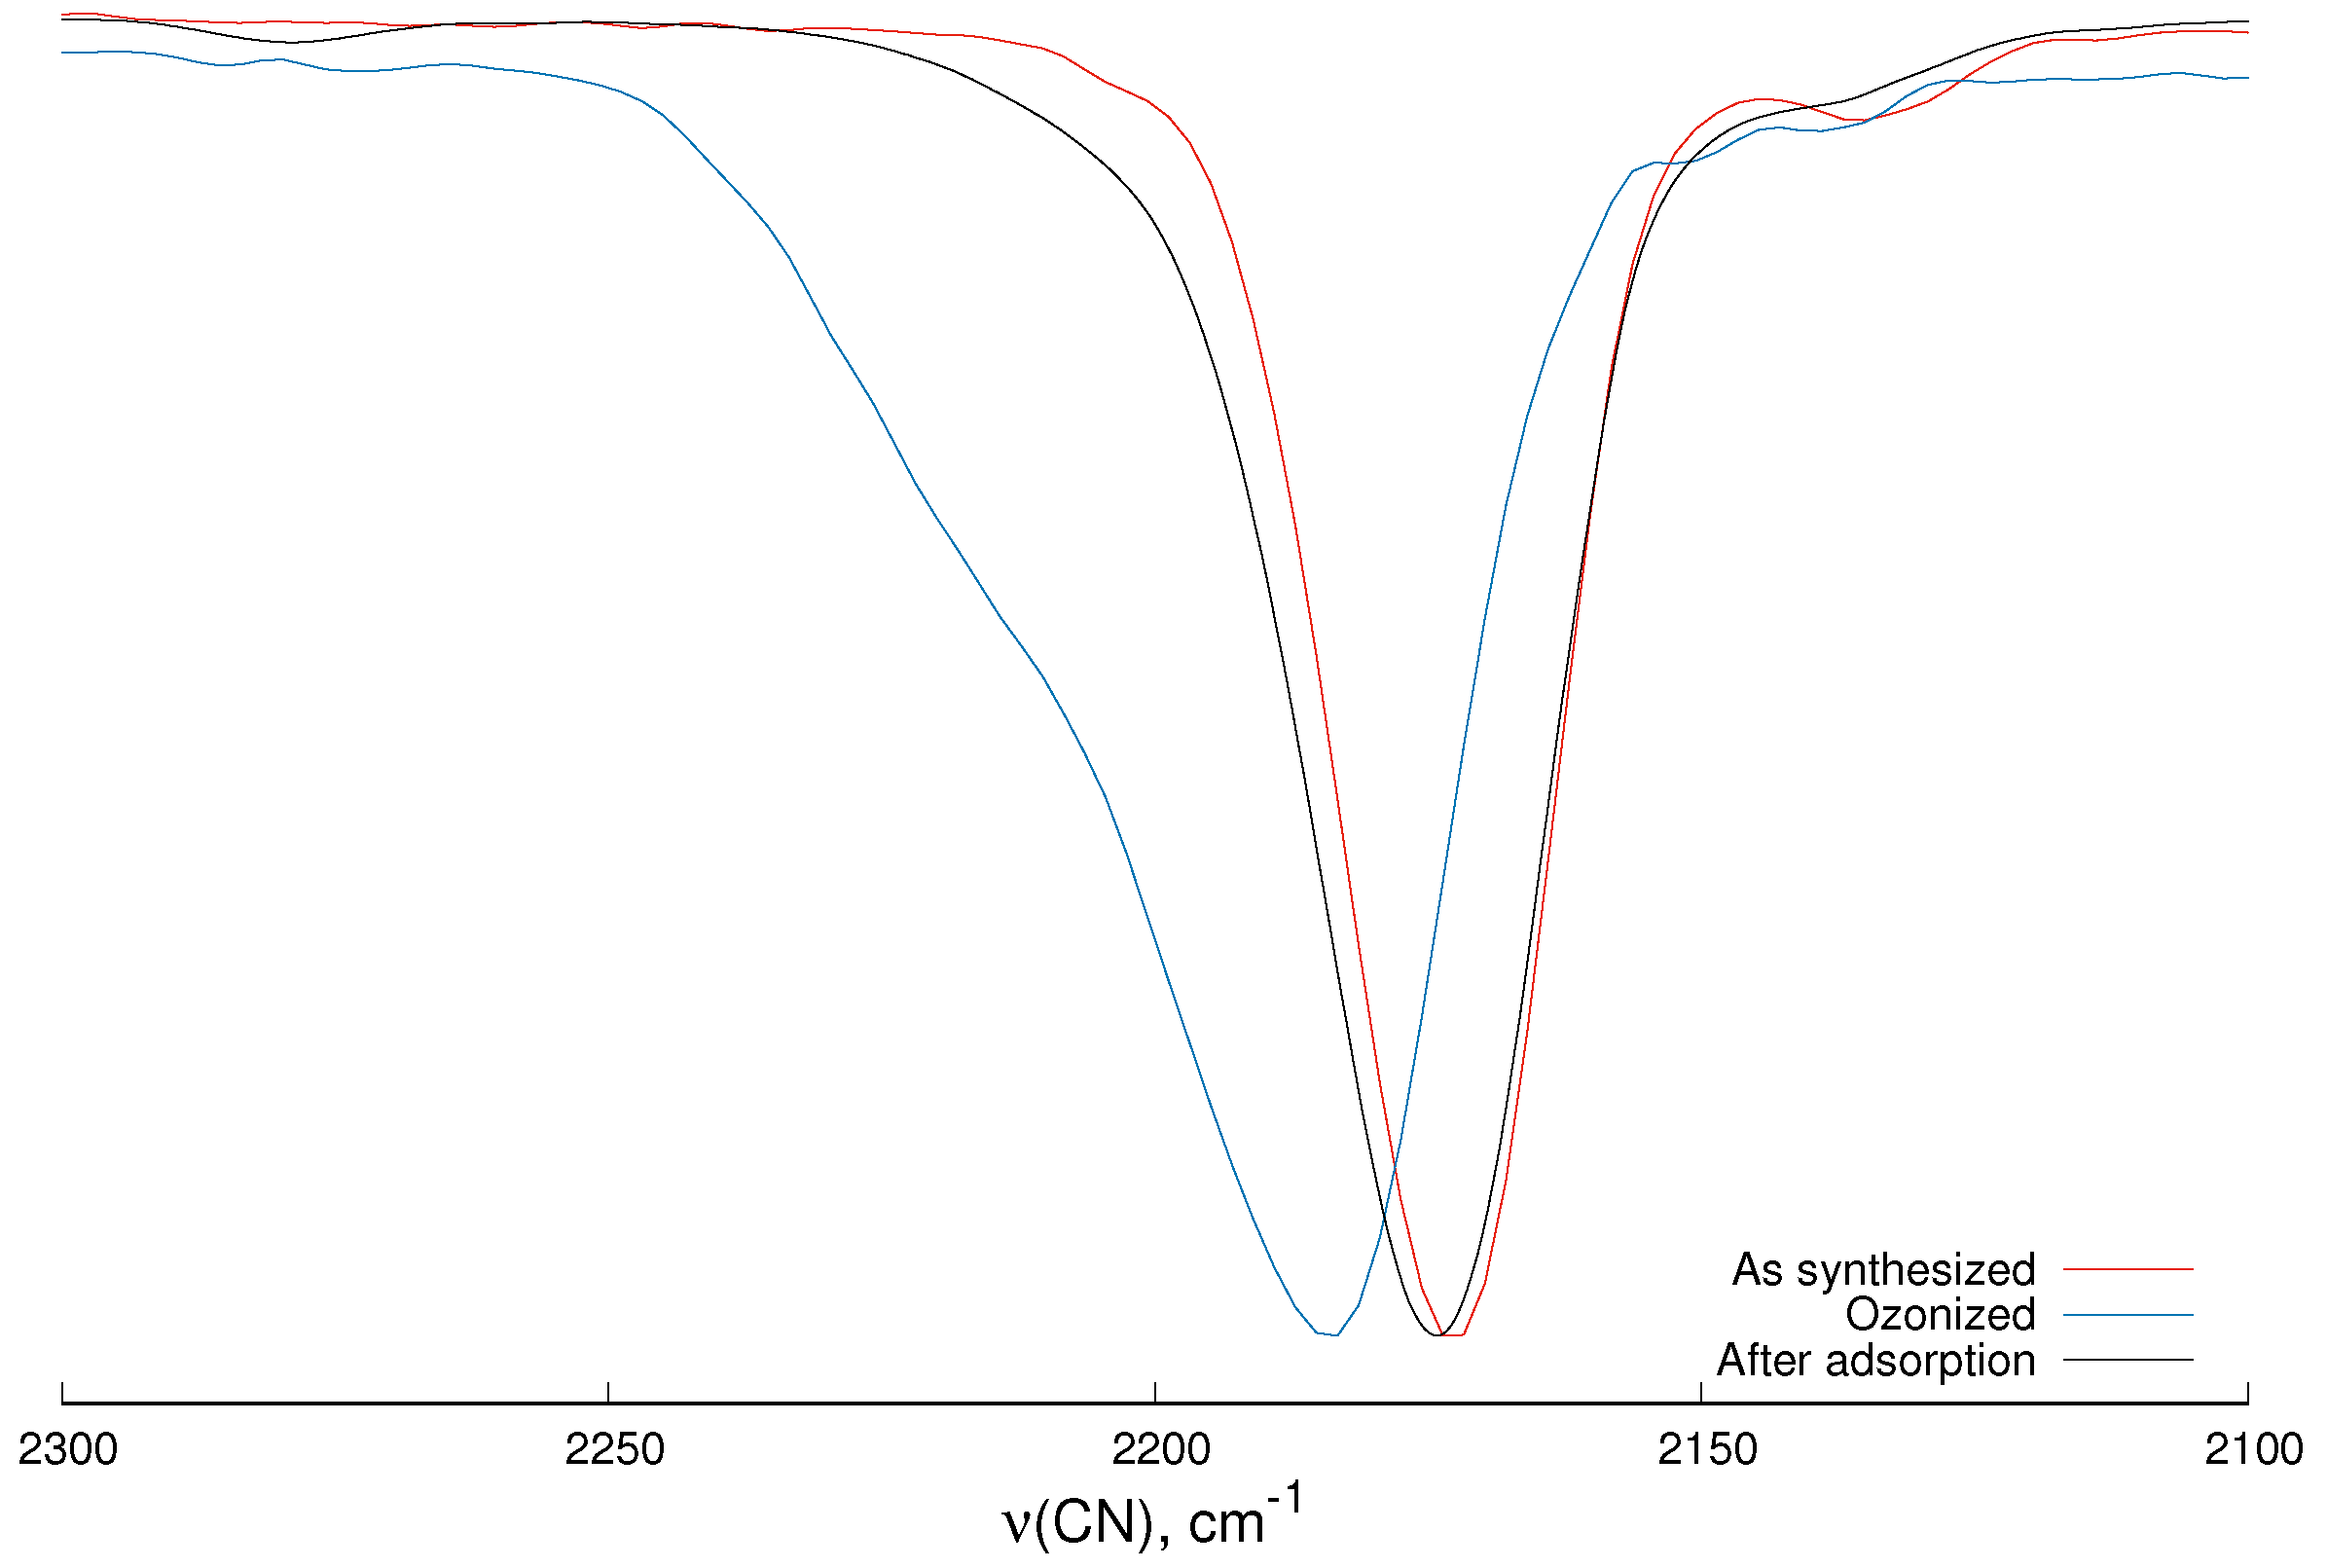
2.1. Infrared and Raman Spectroscopy

The infrared spectra for hexacyanocobaltates in the region from 4000 c m 1 to 1000 c m 1 shows three bands: a narrow band around 2160 c m 1 assigned to the ν(CN) stretching mode of the C≡N bond in the [Co(CN)6]3− octahedral structural unit and two broader bands corresponding to the stretching ν(OH) and bending δ(H−O−H) modes for the water molecules in the structure. These bands are located around 3400 c m 1 and 1600 c m 1 , respectively (Figure 1a,c). On the ozonized materials, ν(CN) bands shift to higher frequencies, and the δ(H−O−H) band splits into three (Figure 1b,d). The ν(CN) band shift is consistent with the oxidation of the metal coordinated to nitrogen [32]. The electron density of the linking metal decreases, thus favoring the σ donation from C≡N ligands and reducing the π back-bonding donation [37] from the metals’ d orbitals. Both effects strengthen the C≡N triple bond increasing the ν(CN) frequency. The appearance of new bands associated with δ(H−O−H) bending modes can be explained considering how the ozonization changes the interaction of water molecules with the framework. There are two types of water in the crystal structure: coordinated and non-coordinated. The first type is linked to the metallic centers through a coordination bond, substituting missing CN groups from [Co(CN)6]3− molecular building blocks. After ozonization, the positive charge increases at the metal coordinated to the nitrogen end of cyano ligands favoring the displacement of the electronic density from the oxygen atom of the coordinated water molecules to the metal through a σ donation. This displacement weakens the O−H bond, and it can explain the shift of the δ(H−O−H) band to smaller frequencies. The second type of water (non-coordinated) fills the rest of the accessible volume interacting between them through van der Waals forces and hydrogen bonds. These non-coordinated molecules are poorly affected by the metals’ charge. Therefore, the effect of the ozonization in the frequency modes is less evident.
Partially-dehydrated and ozonized samples’ FTIR spectra have similar differences relative to the as-synthesized sample FTIR spectrum. Coordinated water molecules share electronic density with the positive cationic centers. After water molecules are removed from the framework, the local electronic density decreases. This is electrically analogous to the oxidation of the metals. Experimental data complementing this observation can be found in Figures S1–S4 in Supplementary Materials.
So far, it has not been considered whether O3 reacted with the metal coordinated to the nitrogen atom in the C≡N ligand, the metal coordinated to the carbon atom in the C≡N ligand, the C≡N itself or with several chemical species at the same time. To get a deeper understanding, we choose the CuHCC compound. The oxidation Cu2+/Cu3+ has a potential of −2.3 V [38], while the standard reduction potential for O3 is 2.07 V [38]. Therefore, the O3 standard reduction potential is insufficient to oxidate the Cu2+. This result is consistent with the small shift observed in the ν(CN) band of the ozonized CuHCC relative to the as-synthesized sample (see Figure S5 in Supplementary Materials). This result suggests that the Co(CN)63− building unit does not interact with O3.
The local symmetry of the metal coordinated to the nitrogen end of cyano ligands in M3[Co(CN)6]2·nH2O ( M = Mn and Co ) is not strictly octahedral. However, the observed Raman spectra do not strongly deviate from that expected using the selection rules of Fm 3 ¯ m crystallographic space group (Figure S6 in Supplementary Materials). Assignments for MnHCC have been made considering [31] (Table 1). Both materials, MnHCC and CoHCC, have the same four Raman active modes:
  • A 1 g stretching mode of C≡N.
  • E g stretching mode of C≡N.
  • F 2 g stretching mode of Co−C≡N.
  • F 2 g stretching mode of C−Co−C.
There are no active modes for the M3[Co(CN)6]2 ( M = Mn and Co ) framework. The signal-to-noise ratios of CoHCC and CoHCCOz Raman spectra are low due to the high contribution to the background from samples’ fluorescence. The quality of the spectra prevented their analysis.
The ν 1 and ν 3 bands of the MnHCC Raman spectrum are located at 2192 c m 1 and 2173 c m 1 , respectively. These lines shift to higher frequencies (2170 c m 1 and 2177 c m 1 ) on the CoMnO3 spectrum (Table 1). The MnHCC Raman spectrum in the Co−C stretch and Co−C−N deformation region is expected to show three bands. Instead, a broad band at 480 c m 1 is present. This band can be resolved for ν 2 at 484 c m 1 and ν 4 at 469 c m 1 . Both frequencies contribute to the ν 10 at 480 c m 1 . The ozonized sample has the ν 2 band at 486 c m 1 , the ν 4 band at 470 c m 1 and the ν 10 band is shifted to 484 c m 1 . In the low energy region, a broad peak is observed for MnHCC at 202 c m 1 . This broad band has been assigned to an F 2 g symmetry mode and C−Co−C deformation ν 11 . After ozonization, the band turns broader. Additionally, MnHCCOz spectra have three new small bands at 2438 c m 1 , 1054 c m 1 and 581 c m 1 .
Raman spectra provide structural and bonding information [37]. On the structural side, the general agreement of MnHCC Raman active modes with Fm 3 ¯ m selection rules is consistent with an octahedral environment for [Co(CN)6]3− building units. The widening of the C−Co−C band in the MnHCCOz spectrum after ozonization suggests a symmetry reduction around the Co sites. It could be due to structural deformations around the exposed metallic centers caused by electric density changes after the reaction with ozone. To understand how changes in the nature of chemical bonds affect the Raman spectra, it is convenient to note that the oxidation of the metal coordinated to nitrogen atom and dehydration have similar effects. Both processes reduce the charge density in the metal coordinated to the nitrogen. Hence, observed Raman modes in MnHCCOz spectrum can be compared with previous reports of MnHCC dehydrated crystals [31]. The shift in MnHCCOz of ν 1 , ν 2 , ν 3 and ν 4 to higher frequencies relative to the corresponding modes in MnHCC suggest that the Mn−N bond has been strengthened after ozonization. This strengthening is consistent with infrared experimental results provided in this section and total diffraction experimental results discussed in Section 2.2.

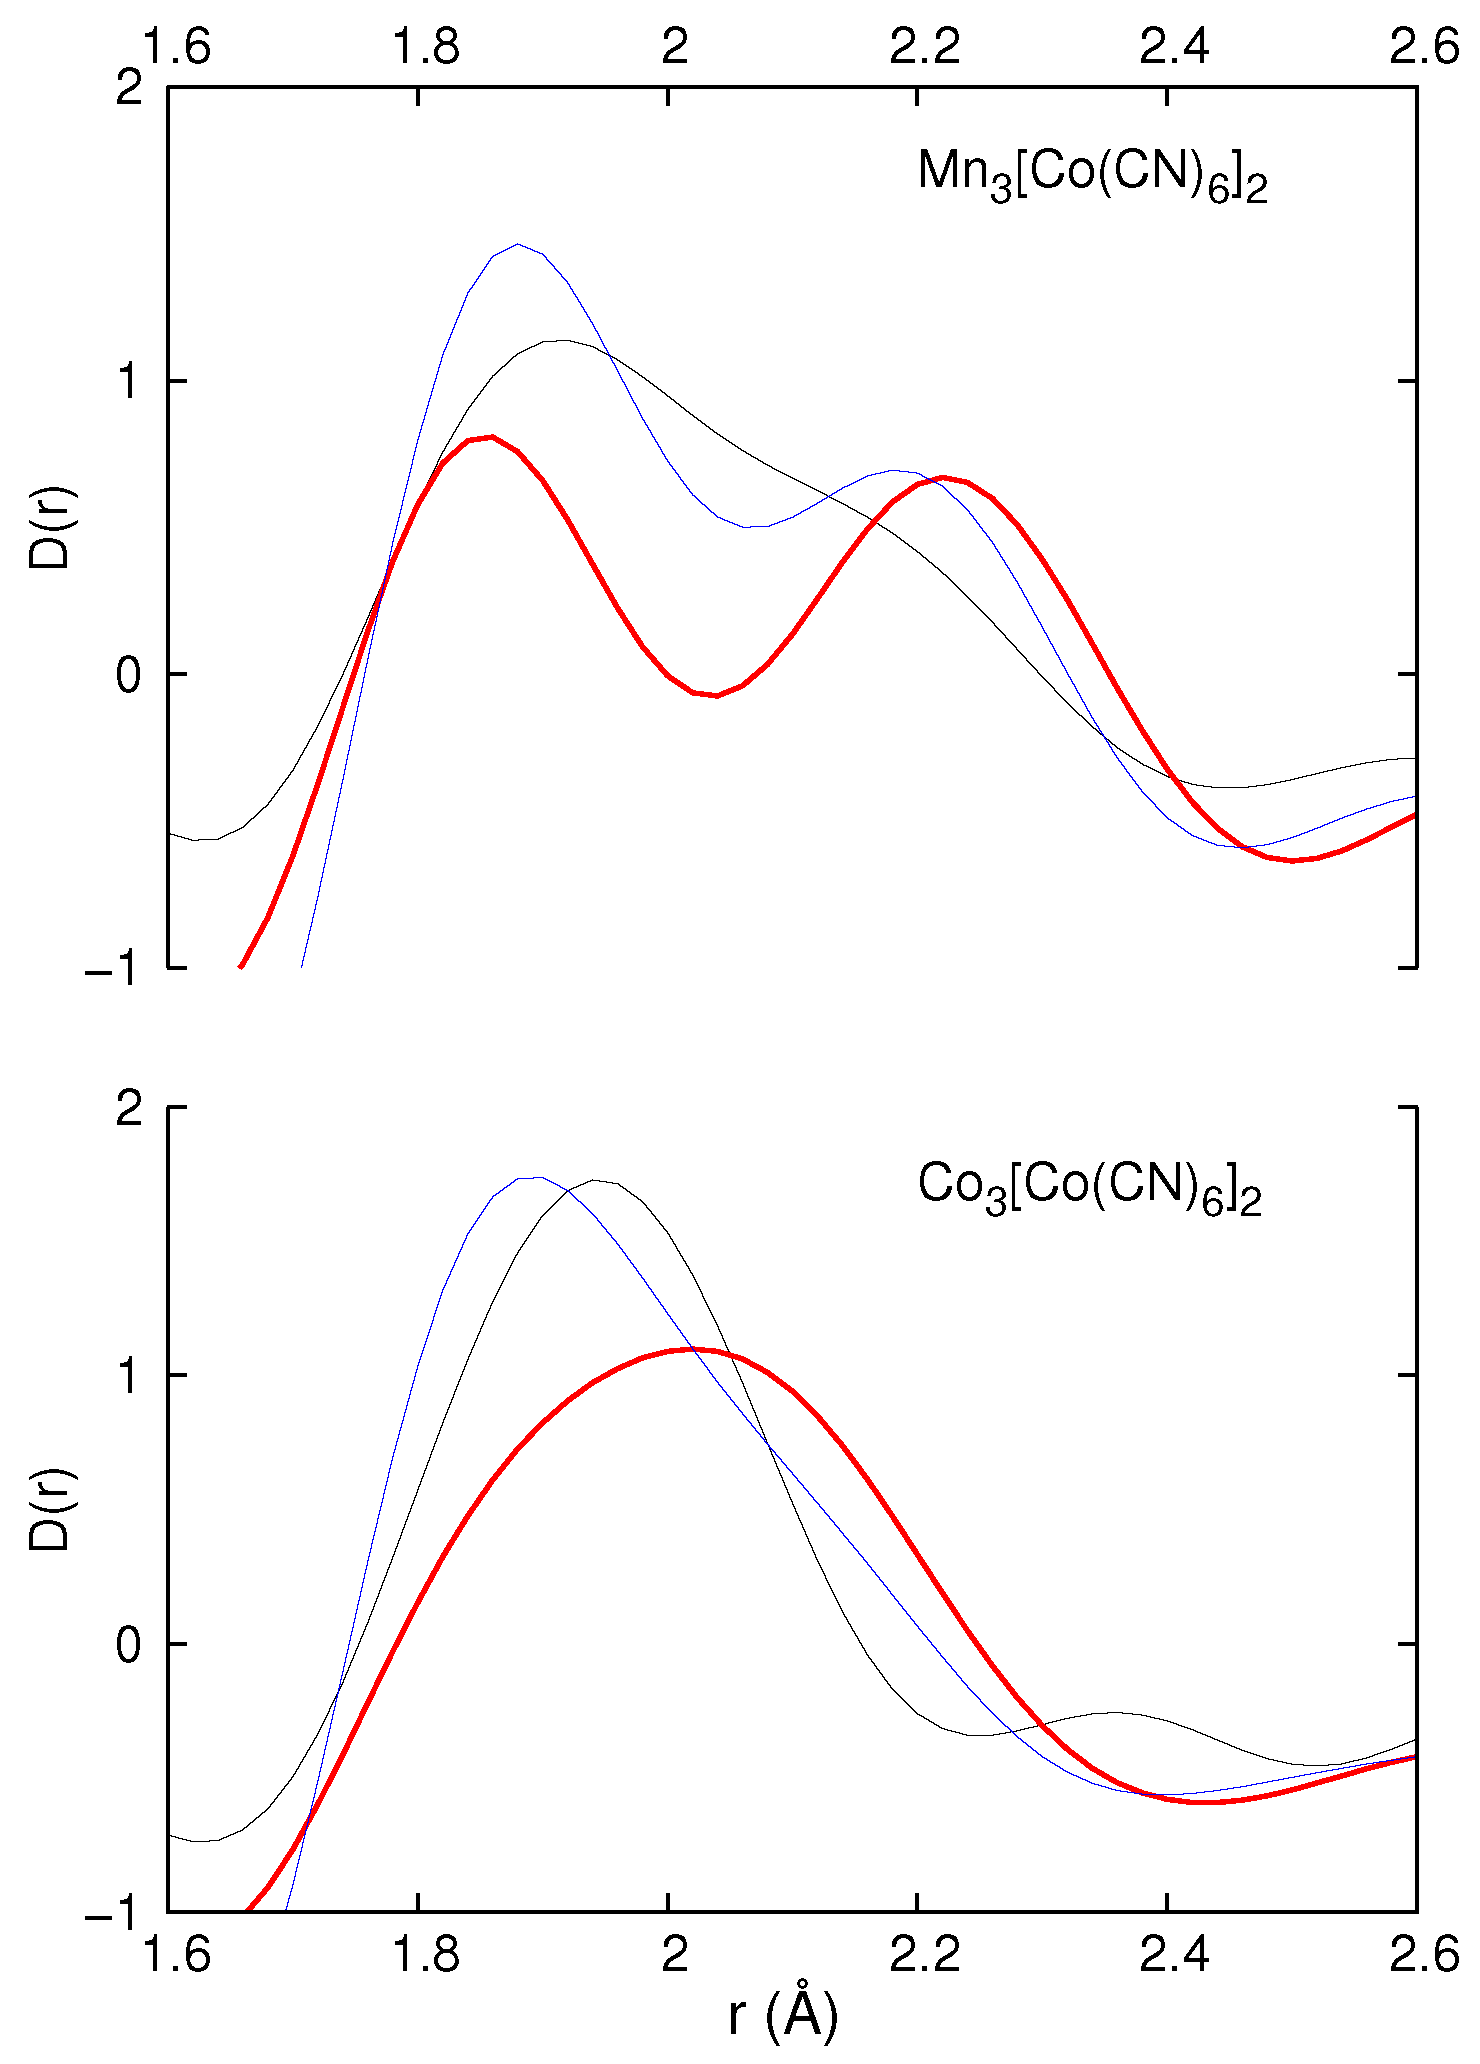
2.2. X-ray Diffraction

According to MnHCC and CoHCC powder X-ray diffraction patterns (Figures S7 and S8 in Supplementary Materials), they crystallize in the Fm 3 ¯ m spacial group, in agreement with previous reports [39,40,41]. The crystalline system continues to be cubic, and there is no indication of a change in the crystallographic space group due to dehydration or exposure to ozone. Cell parameters decrease after both processes for both materials (Table 2). The unit cell volume is reduced with dehydration by 3% for MnHCC and by 2% for CoHCC. After being exposed to ozone and re-hydrated, the analysis of the diffraction patterns indicates the presence of two phases for MnHCC, one with a cell parameter a = 10.3511 ( 6 ) Å , corresponding to a 2% volume contraction, and another with a cell parameter of a = 10.2734 ( 8 ) Å , corresponding to a 4% cell contraction. These two phases suggest the existence of two different oxidation states for manganese. The contraction in the CoHCC cell volume was 3% relative to the as-synthesized phase.
The MnHCC differential correlation function has two maxima at around 1.9 Å and 2.4 Å (Figure 2) in agreement with reported distances for Co−C and Mn−N bonds [11]. A similar behavior is observed for CoHCC. However, in this case, the peak corresponding to the Co−N distance (∼1.9 Å) overlaps with the peak corresponding to the Co−C distance (Figure 2). The Co−C peak shifts to higher distances in the dehydrated samples, and the Mn−N and Co−N peaks shift to lower distances (Figure 2); so, the bond distance Co−C increases, and M−N with M = Mn and Co is shortened. The ozonized sample shows a behavior similar to that in a dehydrated state. This may be linked to the oxidation of the metal coordinated to the nitrogen end of cyano ligands, as was suggested by FTIR analysis.

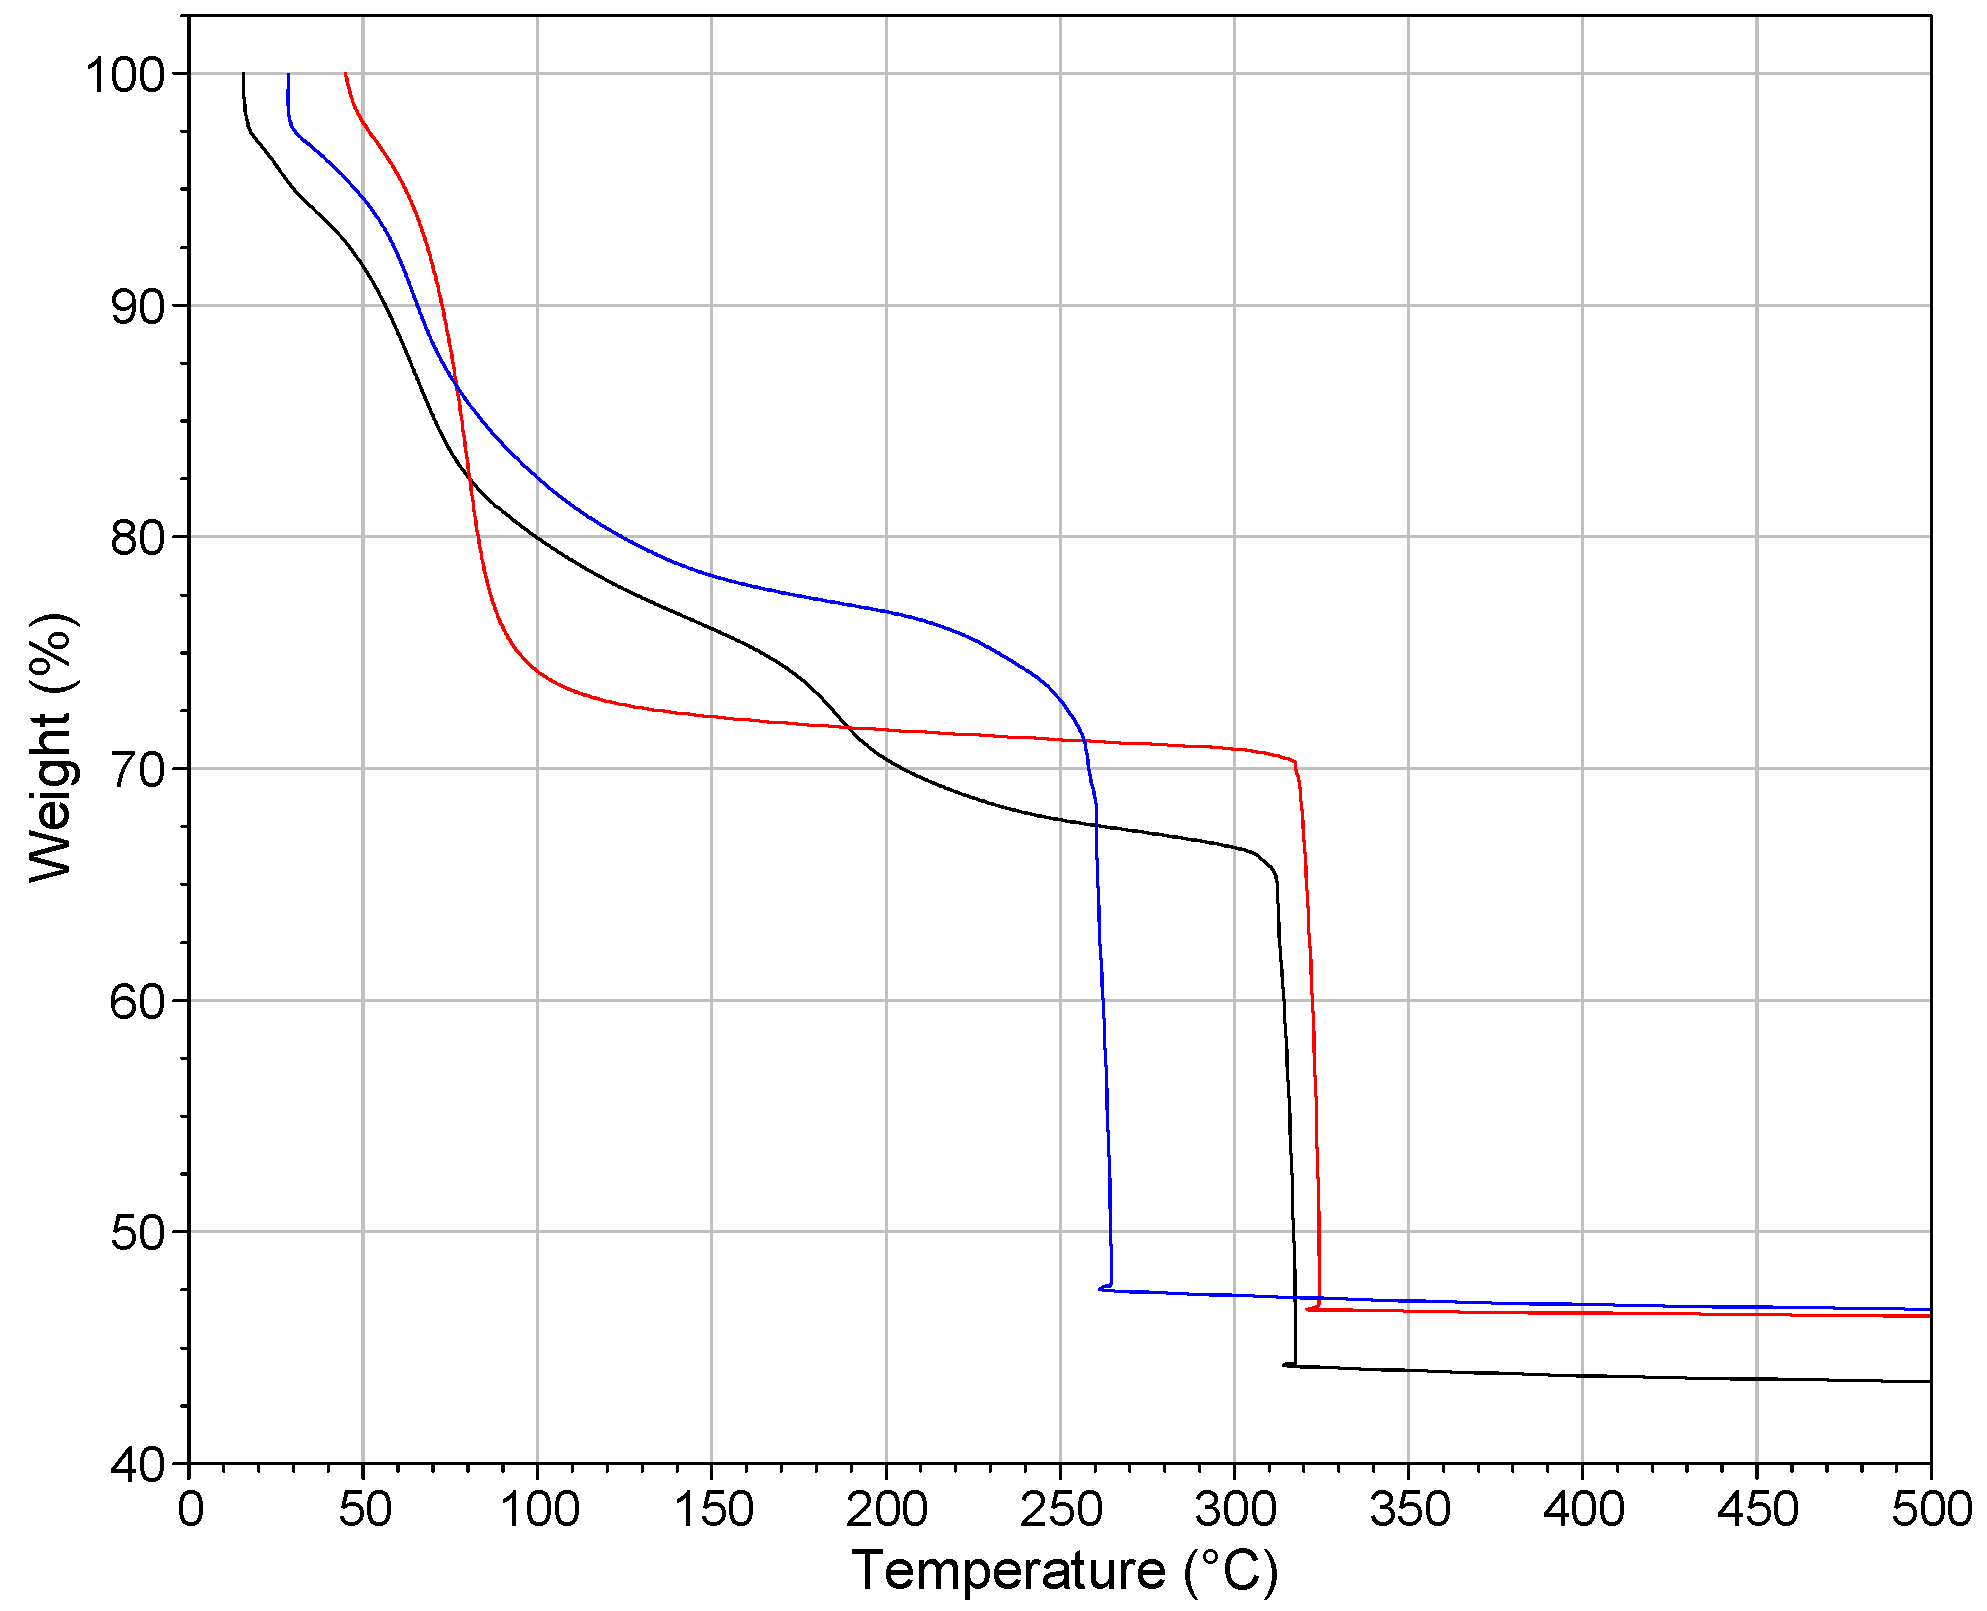
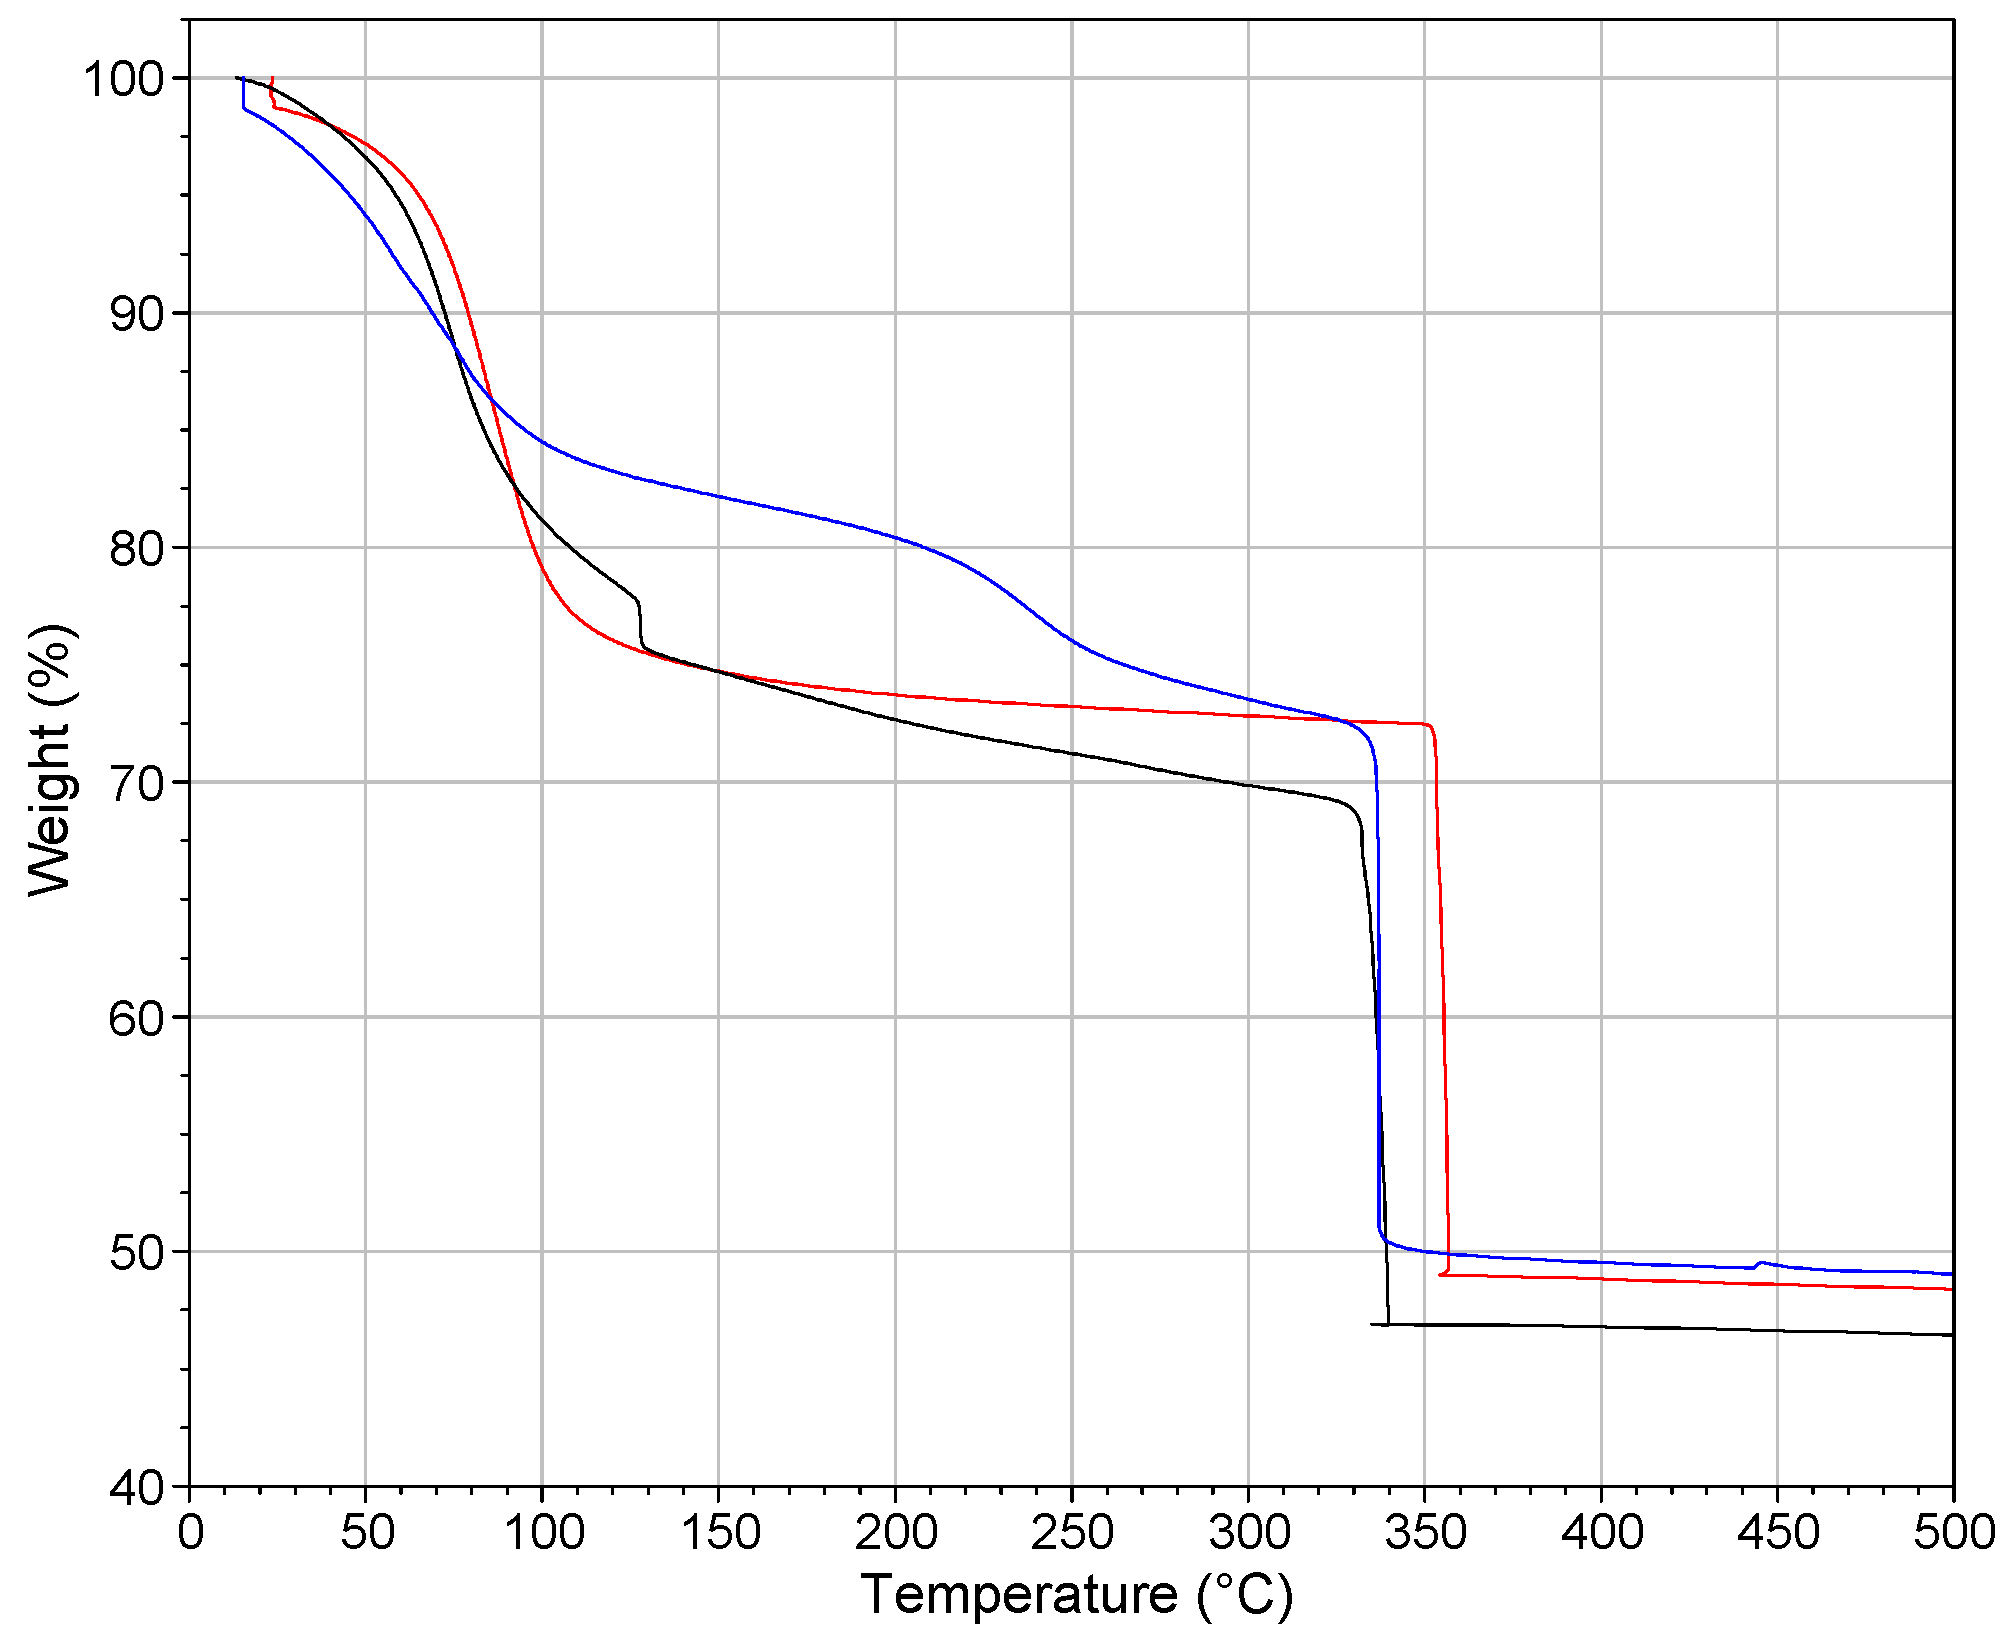
2.3. Thermogravimetric Analysis
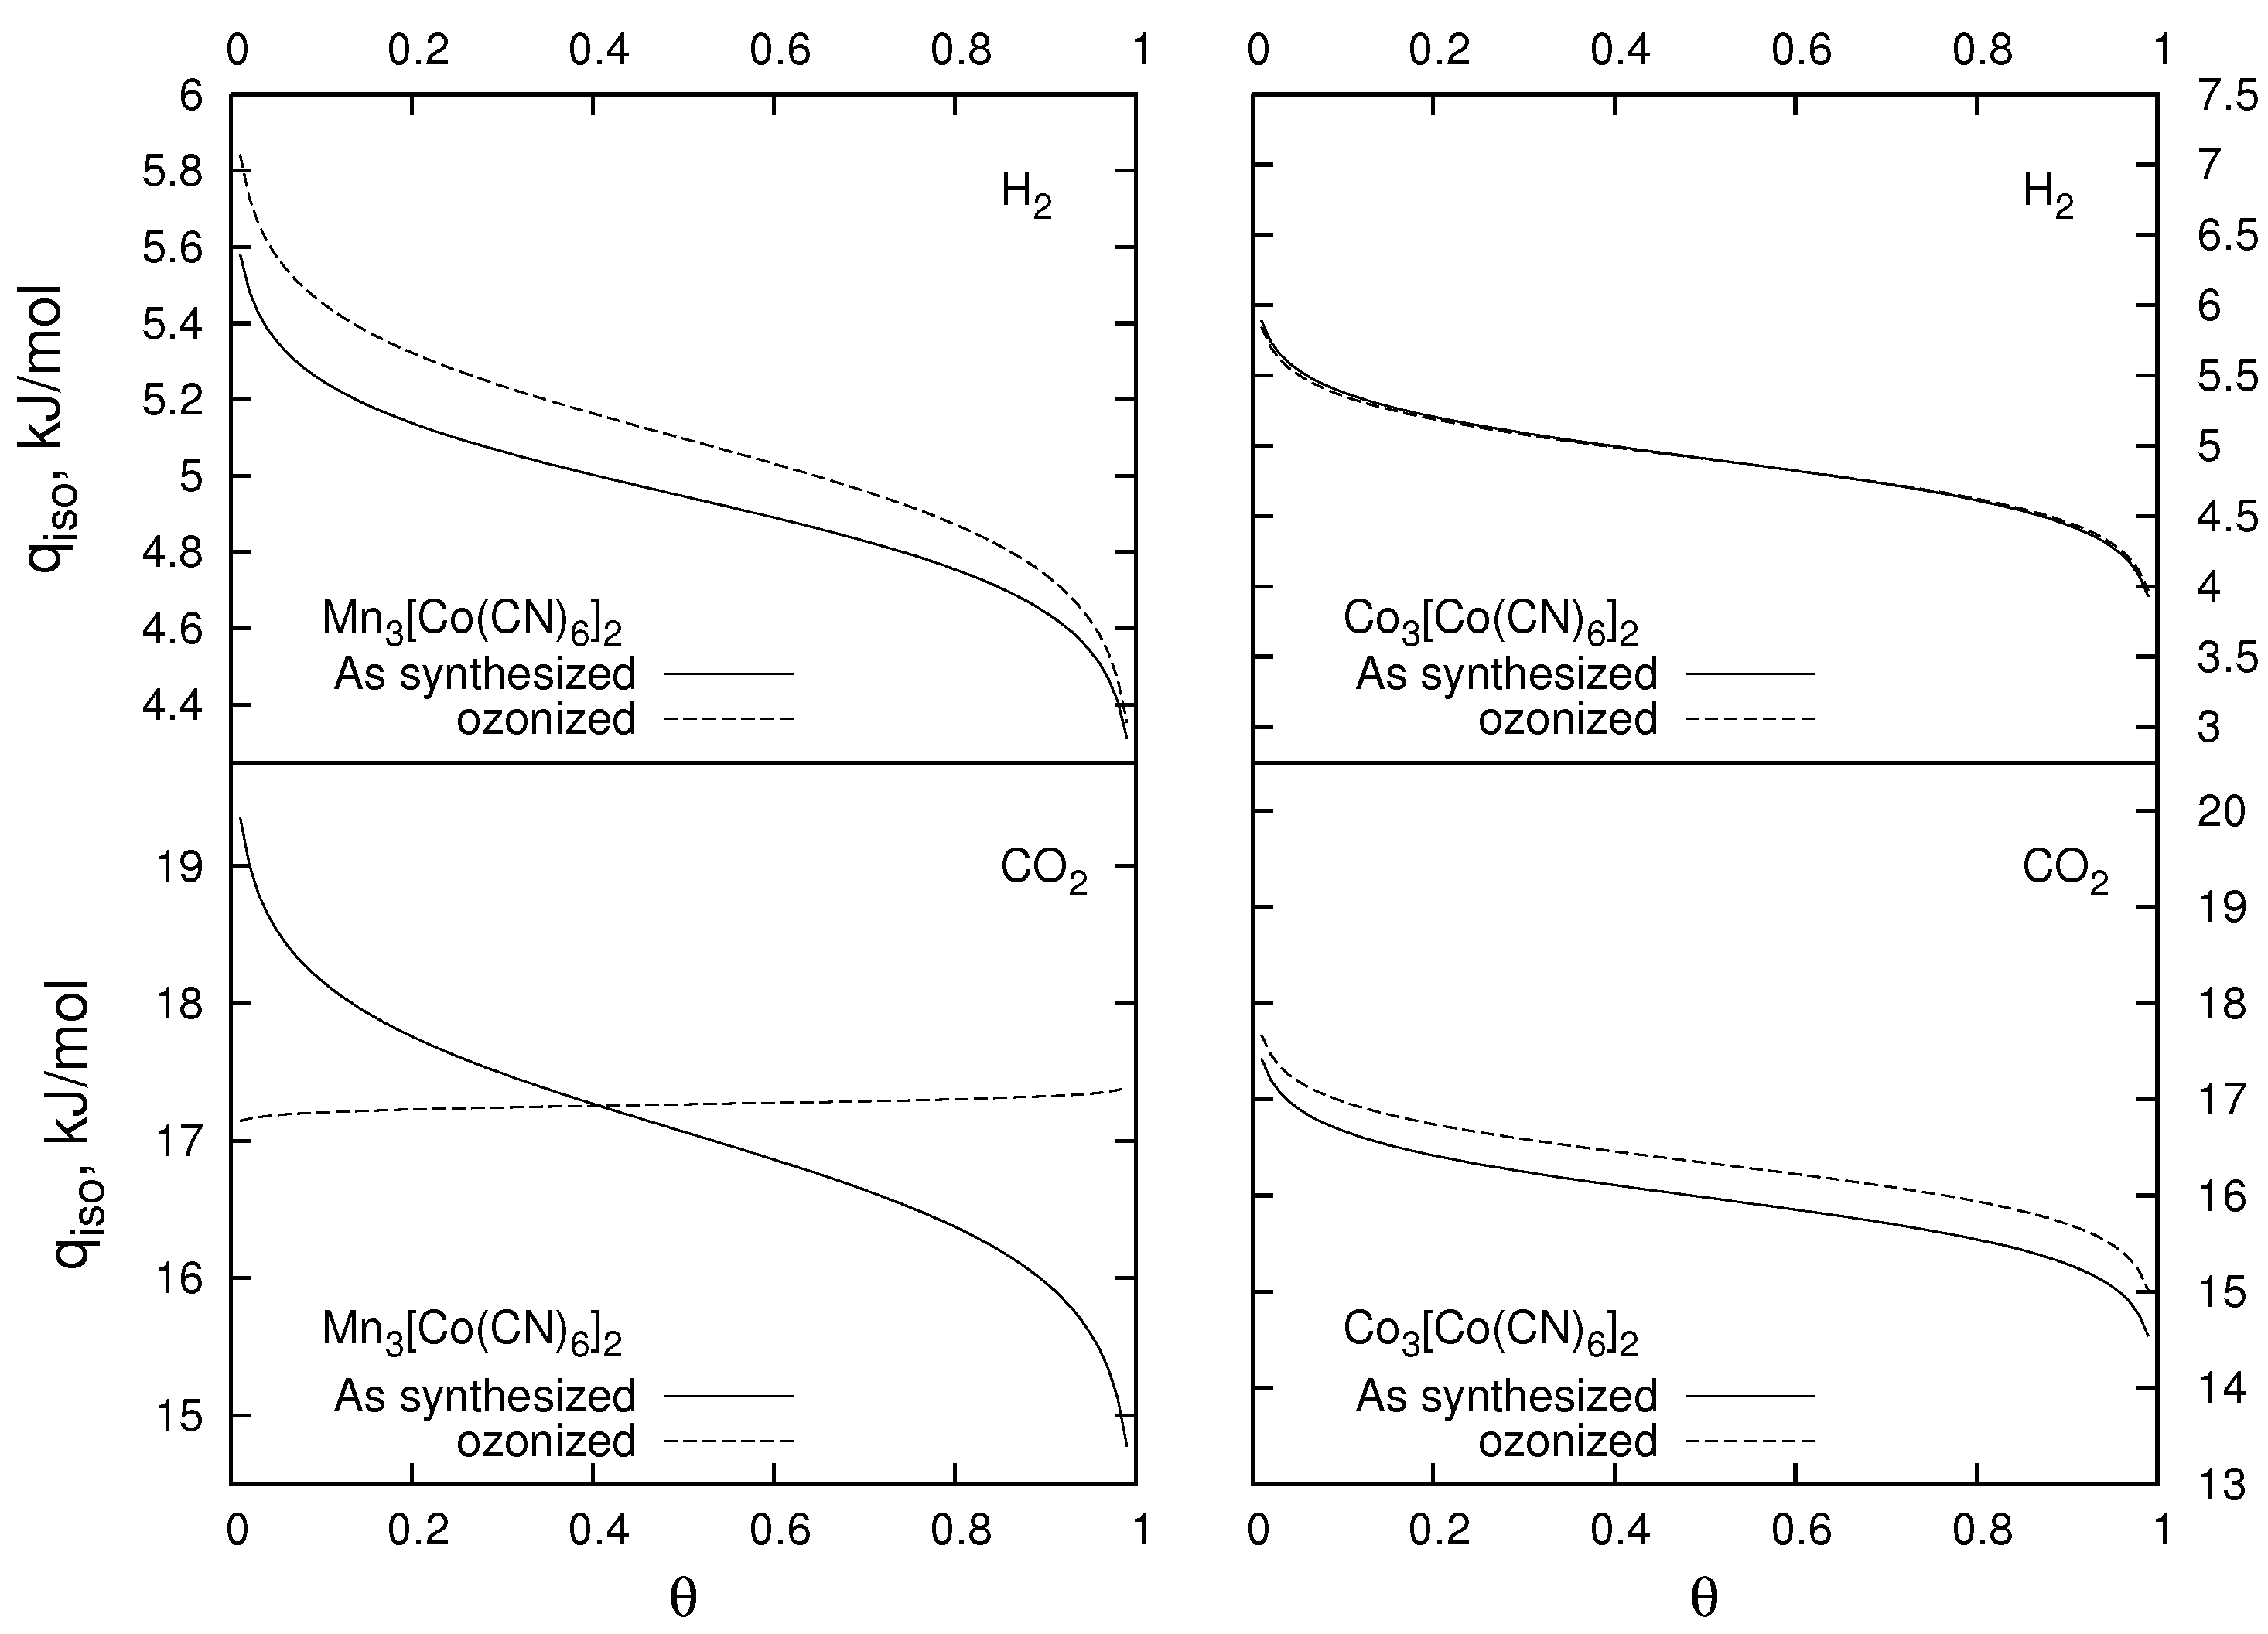
Thermogravimetric curves of MnHCC and CoHCC show two thermal events as a result of dehydration and decomposition processes (Figure 3 and Figure 4). Dehydration in CoHCC starts at room temperature and finishes at 313.10°C (weight loss of 29.48%). For MnHCC, the same event finishes at 346.26°C (weight loss of 27.47%). First derivative curves indicate a maximum dehydration rate at 79.44°C for CoHCC and at 86.36°C for MnHCC. On heating, the water is lost through a continuous process independent of its nature (coordinated or non-coordinated). Non-coordinated water molecules abandon the solid together with a fraction of the coordinated ones probably trough a cooperative process. As a consequence, the thermogravimetric curves show no intermediary inflections (Figure 3 and Figure 4). The samples’ hydration degrees were estimated from weight losses. According to the crystal structure, both as-synthesized samples have six coordinated water molecules per formula unit [11]. The estimated numbers of uncoordinated water molecules per formula units, after fixing six coordinates, for MnHCC and CoHCC were 6.51 and 8.08, respectively, in agreement with previous reported values [11]. The decomposition event occurs from 346.26362.33°C in MnHCC (23.53% weight loss) and from 313.10326.61°C in CoHCC (23.89% weight loss). Both weight losses were associated with the loss of the CN groups. General dehydration-decomposition models are described in the Section 4 of Supplementary Materials (Figures S11–S16).
Dehydration events shift to higher temperatures after frameworks’ ozonization. Ionic hydration enthalpy and oxidation number are positively correlated (Co2+: 1996 k J / mol , Mn2+: 1921 k J / mol , Co3+: 4651 k J / mol , Mn3+: 4544 k J / mol ) [42]. The dehydration events’ shift in ozonized samples is consistent with a higher oxidation state of cations coordinated to the nitrogen end of cyano ligands, suggested in Section 2.1 and Section 2.2. A complete dehydration of the ozonized samples cannot be accomplished without partial decomposition of the frameworks (Figure 3 and Figure 4). This limitation motivated the use of methanol to saturate the samples. Methanol molecules evolve at temperatures lowers than water (Figure 3 and Figure 4). This allows one to obtain greater accessible volume than in hydrated samples at the same temperature. However, complete removal of the methanol molecules also compromises the framework’s integrity.
The starting temperature for the decomposition events decreases after the ozonization (Figure 3 and Figure 4). At this point, almost all solvent molecules have evolved, and the framework stability is determined by three bonds: Co−C, C≡N and N−M ( M = Mn and Co ). In the formula unit M3[Co(CN)6]2 ( M = Mn and Co ), there are: 12 Co−C bonds, 12 C≡N bonds and 3 N−M bonds. Most of the C≡N ligands evolve thermally without breaking the triple bond. Consequently, framework stability is mainly determined by metal-ligand bonds. According to Section 2.1 and Section 2.2, the Co−C bonds become weaker, and the N−M are strengthened. The former contributes to the lower starting temperature for the decomposition events, while the latter increases it. The presence of many more Co−C bonds in the structure results in lowering the starting temperature for the decomposition events.

2.4. Gas Adsorption

The pore distribution of cobalt and manganese hexacyanocobaltates and the existence of open metal sites in their pores make these materials interesting molecular sieves [11,43]. Section 2.1, Section 2.2 and Section 2.3 described the effect of ozonization on the: hexacyanocobaltates frameworks, open metal sites and thermal evolution of adsorbed water and methanol molecules. The cell contraction due to ozonization shifts the pore width distribution to lower values, while the increase in the open metal sites’ oxidation number changes the adsorption energy distributions and the isosteric heat functions. The effect of these changes on water and methanol molecules is the shift of the desolvation event to higher temperatures, as was remarked in Section 2.3. This shift prevents such solvent molecules from being completely removed without compromising the integrity of the framework. In this section, we extend the analysis of adsorption to the retention of two important molecules: H2 and CO2. The analysis will be restricted to samples saturated with methanol, because they allow the removal of a greater amount of solvent without compromising the integrity of the lattice.
It is a great challenge to obtain the equation of an isotherm from a model that takes into account the details of the adsorption process in molecular sieves with wide pore distributions and pores with heterogeneous surfaces. MnHCC and CoHCC are molecular sieves with at least seven different pores due to vacancies of [Co(CN)6]3− building units [44] and one pore in the crystal cell octant. Other types of pores can be formed when vacancies overlap. Besides, surface heterogeneity due to the presence of open metal sites and residual solvent molecules make the system even more complex. However, adsorbate-adsorbent systems involving MnHCC, CoHCC, H2 and CO2 can be treated as a non-ideal vacancy solution, similar to the hypothetical solution used in the derivation of Langmuir–Freundlich-type isotherm (1) ([45], supporting information). The Langmuir–Freundlich equation contains only three parameters: limit capacity n m , related with accessible volume in the adsorbent; pressure at half volumetric filling p 1 2 ; and relative activity coefficient exponent ( g ) . The last two parameters are related to the isosteric heat of adsorption (Equation (2)). The Langmuir–Freundlich isotherm can provide information about changes in pore size and adsorption energy distributions.
The limit capacity of MnHCC and CoHCC samples is reduced for both H2 and CO2 after ozonization (Table 3). The most likely causes of this reduction are the contraction of cell parameters with the ozonization (Table 2) and the existence of some methanol molecules in the porosity. The greatest reduction of the limiting capacity occurred in the MnCo sample, especially for CO2, while for the CoHCC sample, the limit capacity remains almost constant. Apparently, the cell contraction combined with the existence of some strong coordinated methanol molecules reduces the accessible pore volume. This phenomenon is not observed in the H2 isotherm due to its lower molar volume.
The Langmuir–Freundlich parameters p 1 2 and g for CoHCC do not change significantly with ozonization (Table 3). Therefore, the H2 and CO2 isosteric heats of adsorption for the CoHCC as-synthesized and ozonized samples are similar throughout the θ range (Figure 5). The CoHCC sample had to be degassed at a temperature 70 K higher than MnHCC to accomplish approximately the same weight loss percent. This temperature increment reverted the crystalline structure to the state at which it was before being ozonized as evidenced by the position of the ν(CN) band (Figure 6). The MnHCC sample is in general more stable than CoHCC, even at the ozonized state (Figure 3 and Figure 4). This probably explains the increment in the isosteric heat of H2 adsorption observed in the ozonized MnHCC relative to as-synthesized MnHCC. The access of some H2 molecules to modified open metal sites can increase the average interaction. This tendency changes in the CO2 isotherm. Four factors could explain this change: the electric quadrupole moment, the characteristic rotational temperature ([46], p. 662) (0.561 K for CO2 and 88 K for H2), the experimental temperature (liquid nitrogen for H2 and 273.15 K for CO2) and the molar volume (2.845 × 10⁻⁵ m 3 / mol for H2 and 4.290 × 10⁻⁵ m 3 / mol for CO2). Open metal sites are positive charge centers, and the quadrupole interaction energy minimum is reached with the molecular axis parallel to the plane of the surface for H2 and perpendicular for CO2. The characteristic rotational and experimental temperatures suggest that CO2 molecules are rotating while H2 ones are not. The increase of molar volume reduces the accessibility of CO2 molecules to the porosity. Combining all of the previous elements and considering that the quadrupolar interaction is a short-range interaction, we can conclude that the rotation of the CO2 molecule and the collisions derived from the activation of this degree of freedom lead to an average adsorbate-adsorbent interaction weaker than the average adsorbate-adsorbate interaction. The predominance of adsorbate-adsorbate interactions explains the shape of the isosteric heat curve in the sample treated with ozone, saturated with methanol and partially desolvated.

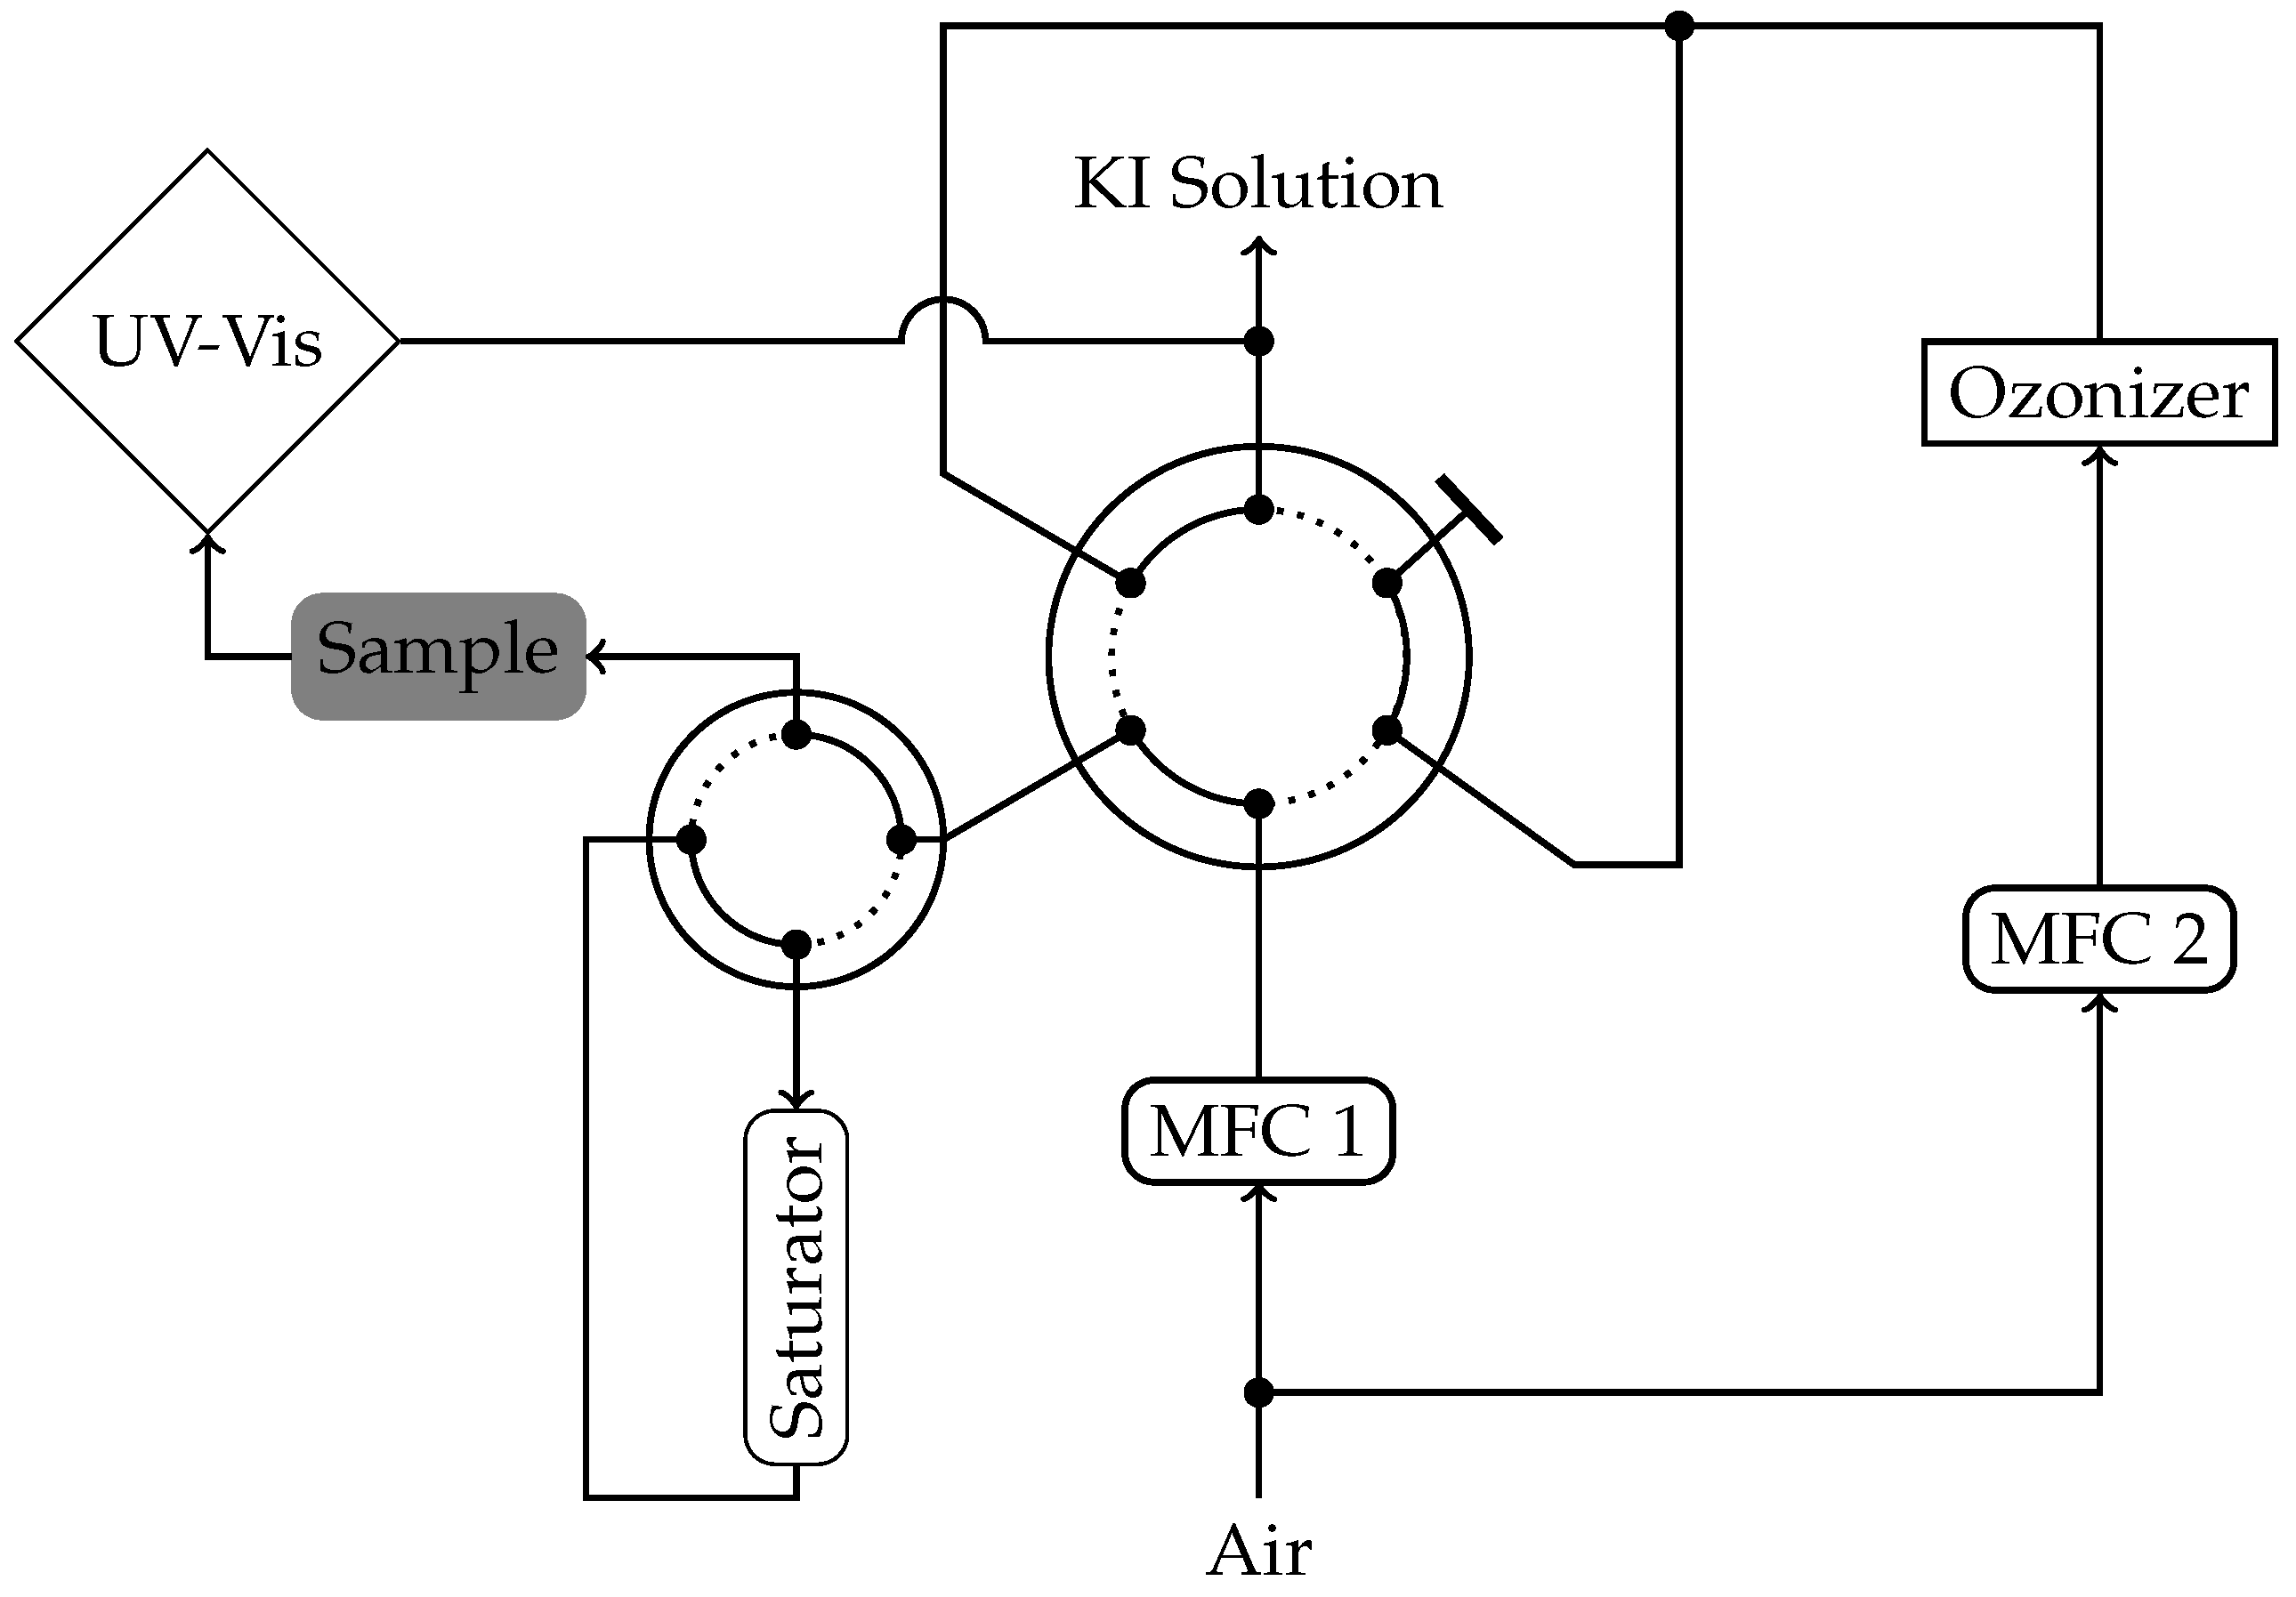
3. Materials and Methods

The synthesis of M3[Co(CN)6]2·nH2O, ( M = Mn and Co ) powders was carried out mixing 0.05 M aqueous solution of K3[Co(CN)6] (Sigma-Aldrich, Mexico City, Mexico 12902 ACS 97%) and MnSO4 monohydrate (Sigma-Aldrich 221287, ACS 98%) or CoSO4 heptahydrate (Sigma-Aldrich C6768, ACS 99%). The resulting precipitated was aged for a week and separated from the mother liquor by centrifugation. The precipitate was washed at least 5 times with 40 m L of distilled water to remove the accompanying ions and finally air dried.
Infrared spectra were collected from 4000 c m 1 to 600 c m 1 with a Nicolet FT-IR 6700 Thermo Scientific spectrophotometer, using the Attenuated Total Reflection technique (ATR).
Structural characterization for hydrated samples was performed from XRD data at room temperature using an Empyrean PANalytical diffractometer with monochromatic CuK α λ = 1 . 54183 Å radiation in a 2 θ range from 5° to 90° with a scan speed of 0.11814 ° / s and step size of 0.01°. Hydrated samples were measured using a steel spinner stage, ozonized samples in a steel flat stage and dehydrated samples on a BGCTcapillary stage. The structural refinements from the obtained XRD powder patterns were carried out with the software FULLPROF, June 2015 version, and pseudo-Voigt peak shape functions were used to fit diffraction peaks.
For the total diffraction experiment, 0.5 m m borosilicate capillaries were used. These were mounted on a PANalytical Empyrean diffractometer, equipped with a GaliPIX detector and an Ag X-ray source λ = 0 . 559421 Å . On the incident beam side, diffractometer optics included a focusing mirror, 0.25° divergence and anti-scatter slits and a 0.04 rad Soller slit. On the diffracted beam side, a 0.04 Radian Soller slit was used. As the data collection strategy, measurements of the scattering pattern were split into the following regions: low Q 2° to 43° for 10 repeat measurements, mid Q 41° to 90° = 55 repeats , high Q 89.5° to 146.3° = 70 repetitions . The splitting and longer measuring at the high angle (large Q) was performed because this region is the most important for a good signal in the PDFwhen it is Fourier transformed. The time per step (degrees) is the same across all 3 regions. However, it is not straightforward to quantify it, as we are using a detector in a scanning line mode. The pair distribution function was calculated from PDFgui software using the D ( r ) formalism.
The dehydration process for MnHCC and CoHCC powder samples was performed under vacuum (2.4 × 10⁻² mbar), at 110 ° C and 90 ° C , respectively, for 17 h , inside a capillary BGCT 0.5 m m . A thermal bath of glycerol was used. The temperature was regulated using a temperature controller. After dehydration, the capillary was cut using a blowtorch, and the glass was sealed with heat and wax.
Raman spectra were recorded with a Raman-Luminescent microscope Rammics M532 and Olympus CX-41 using a Linear CCD Array detector with a spatial resolution 1 μ m and efficiency of 7000 counts / ( m W   s ) . The spectrometer works with a laser wavelength 532 n m (power from 20 m W to 30 m W ) at a spectral resolution from 5 c m 1 to 8 c m 1 . The sample was exposed to 200 scans at 20% of attenuation.
Thermogravimetric analyses were carried out in a TA Instruments Hi-Res™ thermogravimetric analyzer TGA Q5000. The heating rate was dynamically controlled with instrumental resolution of 5 and Hi-Res sensitivity of 1.00. The experimental atmosphere was created combining 10 m L/min dry nitrogen balance flow and 25 m L/min dry air oven purge flow. The mass loss profiles of the studied samples were analyzed using the software Universal Analysis 2000 v4.5A.
An ozonization experimental setup was designed and implemented to modify post-synthesis the powder samples using a flow of ozone-enriched dry air in a selective manner (Figure 7). Before the post-synthesis modification, the samples were dehydrated in situ in order to facilitate direct interaction between the open metal sites and the ozone molecule. This experimental setup has two mass flow controllers: a Sierra Smart Trak C100L (MFC 1) and an MKS 1179A controlled by Single Channel Power Supply MKS 246C (MFC 2). A Vici E60 six-port two-position switching valve, manually actuated with an electric actuator, was used to switch the flux during the experiment. A Swagelok SS-43YFS1 four-port two-position switching valve, manually actuated, allowed switching the flux through the saturator with methanol (methanol HPLC Tecsiquim, 99.8%, CAS# 67-56-1). Additionally, an ozonizer Ozono Carbars with an approximated ozone production of 100 m g / h and a UV-Vis Spectrophotometer Varian CARY 400 with a micro flow cell of a path length UV of 50 m m were used. An extra-dry air tank from INFRA, Code 32015, was used to feed the system. The ozone-enriched air flow was neutralized using a solution of KI at 1 M. All of the connections were made with PTFE tubing.
The ozonization system was operated in two different modes: dehydration and ozonization (Figure 7). In Position A of the switching valve, the sample is dehydrated, while in Position B, it is ozonized. In the dehydration mode, the incoming air flux was split into two fluxes. One of them passed through MFC 1 operating at 100 sccm and through the sample, while the sample was heated at 200 ° C . The other part of the dry air flows through MFC 2 operating at 40 sccm and then through the ozonizer, where ozone is produced at a rate of 100 m g / h . The resulting enriched dry air flux goes directly to the neutralization solution without any contact with the sample. After dehydration is completed, the valve is changed manually to Position B (Figure 7). The dry air that fluxes through MFC 1 mixes with the ozone-enriched air flux coming from the ozonizer and goes directly to the sample. The volumetric concentration of ozone is determined quantitatively using the UV-Vis spectrometer applying the Lambert–Beer law [47]. The ozone molecules in the gas phase have a maximum adsorption at 253.7 n m . Quantitative determination of the volumetric concentration of ozone using the maximum amplitude of the 253.7 n m adsorption band is an absolute measurement with ±1% of accuracy [47]. Ozonization stopped when ozone consumption was undetectable. This experimental design allows one to control the ozone concentration in the enriched air using the mass flow controllers. The methanol saturation of the sample avoiding exposure to the environment was achieved by switching the four-port valve.
The H2 and CO2 adsorption isotherms were recorded using a Micrometrics ASAP 2020 analyzer. The experiments were performed in a liquid nitrogen bath at a local atmospheric pressure (≈ 77 . 981 Pa ) for H2 and at 273.15 K for CO2 isotherms. The Micromeritics Chiller Dewar option and NESLAB refrigerated bath Model RTE7 were combined to guarantee the cryogenic condition for CO2 isotherms. About 100 m g of samples were degassed for 1 h at a pressure below 1.3 Pa . The degassing temperatures changed according to the temperatures at which the evolution of the solvent ends in the thermogravimetric curves (383 K for the original samples, 403 K for MnHCCOz and 473 K for MnHCCOz). After degassing, the sample tube was back filled with dry nitrogen and transferred to the analysis port, and the evacuation was continued for another 12 h at room temperature. Then, the free volume was measured with helium, and the samples were degassed again for another twelve hours at room temperature, previous to recording the H2 adsorption isotherms. After H2 adsorption isotherms finished, the degassing process at room temperature was repeated in the analysis port, and the CO2 adsorption isotherm was run. All isotherms were fitted with a Langmuir–Freundlich-type isotherm (1) derived from vacancy solution theory ([45], Supporting Information):
n a = n m p 1 2 1 g p eq 1 g 1 + p 1 2 1 g p eq 1 g
where p eq is the equilibrium pressure, n a = n a p eq is the quantity adsorbed, n m = lim p eq n a p eq , p 1 2 is the pressure at half volumetric filling and g is the relative activity coefficient exponent. Fitted p 1 2 and g parameters were used to calculated the isosteric heat of adsorption by Equation (2).
q iso = R T ( 1 g ) ln θ 1 θ + R T 1 ln v M R T p 1 2
where R is the gas constant, T is the temperature, θ is the volume filling, v M is the molar volume of the adsorbate and the rest of the parameters have the same meaning as in Equation (1). Derivation of Equation (2) from the vacancy solution model and the values of v M can be found in [45], Supporting Information.

4. Conclusions

The frameworks of both MnHCC and CoHCC samples interact with a mixture of dry air and ozone, thus oxidizing the metals coordinated to the nitrogen end of the cyano ligand. This interaction causes a reduction of the bond distance between these metals and the nitrogen. Additionally, an increase of the Co−C bond distance, as well as a reduction of the cell volume after ozonization were observed. The interaction with ozone also shifts the desolvation events of water and methanol to higher temperatures, overlapping with the decomposition event. This overlapping prevents a complete framework degassing without compromising the integrity of the crystal lattice. The limiting capacity of H2 and CO2 retention is reduced with ozonization due to partial occupation of solvent adsorption sites and reduction of cell volume. The partial molar enthalpy of CO2 adsorption does not change significantly, while that of H2 in MnHCC increases.

Supplementary Materials

The following are available online at www.mdpi.com/2073-4352/7/1/16/s1. Figure S1. Full FTIR spectra of MnHCC: (a) as synthesized; (b) partially dehydrated; (c) ozonized and partially dehydrated; (d) ozonized and hydrated. Figure S2. Section of ν(CN) bands of MnHCC FTIR spectra: (a) as synthesized; (b) partially dehydrated; (c) ozonized and partially dehydrated; (d) ozonized and hydrated. Figure S3. Full FTIR spectra of CoHCC: (a) as synthesized; (b) partially dehydrated; (c) ozonized and partially dehydrated; (d) ozonized and hydrated. Figure S4. Section of ν(CN) bands of CoHCC FTIR spectra: (a) as synthesized; (b) partially dehydrated; (c) ozonized and partially dehydrated; (d) ozonized and hydrated. Figure S5. Section of ν(CN) bands of CuHCC FTIR spectra. Figure S6. Full Raman spectra of: (a) MnHCC as synthesized; (b) MnHCCOz saturated with methanol and then saturated in water vapor; (c) CoHCC as synthesized; (d) CoHCCOz saturated with methanol and then saturated in water vapor. Figure S7. X-ray diffraction powder patterns of MnHCC. Figure S8. X-ray diffraction powder patterns of CoHCC. Figure S9. Hydrogen adsorption isotherms at 77 K and carbon dioxide adsorption isotherms at 273.15 K of the degasified samples. Adsorption branch is plotted with filled symbols and desorption branch by open symbols. The isotherms on the unmodified samples is represented with circles and the isotherms of ozonized samples are represented by triangles. Lines are cubic spline of experimental data to guide the reader. Figure S10. Langmuir-Freundlich isotherm fit (dashed line) to experimental isotherms (red crosses). Figure S11. Thermogravimetric experimental curve for MnHCC as synthesized. Figure S12. Thermogravimetric experimental curve for CoHCC as synthesized. Figure S13. Thermogram of trimanganese bis(hexakis(cyano)cobaltate) as synthesized and ozonized. Figure S14. Thermogram of tricobalt bis(hexakis(cyano)cobaltate) as synthesized (continuous line) and ozonized (dashed line). Figure S15. Thermogram of trimanganese bis(hexakis(cyano)cobaltate) ozonized and saturated with methanol. Figure S16. Thermogram of tricobalt bis(hexakis(cyano)cobaltate) ozonized and saturated with methanol.

Acknowledgments

This research was partially supported by: the internal Project 6317 of “Centro de Investigación en Química Aplicada”, CONACyT Project 250848 and the DGAPA-PAPIIT IG-100315 project (funds for covering the costs to publish in open access). The authors thank: Alberto López Vivas, Omar Alejandro Pompa García, Raúl Reyes Ortíz, Lázaro Huerta Arcos, Adriana Tejeda Cruz and Karla Eriseth Reyes Morales for their technical assistance.

Author Contributions

María Laura Ríos and Jorge Balmaseda conceived of and designed the experiments. María Laura Ríos performed the X-ray diffraction and spectroscopy experiments. María Laura Ríos and Joelis Rodríguez-Hernández performed the X-ray powder and total diffraction analyses. Luis Felipe del Castillo and Jorge Balmaseda performed and analyzed thermal and adsorption experiments. All authors participated in the manuscript writing process.

Conflicts of Interest

The authors declare no conflict of interest.

Abbreviations

The following abbreviations are used in this manuscript:
MnHCCManganese(III) Hexacyanocobaltate(II) with molecular formula Mn3[Co(CN)6]2·nH2O
CoHCCCobalt(III) Hexacyanocobaltate(II) with molecular formula Co3[Co(CN)6]2·nH2O
CuHCCCopper(III) Hexacyanocobaltate(II) with molecular formula Cu3[Co(CN)6]2·nH2O
MnHCCOzOzonized MnHCC
CoHCCOzOzonized CoHCC
FTIRFourier Transform Infrared Spectroscopy
PTFEPolytetrafluoroethylene

References

  1. Barton, T.J.; Bull, L.M.; Klemperer, W.G.; Loy, D.A.; McEnaney, B.; Misono, M.; Monson, P.A.; Pez, G.; Scherer, G.W.; Vartuli, J.C.; et al. Tailored Porous Materials. Chem. Mater. 1999, 11, 2633–2656. [Google Scholar] [CrossRef]
  2. Pentimalli, M.; Imperi, E.; Bellusci, M.; Alvani, C.; Santini, A.; Padella, F. Silica-Metal Composite for Hydrogen Storage Applications. Crystals 2012, 2, 690–703. [Google Scholar] [CrossRef]
  3. Li, J.R.; Sculley, J.; Zhou, H.C. Metal-Organic Frameworks for Separations. Chem. Rev. 2012, 112, 869–932. [Google Scholar] [CrossRef] [PubMed]
  4. Li, C.C.; Yang, S.; Tsou, Y.J.; Lee, J.T.; Hsieh, C.J. Newly Designed Copolymers for Fabricating Particles with Highly Porous Architectures. Chem. Mater. 2016, 28, 6089–6095. [Google Scholar] [CrossRef]
  5. Breternitz, J.; Gregory, D.H. The Search for Hydrogen Stores on a Large Scale; A Straightforward and Automated Open Database Analysis as a First Sweep for Candidate Materials. Crystals 2015, 5, 617–633. [Google Scholar] [CrossRef]
  6. Bobbitt, N.S.; Chen, J.; Snurr, R.Q. High-Throughput Screening of Metal-Organic Frameworks for Hydrogen Storage at Cryogenic Temperature. J. Phys. Chem. C 2016, 120, 27328–27341. [Google Scholar] [CrossRef]
  7. Suh, M.P.; Park, H.J.; Prasad, T.K.; Lim, D.W. Hydrogen Storage in Metal-Organic Frameworks. Chem. Rev. 2012, 112, 782–835. [Google Scholar] [CrossRef] [PubMed]
  8. Sanz-Pérez, E.S.; Murdock, C.R.; Didas, S.A.; Jones, C.W. Direct Capture of CO2 from Ambient Air. Chem. Rev. 2016, 116, 11840–11876. [Google Scholar] [CrossRef] [PubMed]
  9. Sumida, K.; Rogow, D.L.; Mason, J.A.; McDonald, T.M.; Bloch, E.D.; Herm, Z.R.; Bae, T.H.; Long, J.R. Carbon Dioxide Capture in Metal-Organic Frameworks. Chem. Rev. 2012, 112, 724–781. [Google Scholar] [CrossRef] [PubMed]
  10. Beall, G.W.; Milligan, W.O.; Petrich, J.A.; Swanson, B.I. Crystal Structure and Raman Spectral Study of Ligand Substitution in Mn3[Co(CN)6]2·xL. Inorg. Chem. 1978, 17, 2978–2981. [Google Scholar] [CrossRef]
  11. Roque, J.; Reguera, E.; Balmaseda, J.; Rodríguez-Hernández, J.; Reguera, L.; del Castillo, L. Porous Hexacyanocobaltates(III): Role of the Metal on the Framework Properties. Microporous Mesoporous Mater. 2007, 103, 57–71. [Google Scholar] [CrossRef]
  12. Avila, M.; Reguera, L.; Rodriguez-Hernandez, J.; Balmaseda, J.; Reguera, E. Porous Framework of T2[Fe(CN)6]·xH2O with T = Co, Ni, Cu, Zn, and H2 Storage. J. Solid State Chem. 2008, 181, 2899–2907. [Google Scholar] [CrossRef]
  13. Reguera, L.; Reguera, E.; Balmaseda, J.; Rodriguez-Hernandez, J.; Yee-Madeira, H. Mixed Valences System in Cobalt Iron Cyanide. Microporous Structure Stability. J. Porous Mater. 2008, 15, 719–729. [Google Scholar] [CrossRef]
  14. Reguera, L.; Balmaseda, J.; Krap, C.P.; Avila, M.; Reguera, E. Hydrogen Storage in Zeolite-Like Hexacyanometallates: Role of the Building Block. J. Phys. Chem. C 2008, 112, 17443–17449. [Google Scholar] [CrossRef]
  15. Reguera, L.; Krap, C.P.; Balmaseda, J.; Reguera, E. Hydrogen Storage in Copper Prussian Blue Analogues: Evidence of H2 Coordination to the Copper Atom. J. Phys. Chem. C 2008, 112, 15893–15899. [Google Scholar] [CrossRef]
  16. Reguera, L.; Balmaseda, J.; del Castillo, L.F.; Reguera, E. Hydrogen Storage in Porous Cyanometalates: Role of the Exchangeable Alkali Metal. J. Phys. Chem. C 2008, 112, 5589–5597. [Google Scholar] [CrossRef]
  17. Rodriguez-Hernandez, J.; Reguera, E.; Lima, E.; Balmaseda, J.; Martinez-Garcia, R.; Yee-Madeira, H. An Atypical Coordination in Hexacyanometallates: Structure and Properties of Hexagonal Zinc Phases. J. Phys. Chem. Solids 2007, 68, 1630–1642. [Google Scholar] [CrossRef]
  18. Martinez-Garcia, R.; Reguera, E.; Balmaseda, J.; Ramos, G.; Yee-Madeira, H. On the Crystal Structures of Some Nickel Hexacyanoferrates(II,III). Powder Diffr. 2004, 19, 284–291. [Google Scholar] [CrossRef]
  19. Martinez-Garcia, R.; Reguera, E.; Rodriguez, J.; Balmaseda, J.; Roque, J. Crystal Structures of Some Manganese(II) and Cadmium Hexacyanoferrates(II,III) and Structural Transformations Related to the Sorption of Cesium. Powder Diffr. 2004, 19, 255–264. [Google Scholar] [CrossRef]
  20. Yuan, A.H.; Chu, C.X.; Zhou, H.; Yuan, P.; Liu, K.K.; Li, L.; Zhang, Q.F.; Chen, X.; Li, Y.Z. Syntheses, Crystal Structures and Gas Sorption Properties of Prussian Blue Analogues Constructed from [Cr(CN)6]3− Building Blocks. Eur. J. Inorg. Chem. 2010, 2010, 866–871. [Google Scholar] [CrossRef]
  21. Zamora, B.; Autie, M.; Contreras, J.L.; Centeno, M.; Reguera, E. Separation of Oxygen and Nitrogen by Porous Cyanometallates. Sep. Sci. Technol. 2010, 45, 692–699. [Google Scholar] [CrossRef]
  22. Song, J.; Wang, L.; Lu, Y.; Liu, J.; Guo, B.; Xiao, P.; Lee, J.J.; Yang, X.Q.; Henkelman, G.; Goodenough, J.B. Removal of Interstitial H2O in Hexacyanometallates for a Superior Cathode of a Sodium-Ion Battery. J. Am. Chem. Soc. 2015, 137, 2658–2664. [Google Scholar] [CrossRef] [PubMed]
  23. Dincǎ, M.; Long, J. Hydrogen Storage in Microporous Metal-Organic Frameworks with Exposed Metal Sites. Angew. Chem. Int. Ed. 2008, 47, 6766–6779. [Google Scholar] [CrossRef] [PubMed]
  24. Zamora, B.; Al-Hajjaj, A.; Shah, A.; Bavykin, D.; Reguera, E. Kinetic and Thermodynamic Studies of Hydrogen Adsorption on Titanate Nanotubes Decorated with a Prussian Blue Analogue. Int. J. Hydrogen Energy 2013, 38, 6406–6416. [Google Scholar] [CrossRef]
  25. Poloni, R.; Lee, K.; Berger, R.F.; Smit, B.; Neaton, J.B. Understanding Trends in CO2 Adsorption in Metal-Organic Frameworks with Open-Metal Sites. J. Phys. Chem. Lett. 2014, 5, 861–865. [Google Scholar] [CrossRef] [PubMed]
  26. Thallapally, P.K.; Motkuri, R.K.; Fernandez, C.A.; McGrail, B.P.; Behrooz, G.S. Prussian Blue Analogues for CO2 and SO2 Capture and Separation Applications. Inorg. Chem. 2010, 49, 4909–4915. [Google Scholar] [CrossRef] [PubMed]
  27. Autie-Castro, G.; Autie, M.; Reguera, E.; Santamaría-González, J.; Moreno-Tost, R.; Rodríguez-Castellón, E.; Jiménez-López, A. Adsorption and Separation of Light Alkane Hydrocarbons by Porous Hexacyanocobaltates(III). Surf. Interface Anal. 2009, 41, 730–734. [Google Scholar] [CrossRef]
  28. Kim, H.K.; Yun, W.S.; Kim, M.B.; Kim, J.Y.; Bae, Y.S.; Lee, J.; Jeong, N.C. A Chemical Route to Activation of Open Metal Sites in the Copper-Based Metal-Organic Framework Materials HKUST-1 and Cu-MOF-2. J. Am. Chem. Soc. 2015, 137, 10009–10015. [Google Scholar] [CrossRef] [PubMed]
  29. Takahashi, A.; Tanaka, H.; Parajuli, D.; Nakamura, T.; Minami, K.; Sugiyama, Y.; Hakuta, Y.; Ohkoshi, S.I.; Kawamoto, T. Historical Pigment Exhibiting Ammonia Gas Capture beyond Standard Adsorbents with Adsorption Sites of Two Kinds. J. Am. Chem. Soc. 2016, 138, 6376–6379. [Google Scholar] [CrossRef] [PubMed]
  30. Nune, S.K.; Thallapally, P.K.; McGrail, B.P.; Annapureddy, H.V.R.; Dang, L.X.; Mei, D.; Karri, N.; Alvine, K.J.; Olszta, M.J.; Arey, B.W.; et al. Adsorption Kinetics in Nanoscale Porous Coordination Polymers. ACS Appl. Mater. Interfaces 2015, 7, 21712–21716. [Google Scholar] [CrossRef] [PubMed]
  31. Swanson, B.I. Aspects of the Structure and Bonding in Prussian Blues. Single-Crystal Raman Study of Trimanganese Hexacyanocobaltate Hydrate (Mn3[Co(CN)6]·xH2O) and Tricadmium Bis(hexacyanocobaltate) Hydrate (Cd3[Co(CN)6]2·xH2O). Inorg. Chem. 1976, 15, 253–259. [Google Scholar] [CrossRef]
  32. Bertrán, J.F.; Pascual, J.B.; Reguera Ruiz, E. The CN Stretch of Hexacyanometallates as a Sensor of Ligand-Outer Cation Interactions-I. Ferricyanides and Cobalticyanides. Spectrochim. Acta A Mol. Spectrosc. 1990, 46, 685–689. [Google Scholar] [CrossRef]
  33. Reguera, E.; Bertrán, J.; Diaz, C.; Blanco, J.; Rondón, S. Mössbauer and Infrared Spectroscopic Studies of Novel Mixed Valence States in Cobaltous Ferrocyanides and Ferricyanides. Hyperfine Interact. 1990, 53, 391–395. [Google Scholar] [CrossRef]
  34. Reguera, E.; Fernández-Bertrán, J.; Díaz, C.; Molerio, J. Behaviour of Prussian Blue during Its Interaction with Ozone. Hyperfine Interact. 1992, 73, 285–294. [Google Scholar] [CrossRef]
  35. Reguera, E.; Fernández-Bertrán, J. Study of the Interaction of Ozone with Solid Ferrocyanides. Eur. J. Solid State Inorg. Chem. 1994, 31, 1021–1027. [Google Scholar]
  36. Reguera, E.; Fernández-Bertrán, J.; Duque, J. On the Interactions of Ozone with Manganous Hexacyanoferrates. Polyhedron 1994, 13, 479–484. [Google Scholar] [CrossRef]
  37. Nakamoto, K. Infrared and Raman Spectra of Inorganic and Coordination Compounds, Part B: Applications in Coordination, Organometallic, and Bioinorganic Chemistry, 6th ed.; John Wiley & Sons, Inc.: Hoboken, NJ, USA, 2009; Volume B. [Google Scholar]
  38. Lide, D.R. (Ed.) Handbook of Chemistry and Physics; CRC Press: Boca Raton, FL, USA, 2003.
  39. Kaye, S.S.; Long, J.R. Hydrogen Storage in the Dehydrated Prussian Blue Analogues M3[Co(CN)6]2 (M = Mn, Fe, Co, Ni, Cu, Zn). J. Am. Chem. Soc. 2005, 127, 6506–6507. [Google Scholar] [CrossRef] [PubMed]
  40. Ludi, A.; Guedel, H.U.; Ruegg, M. Structural Chemistry of Prussian Blue Analogs. Single-Crystal Study of Manganese (II) Hexacyanocobaltate (III), Mn3[Co(DcN)6]2·xH2O. Inorg. Chem. 1970, 9, 2224–2227. [Google Scholar] [CrossRef]
  41. Beall, G.W.; Milligan, W.O.; Korp, J.; Bernal, I. Crystal Structure of Mn3[Co(CN)6]2·12H2O and Cd3[Co(CN)6]2·12H2O by Neutron and X-ray Diffraction. Inorg. Chem. 1977, 16, 2715–2718. [Google Scholar] [CrossRef]
  42. Smith, D.W. Ionic Hydration Enthalpies. J. Chem. Educ. 1977, 54, 540. [Google Scholar] [CrossRef]
  43. Natesakhawat, S.; Culp, J.T.; Matranga, C.; Bockrath, B. Adsorption Properties of Hydrogen and Carbon Dioxide in Prussian Blue Analogues M3[Co(CN)6]2, M = Co, Zn. J. Phys. Chem. C 2007, 111, 1055–1060. [Google Scholar] [CrossRef]
  44. Flambard, A.; Köhler, F.H.; Lescouëzec, R.; Revel, B. Probing Spin Density and Local Structure in the Prussian Blue Analogues CsCd[FeCo(CN)6]·0.5H2O and Cd3[FeCo(CN)6]2·15H2O with Solid-State MAS NMR Spectroscopy. Chem. Eur. J. 2011, 17, 11567–11575. [Google Scholar] [CrossRef] [PubMed]
  45. Olvera, L.I.; Ruiz-Treviño, F.A.; Balmaseda, J.; Ronova, I.A.; Zolotukhin, M.G.; Carreón-Castro, M.P.; Lima, E.; Cárdenas, J.; Gaviño, R. Microporous Polymers from Superacid Catalyzed Polymerizations of Fluoroketones with p-Quaterphenyl: Synthesis, Characterization, and Gas Sorption Properties. Polymer 2016, 102, 221–230. [Google Scholar] [CrossRef]
  46. Atkins, P.; de Paula, J. Physical Chemistry, 7th ed.; W. H. Freeman and Company: New York, NY, USA, 2002. [Google Scholar]
  47. Rakness, K.; Gordon, G.; Langlais, B.; Masschelein, W.; Matsumoto, N.; Richard, Y.; Robson, C.M.; Somiya, I. Guideline for Measurement of Ozone Concentration in the Process Gas From an Ozone Generator. Ozone Sci. Eng. 1996, 18, 209–229. [Google Scholar] [CrossRef]
Figure 1. Full FTIR spectra (left column) and ν(CN) bands region (right column). FTIR spectra of: (a) MnHCC as synthesized; (b) ozonized and hydrated MnHCC; (c) CoHCC as synthesized; (d) ozonized and hydrated CoHCC.
Crystals 07 00016 g001
Figure 2. Differential correlation function fragment corresponding to the M−N and Co−C bonds for MnHCC and CoHCC: as-synthesized (red line), ozonized (blue line) and dehydrated (black line).
Crystals 07 00016 g002
Figure 3. Thermogravimetric curves of the MnHCC sample as-synthesized (red), ozonized and hydrated (blue) and ozonized and saturated with methanol (black).
Crystals 07 00016 g003
Figure 4. Thermogravimetric curves of the CoHCC sample as-synthesized (red), ozonized and hydrated (blue) and ozonized and saturated with methanol (black).
Crystals 07 00016 g004
Figure 5. Calculated isosteric heat of adsorption for all samples.
Crystals 07 00016 g005
Figure 6. FTIR ν(CN) bands of CoHCC: as-synthesized (red), ozonized (blue) and after adsorption experiment and re-hydration (black).
Crystals 07 00016 g006
Figure 7. Experimental setup for ozonization. Position A of the six-way valve (continuous line) is for sample degassing. Position B of the six-way valve (dotted line) is for sample ozonization with a mixture of air and ozone. Position A of the four-way valve (continuous line) is a bypass for the saturator. Its B position allows methanol saturation of the sample.
Crystals 07 00016 g007
Table 1. Observed Raman modes for the Co(CN)63− building units of the original and ozonized samples.
ModeMnHCC cm 1 MnCoO3 cm 1 Reference MnHCC [31] cm 1
ν 1 ( A 1 g , CN)219221972191
ν 2 ( A 1 g , CoC)484486485
ν 3 ( E g , CN)217321772172
ν 4 ( E g , CoC)469470470
ν 10 ( F 2 g , CoCN)480484480
ν 11 ( F 2 g , CCoC)202202 a202
a This band is broader than the corresponding MnHCC band.
Table 2. Percent of volume change ( Δ V ) and cell parameters (Å) for M3[Co(CN)6]2·nH2O ( M = Mn and Co ) as-synthesized and ozonized.
MHydratedDehydrated Δ V , %Hydrated Ozonized Δ V , %
Mn10.4228(1)10.3272(4)2.710.3511(6),10.2734(8) a2.0, 4.2
Co10.2191(5)10.143(7)2.210.1092(8)3.2
a Two phases were observed in the powder pattern.
Table 3. Limit capacity n m , pressure at half volumetric filling p 1 2 and relative activity coefficient exponent ( g ) , estimated fitting the Langmuir–Freundlich equation to experimental isotherms: H2 at liquid nitrogen and CO2 at 273.15 K . Figures S9 and S10 of Supplementary Materials show the isotherms and Langmuir–Freundlich function fittings.
AdsorbateSample n m mmol/g p 1 2 mmHgg
H2MnHCC11.1 ± 0.1202 ± 61.22 ± 0.01
MnHCCOz9.3 ± 0.1160 ± 51.25 ± 0.02
CoHCC10.8 ± 0.2214 ± 101.33 ± 0.02
CoHCCOz10.4 ± 0.1215 ± 81.32 ± 0.04
CO2MnHCC9.2 ± 0.1589 ± 201.220 ± 0.009
MnHCCOz6.74 ± 0.03539 ± 50.988 ± 0.003
CoHCC7.40 ± 0.06948 ± 161.139 ± 0.003
CoHCCOz7.0 ± 0.1809 ± 311.127 ± 0.008

