Article

Study on Micro Morphology of Potassium Dihydrogen Phosphate Crystals Grown at Elevated Temperatures

1
State Key Laboratory of Crystal Materials, Shandong University, Jinan 250100, China
2
Key Laboratory of Functional Crystal Materials and Device (Shandong University), Ministry of Education, Jinan 250100, China
3
College of Materials Science and Engineering, Shandong University of Science and Technology, Qingdao 266590, China
*
Author to whom correspondence should be addressed.
Crystals 2017, 7(4), 118; https://doi.org/10.3390/cryst7040118
Submission received: 7 March 2017 / Revised: 7 April 2017 / Accepted: 18 April 2017 / Published: 21 April 2017

Abstract

:
Potassium dihydrogen phosphate crystals were grown around 65 °C. The growth rate of KDP (KH2PO4) crystal prismatic faces was measured by laser polarization interference system. The surface micro morphology of KDP crystals grown at various supersaturation were comparatively observed by atomic force microscope systematically. The results show that the growth rate increased with the rise of supersaturation, the aspect ratio reduced. The steps bunching height occurred at σ = 0.03 and 0.04. At this point, the steps height reached maximum value about 11.3~24.4 nm. The step bunching was almost constant at higher supersaturation. A few pits and holes appeared on the crystal surface at high supersaturation. In our opinion, the forming of these pits and holes might be related with the step movement and 2D nuclei mechanism.

1. Introduction

Crystals of potassium dihydrogen phosphate (KDP) are widely applied in laser frequency conversion, electro-optic modulation, parametric oscillation, and other fields due to their excellent electro-optical and nonlinear optical properties [1]. They are used for manufacturing civil piezoelectric transducer and sonar as piezoelectric crystal materials with good performance. The KDP crystals have large nonlinear optical coefficients, d36 (1.064 μm) = 0.39 × 10⁻¹² m/V, it can be as the reference standard for nonlinear property of other crystals. They are also the preferred laser frequency and switching materials currently in high-power laser systems of inertial confinement fusion (ICF) [2]. In order to obtain high-quality KDP crystals, people pay close attention to study the various factors affecting the crystal growth rate and optical properties [3,4,5,6]. L.N. Rashkovich [7] researched the influence of impurities on the dependence of step growth rate versus the solution supersaturation using in-situ interference microscopy. With the development of AFM technology, researchers could explore the detailed information of KDP crystals at an atomic scale. Terry A. Land [8] used atomic force microscopy to investigate the KDP (100) surface as it emerged from the dead zone and presented a simple physical model of this process. K. Sangwal [9] studied the behavior of growth steps on the (100) faces of KDP crystals and the tapering phenomenon by AFM. These experiments were all proceed at low temperature around 30 °C. Cheng Min [10] observed the morphologies on (100) face of KDP crystal by ex-situ AFM with different pH values at different supersaturation around 40 °C, investigated the step flow by in situ AFM at low supersaturation around 25 °C. Jianxu Ding [11] studied the influence of MoO42− growth steps on (100) face of KDP by ex-situ AFM technique, the crystal samples were grown from solution with a saturation temperature of 55 °C. Fafu Liu [12] reported the effect of pH value on the growth morphology of KDP crystal grown in defined crystallographic direction, the initial growth temperature was 56 °C. However, the crystal growth was performed actually from elevated temperature to low temperature at a changing supersaturation. The temperature was one of the most important factors in the process of crystal growth, but research about the morphology, growth rate, and steps movement on the surfaces at elevated temperature was minimal.
The aim of this paper is to study the effect of supersaturation on surface morphology, crystal growth rate and the steps evolvement at elevated temperature. The information of step bunching, terrace width, and step slopes were all obtained at various supersaturation.

2. Experiments

2.1. Crystal Growth

The process of KDP crystal growth was same as the description previous [13]. The aqueous solutions used to grow KDP crystals were prepared using high purity KH2PO4 and de-ionized water according to the solubility curve S [14] using the equation
S = 6.02 × 10 3 × T 2 + 0.208 × T + 15.9 ( g   KDP / 100 g   H 2 O )
T is the saturation temperature of solution. In this experiment, the value was controlled around 65 °C, which is a suitable temperature to begin the growth of KDP crystal by the temperature lowering method. The solutions were heated at 80 °C for 24 h after filtered by a 0.22 μm membrane to assure that all components dissolved. These crystals were grown at the set supersaturation after recovery under the temperature of 0.5 °C lower than the saturation temperature for several hours. The temperature was controlled by a Shimada FP21 automatic temperature apparatus with an accuracy of ±0.01 °C. The supersaturation σ was calculated as [14]
σ = ln ( C / C 0 )
where C is the actual concentration, C0 is the equilibrium saturation concentration at experiment temperature, it can calculated using the equation
C 0 = 10.68 + 0.3616 T ± 0.04 ( g   KDP / 100 g   solution )
After the crystals grown to the required size, the crystals were removed from the solution and were transferred into CHCl3. The organic solvent CHCl3 could eliminate the mother solutions from crystal surface and protect the growth steps, and then the crystals were naturally cooled to room temperature.

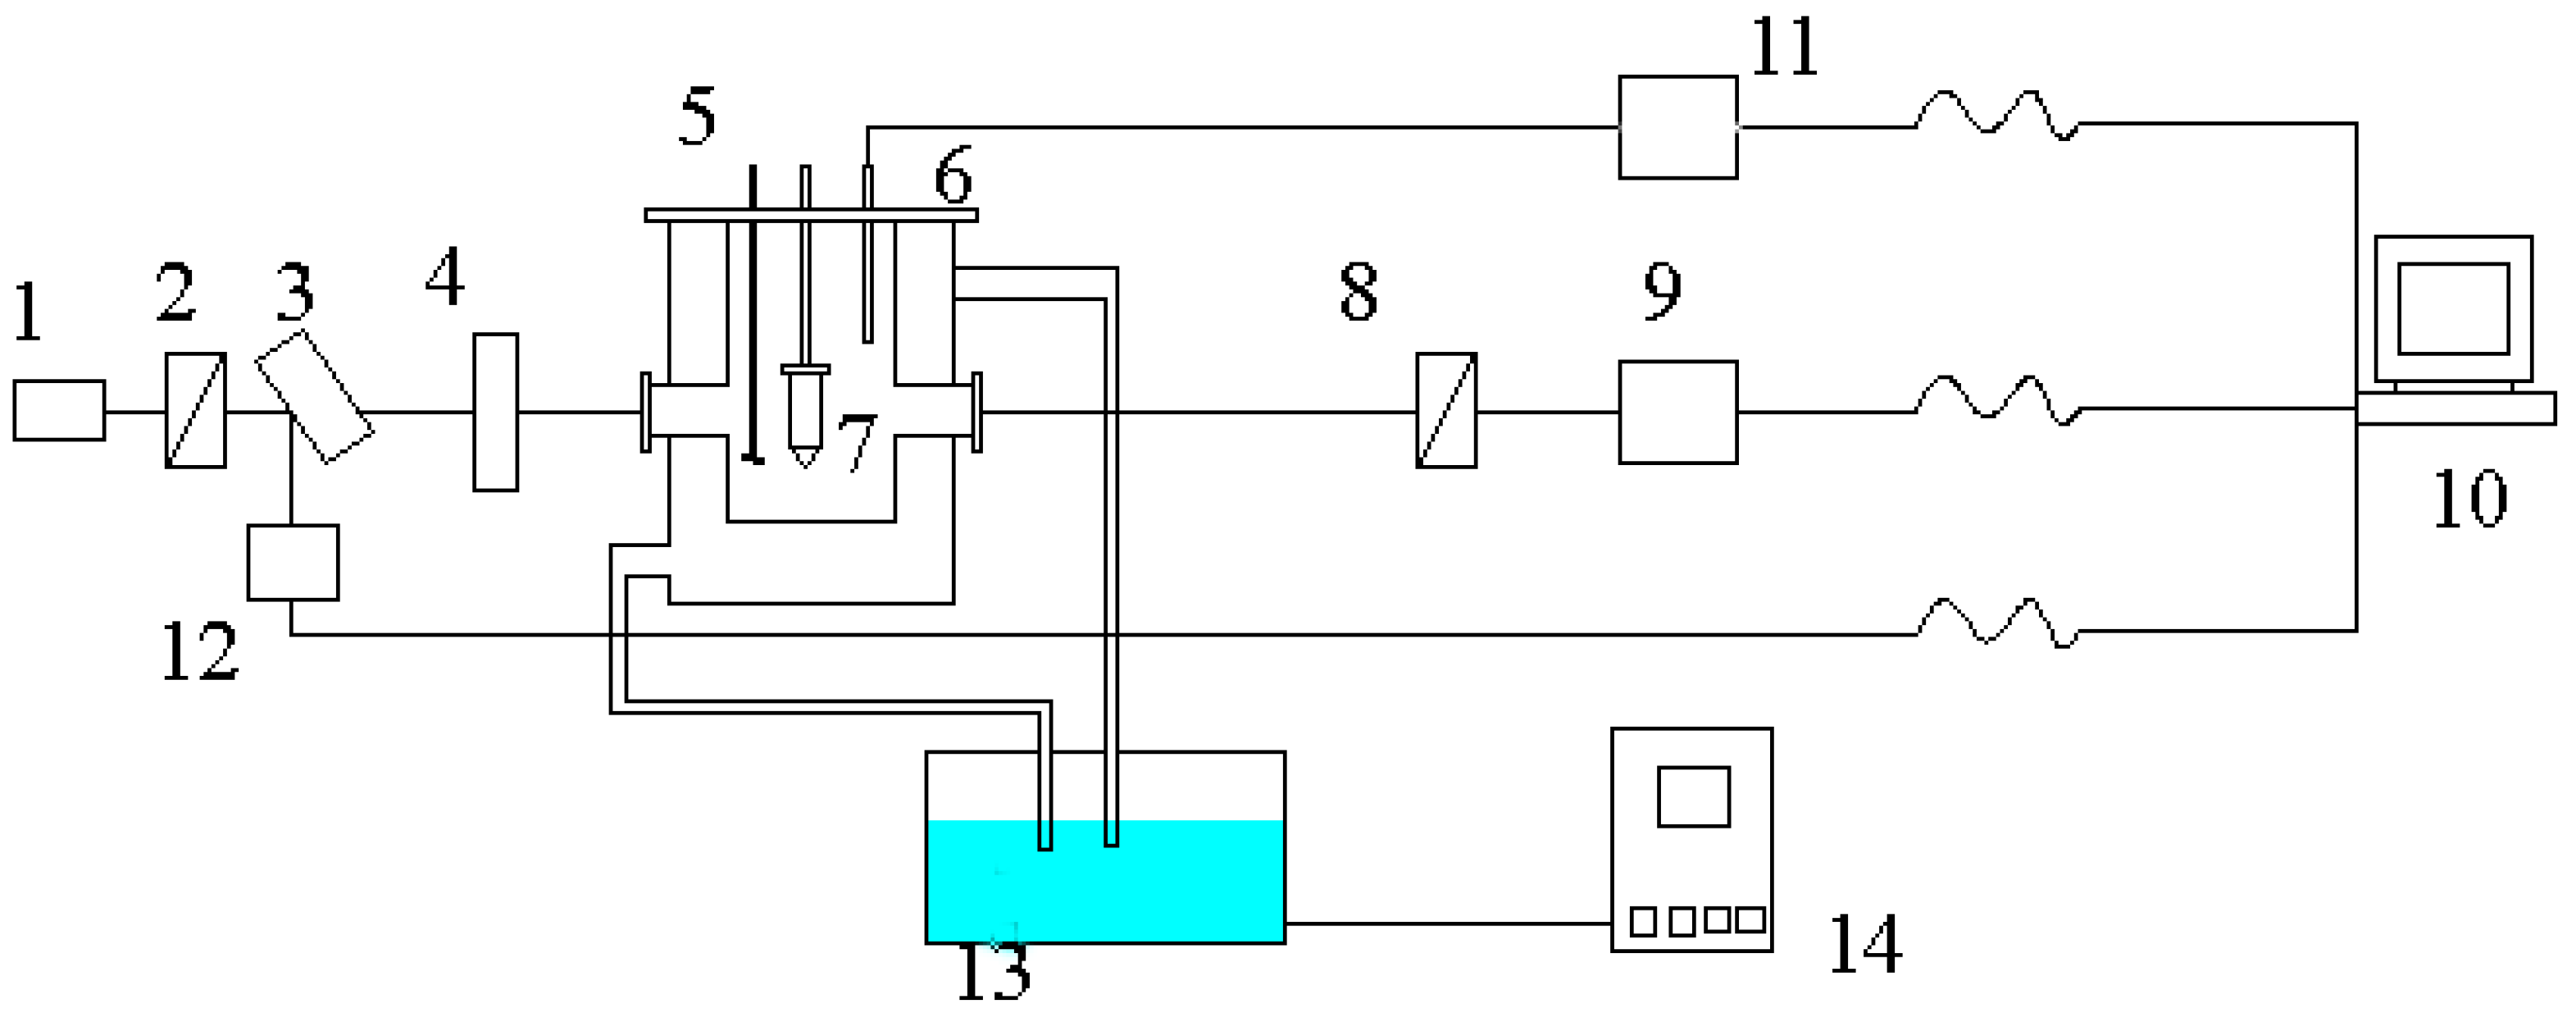
2.2. AFM Characterization

The equipment model of the atomic force microscope (AFM) was Dimension Icon, produced by Veeco Instruments Inc. in America. Before AFM observation, the crystals were removed from CHCl3 until the residual on crystal surface evaporating. Adjust the crystal to keep the observed surface horizontal before testing. The surface structures on the (100) faces of crystals were studied in ambient atmosphere at room temperature by Contact or ScanAsyst modes with standard SiN cantilevers. The AFM images were produced by repeating scanning in the test process, so the error of the scanning itself did not affect the original actual morphology.

2.3. Measurement of Growth Rate

The growth rate of the (100) face was measured by the laser polarization interference system [15]. The schematic of the system was shown in Figure 1. A laser beam with the wavelength of 473 nm was employed. The crystals prepared beforehand which have a good optical quality and no obvious macroscopic defects were put in the solution at the temperature of 1 °C above the saturation point. Adjust the crystal to ensure the laser vertically through the (100) face. The temperature was controlled via the circulating water. The solution cooling rate was 3 °C/h. The intensity of the laser and the temperature were collected by a computer in real time.
The growth rate R was calculated in terms of relationship between the laser intensity I and the crystal thickness [15] as
R = Δ d 2 Δ t = 1 2 ( Δ I Δ d ) 1 Δ I Δ t = λ 4 π Δ n I ( I 0 I ) Δ I Δ t   ( for   low   supersaturation )
R = λ / 2 Δ n Δ t   ( for high   supersaturation )
where d is the thickness of the crystal; λ is the laser wavelength; Δn is crystal birefringence; I0 is the light intensity before entering crystal at the t moment; I’ is the light intensity after leaving crystal at the t moment; I is the relative light intensity, I = I0/I’.

3. Results

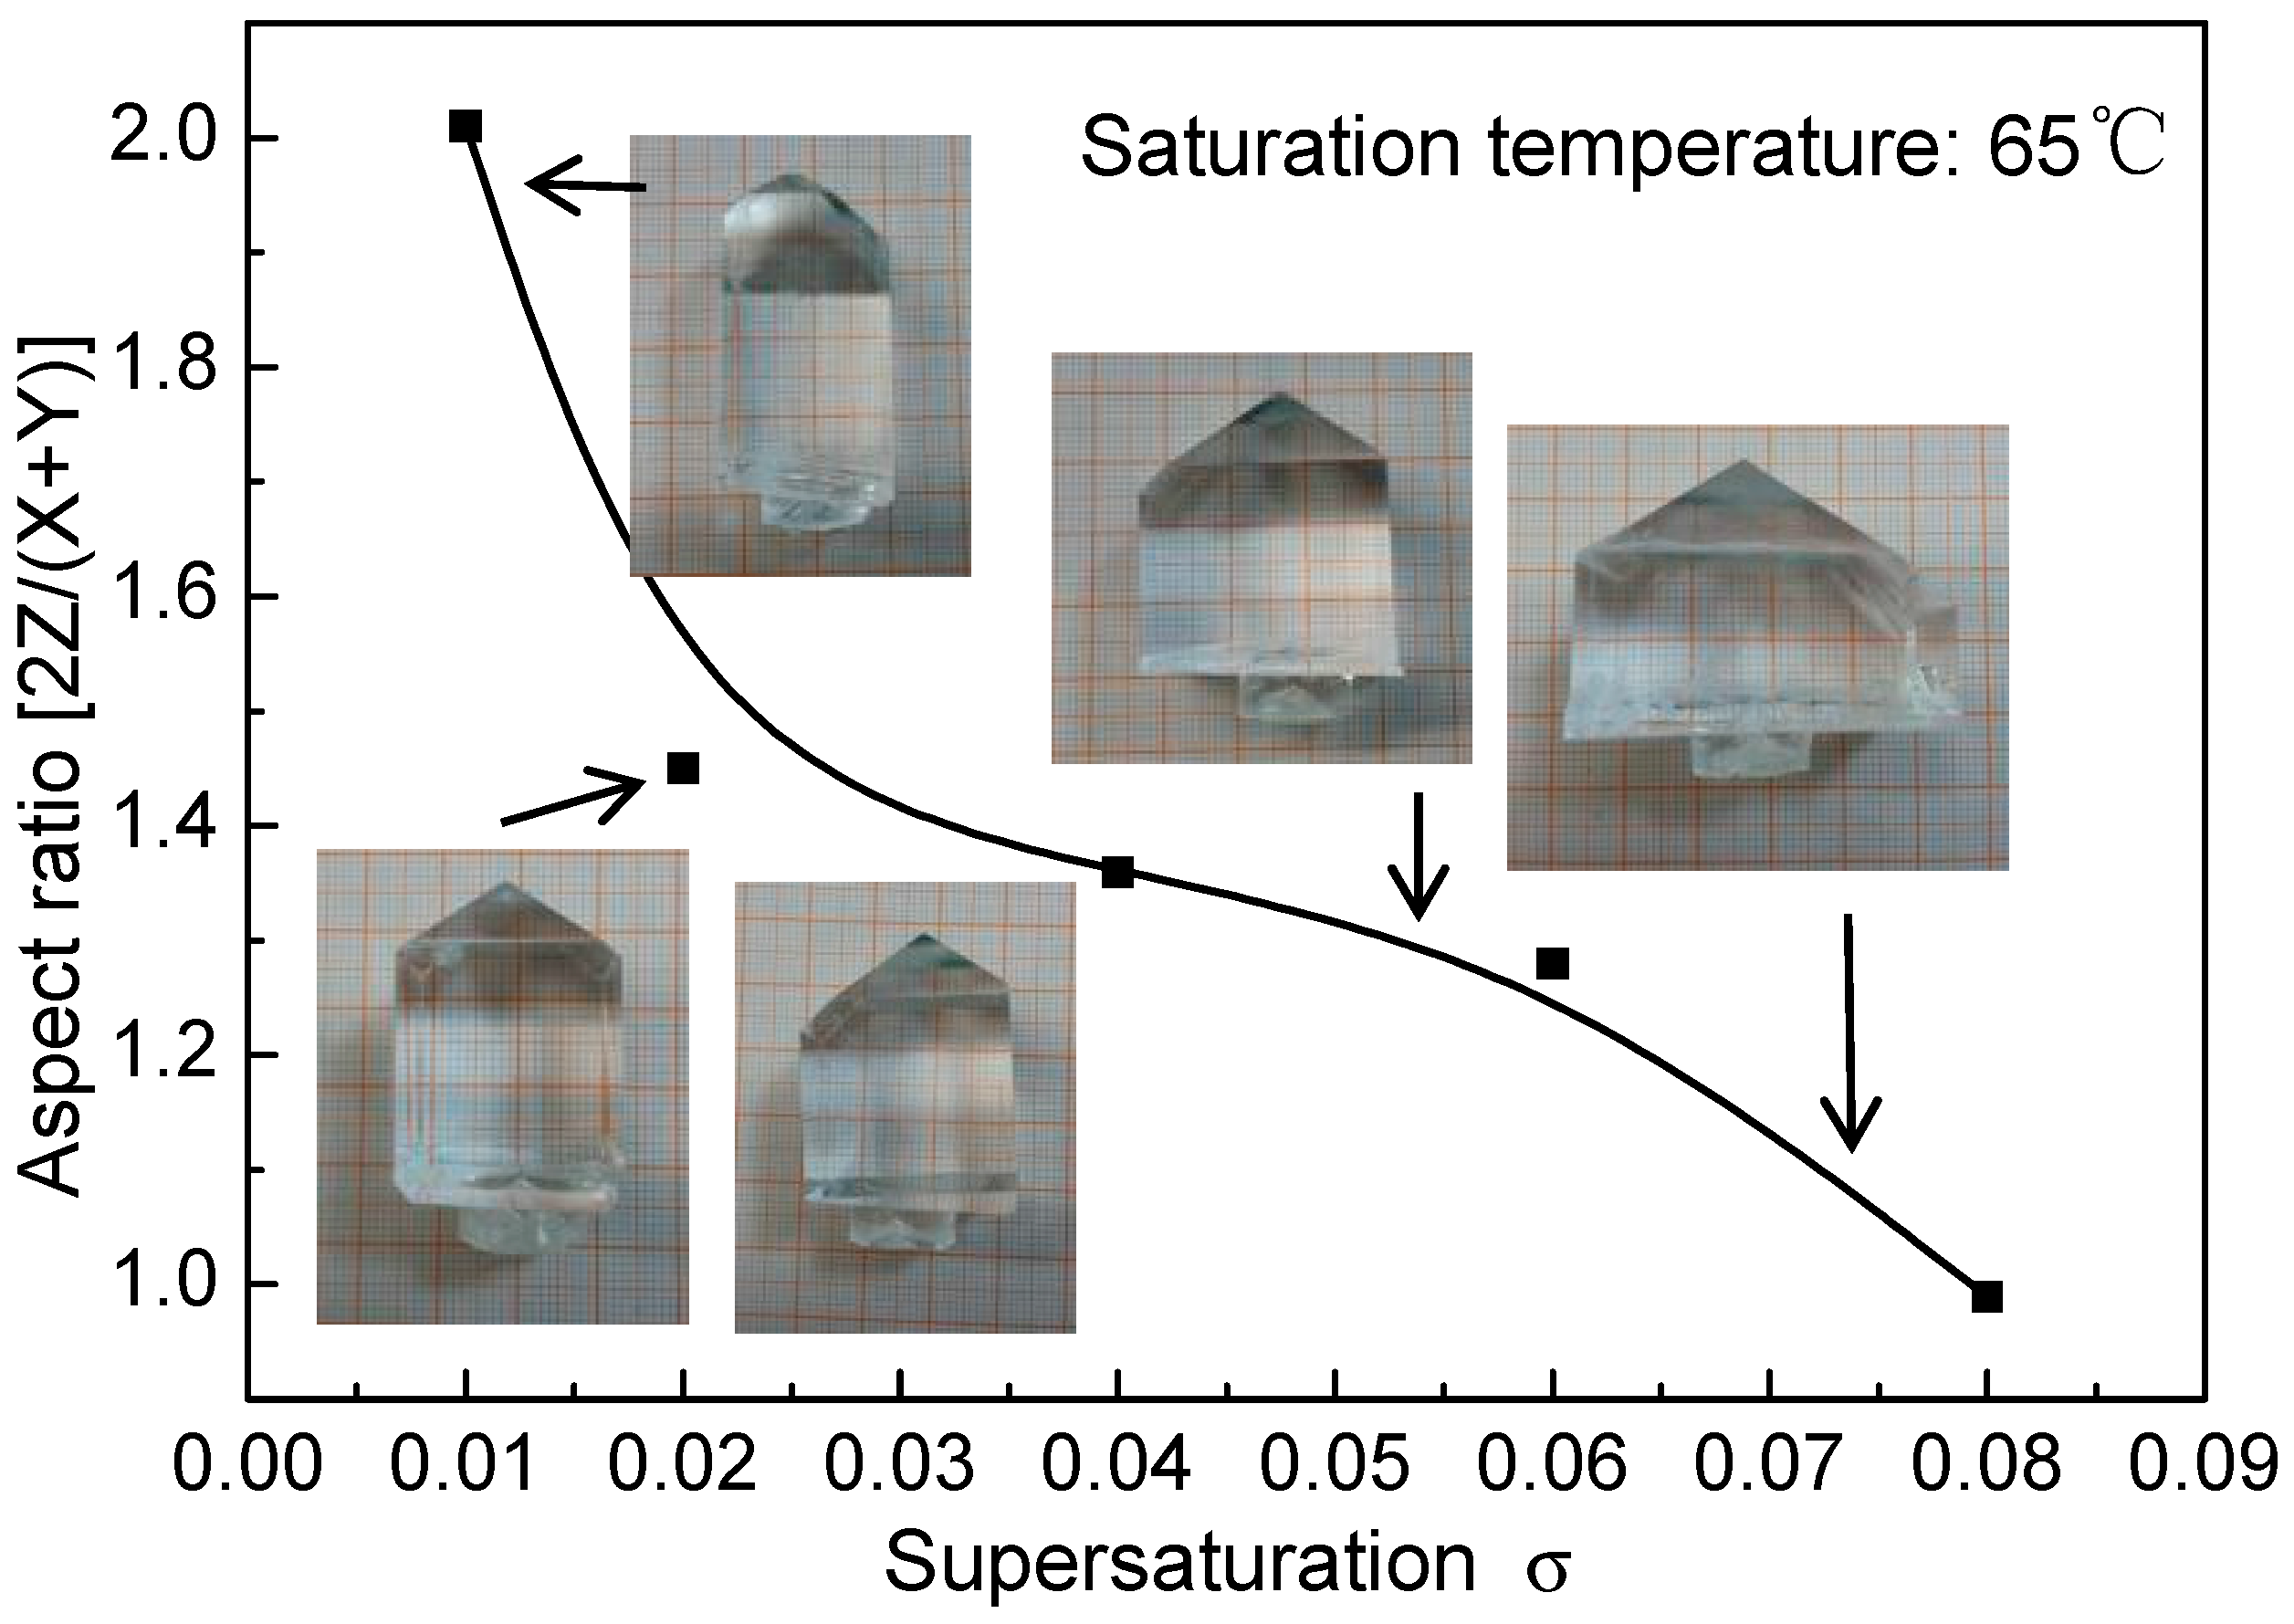
3.1. Crystals and Aspect Ratio

The material objects grown at different supersaturation and their aspect ratio are shown in Figure 2. The aspect ratio were calculated by 2Z/(X + Y), the length were measured by Vernier caliper. It can be seen that the crystals grown at σ = 0.01~0.06 had a good optical transparency and no obvious macro defects by naked eye. The aspect ratio of the crystals decreased with the rise of supersaturation. Variations of supersaturation caused considerable shape change. At low supersaturation, the crystal was a “tall and thin” shape. At high supersaturation, the shape became “chunky” finally.

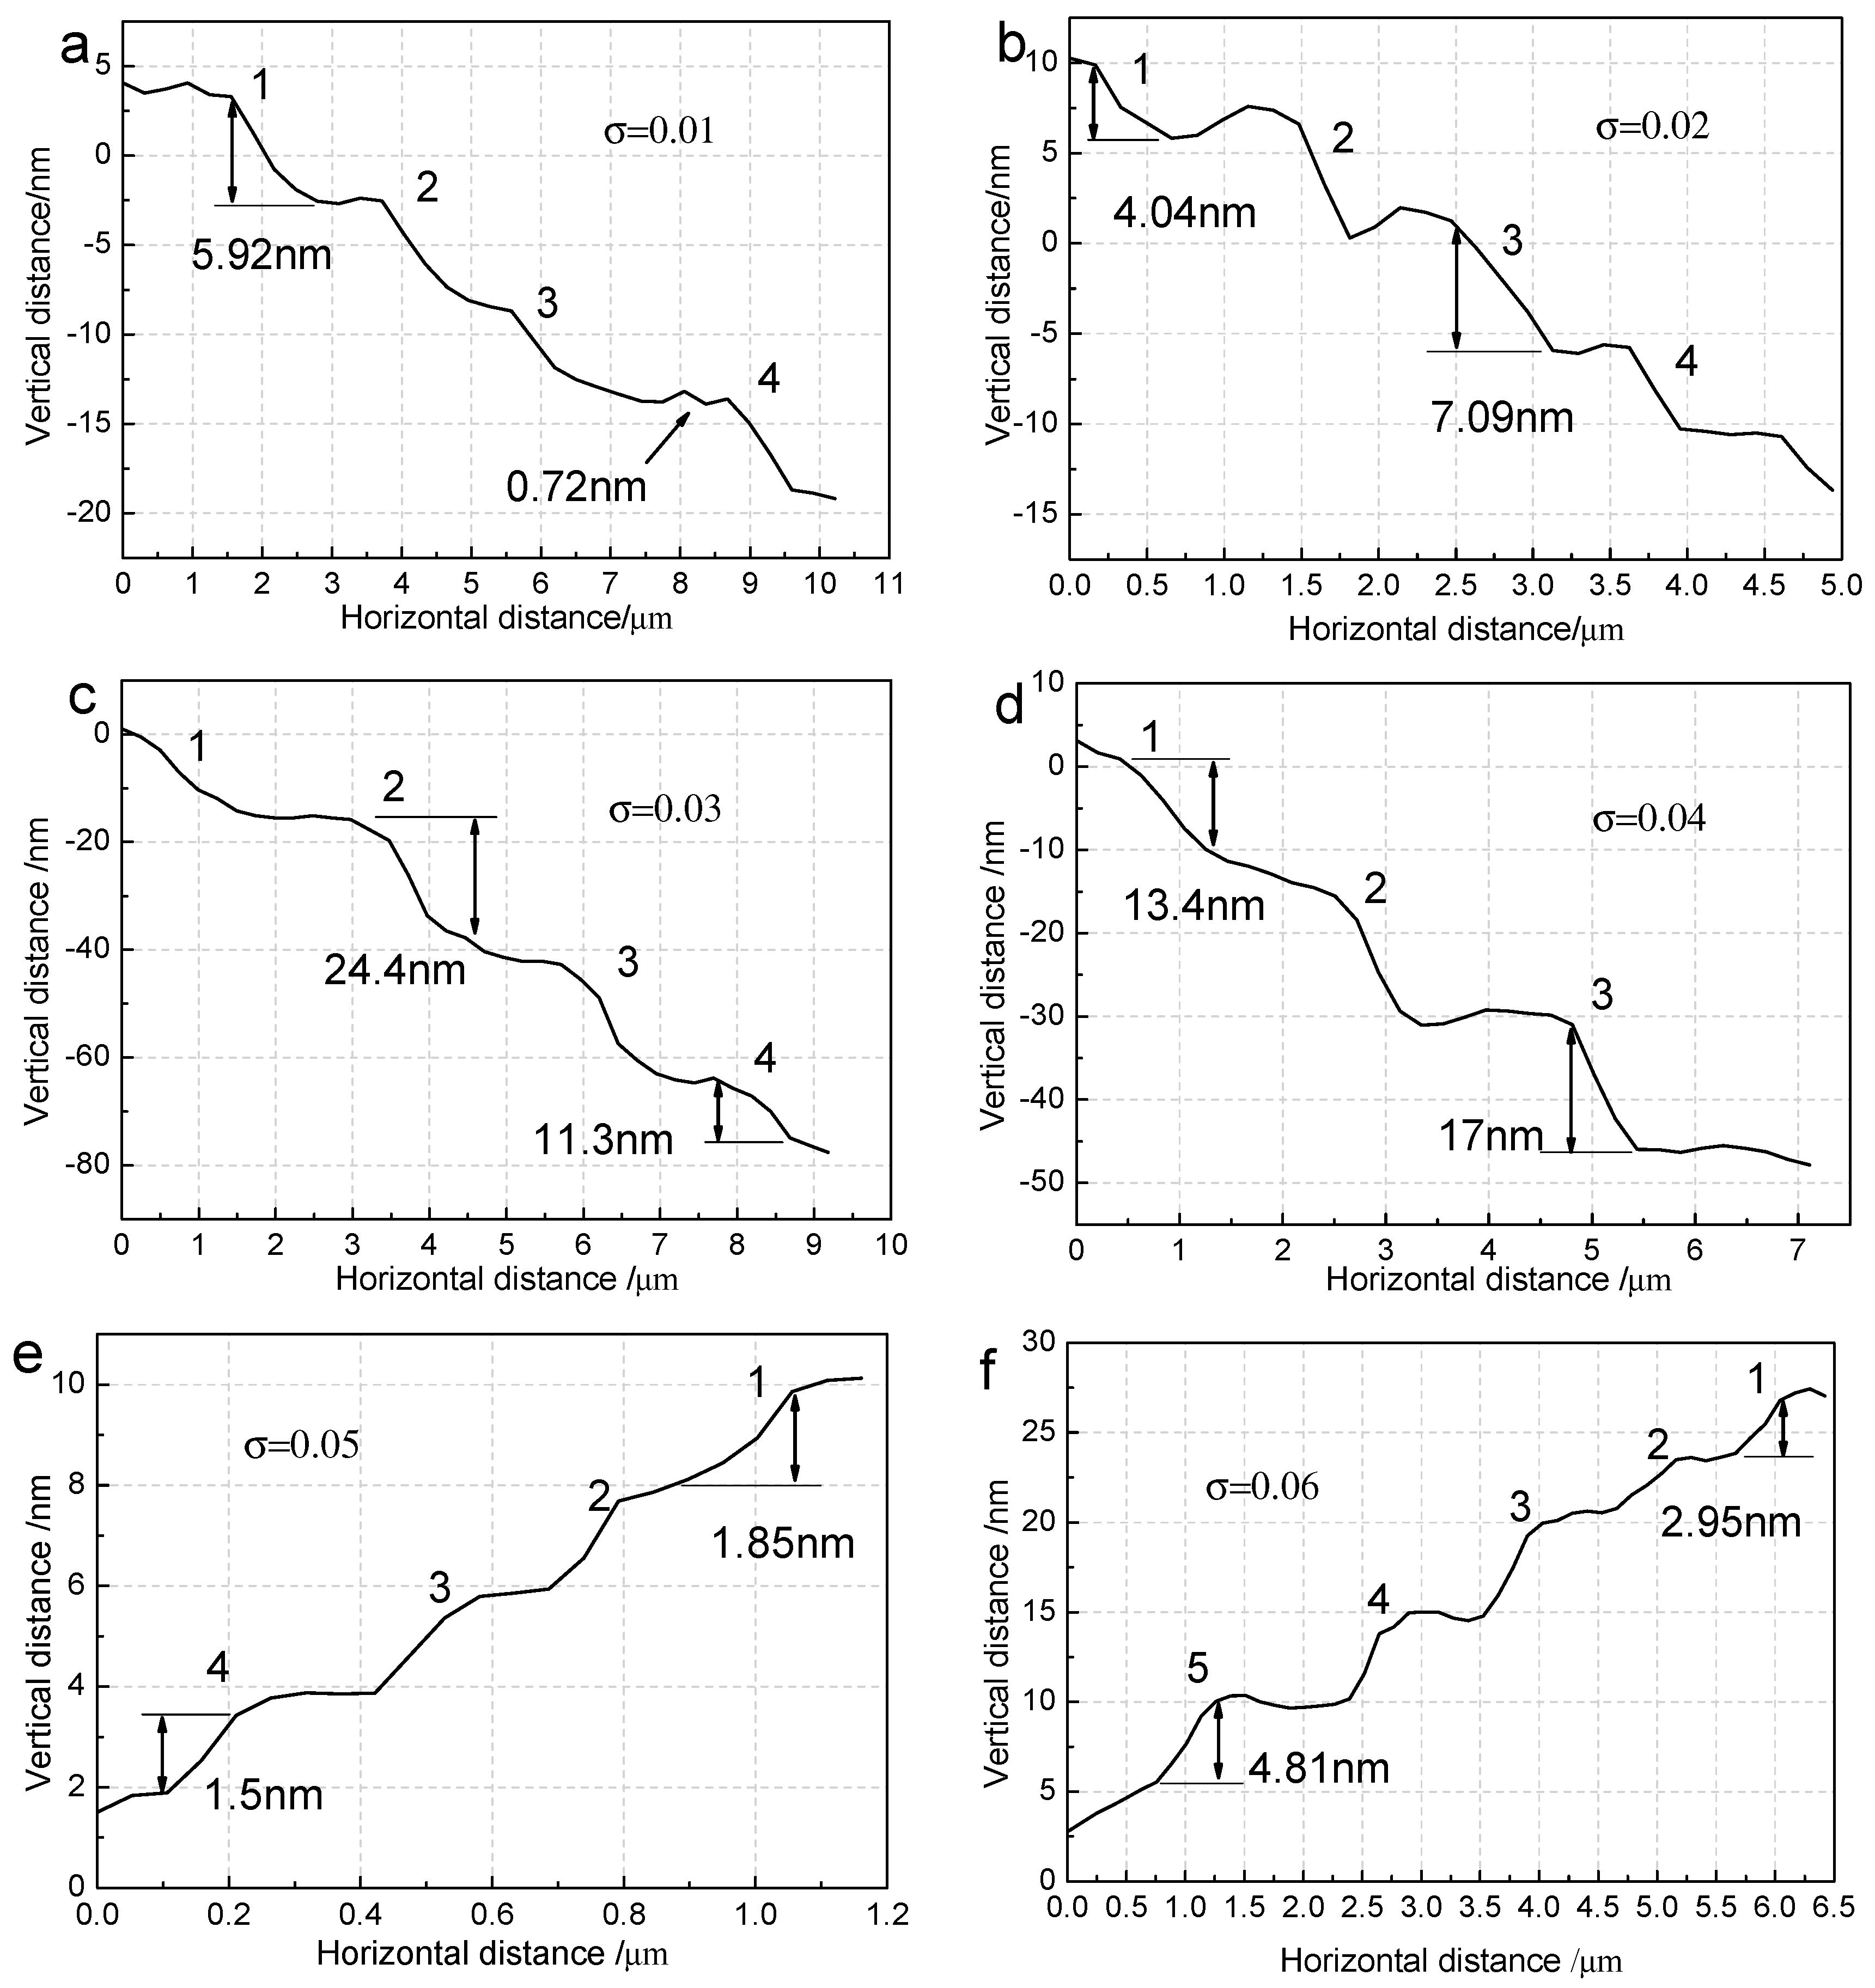
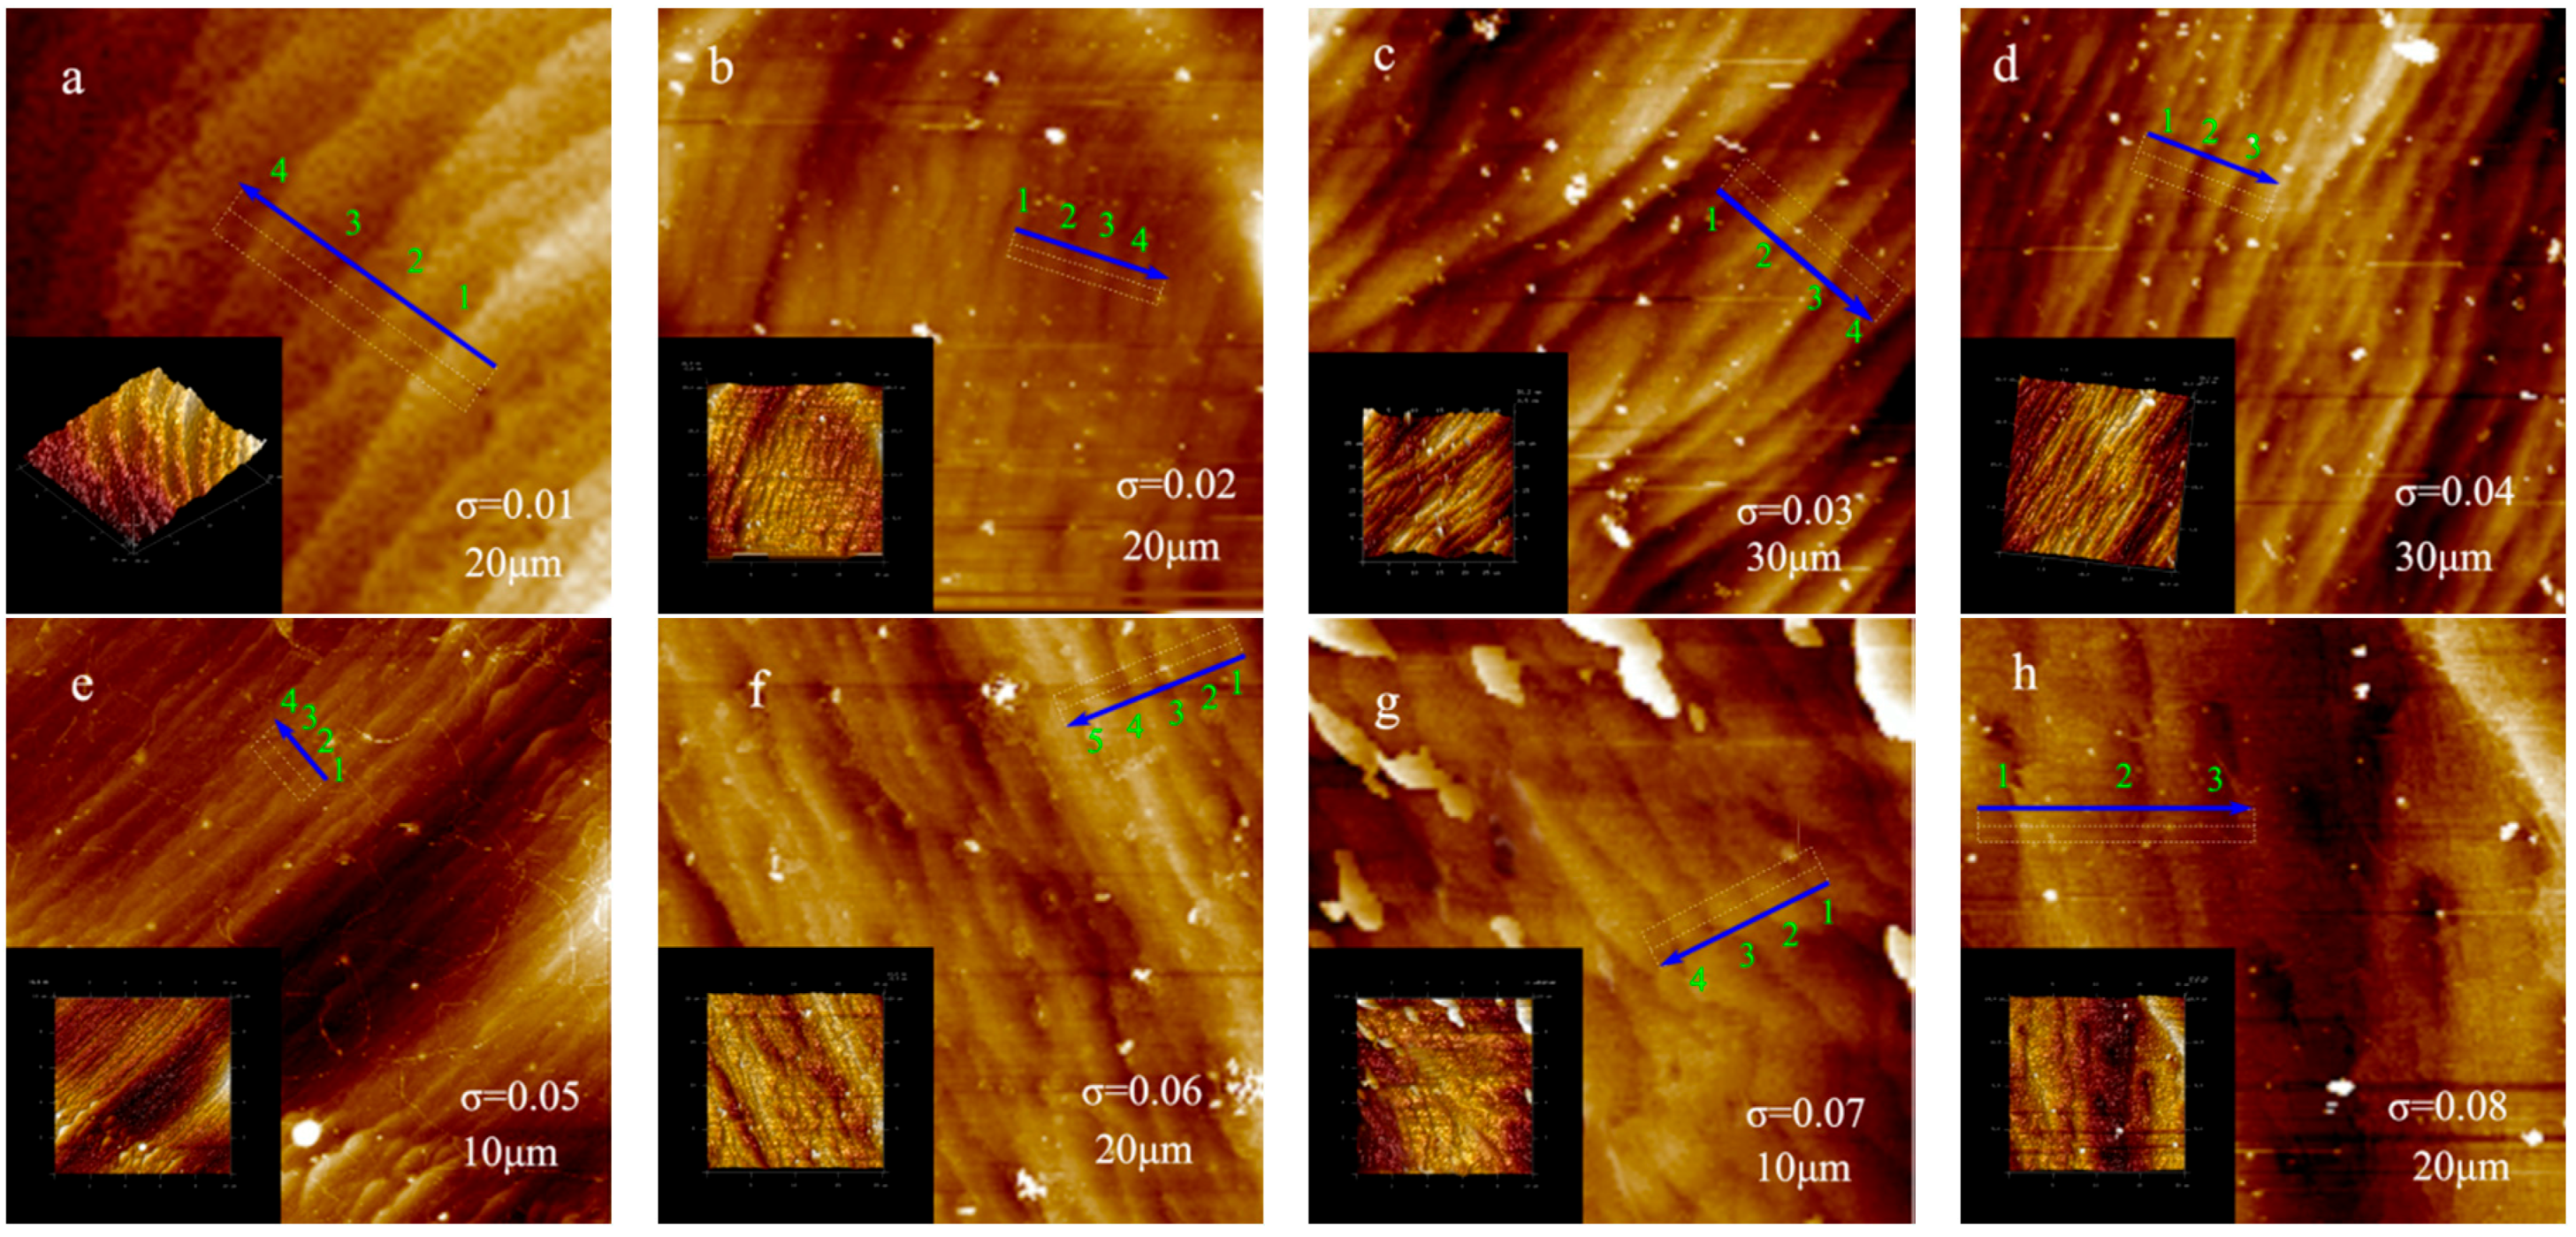
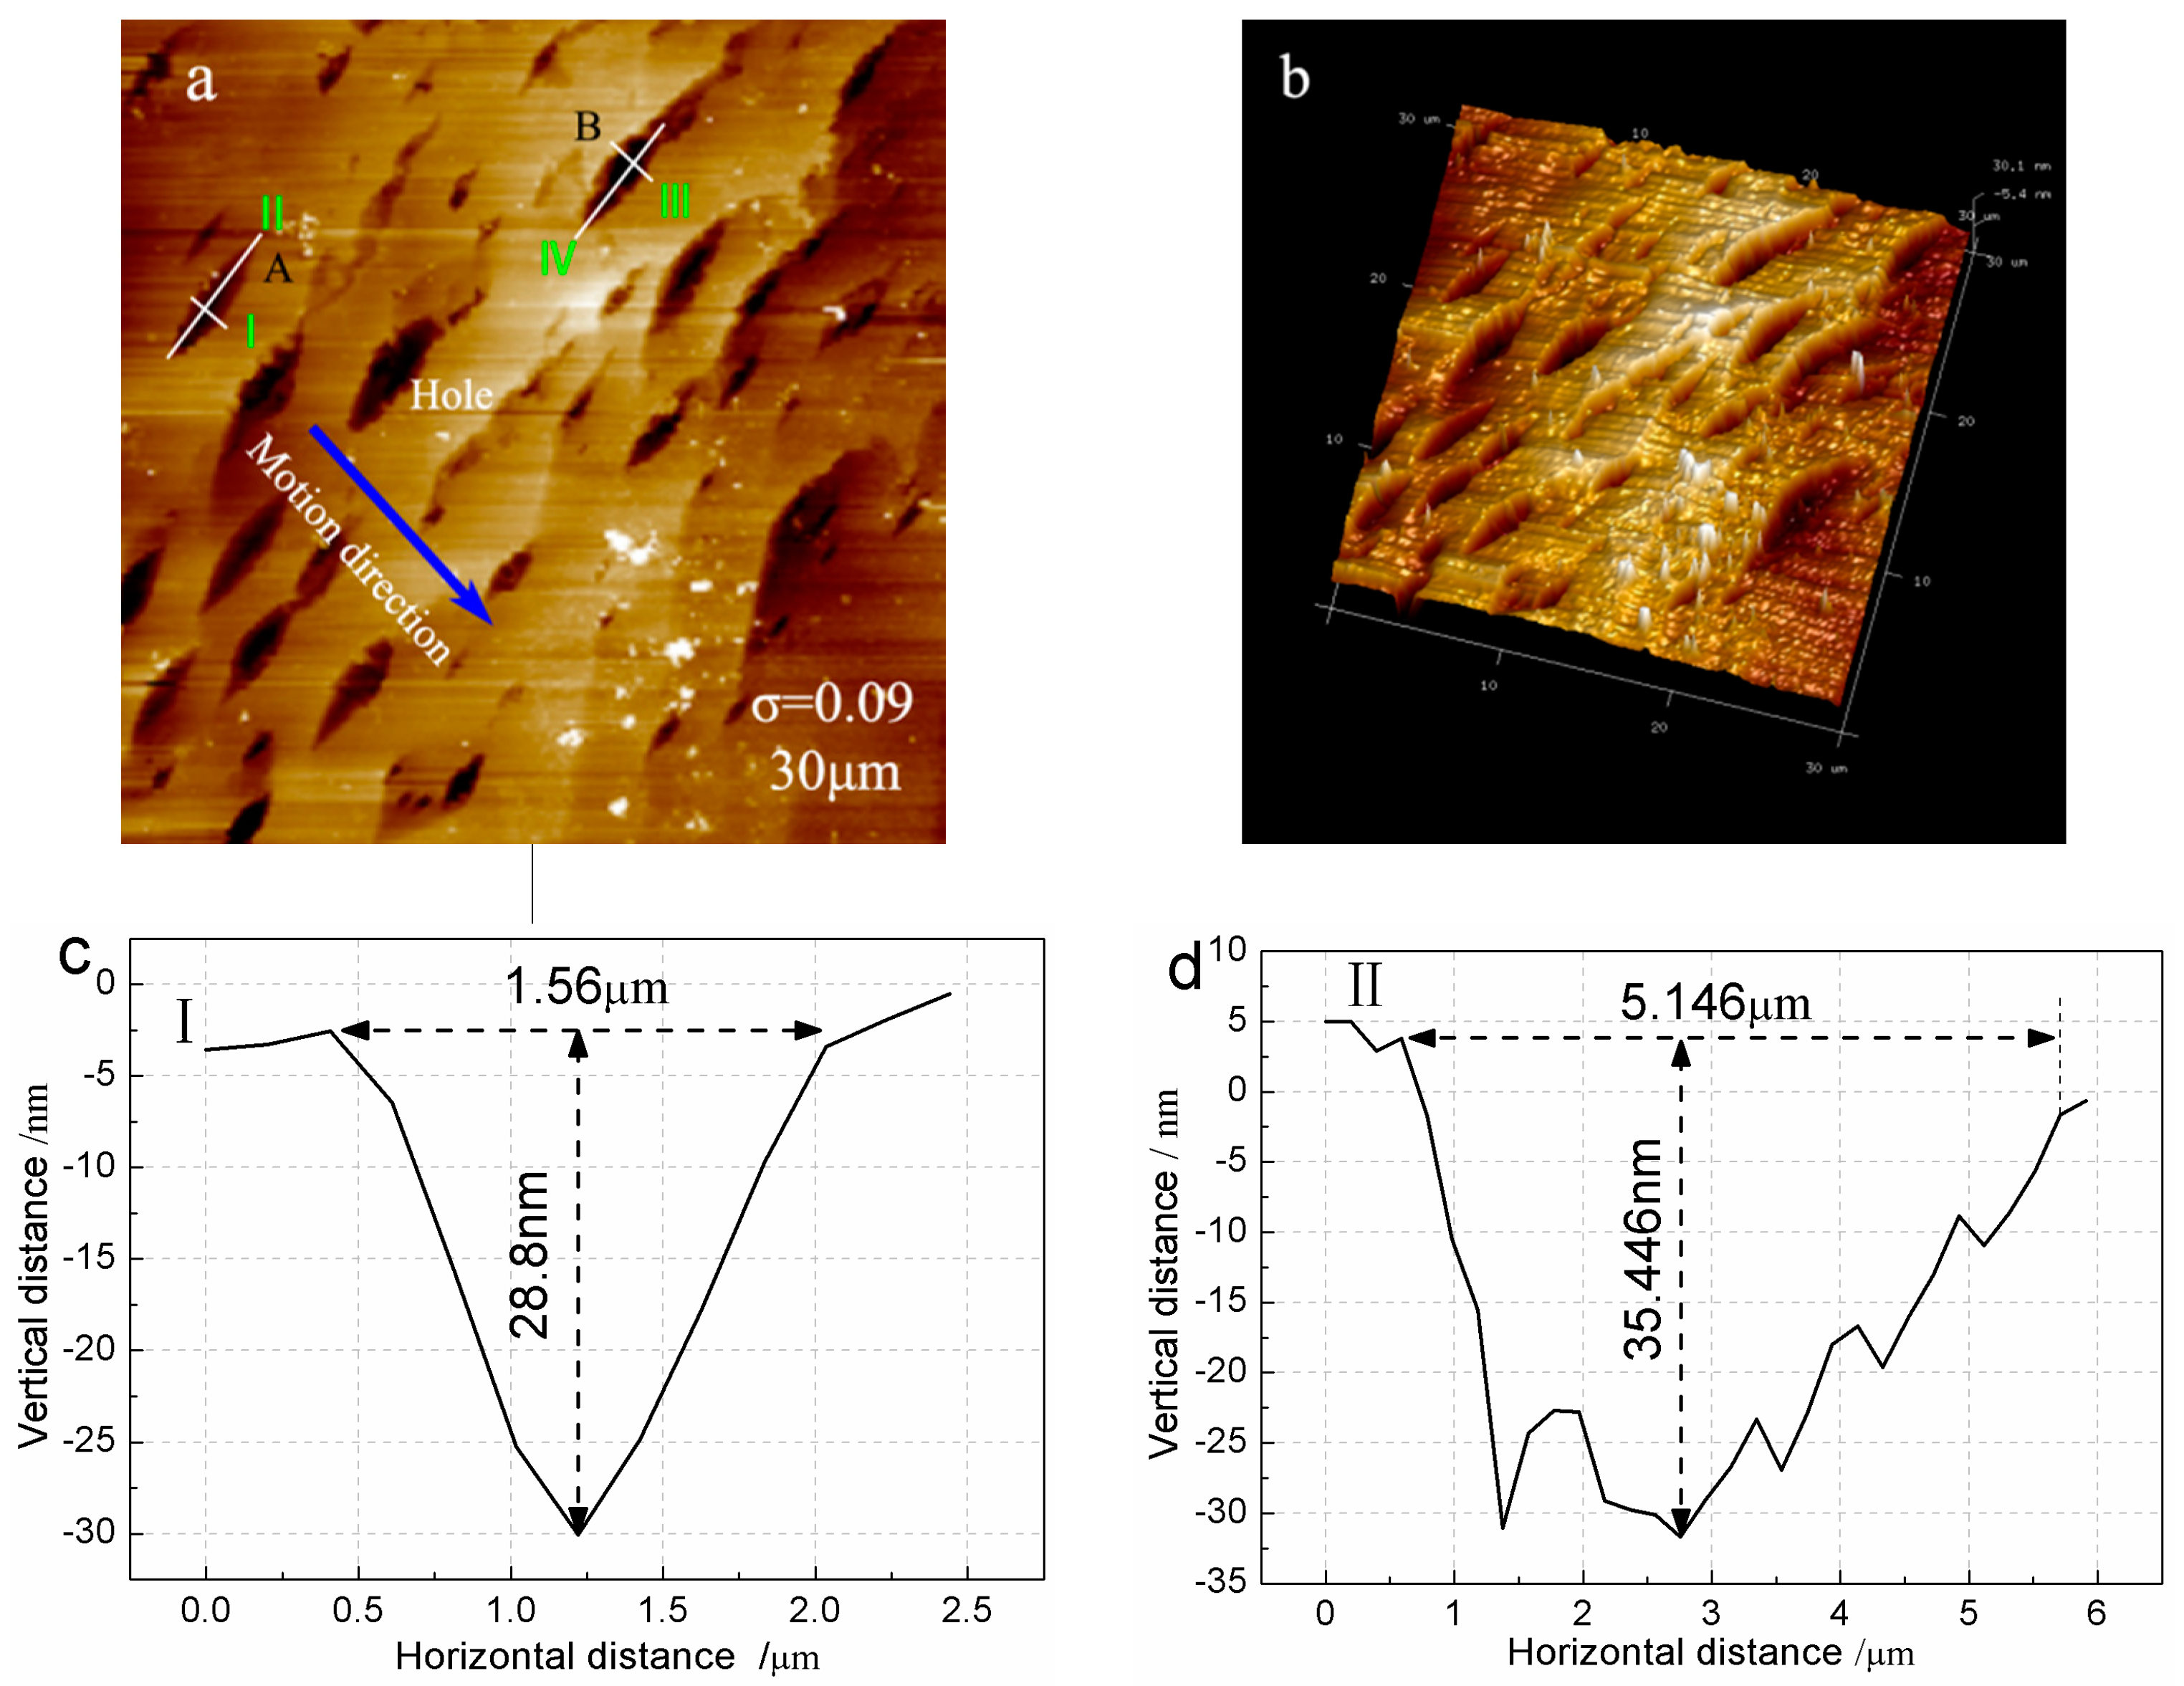
3.2. The Surface Step Morphology on (100) Faces

The different regions of sample were observed and tested, the most representative images are shown in Figure 3. They are the morphology on (100) faces of KDP crystals grown at the supersaturation of 0.01~0.08. The insets are the corresponding 3-D graphics. The blue arrow represents the steps motion direction.
It can be seen that the steps were generally bent at various supersaturations. At the supersaturation of 0.03, the step was bent and intertwined with each other. A row of protuberance steps which paralleled to the motion direction appeared at σ = 0.05. The steps of bending increased obviously at σ = 0.07. When the supersaturation added up to 0.08, a few shallow pits appeared on the crystal surface. It is significantly different from the situation at low temperature that the dendritic branch steps emerged [16].

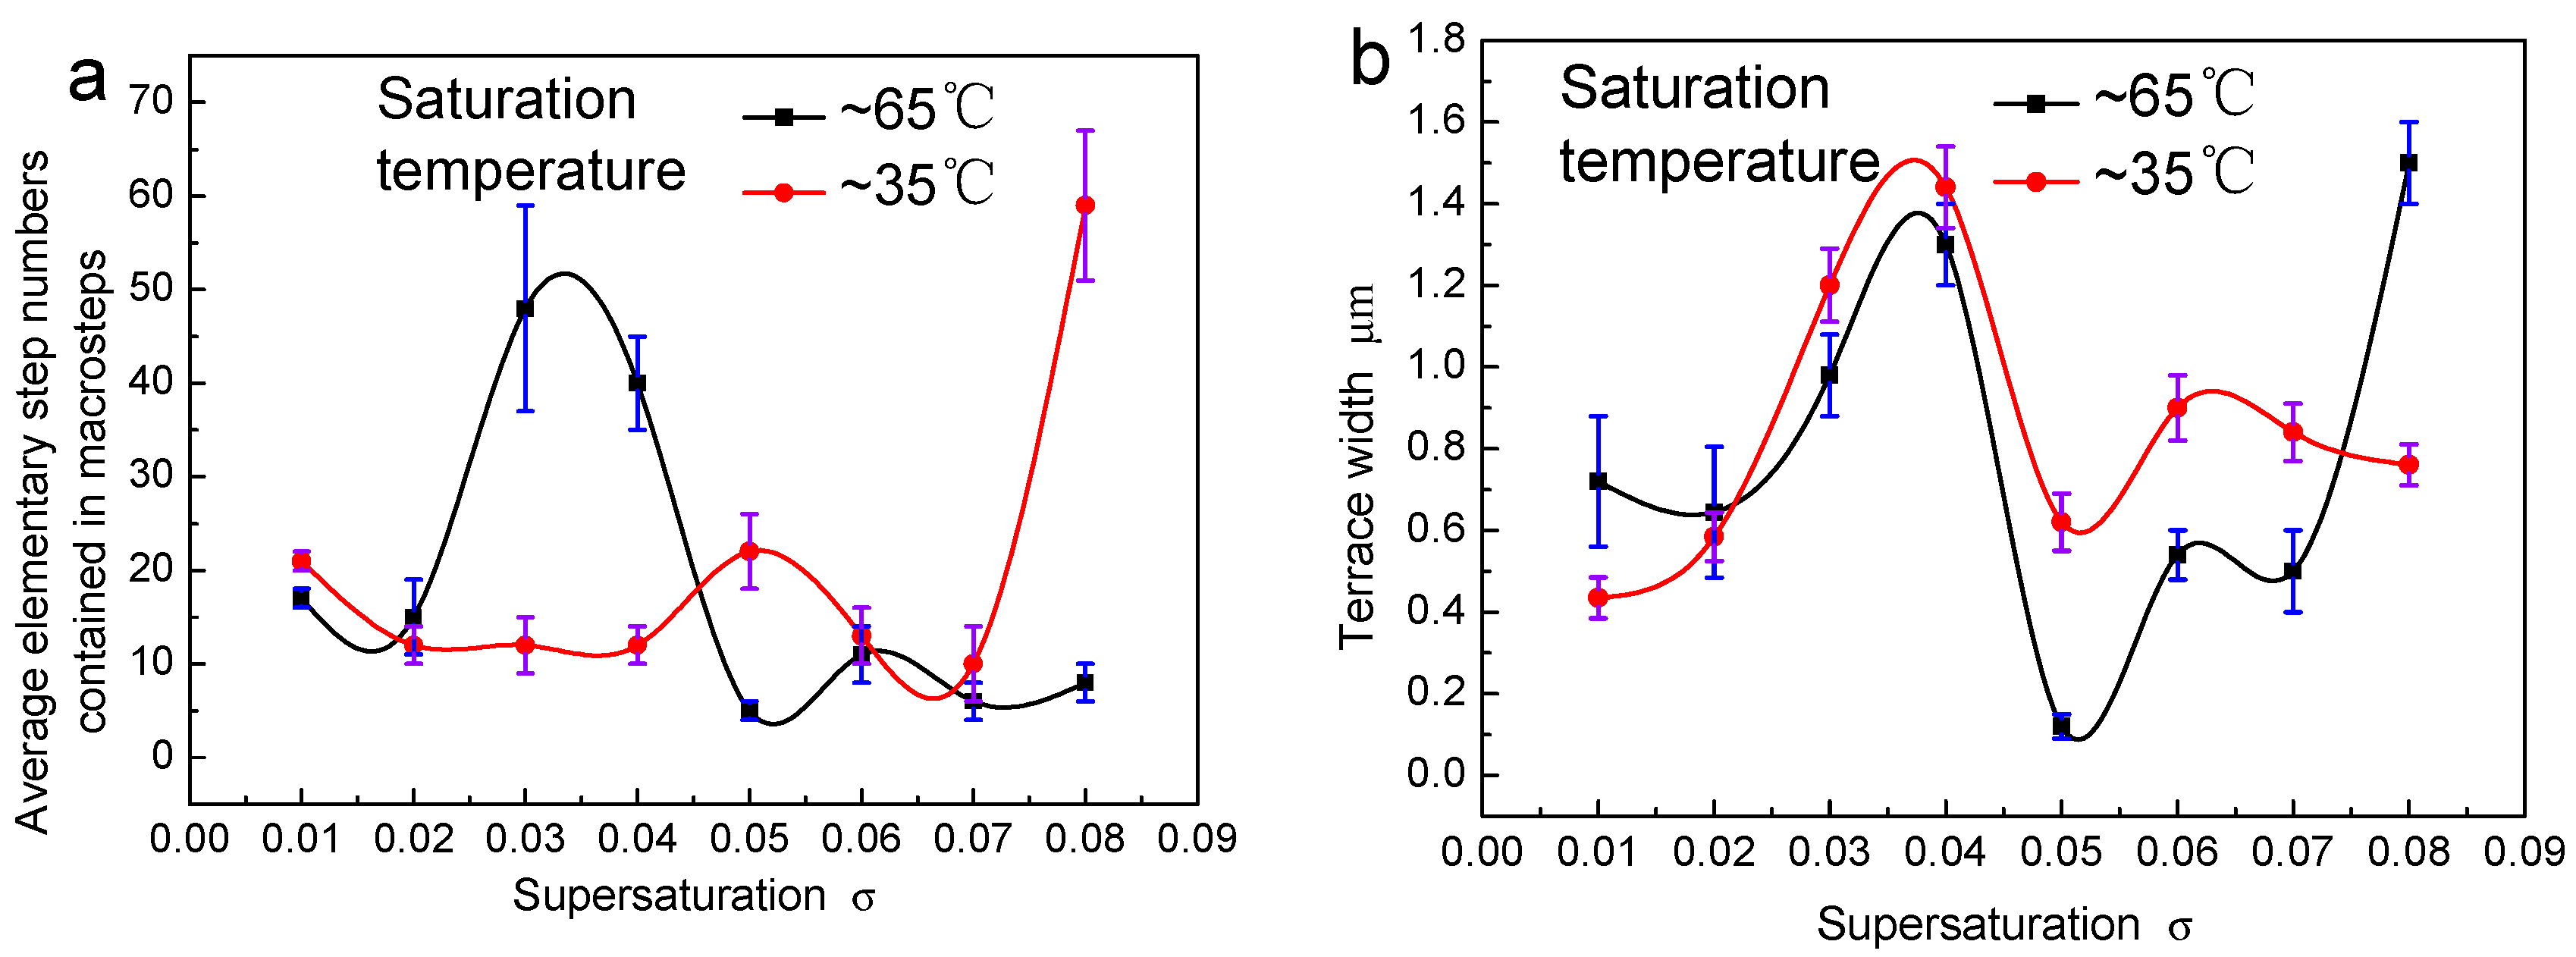
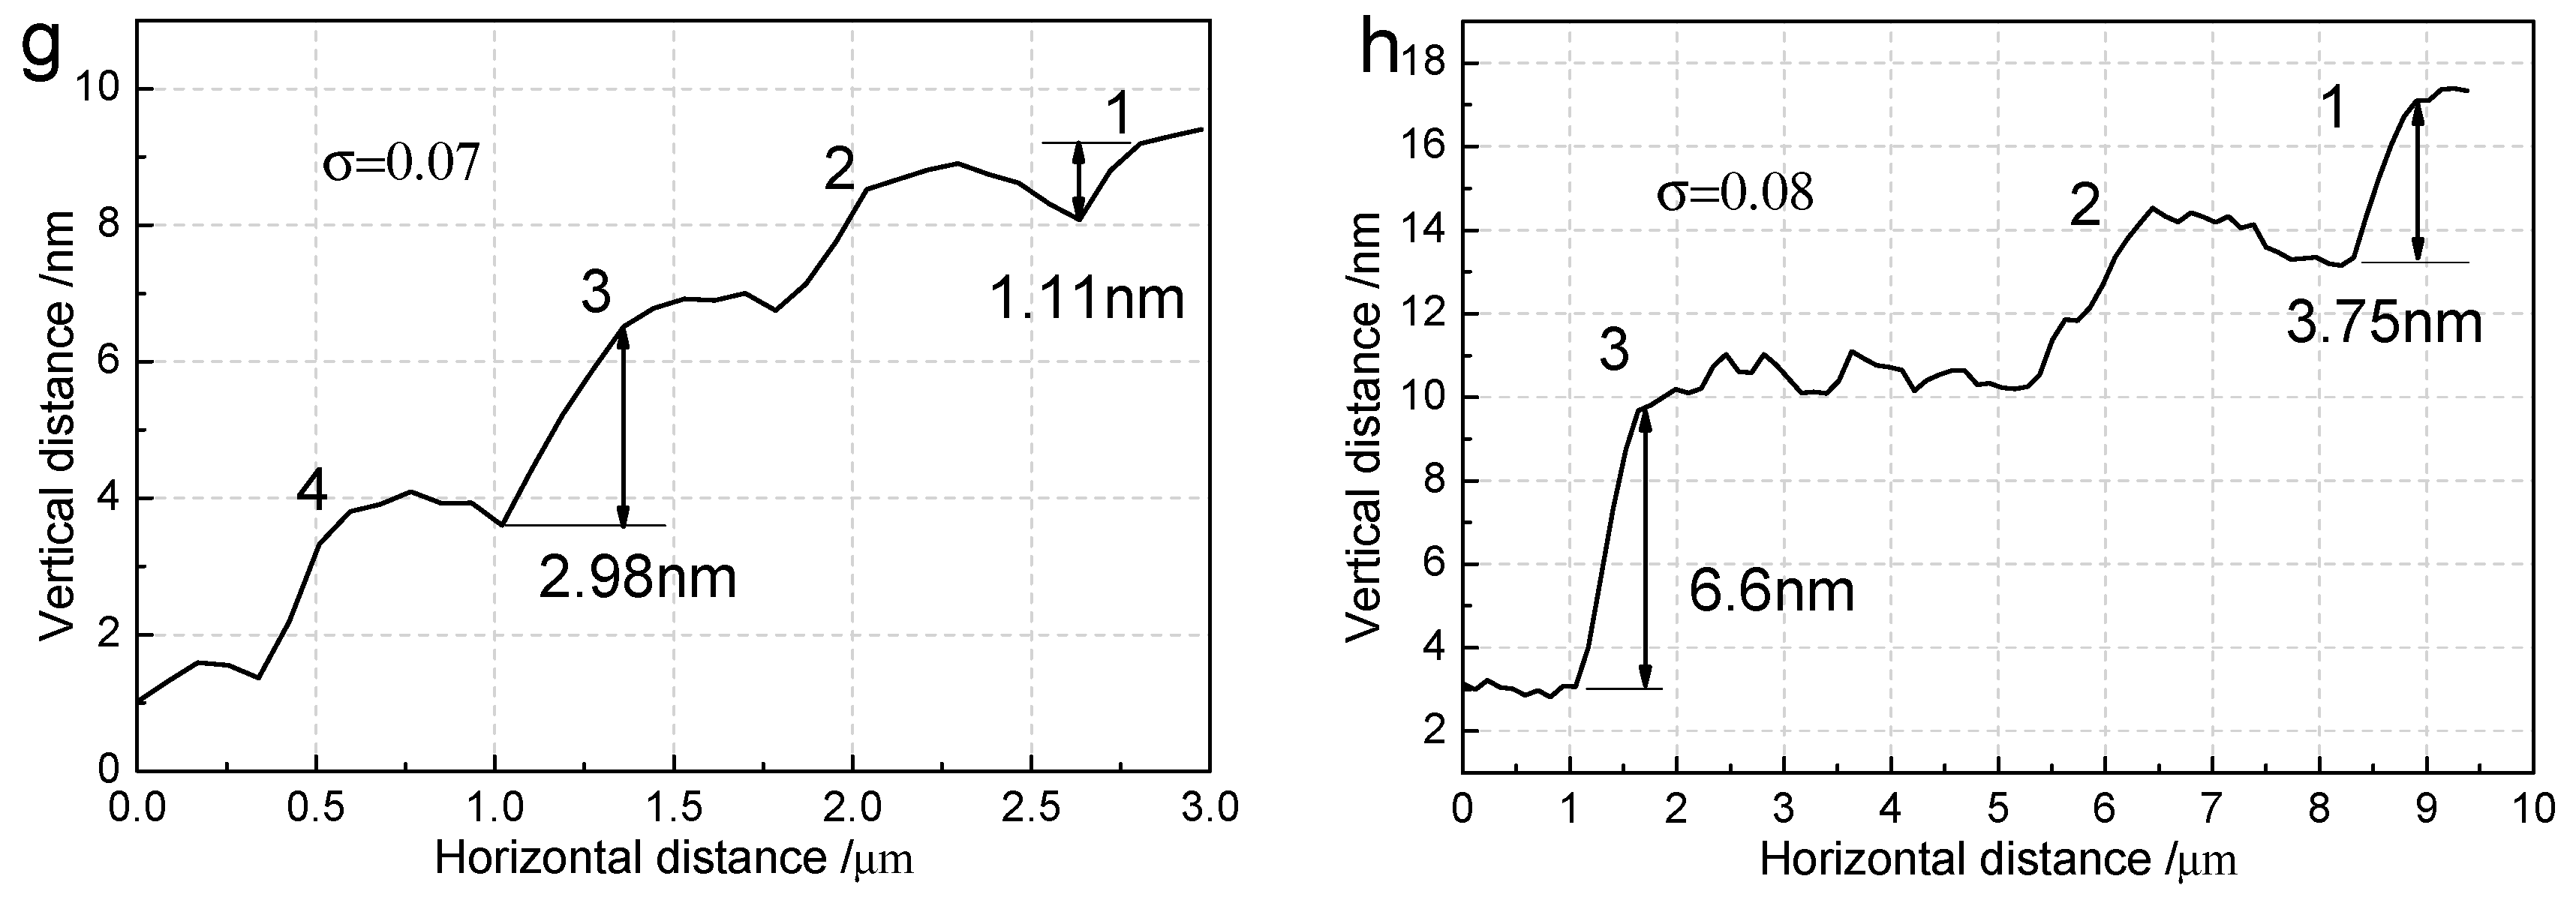
3.3. The Step Structure on (100) Faces

The areas marked with white dotted box in Figure 3 were chosen to measure the step structure and obtain the detailed information about the steps. The height and average width of steps in each area are illustrated in Figure 4a–h.
It can be seen that there were mainly the macrosteps on the crystals surface. A few small bunching steps appeared on the surface at the supersaturation of 0.01, they faded away with the rise of supersaturation. The step height reached a maximum value about 11.3~24.4 nm at σ = 0.03 and minimum value about 1.5~1.85 nm at σ = 0.05, respectively. When the supersaturation was 0.08, it could be seen clearly that some small bunching steps occurred on the macrostep terrace. These small bunching steps were segregated from the big macrosteps at high supersaturation.
For KDP crystals, the bunching, average width, and slope of step are sensitive to supersaturation. The relationships between the three parameters and supersaturation at the saturation temperature of 65 °C are shown in Figure 5. For comparison, the relationship at the saturation temperature of 35 °C are also displayed in Figure 5 [16]. The elementary number was calculated as the step height divided by the elementary step height, which was 0.37 nm, or half unit cell height [17].
It can be seen that the step bunching increased markedly in the middle section of the supersaturation range for the saturation temperature around 65 °C. The supersaturation was around σ = 0.03 to σ = 0.04. Then the step bunching changed little with the rise of supersaturation. Contrasted to the situation at elevated temperature, the supersaturation apex of step bunching emerged around σ = 0.05, and the step height rose rapidly for σ = 0.08 when the saturation temperature was around 35 °C [16].
The terrace width had a similar trend with step bunching except for high supersaturation at the elevated temperature. The terrace width increased sharply at the supersaturation of σ = 0.08, which was different from the situation around 35 °C.
The step slope first increased then decreased with the rise of supersaturation when the saturation temperature was around 65 °C. The step slope had a peak at σ = 0.03 to σ = 0.04, which was consistent with the apex of step bunching. The peak position was at σ = 0.05 when the temperature was around 35 °C. The step slope was synchronized with step bunching at these peaks. For σ = 0.01 and σ = 0.08, the slope of the crystal grown around 65 °C was very low, which was different from the situation around 35 °C.

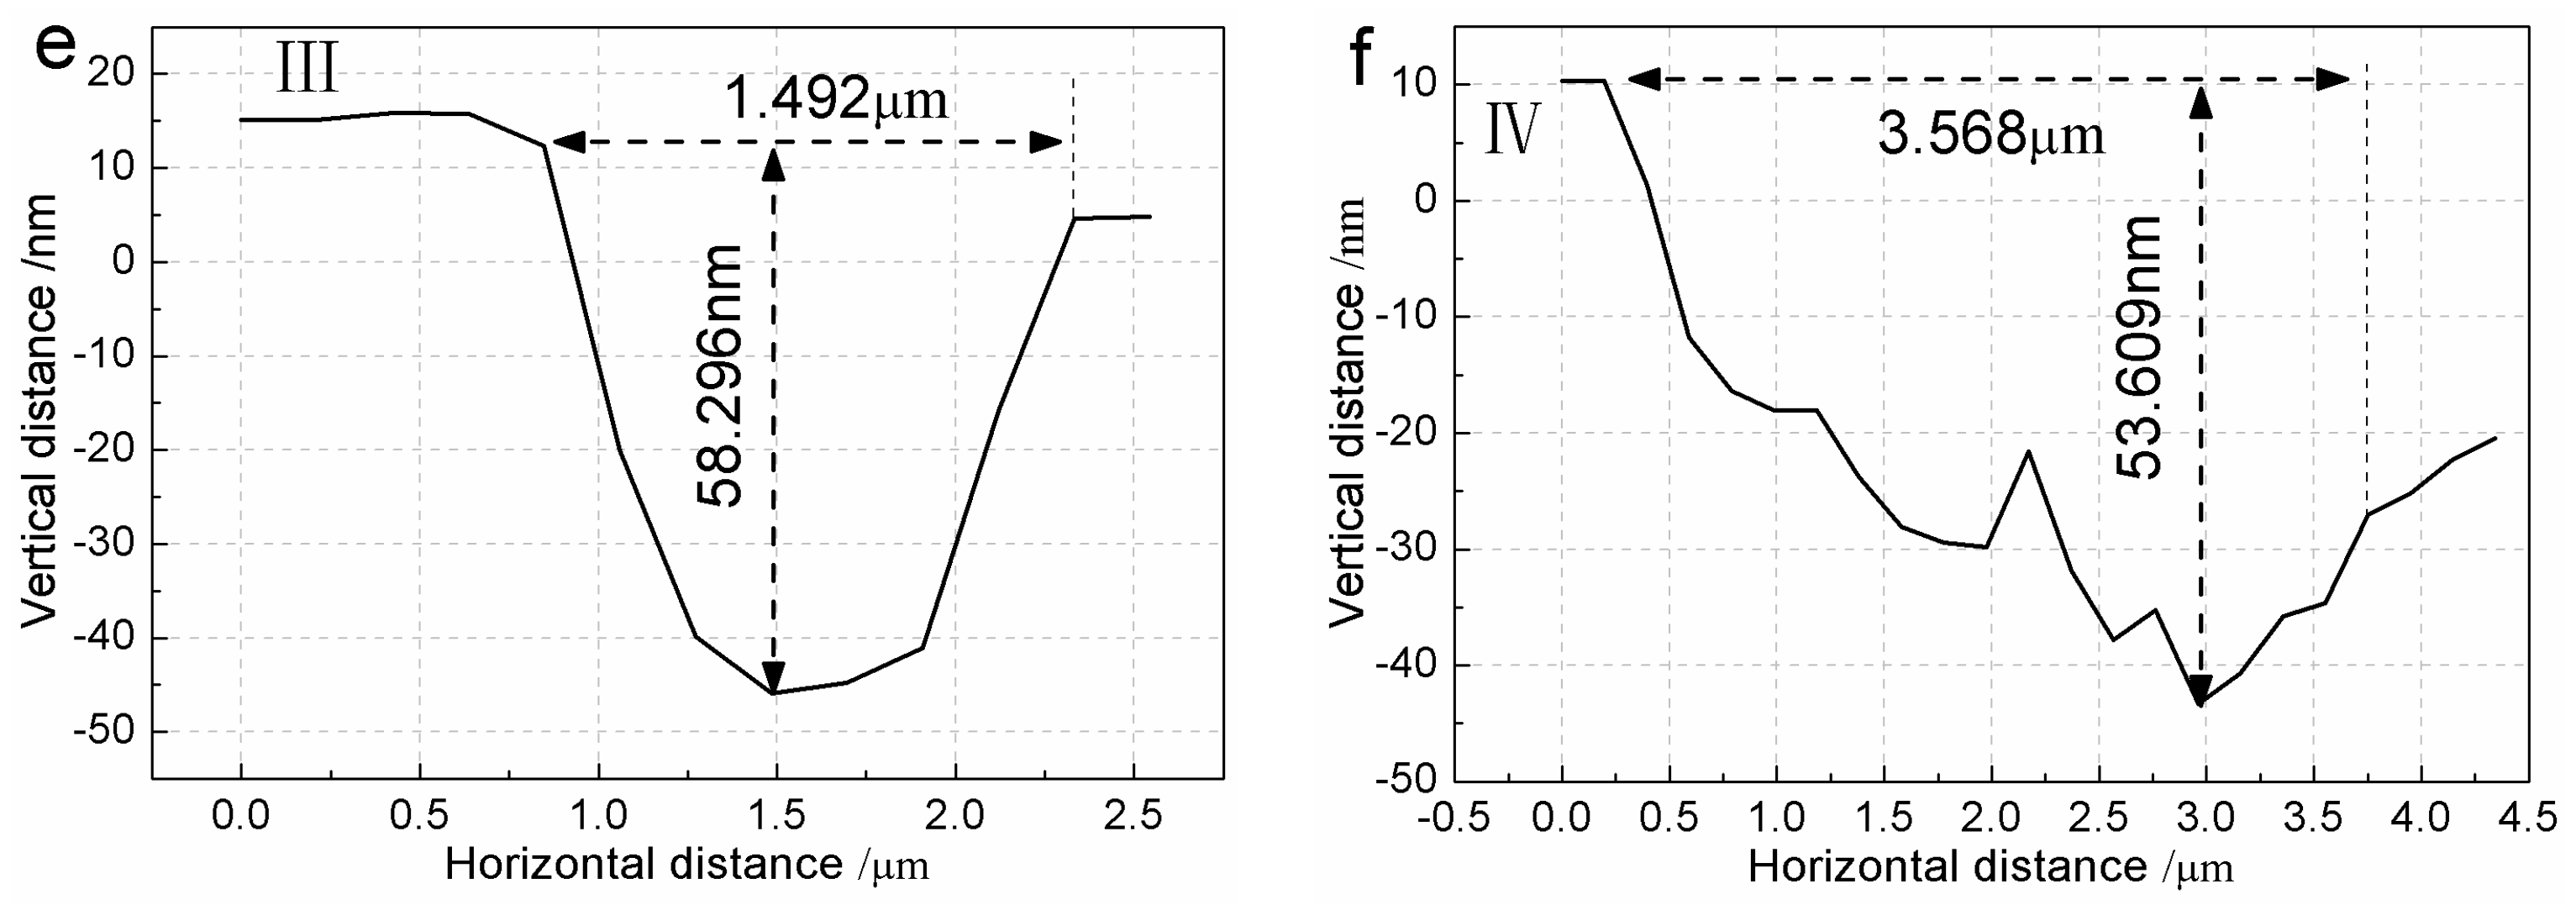
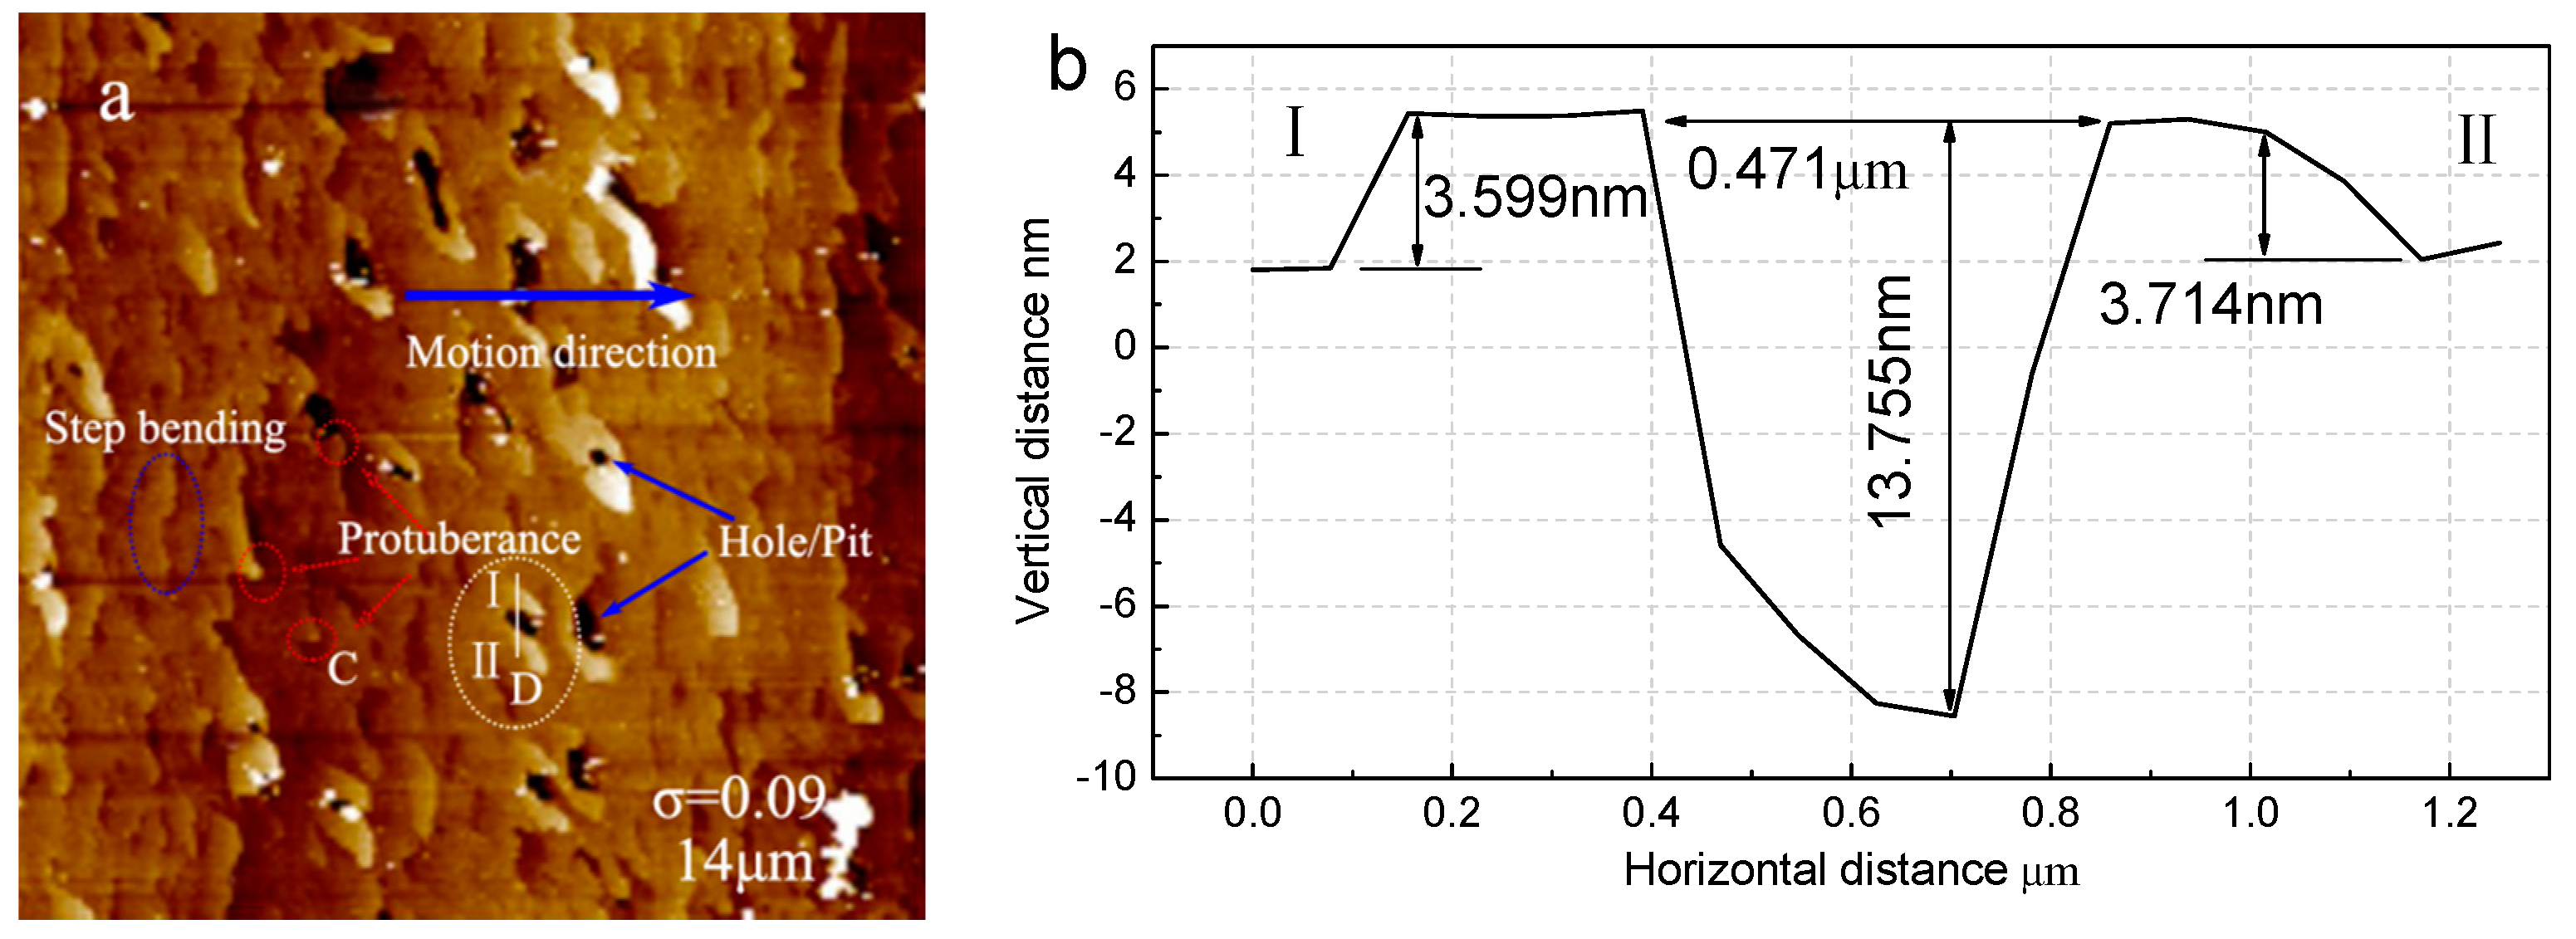
3.4. Step Structure on (100) Face for σ = 0.09

In order to study the effect of high supersaturation on the evolution of these pits, we grew crystals at σ = 0.09. The morphology of the crystals are shown in Figure 6a,b. It can be seen that more pits obviously appeared on the crystal surface. These pits shaped were like ‘spindles’ and were approximately arranged in a row.
The detail information of the typical pits at the step edge are displayed in Figure 6c–f. The long direction was perpendicular to the step motion direction, the short direction was parallel to the step motion direction. The structures of position “A” and “B” marked in Figure 6a were measured. At position “A”, the length of long and short direction were about 5.146 and 1.56 μm. At position “B”, the two values were about 3.568 and 1.492 μm, respectively. The height of the two pits were about 28.8~35.446 nm and 53.609~58.296 nm, respectively.
The step structure was considerably different from the ordinary steps. These pits on the step terrace may lead to some defects, such as vacancies and inclusions, which would result in deterioration of the crystal quality.
The other typical area on the crystal surface was observed, the morphology is shown in Figure 7a. The steps were twisted like waves. Some protuberances occurred at the step edge. The direction of the protuberance evolution was consistent with the steps flow. The radius of the small protuberance at position “C” was about 74 nm.
The structure along the line from I to II at the position “D” was measured, the information is shown in Figure 7b. It can be seen that the top of the two protuberances were both flat. At the end of “I”, the height between the protuberance with the step terrace on the bottom was about 3.559 nm. At the end of “II”, the height was about 3.714 nm. In addition, the width and height of the pit were about 0.471 μm and 13.755 nm, respectively.

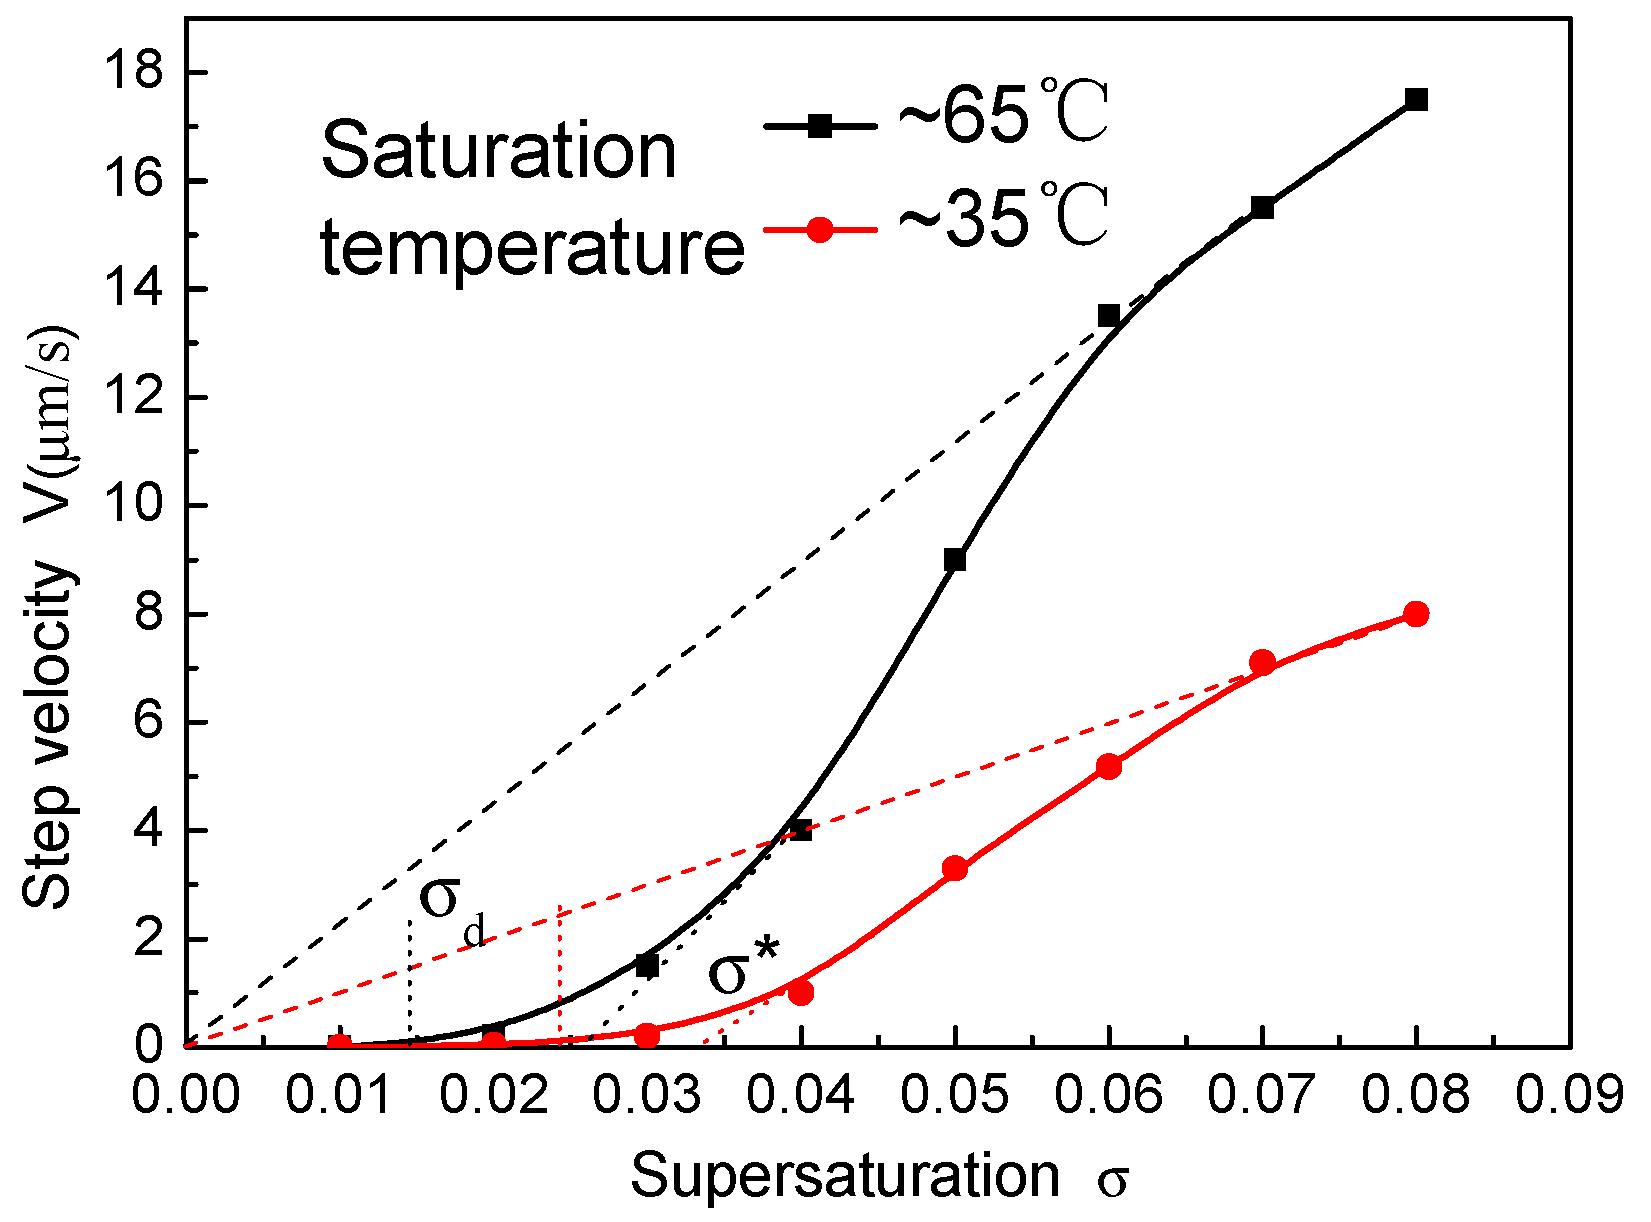
3.5. Growth Rate Versus the Supersaturation

In this experiment, the variations of the normal growth rate R versus supersaturation were measured by laser polarization interference system. According to the theory of BCF, there is a geometrical relation between the growth rate of a crystal face in the normal direction R with the tangential velocity of the steps v [14]:
R = p v
where p is the slope of the steps. Combining with the slope which was preciously observed by AFM, the variations of the tangential velocity v with supersaturation were obtained. The relationship between step velocity with supersaturation is displayed in Figure 8. For comparison, the experimental results obtained at low saturation temperature are also shown in Figure 8 [16].
It can be seen that the step velocity around 65 °C was faster than the velocity around 35 °C at the same supersaturation. The step speed both increased gradually after a “dead zone” where no growth occurred. At low supersaturation, the growth rate was slow. Above another high supersaturation zone, the growth rate rose rapidly approaching linearly. Referring to Terry A. Land’s experimental methods [7], there was a supersaturation dead zone σd and a linear region σ* in the process of step tangential evolution with the change of the supersaturation. Both of the critical supersaturations in the process of crystal growth, dead zone σd, and linear region σ*, are shown in Table 1.
The supersaturation dead zone σd and linear region σ* around 65 °C were both less than the values around 35 °C. As shown in Figure 8, the dependence v(σ) became a straight line passing through the origin [19] at σ = 0.06 around 65 °C and at σ = 0.07 around 35 °C. The three values of the supersaturation dead zone σd, linear region σ*, and the critical supersaturation linearly passing through the origin all reduced with the rise of saturation temperature.

4. Discussion

4.1. Effect of Temperature on Kinetic Coefficients

Our experimental results indicate that supersaturation is one of the most important factors to effect crystal growth. The greater the supersaturation, the faster the crystal growth rate. According to the spiral growth model [14,20], when the supersaturation is very small, the face growth rate can be written as
R = A σ 2
where A is a coefficient. When the supersaturation is larger, the face growth rate can be written as
R = β l σ
where β l is the kinetic coefficient. Equations (7) and (8) represent the ideal parabolic and linear laws, respectively. The step velocity increased slowly at low supersaturation, the dependence v(σ) was parabolic law. At high supersaturation, a steep rise was observed and the dependence v(σ) was linear law. It was consistent with our test results.
From the curve fitting of the parabolic and linear part, we obtained the coefficient A and β l , which were shown in Table 1. It can be seen that the two coefficients, A and β l , both increased with the rise of the saturation temperature. The β l value around 35 °C was near the result measured by A.V. Belustin, the crystal grew at 30 °C [18], which was similar to our experimental temperature [16].
When temperature increased from 35 °C to 65 °C, the coefficient A and β l both increased manifold. This results can partly explained by Arrhenius type kinetics for the elementary stage of crystal growth [21]. The crystallization process in our experiment was an exothermic process. The Arrhenius equation gives the dependence of the rate constant k of a reaction on the absolute temperature T (in Kelvin) as
k = A e E a K B T
where KB is the Boltzmann constant; A is the pre-exponential factor, a constant for each chemical reaction that defines the rate due to frequency of collisions in the correct orientation; and Ea is the activation energy for the reaction. We can infer that the reaction rate constant increase with the rise of temperature. The results suggested that the temperature was a very important factor influencing the kinetic coefficients and the crystal growth.

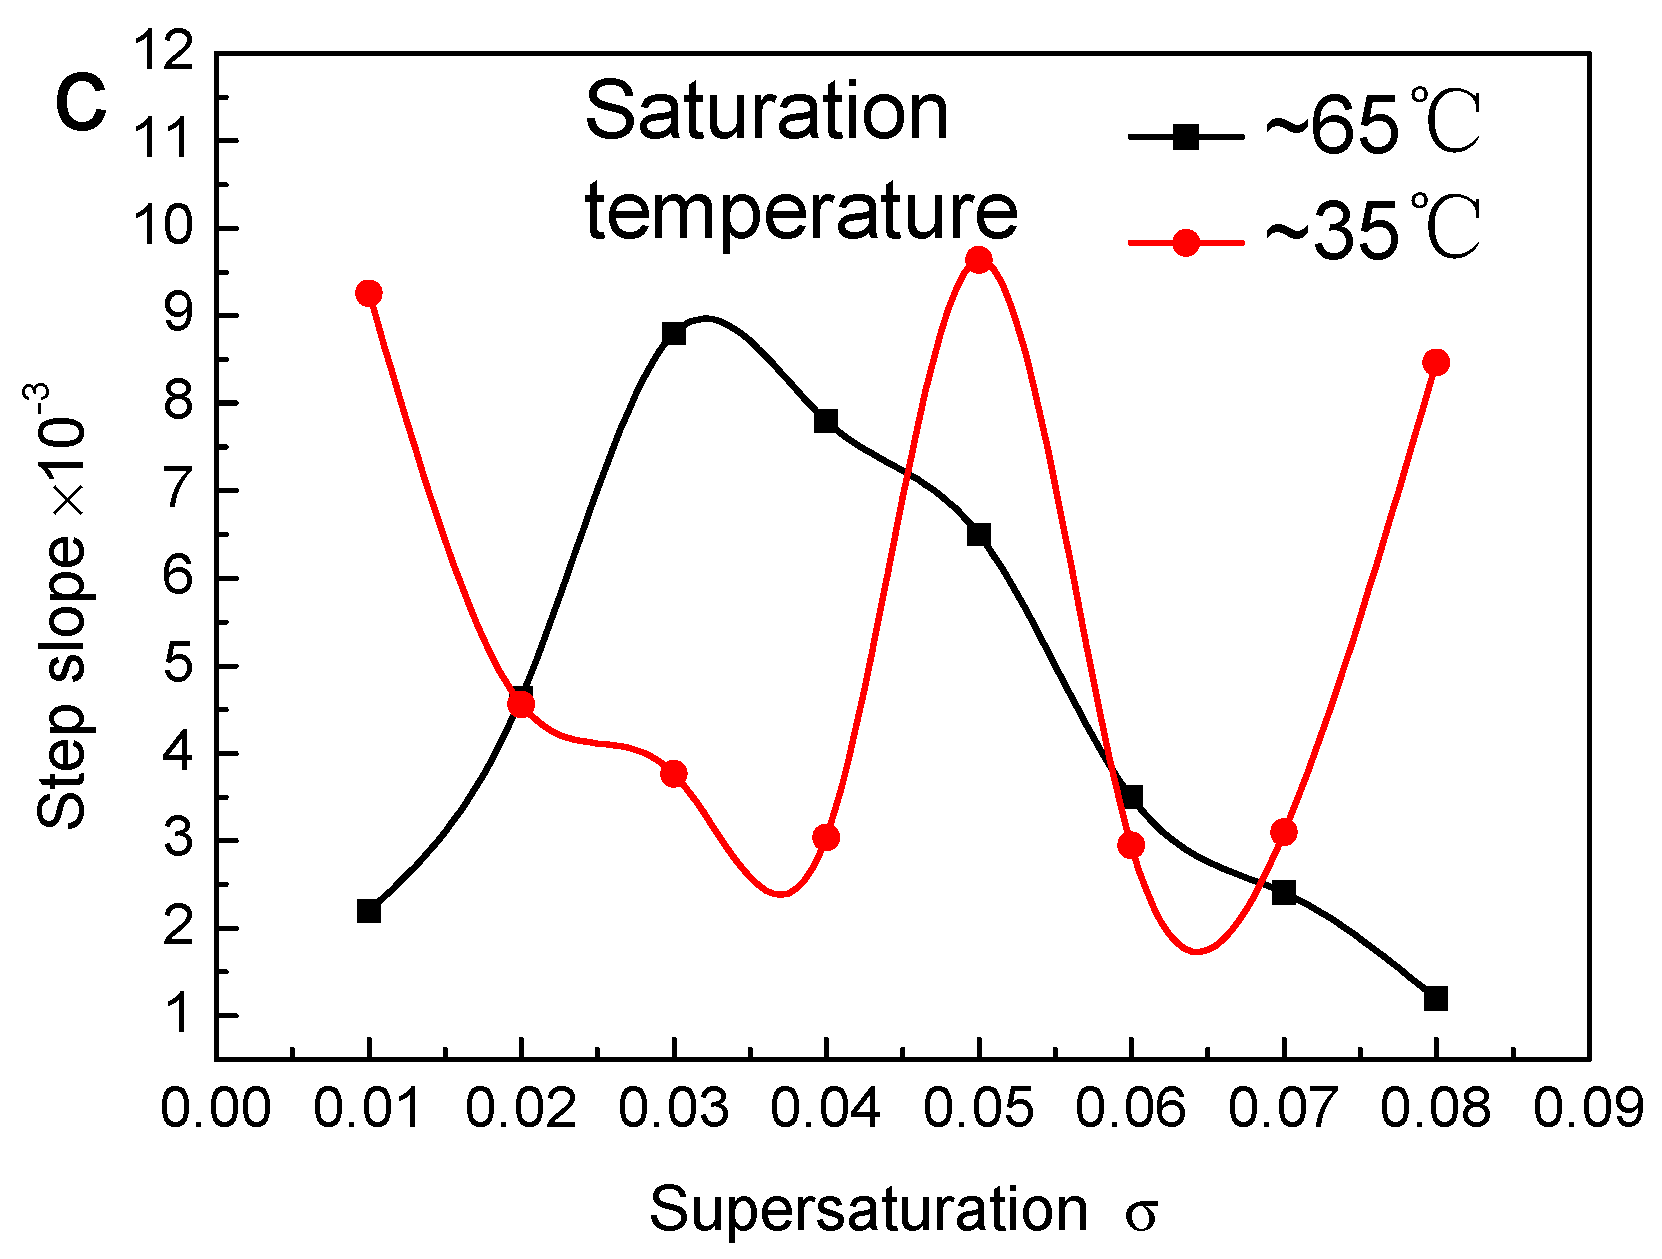
4.2. Effect of Temperature on Step Bunching

Our results show that the steps height occurred increase at σ = 0.03 and 0.04 in the process of crystal growth. The supersaturation of 0.03 and 0.04 were just beyond the linear region σ* when the temperature was around 65 °C. According to the research of L.N. Rashkovich [9] et al., the range of supersaturation where the derivative dV/dσ was high was most hazardous for the crystal growth. Within this interval, the change of the adsorbed impurity concentration and surface supersaturation would cause significant velocity variation. The velocity variation of the single step in the step column would lead to the step bunching. From the curve in Figure 8, it was found that the supersaturation interval were about 0.03 and 0.04 around 65 °C, the relevant supersaturation was about 0.05 around 35 °C. The supersaturation intervals were corresponded with the apex of step bunching which was shown in Figure 5. The moment of step bunching appeared fluctuation was delayed with the decrease of temperature. T.N. Thomas [17] found that growth on the (100) face occurred almost exclusively at macrosteps, which increased in height and terrace width with distance from the top of the hillock when σ > 0.035.
J. X. Ding [22] thought that the step bunching increased with the rise of supersaturation, and the slope reached stable ultimately. When the supersaturation rose as high as σ = 0.08 in our experiments, the step bunching changed little, the terrace width increased sharply and the step slope decreased, which was utterly different from the situation around 35 °C. We thought that the differences were attributed to the mode of step movement at high supersaturation. The supersaturation located in the linear region. Both the normal growth rate R and tangential velocity V increased with the rise of supersaturation. When the temperature was around 65 °C, the elementary steps and macrosteps both moved fast with a similar speed, which led to the crystal growth having no need to complete by great step bunching. The step spacing was large due to the fast tangential velocity and the step slope decrease. Contrasted with the situation at elevated temperature, the step tangential velocity was low and could not keep pace with the normal growth rate when the supersaturation increased as high as 0.08. In this case, the crystal growth was achieved by step bunching so that the slope rose rapidly. The terrace width was small due to the slow step tangential velocity. The diversity of step evolution was considered to be the result of the energetic barrier difference between elevated temperature and low temperature. A system should overcome the energetic barrier [23] was
Δ G c = 16 π α 3 ω 2 3 ( Δ μ ) 2
Δ μ = σ k T
where ω is the volume of a molecule of the crystallizing matter, α is the specific free energy of a step edge, k is Boltzmann constant, and T is the temperature in Kelvin. It can be seen that the energetic barrier reduced with the rise of temperature at the same supersaturation. The solute unit diffusion on the surface and growth was more easy around 65 °C than around 35 °C.
Another difference was the value of step slope at the supersaturation of σ = 0.01. When the temperature was around 65 °C, the step slope was lower by an order of magnitude than that around 35 °C. We also attributed the difference to the diversity of energetic barrier caused by temperature. The supersaturation lwas ocated in the growth dead zone σd. The macrosteps were immobile, but the elementary steps still moved at a very slow speed in fact. The terrace width was grew slightly and it led to the step slope becoming small, which is different from the situation around 35 °C. Both macrosteps and elementary steps were immobile at the supersaturation of σ = 0.01 around 35 °C.

4.3. Appearance of Pits at High Supersaturation

It was found that a few shallow pits appeared on the crystal surface when the supersaturation was above 0.08. From the AFM image, we can see that these pits and holes were surrounded by protuberances. Combined with the step morphology, we thought that the forming of these pits/holes were related with the step movement. At high supersaturation, the KDP crystals might grow by both step evolution and 2D nuclei mechanism. Then, how these protuberances were formed? Was it known that the solute units would tend to be adsorbed on the bottom of the step edge, or whether it would generate the 2D nuclei at the step edge?
In the classic work on the crystals growth, BCF showed that the critical radius was related to the supersaturation σ by [14]
r c = w α / k T σ
By combining the previous Rashkovich’s studies [24], the critical radius for σ = 0.09 could be calculated to be about 4.61 nm. The value was far less than the radius of protuberance measured in Figure 7a. According to the structure of the protuberances which were shown in Figure 7b, we thought that these protuberances might be formed by the development of 2D nuclei. The studies of J.J. De Yoreo [25] and D XU [26] also showed that growth occurred on monomolecular steps both by step-flow and through layer-by-layer growth on both dislocation induced steps and 2D nuclei.
The elementary steps and macrosteps were both moved fast at high supersaturation as shown in Figure 8. Some solute units were adsorbed at the step edge. The local supersaturation was non uniform and 2D nuclei formed. Some of them would link together and form large nucleus at the step edge. As growth proceed, these nucleus developed into protuberances as shown in Figure 7. There were gaps between the adjacent protuberances on the step terrace. The ability to capture growth units around the protuberances was larger than in the gaps. The gaps would become pits with the development of the protuberances, and they even might form holes. These holes were not easy to close in the process of crystal growth because that the supersaturation was not homogeneity around the edge of holes. The solute diffusion was impeded in the holes so that the step was difficult to grow. In addition, the steps became more bent due to the 2D nuclei presence. It made the steps evolve like waves. The adjacent wavy steps moved inconsistently, which may also lead to the appearance of the pits and holes.
S. J. Zhu [27] found that the numbers of scattering particles and liquid inclusions increased with the rise of supersaturation. These scattering particles may lead to the reduction of the crystals optical properties at high supersaturation. In our experiment, the sizes of these pits and holes were at the micron level, which was consistent with the size of scattering particles and inclusions in the crystal. We thought that the appearance of these pits and holes may cause a decline in optical properties of KDP crystals.

5. Conclusions

The crystals growth rate, step bunching, and motion direction of elementary steps and macrosteps were all obtained in the process of crystal growth. In different supersaturation ranges, variations in step evolution direction caused considerable step bunching and velocity change. The step bunching increased rapidly at σ = 0.03 and σ = 0.04 at elevated temperature. It was the result that the supersaturation located the interval where the derivative dV/dσ was high. The moment of step bunching appeared fluctuation was delayed with the decrease of temperature. A few pits and holes appeared on the crystal surface at high supersaturation. The forming of these pits and holes may be related with the combined effect of step movement and 2D nuclei mechanism.

Acknowledgments

This work was financially supported by National Natural Science Foundation of China (No.51321062) and National Science Foundation for Young Scientists of China (No.51202131).

Author Contributions

Weidong Li and Shenglai Wang conceived and designed the experiments; Weidong Li, Jianxu Ding and Duanliang Wang performed the experiments; Pingping Huang and Hui Liu analyzed the data; Guangwei Yu, Qingtian Gu and Xinguang Xu contributed analysis tools; Weidong Li wrote the paper.

Conflicts of Interest

The authors declare no conflict of interest.

References

  1. Yoshida, H.; Jitsuno, T.; Fujita, H.; Nakatsuka, M.; Yoshimura, M.; Sasaki, T.; Yoshida, K. Investigation of bulk laser damage in KDP crystal as a function of laser irradiation direction, polarization, and wavelength. Appl. Phys. B 2000, 70, 195–201. [Google Scholar] [CrossRef]
  2. De Yoreo, J.J.; Burnham, A.K.; Whitman, P.K. Developing KH2PO4 and KD2PO4 crystal for world’s most powerful laser. Int. Mater. Rev. 2002, 47, 113–152. [Google Scholar] [CrossRef]
  3. Sangwal, K. Effects of impurities on crystal growth process. Cryst. Growth Charact. 1996, 32, 3–43. [Google Scholar] [CrossRef]
  4. Leroudier, J.; Zaccaro, J.; Ildefonso, M.; Veesler, S.; Baruchel, J.; Ibanez, A. Nucleation control and rapid growth of KDP crystals in stationaryconditions. Cryst. Growth Des. 2011, 11, 2592–2598. [Google Scholar] [CrossRef]
  5. Zaitseva, N.; Carman, L.; Smolsky, I.; Torres, R.; Yan, M. The effect of impurities and supersaturation on the rapid growth of KDP crystals. J. Cryst. Growth 1999, 204, 512–524. [Google Scholar] [CrossRef]
  6. Liu, G.X.; Wang, S.L.; Gu, Q.T.; Ding, J.X.; Sun, Y.; Liu, W.J.; Zhu, S.J.; Liu, L. Numerical simulation of temperature field of KDP crystal grown by traditional method. J. Synth. Cryst. 2013, 42, 1261–1266. [Google Scholar]
  7. Rashkovich, L.N.; Kronsky, N.V. Influence of Fe3+ and Al3+ ions on the kinetics of steps on the {100} faces of KDP. J. Cryst. Growth 1997, 182, 434–441. [Google Scholar] [CrossRef]
  8. Land, T.A.; Martin, T.L.; Potapenko, S. Recovery of surfaces from impurity poisoning during crystal growth. Nature 1999, 399, 442–445. [Google Scholar] [CrossRef]
  9. Sangwal, K.; Torrent-Burgues, J.; Gorostiza, P.; Sanz, F. AFM study of the behavior of growth steps on the (100) faces of KDP crystals and the tapering phenomenon. Cryst. Res. Technol. 1999, 34, 667–675. [Google Scholar] [CrossRef]
  10. Min, C.; Li, M.W.; Guo, J.L.; Cao, Y.C. Ex situ and in situ AFM investigations on the growth of the (100) face of KDP with different pH values. Sci. China Technol. Sci. 2010, 53, 1554–1561. [Google Scholar]
  11. Ding, J.X.; Wang, S.L.; Xu, X.G.; Gu, Q.T.; Sun, X.; Li, Y.P.; Wang, B.; Liu, G.X.; Liu, W.J.; Sun, Y. Investigation on (100) face of KDP crystal poisoned by MoO42− impurity. J. Mater. Sci. 2012, 47, 5232–5240. [Google Scholar] [CrossRef]
  12. Liu, F.F.; Zhang, L.S.; Yu, G.W.; Sun, X. Effect of pH value on the growth morphology of KH2PO4 crystal grown in defined crystallographic direction. Cryst. Res. Technol. 2015, 50, 164–170. [Google Scholar] [CrossRef]
  13. Zhu, S.J.; Wang, S.L.; Ding, J.X.; Liu, G.X.; Liu, W.J.; Liu, L.; Wang, D.L.; Li, W.D.; Gu, Q.T.; Xu, X.G. Imorovement of growth rate and optical performances of rapidly gown KDP crystal by adding cyclohexane tetraacetic acid in growth solution. J. Cryst. Growth 2014, 388, 98–102. [Google Scholar] [CrossRef]
  14. Burton, W.K.; Cabrera, N.; Frank, F.C. The growth of crystals and the equilibrium structure of their surfaces. Philos. Trans. R. Soc. Lond. 1951, 243, 299–358. [Google Scholar] [CrossRef]
  15. Liu, B.; Fang, C.S.; Wang, S.L. In situ measurement of growth kinetics of (100) KDP crystal faces in the presence of polyphosphate impurities. Cryst. Res. Technol. 2008, 43, 700–708. [Google Scholar] [CrossRef]
  16. Li, W.D.; Wang, S.L.; Yu, G.W. Influence of supersaturation on the growth and surface morphology of KDP crystals. J. Chin. Ceram. Soc. 2016, in press. [Google Scholar]
  17. Thomas, T.N.; Land, T.A.; Martin, T.; Casey, W.H.; de Yoreo, J.J. AFM investigation of step kinetics and hillock morphology of the {100} face of KDP. J. Cryst. Growth 2004, 260, 566–579. [Google Scholar] [CrossRef]
  18. Belustin, A.V.; Kolina, A.V. Growth kinetics of potassium dihydrophosphate crystals. Kristallografyia 1975, 20, 206–207. [Google Scholar]
  19. Rashkovich, L.N. KDP Family of Crystals; Hilger: Bristol, UK, 1991. [Google Scholar]
  20. Frank, F.C. Crystal Growth; Butterworths: London, UK, 1959. [Google Scholar]
  21. Arrhenius, S.A. Uber die Dissociationswarme und den Einfluss der Temperatur auf den Dissociationsgrad der Elektrolyte. Z. Phys. Chem. 1889, 4, 96–116. [Google Scholar] [CrossRef]
  22. Ding, J.X.; Wang, S.L.; Mu, X.M.; Yu, G.W.; Xu, X.G.; Sun, X.; Liu, W.J. AFM investigation on step bunching on (100) face of KDP crystal. J. Inorg. Mater. 2010, 25, 1191–1194. [Google Scholar] [CrossRef]
  23. Zaitseva, N.; Carman, L. Rapid growth of KDP-type crystals. Prog. Cryst. Growth Charact. Mater. 2001, 43, 1–118. [Google Scholar] [CrossRef]
  24. Rashkovich, L.N.; Mkrtchyan, A.A.; Chernov, A.A. Optical interference investigation of growth morphology and kinetics of (100) face of ADP from aqueous solution. Sov. Phys. Crystallogr. 1985, 30, 380–387. [Google Scholar]
  25. De Yoreo, J.J.; Land, T.A.; Dair, B. Growth morphology of vicinal hillocks on the {101} face of KH2PO4: From step-flow to layer-by-layer growth. Phys. Rev. Lett. 1994, 73, 838. [Google Scholar] [CrossRef] [PubMed]
  26. Geng, Y.L.; U, D.X.; Sun, D.L. Atomic force microscopy studies on growth steps and 2D nuclei on the {100} faces of deuterated L-arginine phosphate crystals. Surface Rev. Lett. 2004, 11, 379–383. [Google Scholar] [CrossRef]
  27. Zhu, S.J.; Wang, S.L.; Ding, J.X.; Liu, G.X.; Wang, D.L.; Liu, L.; Gu, Q.T.; Xu, X.G. Effect of supersaturation on growth and optical properties of KDP crystal. J. Synth. Cryst. 2013, 42, 1973. [Google Scholar]
Figure 1. Schematic of the set-up for situ measurement of growth rate. 1: He-Ne laser; 2: Polarizer; 3: Beam splitter; 4: Diaphragm; 5: Stirrer; 6: Thermocouple; 7: Crystal; 8: Analyzer; 9: Photocell; 10: Computer; 11: AI-708P temperature controller; 12: Photocell; 13: Thermostatic vessel; 14: FP21 temperature controller.
Crystals 07 00118 g001
Figure 2. The material object and aspect ratio of crystals grown at different supersaturation.
Crystals 07 00118 g002
Figure 3. The micromorphology on (100) faces of KDP crystals grown at supersaturation of 0.01~0.08. (a) σ = 0.01, 20 × 20 μm; (b) σ = 0.02, 20 × 20 μm; (c) σ = 0.03, 30 × 30 μm; (d) σ = 0.04, 30 × 30 μm; (e) σ = 0.05, 10 × 10 μm; (f) σ = 0.06, 20 × 20 μm; (g) σ = 0.07, 10 × 10 μm; (h) σ = 0.08, 20 × 20 μm. (Inserts are the corresponding 3-D graphics, blue arrows stand for step motion direction).
Crystals 07 00118 g003
Figure 4. Step height and width measured according to AFM images. (a) σ = 0.01; (b) σ = 0.02; (c) σ = 0.03; (d) σ = 0.04; (e) σ = 0.05; (f) σ = 0.06; (g) σ = 0.07; (h) σ = 0.08.
Crystals 07 00118 g004aCrystals 07 00118 g004b
Figure 5. (a) Average elementary step numbers contained in macrosteps, (b) terrace width, and (c) step slope depend on the supersaturation at different saturation temperatures of 65 °C and 35 °C.
Crystals 07 00118 g005aCrystals 07 00118 g005b
Figure 6. The step structure on (100) face for σ = 0.09. (a) The AFM image; (b) corresponding 3-D image; (c,e) The structure of the two holes parallel to the step motion direction; (d,f) The vertical structure of the two holes in the step motion direction.
Crystals 07 00118 g006aCrystals 07 00118 g006b
Figure 7. (a) Micromorphology on the crystal surface where the large pits had not been formed; (b) The structure along the line from I to II at the position “D”.
Crystals 07 00118 g007
Figure 8. The relationship between step velocity and supersaturation at different supersaturation temperature of 65 °C and 35 °C.
Crystals 07 00118 g008
Table 1. The values of σd, σ*, A, β l at different saturation temperature.
Saturation Temperatureσd (%)σ* (%)A (10−6 m/s) β l (10−6 m/s) β l (10−6 m/s) [18]
~35 °C2.43.35.0751.2611.394 (30 °C)
~65 °C1.512.642.585.096

