
HPHT Diamond Crystallization in the Mg-Si-C System: Effect of Mg/Si Composition
by
Yuri Palyanov
1,2,*, 
Igor Kupriyanov
1,2,
Yuri Borzdov
1,2,*,
Denis Nechaev
1 and
Yuliya Bataleva
1 1
Sobolev Institute of Geology and Mineralogy SB RAS, Koptyug ave. 3, 630090 Novosibirsk, Russia
2
Department of Geology and Geophysics, Novosibirsk State University, Novosibirsk 630090, Russia
*
Authors to whom correspondence should be addressed.
Crystals 2017, 7(5), 119; https://doi.org/10.3390/cryst7050119
Submission received: 31 March 2017
/
Revised: 21 April 2017
/
Accepted: 23 April 2017
/
Published: 25 April 2017
(This article belongs to the Special Issue Diamond Crystals)
Abstract
:Crystallization of diamond in the Mg-Si-C system has been studied at 7.5 GPa and 1800 °C with the Mg-Si compositions spanning the range from Mg-C to Si-C end-systems. It is found that as Si content of the system increases from 0 to 2 wt %, the degree of the graphite-to-diamond conversion increases from about 50 to 100% and remains at about this level up to 20 wt % Si. A further increase in Si content of the system leads to a decrease in the graphite-to-diamond conversion degree down to complete termination of diamond synthesis at Si content >50 wt %. Depending on the Si content crystallization of diamond, joint crystallization of diamond and silicon carbide and crystallization of silicon carbide only are found to take place. The cubic growth of diamond, typical of the Mg-C system, transforms to the cube-octahedron upon adding 1 wt % Si and then to the octahedron at a Si content of 2 wt % and higher. The crystallized diamonds are studied by a suite of optical spectroscopy techniques and the major characteristics of their defect-and-impurity structure are revealed. The correlations between the Si content of the Mg-Si-C system and the properties of the produced diamond crystals are established.
1. Introduction
Synthesis and growth of diamond at high pressure high temperature (HPHT) conditions has evolved into a mature technology that enables the use of diamond in a variety of scientific and industrial applications. The most efficient and commonly used solvent-catalysts for HPHT diamond synthesis are group VIII transition metals, particularly Fe, Co, Ni, and their alloys [1,2,3]. The processes of synthesis and growth of diamond crystals from these catalysts, which are frequently referred to as conventional, have been well studied, and the major factors controlling nucleation, growth, morphology, and properties of the crystals have been determined [4,5,6]. In recent decades, various diamond producing systems have been extensively investigated, that has significantly expanded the range of solvent-catalysts for diamond synthesis and provided additional information on the mechanisms of diamond nucleation and growth. The use of new growth systems enables production of diamond crystals with unusual and unique properties. For example, superconducting diamonds were obtained in the B-C system [7]; phosphorus-doped crystals were synthesized in the P-C system [8,9]; Ge-doped diamonds were produced using germanium as the solvent-catalyst [10].
Recently, considerable attention has been focused to the Mg-based solvent-catalysts [11,12,13,14,15]. This interest is related to the following factors: in the Mg-based systems, diamond crystallizes in the kinetically controlled regime with very high growth rates, reaching 8.5 mm/h [11]; the crystal morphology is very specific and largely controlled by the influence of impurities [11,12,13,14]; the produced diamond crystals are nitrogen-free type II. It is also important to emphasize that the Mg-based systems enable effective doping of diamond with silicon [12] and germanium [13] impurities, which create in the diamond lattice optically active silicon-vacancy and germanium-vacancy centers. These centers attract heated interest as promising single-photon emitters to be used in the emerging quantum technologies [16,17,18]. Previous studies determined the effect of temperature on diamond nucleation and growth in the Mg0.8Si0.2-C system [12].
In order to get a better understanding of diamond crystallization processes in Mg-based systems, in this work we have studied the effect of the Mg-Si composition ratio on diamond formation in the Mg-Si-C system at HPHT conditions. In this paper, we show that the Mg/Si ratio significantly affects diamond crystallization, degree of the graphite-to-diamond conversion, morphological stability, optical properties of diamond crystals, as well as phase formation in the Mg-Si-C system.
2. Results
2.1. Diamond Crystallization
A series of experiments in the Mg-Si-C system were carried out at a pressure of 7.5 GPa, a temperature of 1800 °C, and a run time of 30 min. These experimental conditions were chosen based on the results of our previous studies on diamond crystallization from the Mg-based catalysts [11,12]. The starting compositions and experimental results are summarized in Table 1. A schematic of the initial sample assembly and general crystallization schemes revealed in the experiments are presented in Figure 1.
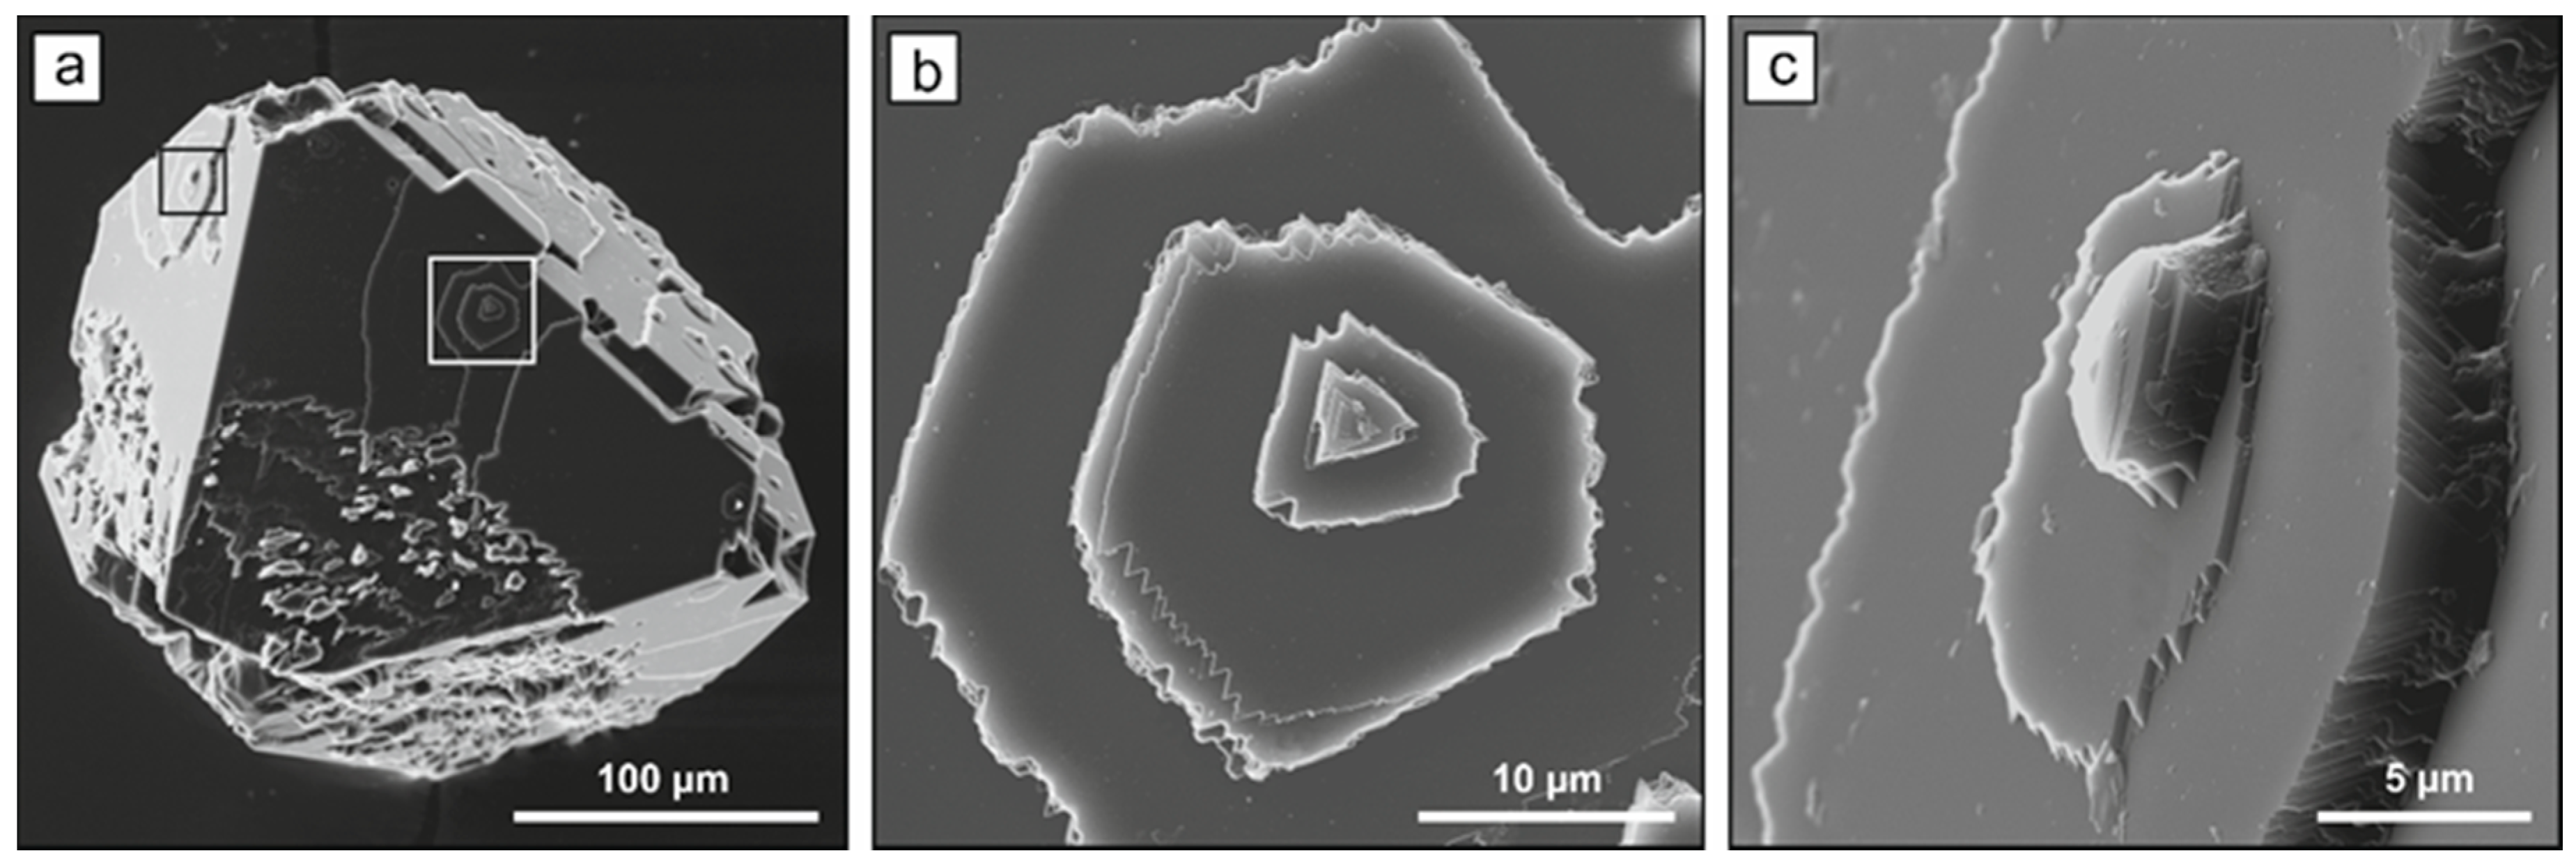
In the Mg-C system (run MS-1) diamonds of predominantly cubic morphology were formed. The {111} faces were either present as minor faces or completely absent. The degree of the graphite-to-diamond conversion was around 50%, with a significant part of diamonds forming a polycrystalline aggregate of colorless or gray crystals. Addition of 1 wt % Si (run MS-2) resulted in a substantial increase in the degree of graphite-to-diamond conversion (up to 80%) and led to a significant change in the diamond morphology. Although most diamonds were present as cleavage blocks, individual crystals and their fragments demonstrated that the {100} and {111} faces had approximately equal development, and the resulting crystals were cube-octahedrons (Figure 2). Striation along the [110] direction, formed due to the stepped structure of {111} faces, was usually present between the adjacent octahedral faces.
With addition of 2 wt % Si (MS-3), the starting graphite capsule converted to a polycrystalline diamond aggregate consisting of gray and colorless crystals and blocks. The morphology of the produced diamond crystals was determined by the dominant {111} faces, surfaces with crystallographic orientation close to the {110} faces showing pronounced striation along [110], and minor {100} faces at the polyhedron corners (Figure 3). Twinned crystals frequently occurred among the synthesized diamonds (Figure 4). As it can be clearly seen from Figure 4b, the sources of the growth macrolayers on the {111} faces are associated with the twin boundaries.
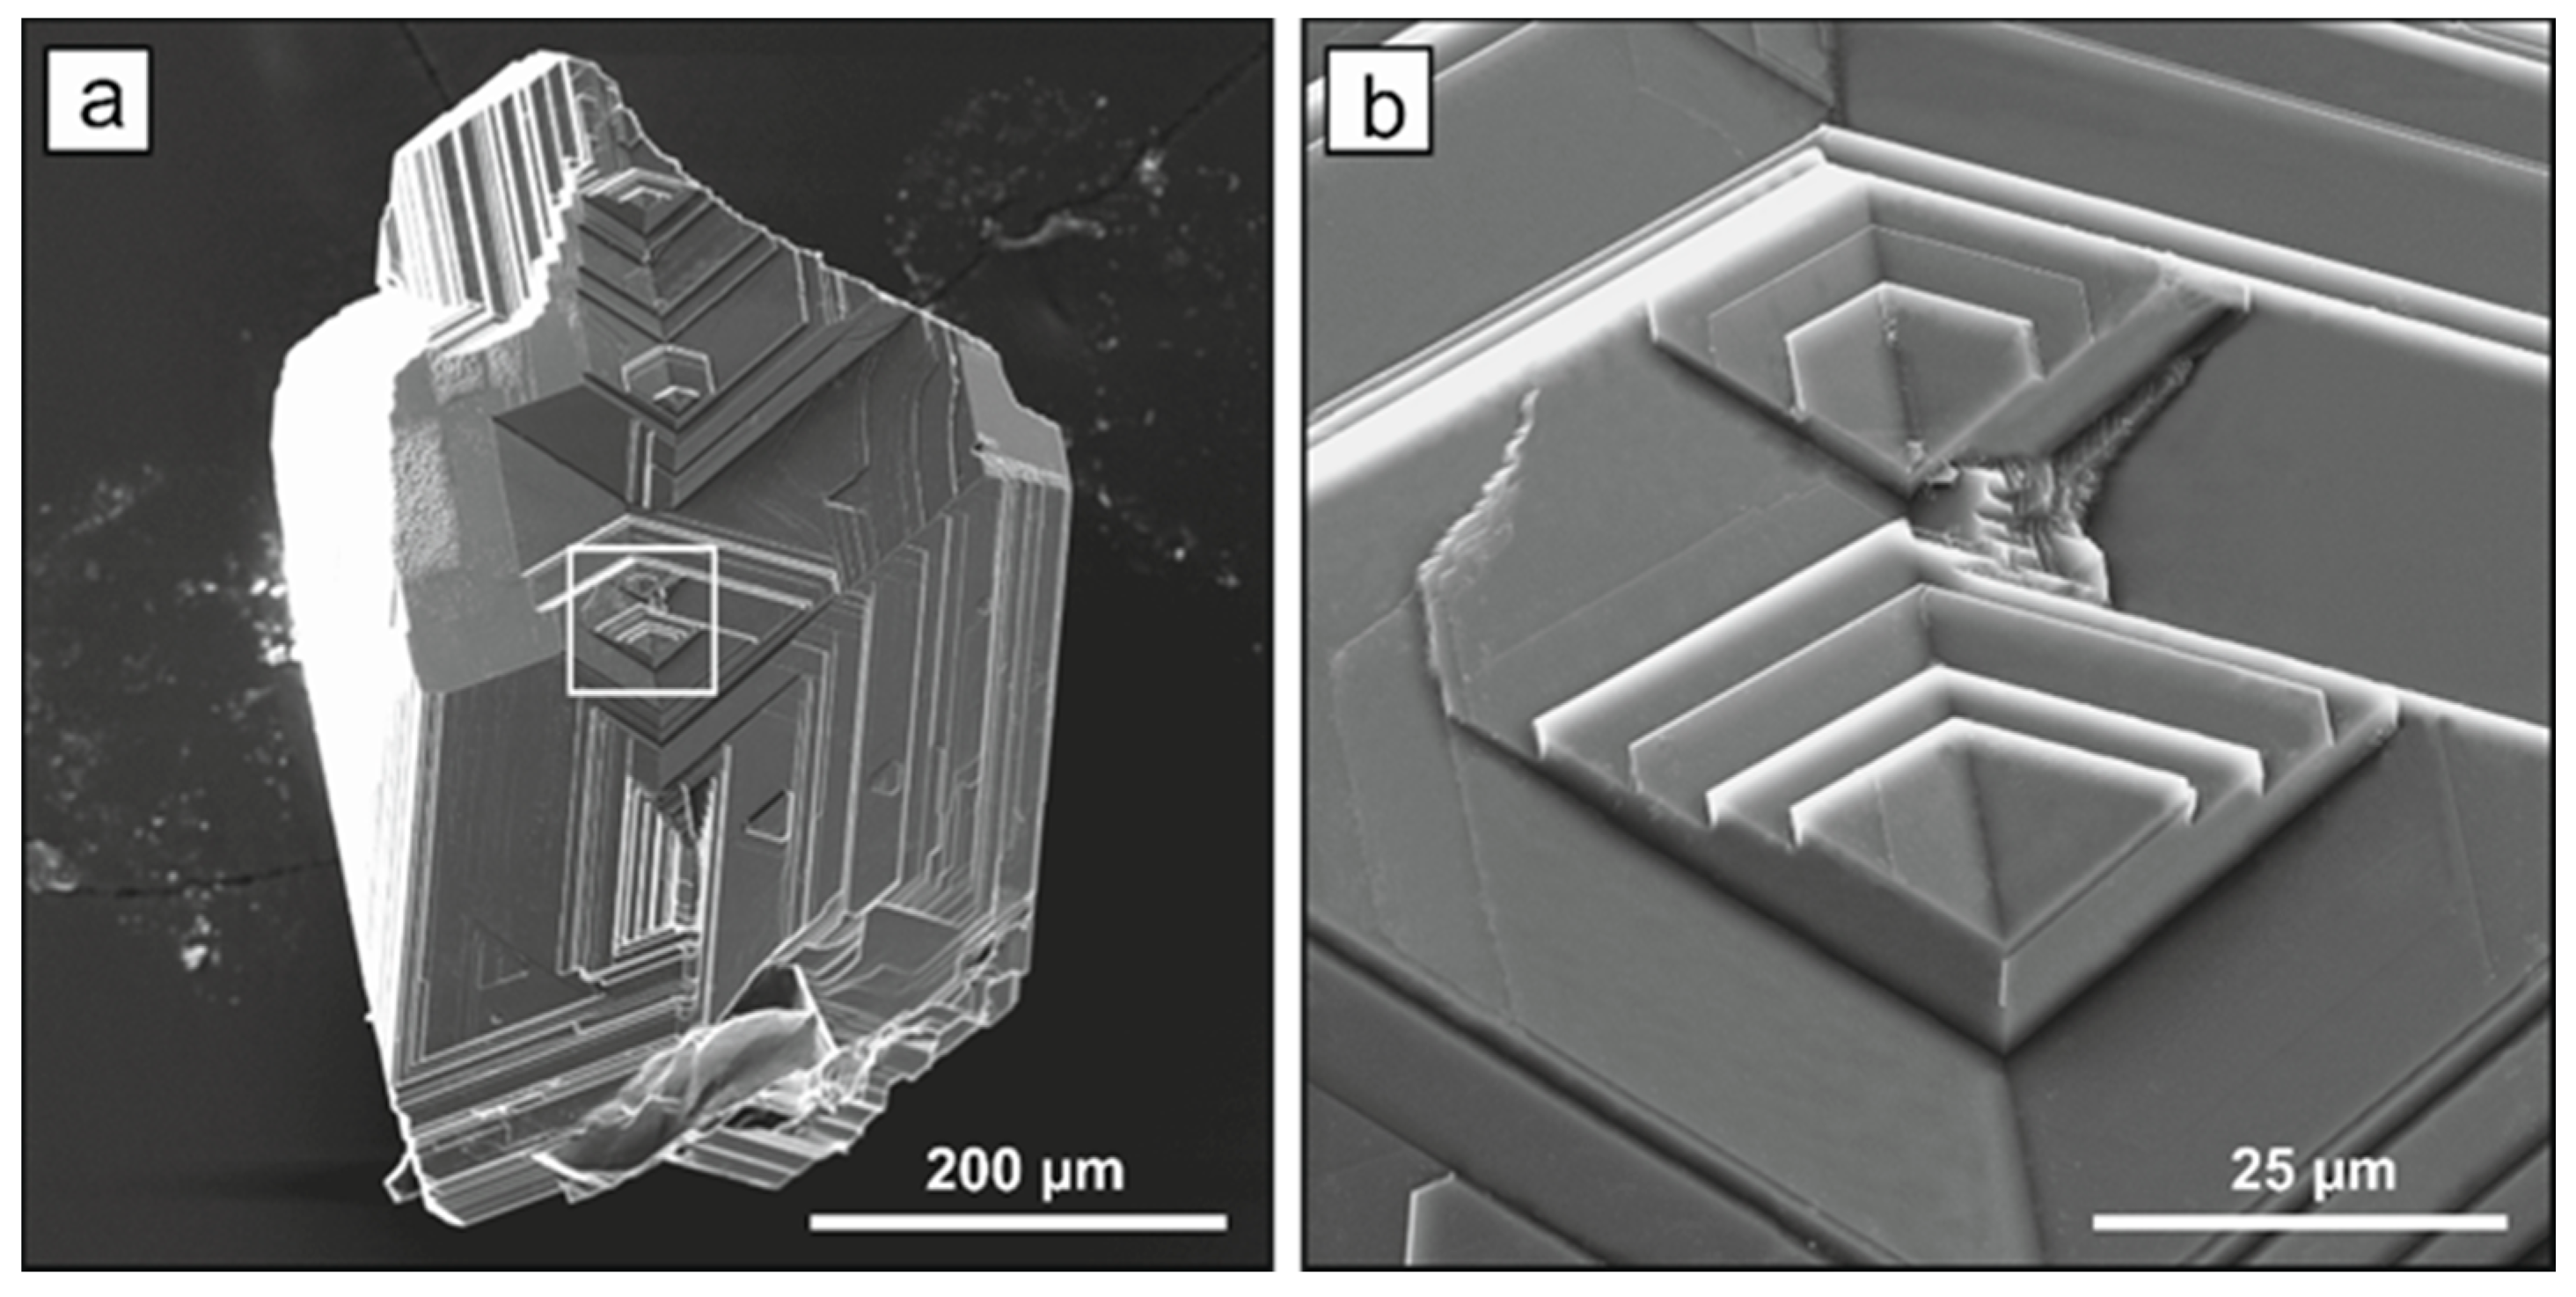
With the starting compositions Mg95Si5 and Mg90Si10, the degree of graphite-to-diamond conversion was estimated at about 90%. Diamonds typically formed polycrystalline aggregates. Individual octahedral crystals with serrate macrolayers propagating from single sources (Figure 5) were rarely observed.
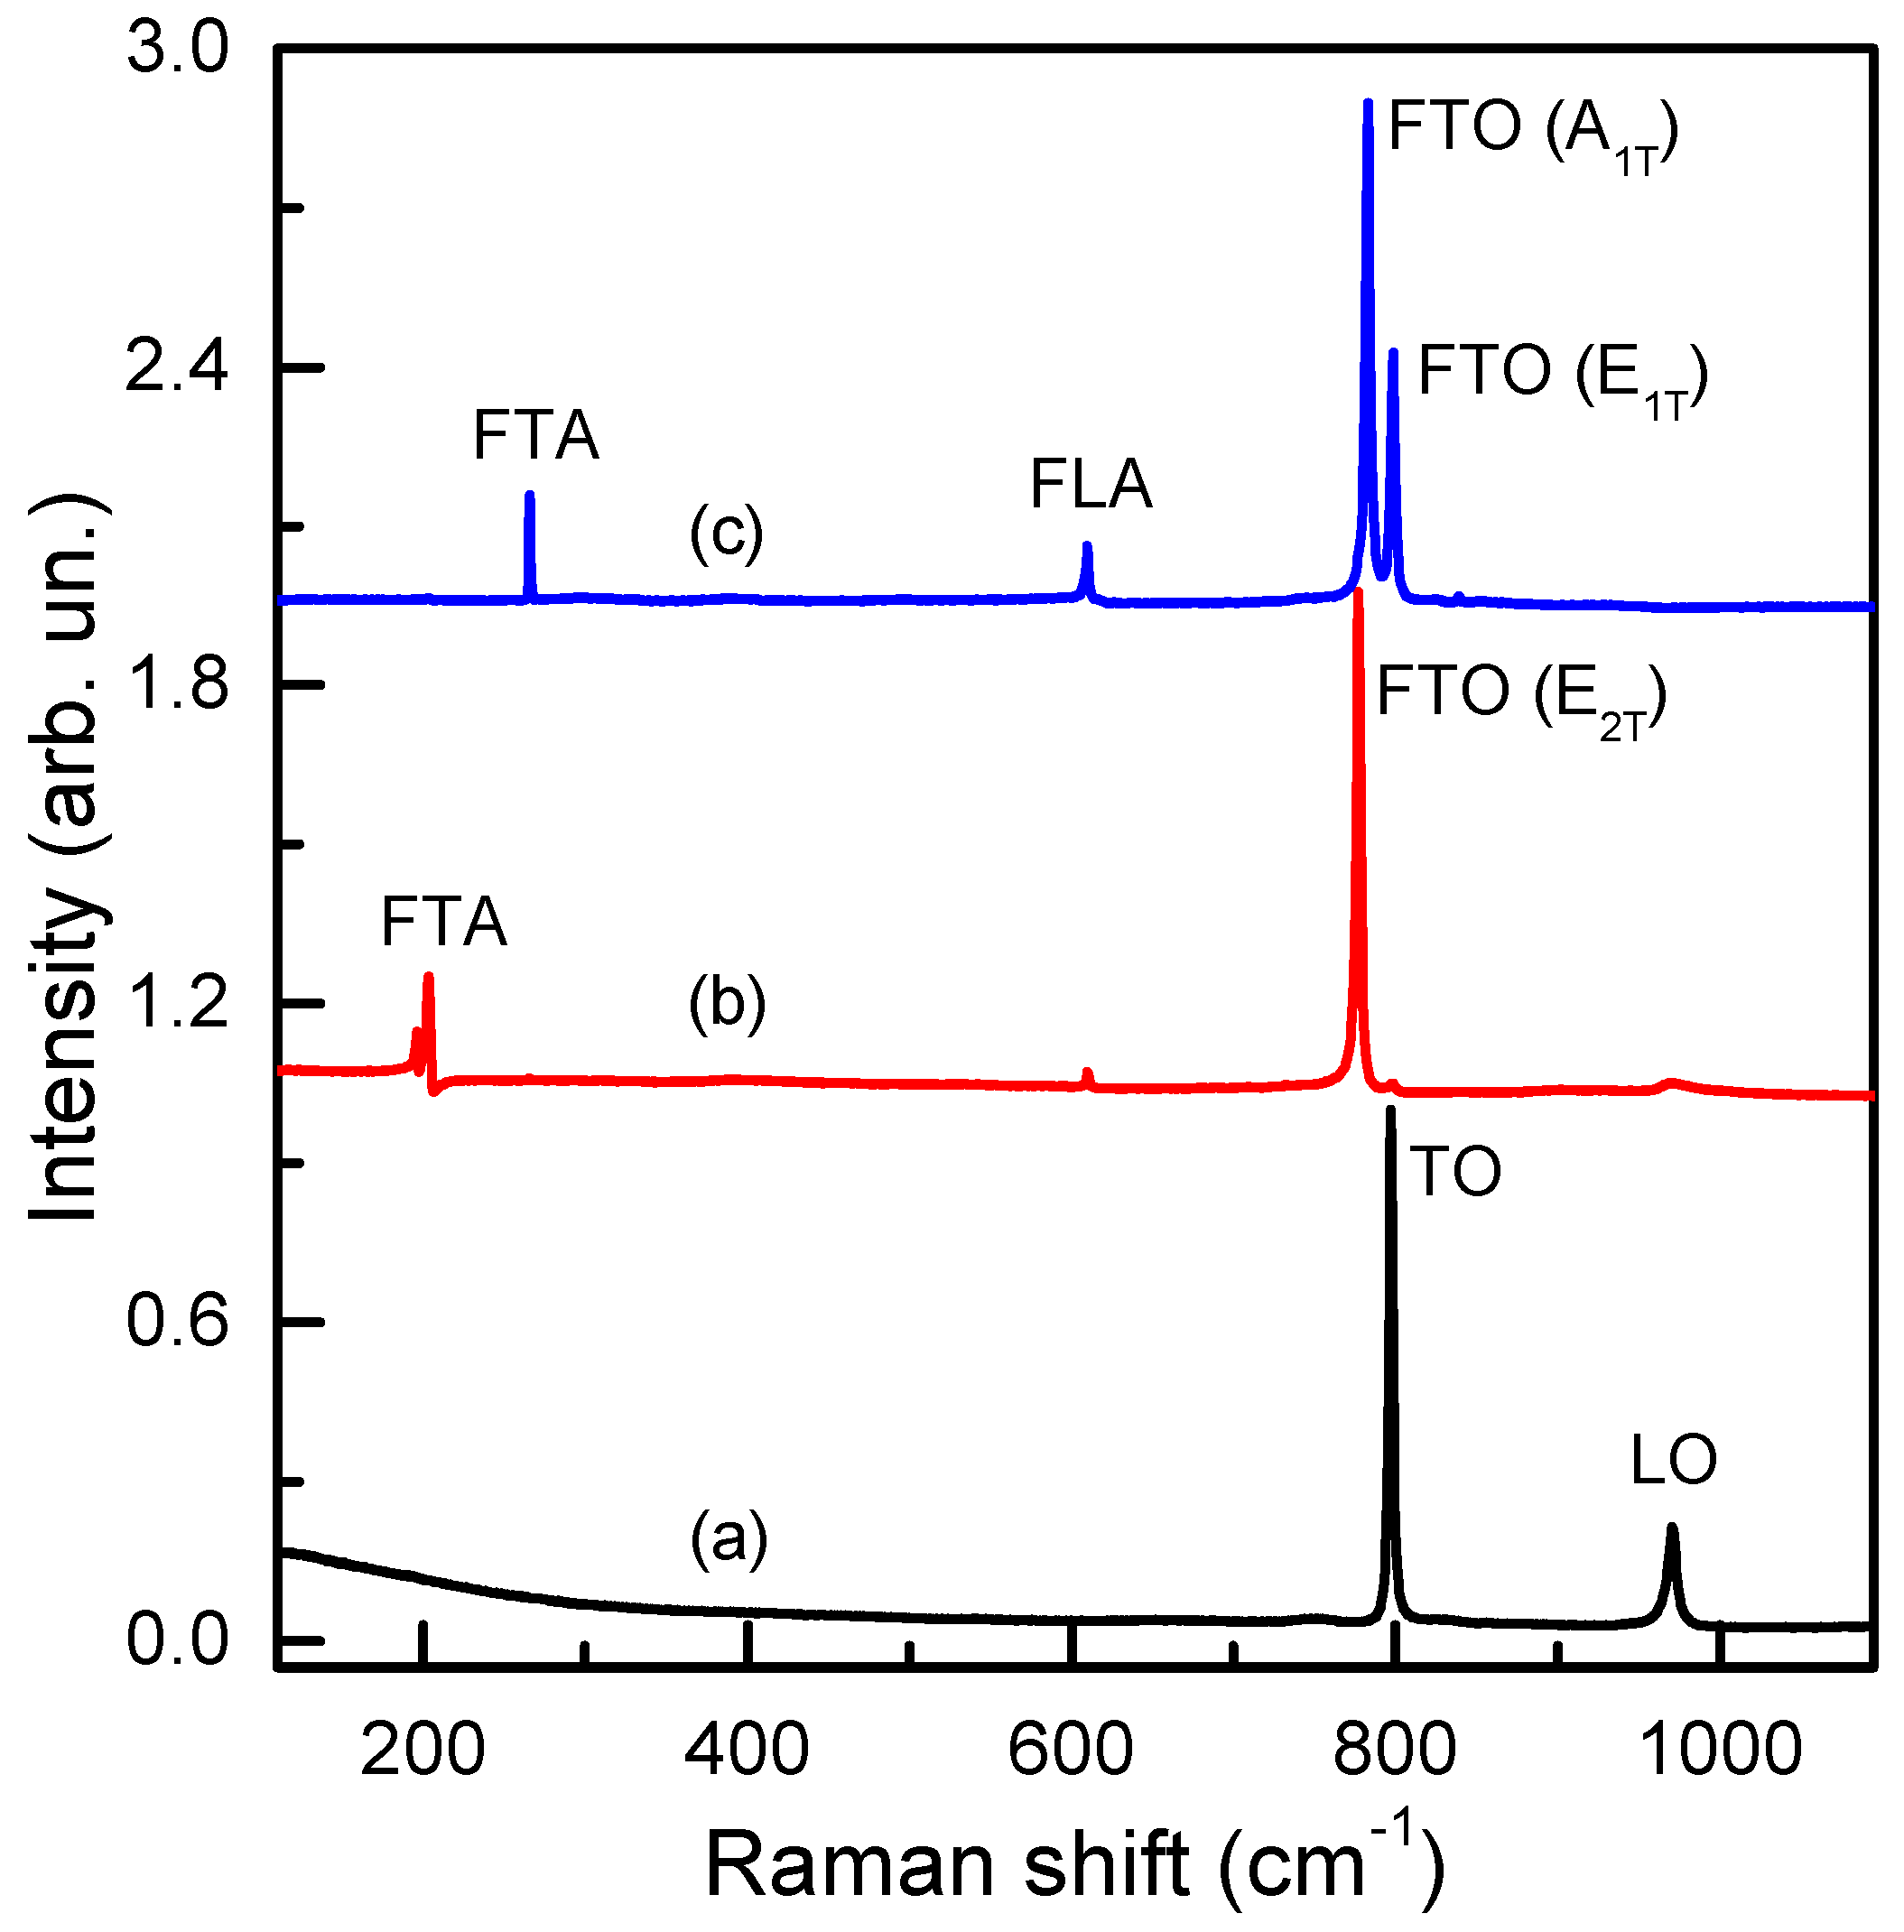
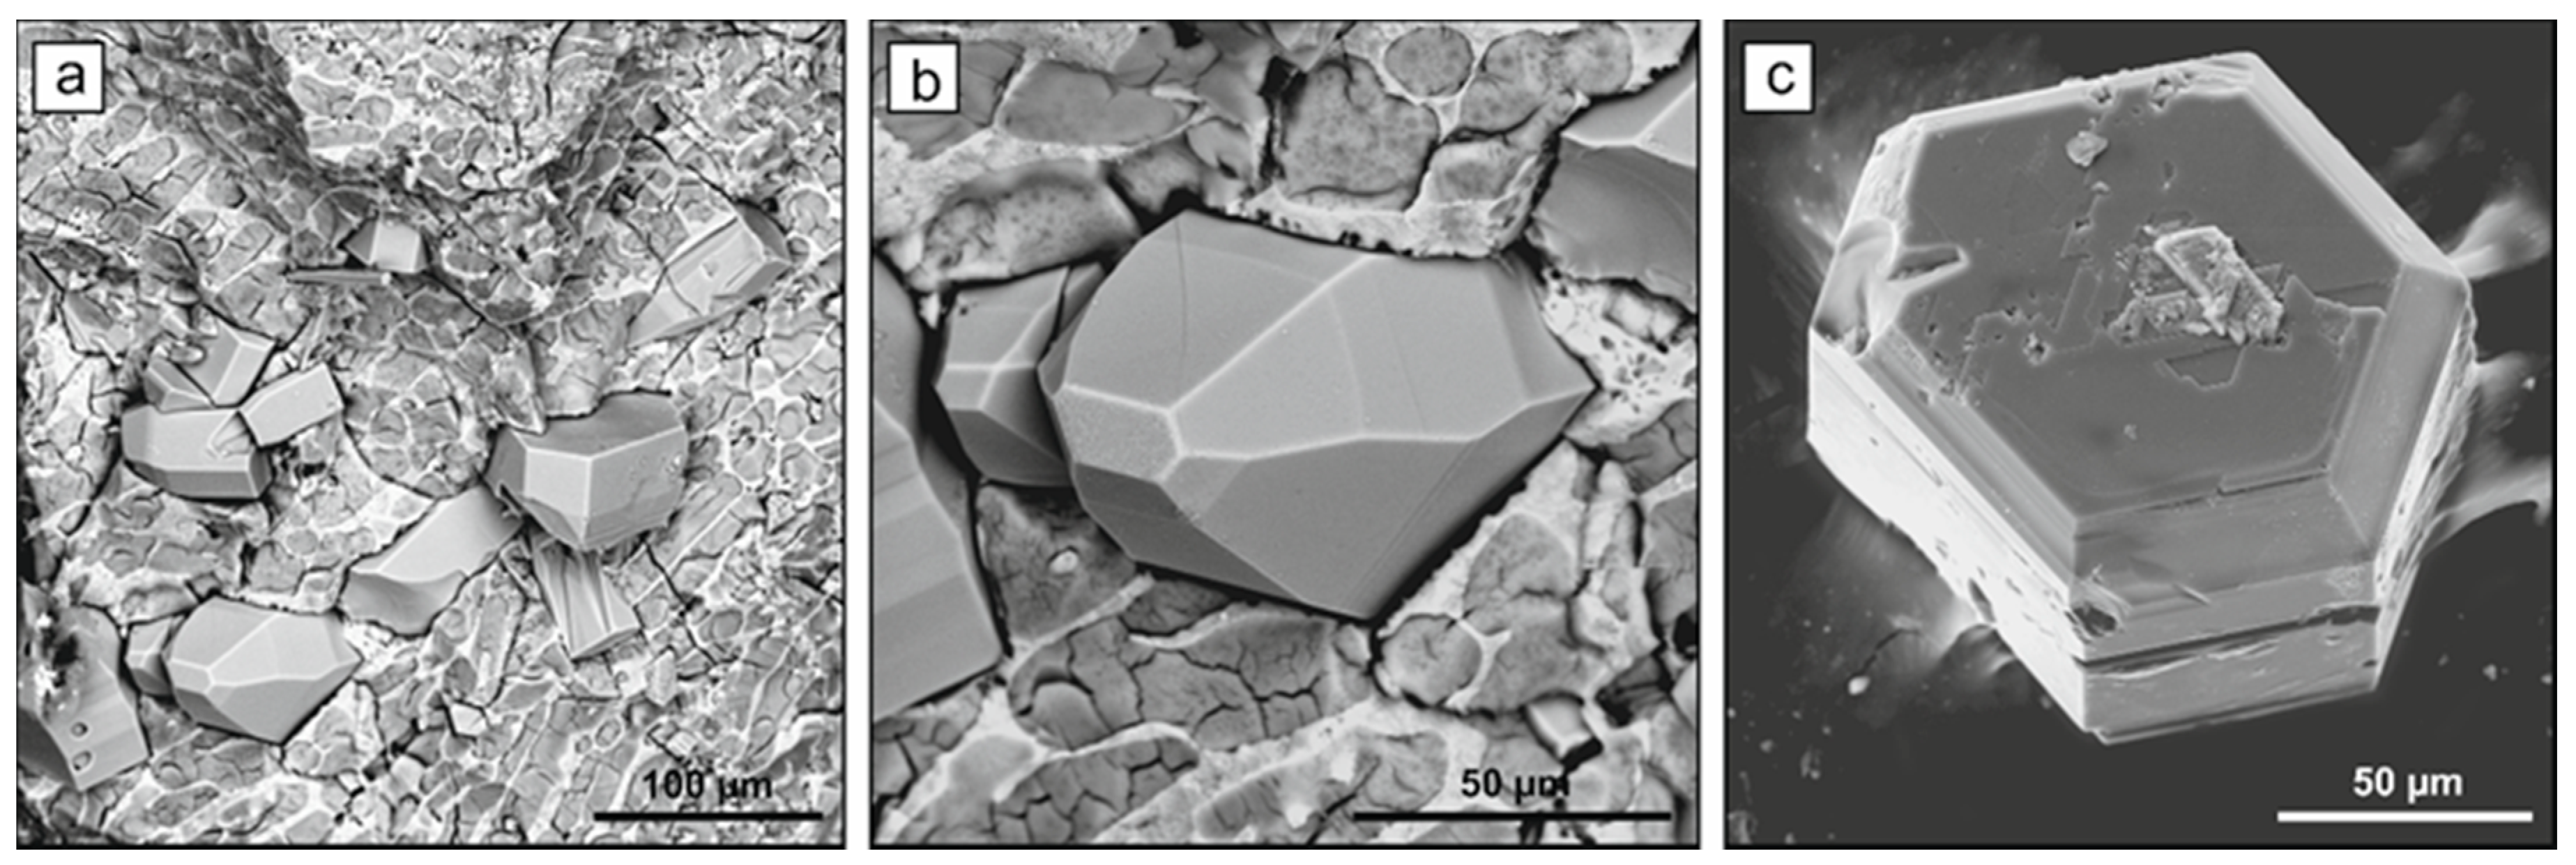
In run MS-6 with 20 wt % Si, along with diamond, tetrahedral silicon carbide crystals were found in the products. All graphite of the starting capsule was converted to diamond. The observed intergrowths of silicon carbide with diamond (Figure 6c) and SiC inclusions in diamond crystals indicate co-crystallization of diamond and silicon carbide. With the Mg70Si30 initial composition (run MS-7) the degree of graphite-to-diamond conversion decreased to about 80%. Crystallized diamonds were mainly in the form of blocks consisting of octahedral crystals in approximately parallel orientation (Figure 6a,b). Silicon carbide was present as single crystals, intergrowths, and polycrystalline aggregates in the central part of the capsule. From the Raman scattering measurements, it was found that the silicon carbide crystallized in runs MS-6, and MS-7 corresponded to the cubic 3C-SiC phase (Figure 7).
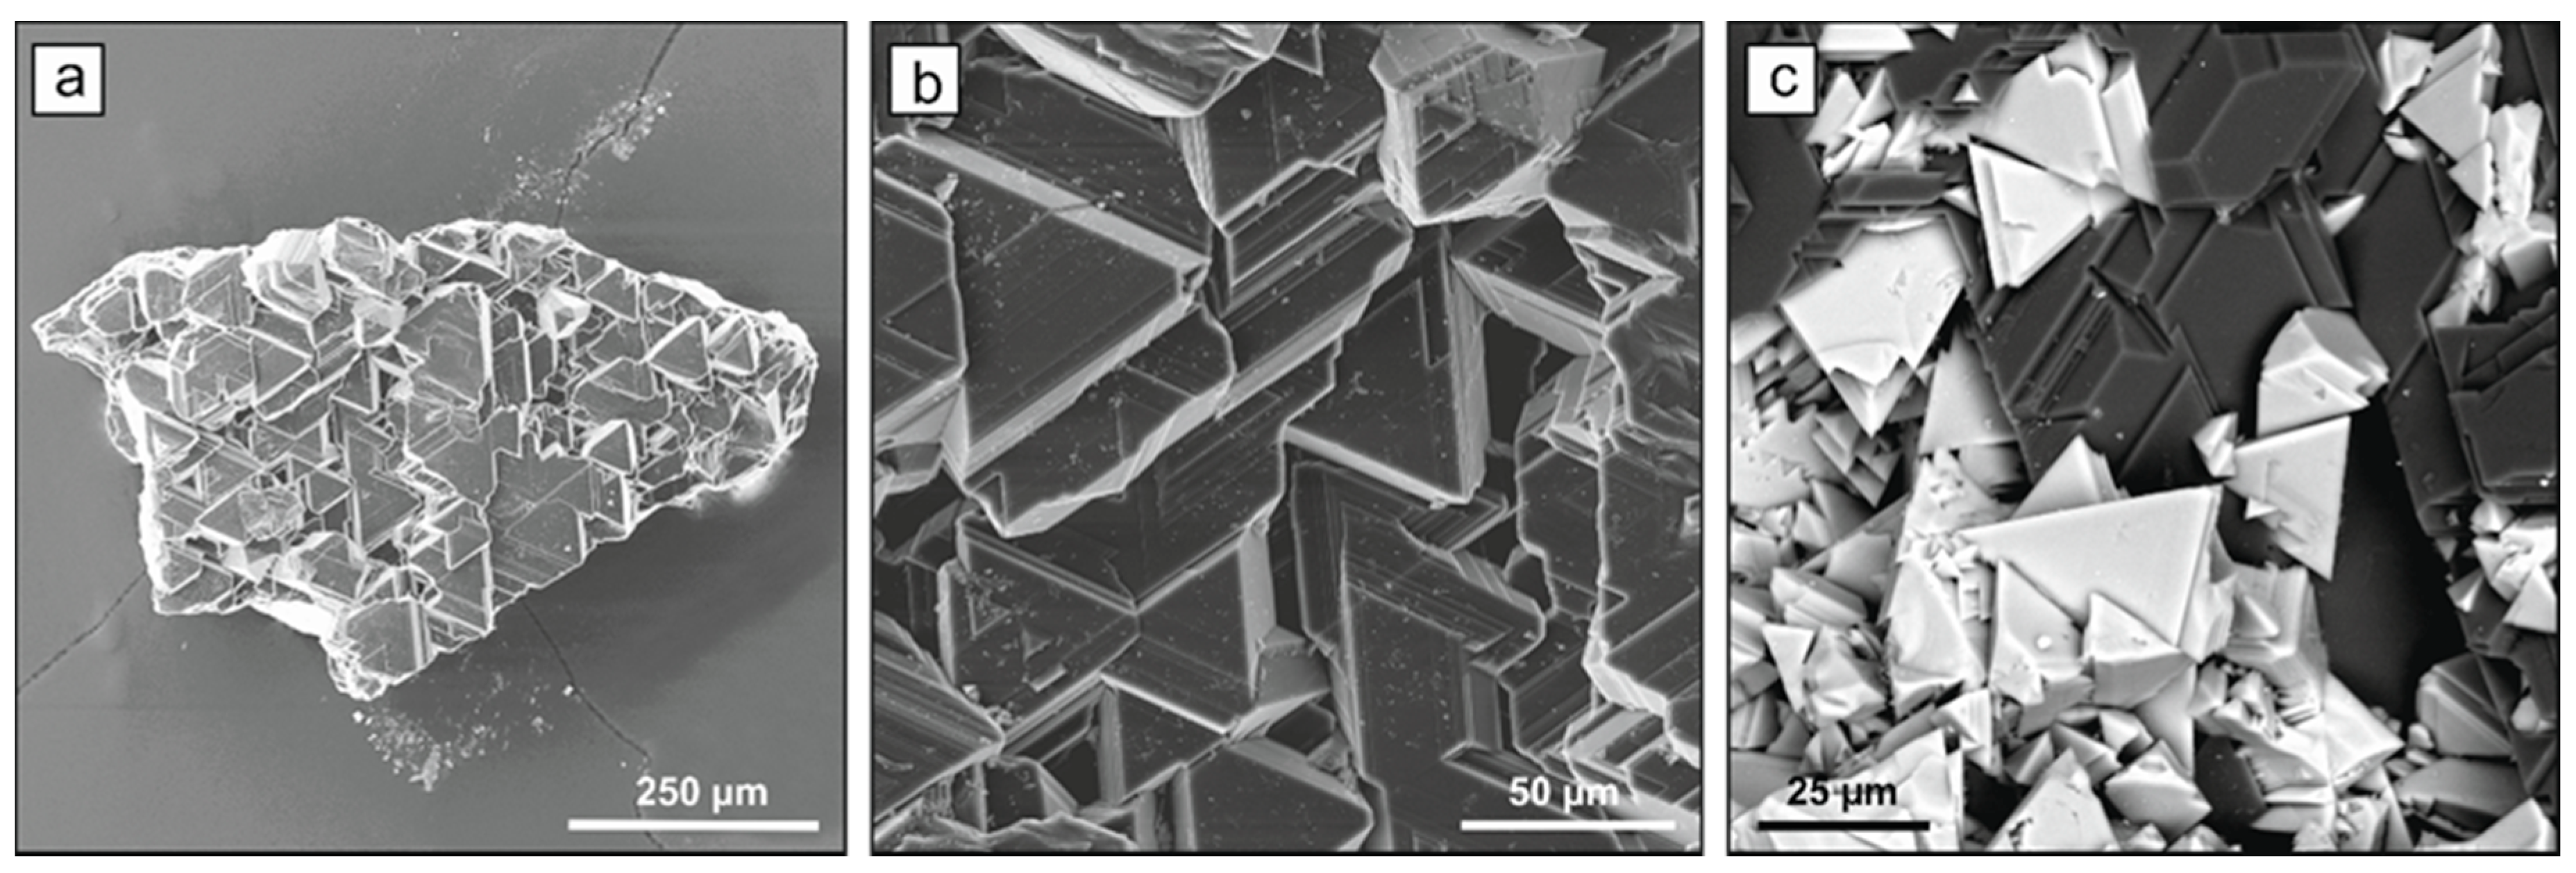
In the experiment with the Mg50Si50 starting composition (MS-8) it was found that two melts with different properties formed under the experimental conditions. The first melt reacted with graphite to produce diamond with a conversion degree of about 20%. After opening the capsule, the quenching products of this melt were rapidly oxidized in air; i.e., they behaved as in all experiments described above. The second melt was located in the central part of the capsule and the alloy produced upon quenching this melt was stable in air. Furthermore, it was not dissolved in hot nitric acid, but underwent surface oxidization, revealing its eutectoid structure (Figure 8a,b). Numerous crystals of hexagonal silicon carbide were observed inside this quenched alloy. The composition of the first and second quenched alloys was found to be Mg63Si37 and Mg35Si65, respectively. Silicon carbide formed pyramidal, prismatic, or tabular crystals, depending on the relative development of different crystal faces (Figure 8). Raman spectra recorded for the SiC crystals with different morphologies (Figure 7) demonstrated that in this case silicon carbide corresponded to the hexagonal 4H modification.
In the experiment with the Mg25Si75 composition (MS-9), no diamond was established in the run products. Fine silicon carbide crystals, corresponding to the cubic 3C modification, are formed at the melt-graphite ampoule interface. The melt consisted of quenched silicon crystals and phases with the Mg58Si42 and Mg32Si68 compositions which formed eutectoid structures. In the experiment MS-10 conducted in the Si-С system, a quenched Si melt and a polycrystalline silicon carbide aggregate were found at the graphite-silicon interface. Diamond seed crystals were partially corroded and silicon carbide crystal aggregates formed on their surface.
2.2. Spectroscopic Characterization
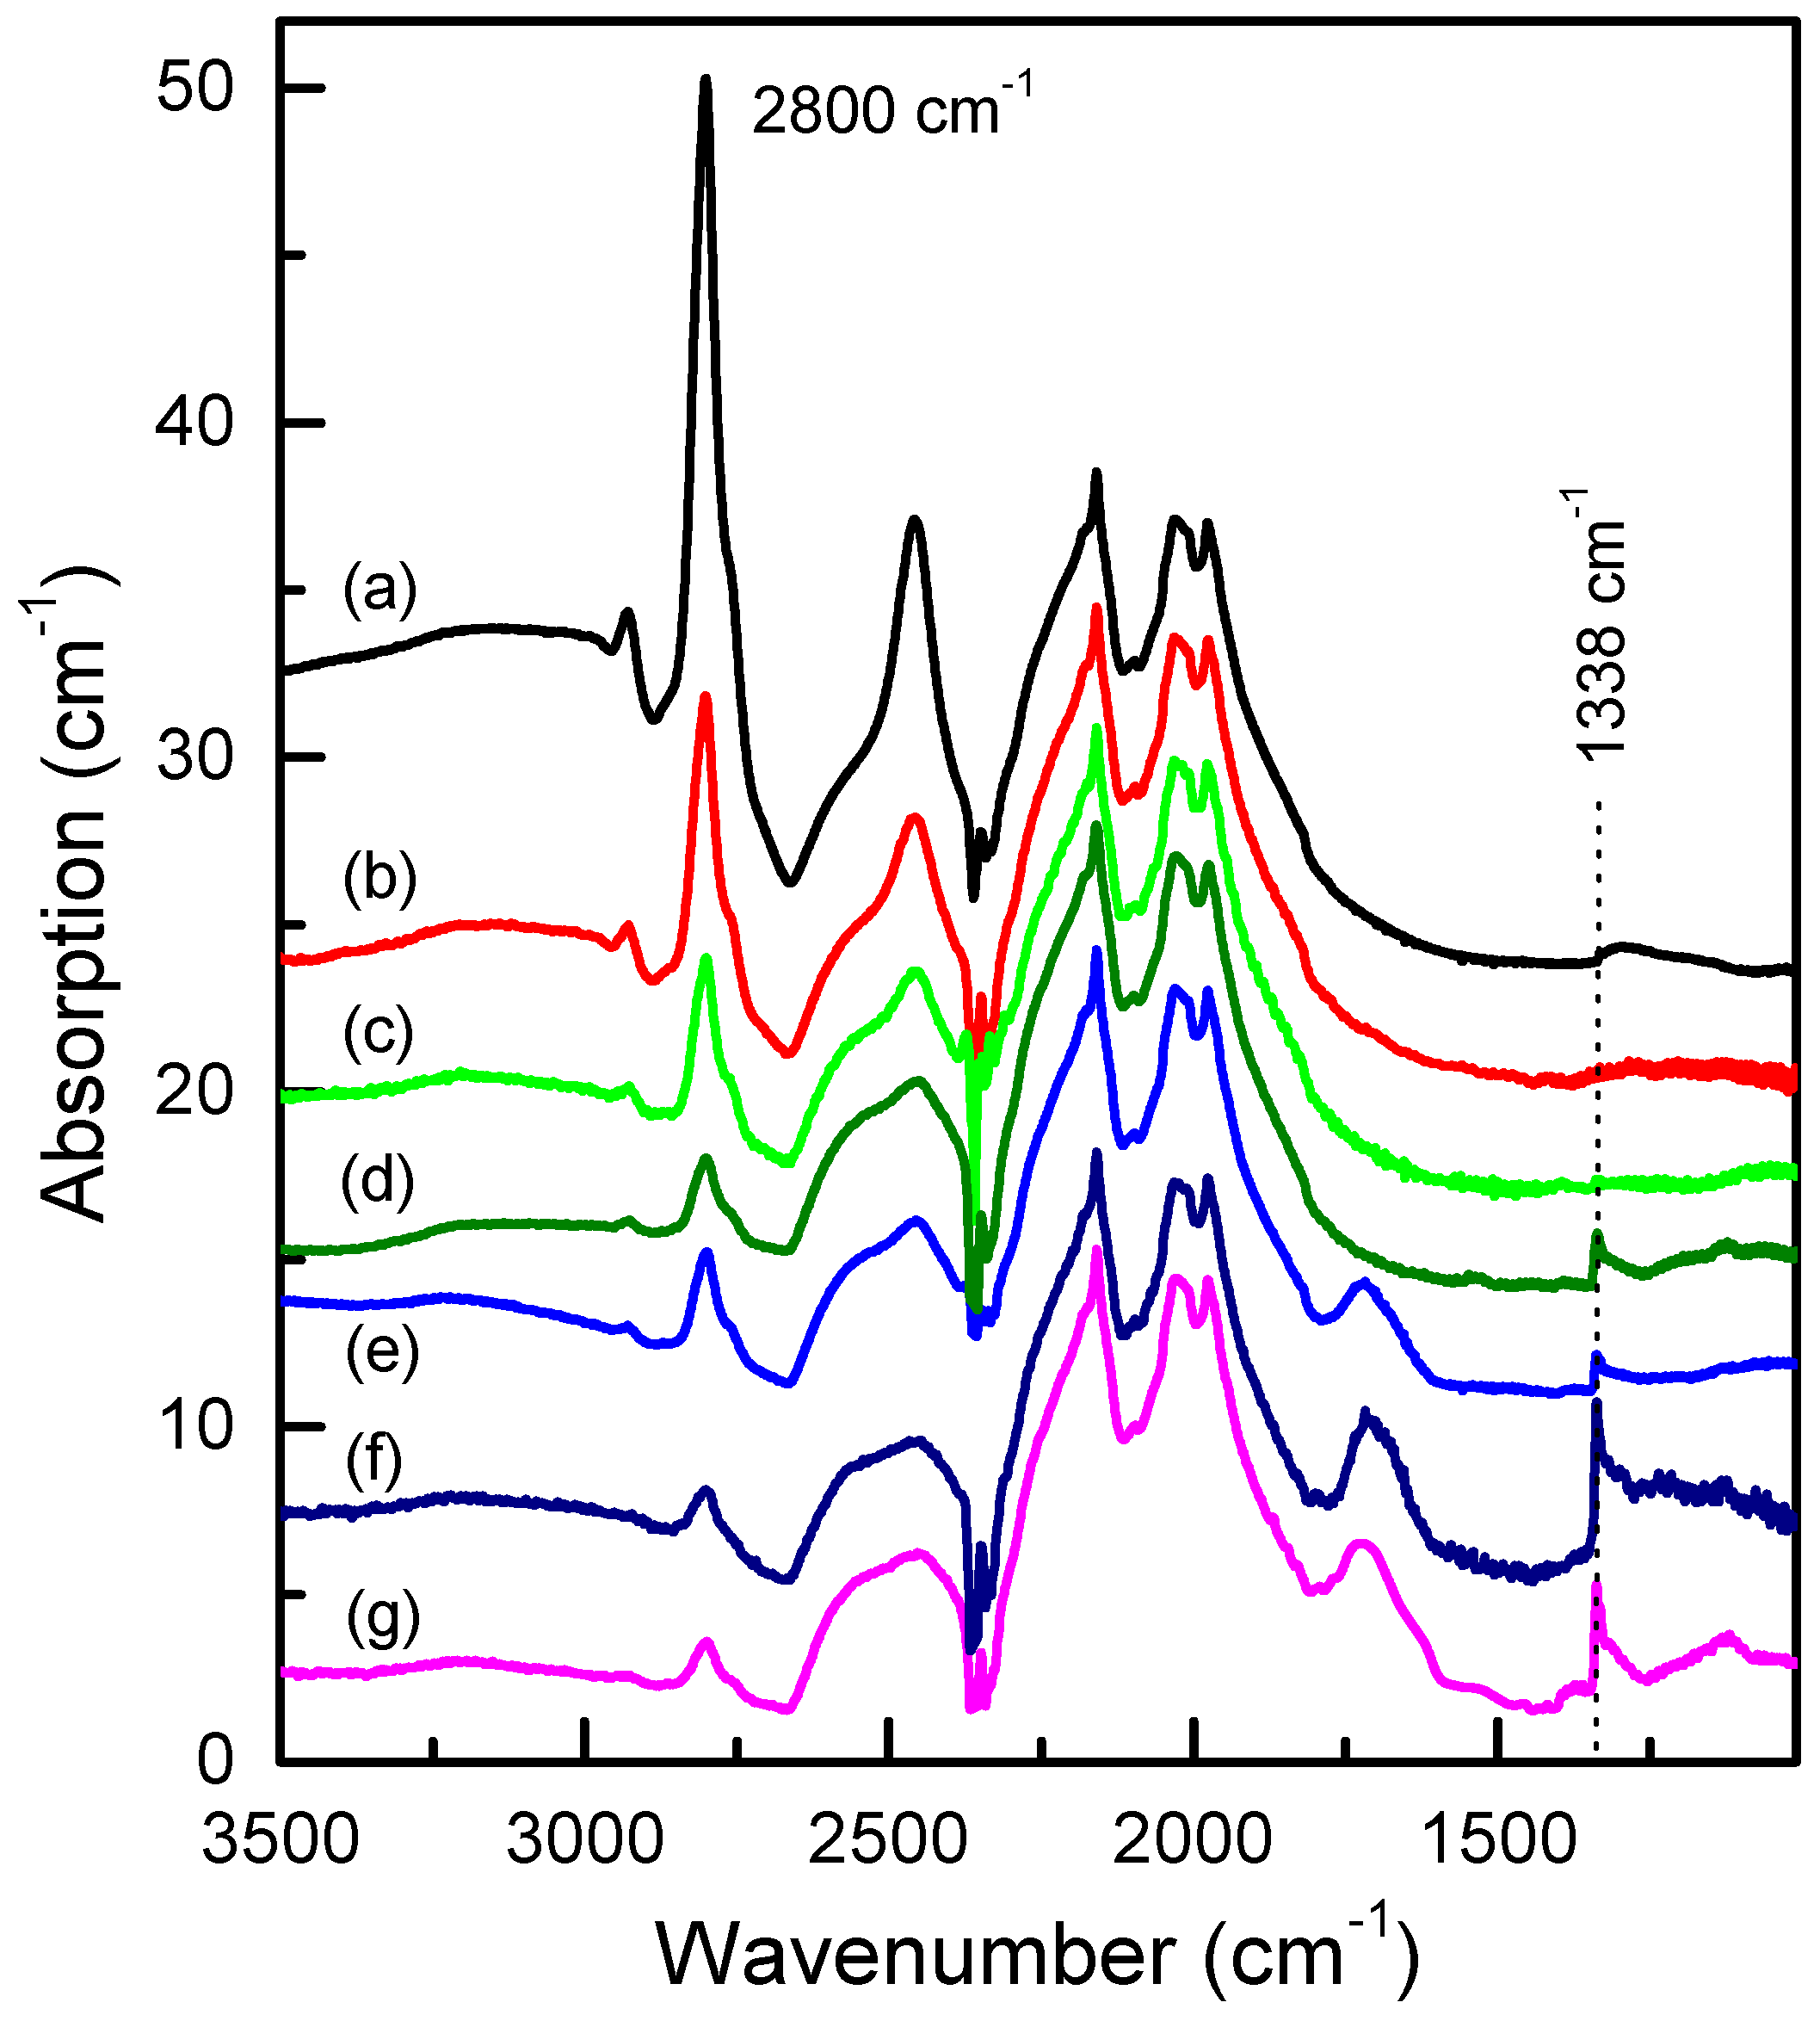
We now consider the results of spectroscopic characterization of the crystallized diamonds. Figure 9 shows typical infrared absorption spectra recorded for the produced diamond crystals. It was found that the crystals synthesized over the entire range of the diamond producing compositions (≤50 wt % Si) showed no detectable features in the IR spectra caused by nitrogen impurities. This characteristic of diamonds grown from the Mg-based catalysts has been demonstrated in previous studies [11,12,19] and attributed to the gettering properties of magnesium. In addition, we can note that silicon, being a carbide-forming element, may also act as the nitrogen getter and contribute to the growth of type II nitrogen-free diamond. The recorded IR spectra frequently exhibited relatively weak absorption peaks due to the uncompensated boron acceptors. The concentration of boron acceptors (NA) was estimated from the strength of the peak at 2800 cm−1 using previously established calibrations [20]. The calculations gave values of NA from below 0.1 up to 1 ppm. No clear dependence of the boron content in the crystals on the growth system composition was found. For diamonds showing both {111} and {100} growth sectors (runs MS-2, MS-3), no growth sector dependence of boron distribution was found either. It is necessary to note that, in the present study, no boron was deliberately added to the growth system and it was present only as trace impurity in the reagents. Starting from the Mg80Si20 composition, crystallized diamonds exhibited a distinct feature in the IR spectra comprising a sharp absorption peak at 1338 cm−1 (Figure 9). The position of this peak was clearly different from that of the highest energy zone-center phonons of diamond (1332 cm−1). With further increasing Si content of the growth system, the 1338 cm−1 peak showed a tendency to increase in strength. The exact nature of this peak has not been clearly established so far. However, there is growing amount of evidence suggesting that the 1338 cm−1 localized vibration mode is related to substitutional silicon defects in the diamond lattice and originates due to high local strains surrounding these defects [12,21,22]. Our results give further support to this hypothesis.
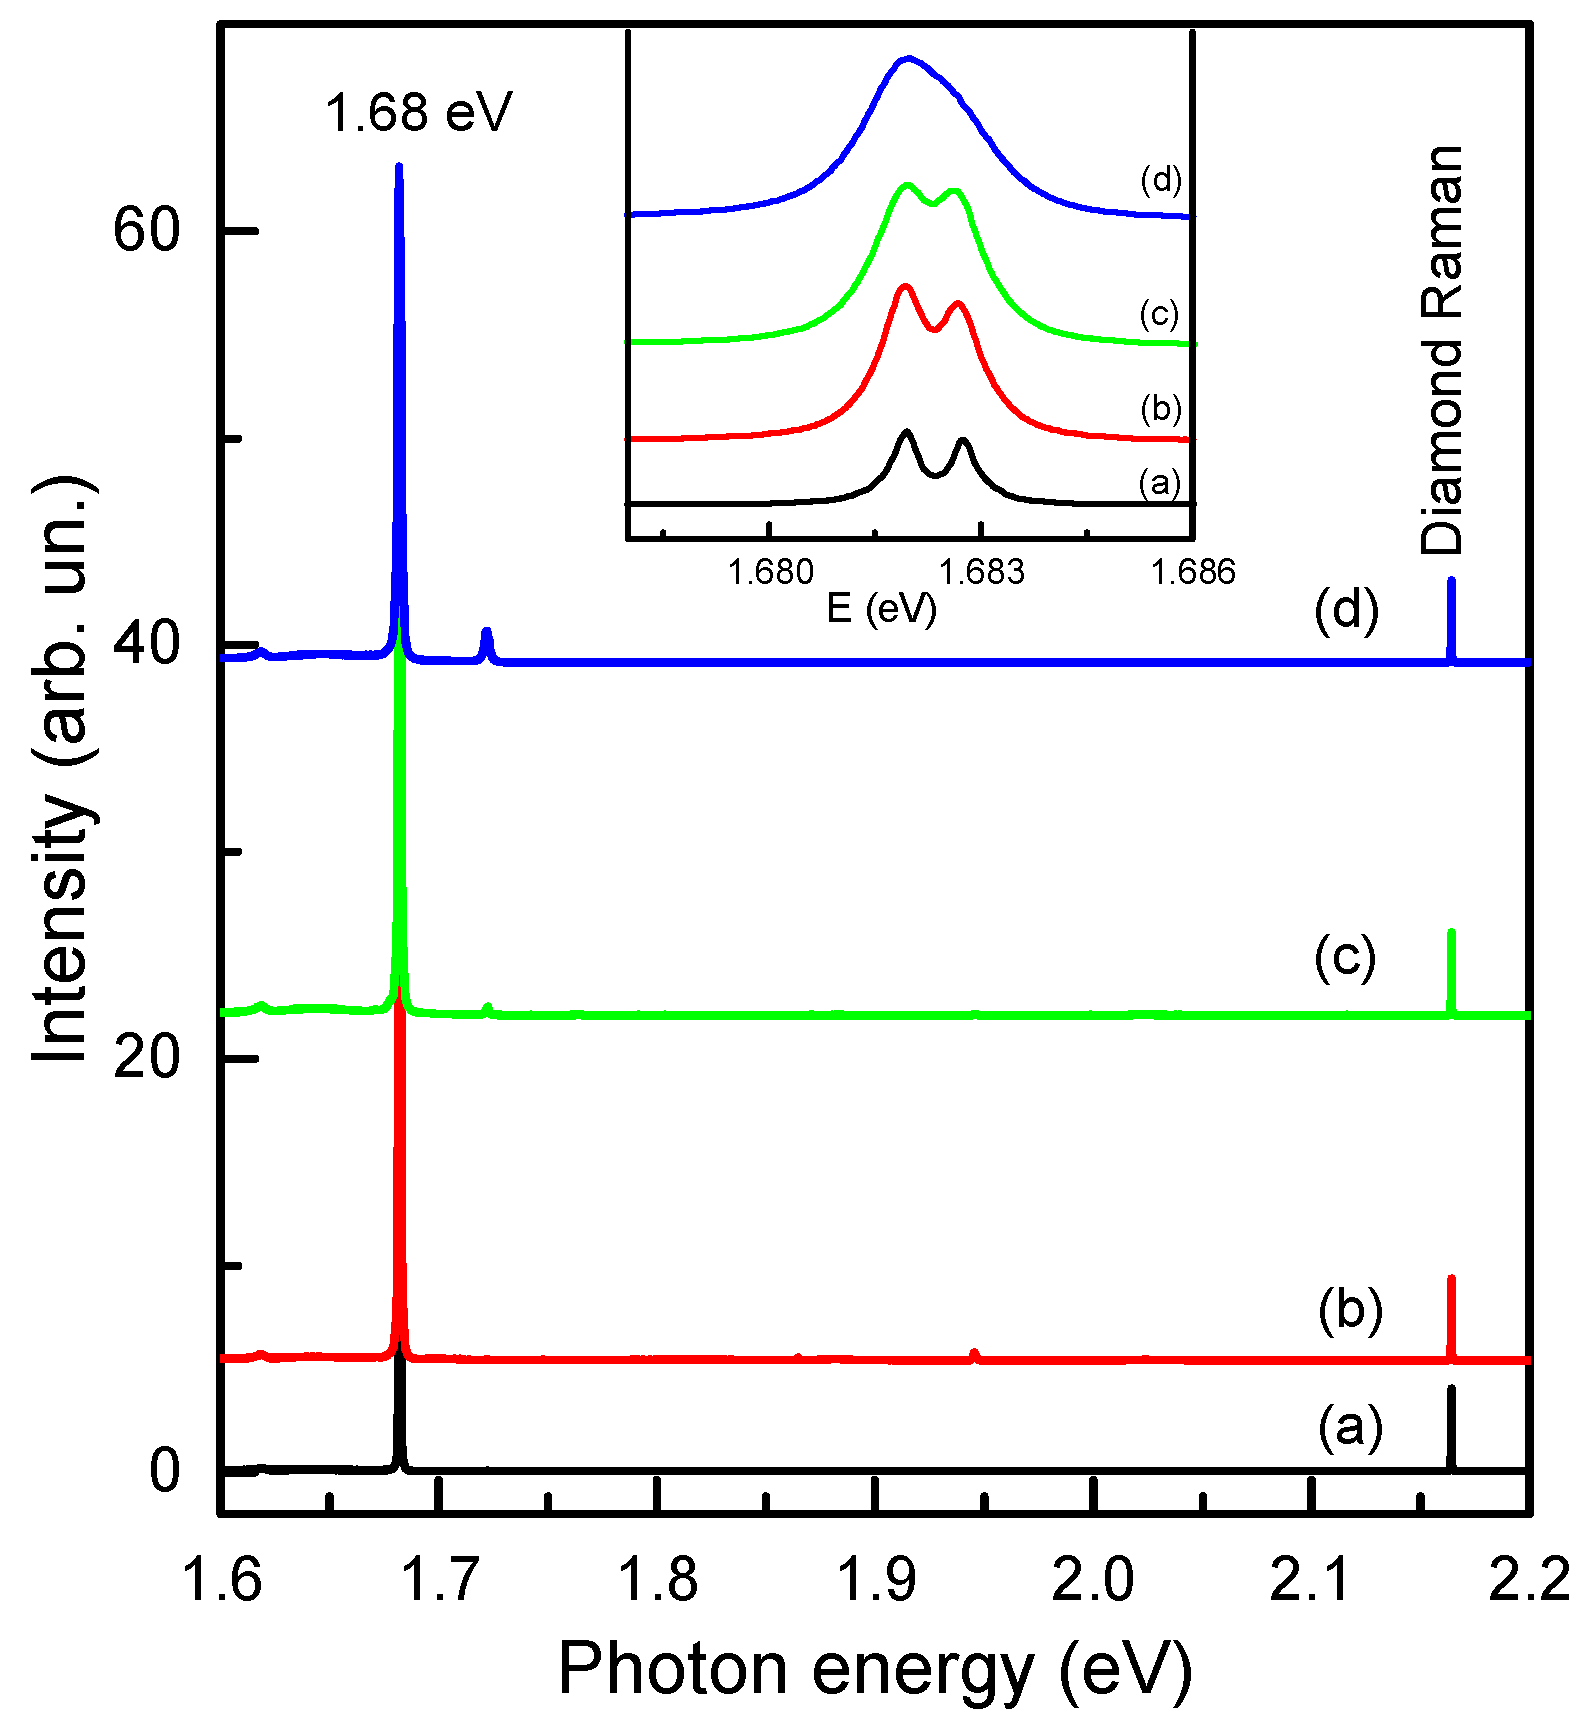
Photoluminescence (PL) measurements showed that the PL spectra of diamond crystals synthesized over the entire range of the diamond producing compositions were dominated by the 1.68 eV optical system caused by the negatively charged silicon-vacancy (Si-V) centers (Figure 10). As it was found previously, the 1.68 eV Si-V centers occur as the major PL feature in diamonds synthesized from the pure Mg-C system, which contain silicon only as trace impurities in the starting reagents [11,19]. Comparing PL spectra normalized to the intensity of the diamond Raman scattering peak we found that diamonds produced in the Mg99Si1-C and Mg98Si2-C systems (runs MS-2 and MS-3) showed, on average, high intensities of emission from the 1.68 eV centers, compared to those synthesized in the pure Mg-C system (MS-1). It is important to note that with these higher PL intensities, the zero-phonon peak of the 1.68 eV vibronic band still demonstrated a clear doublet structure (Figure 10) in the low-temperature (80 K) spectra of diamonds from runs MS-2 and MS-3. This implies that small (1–2 wt %) additives of Si to the Mg-C system improve the luminescent characteristics of the diamonds, without diminishing their internal quality.
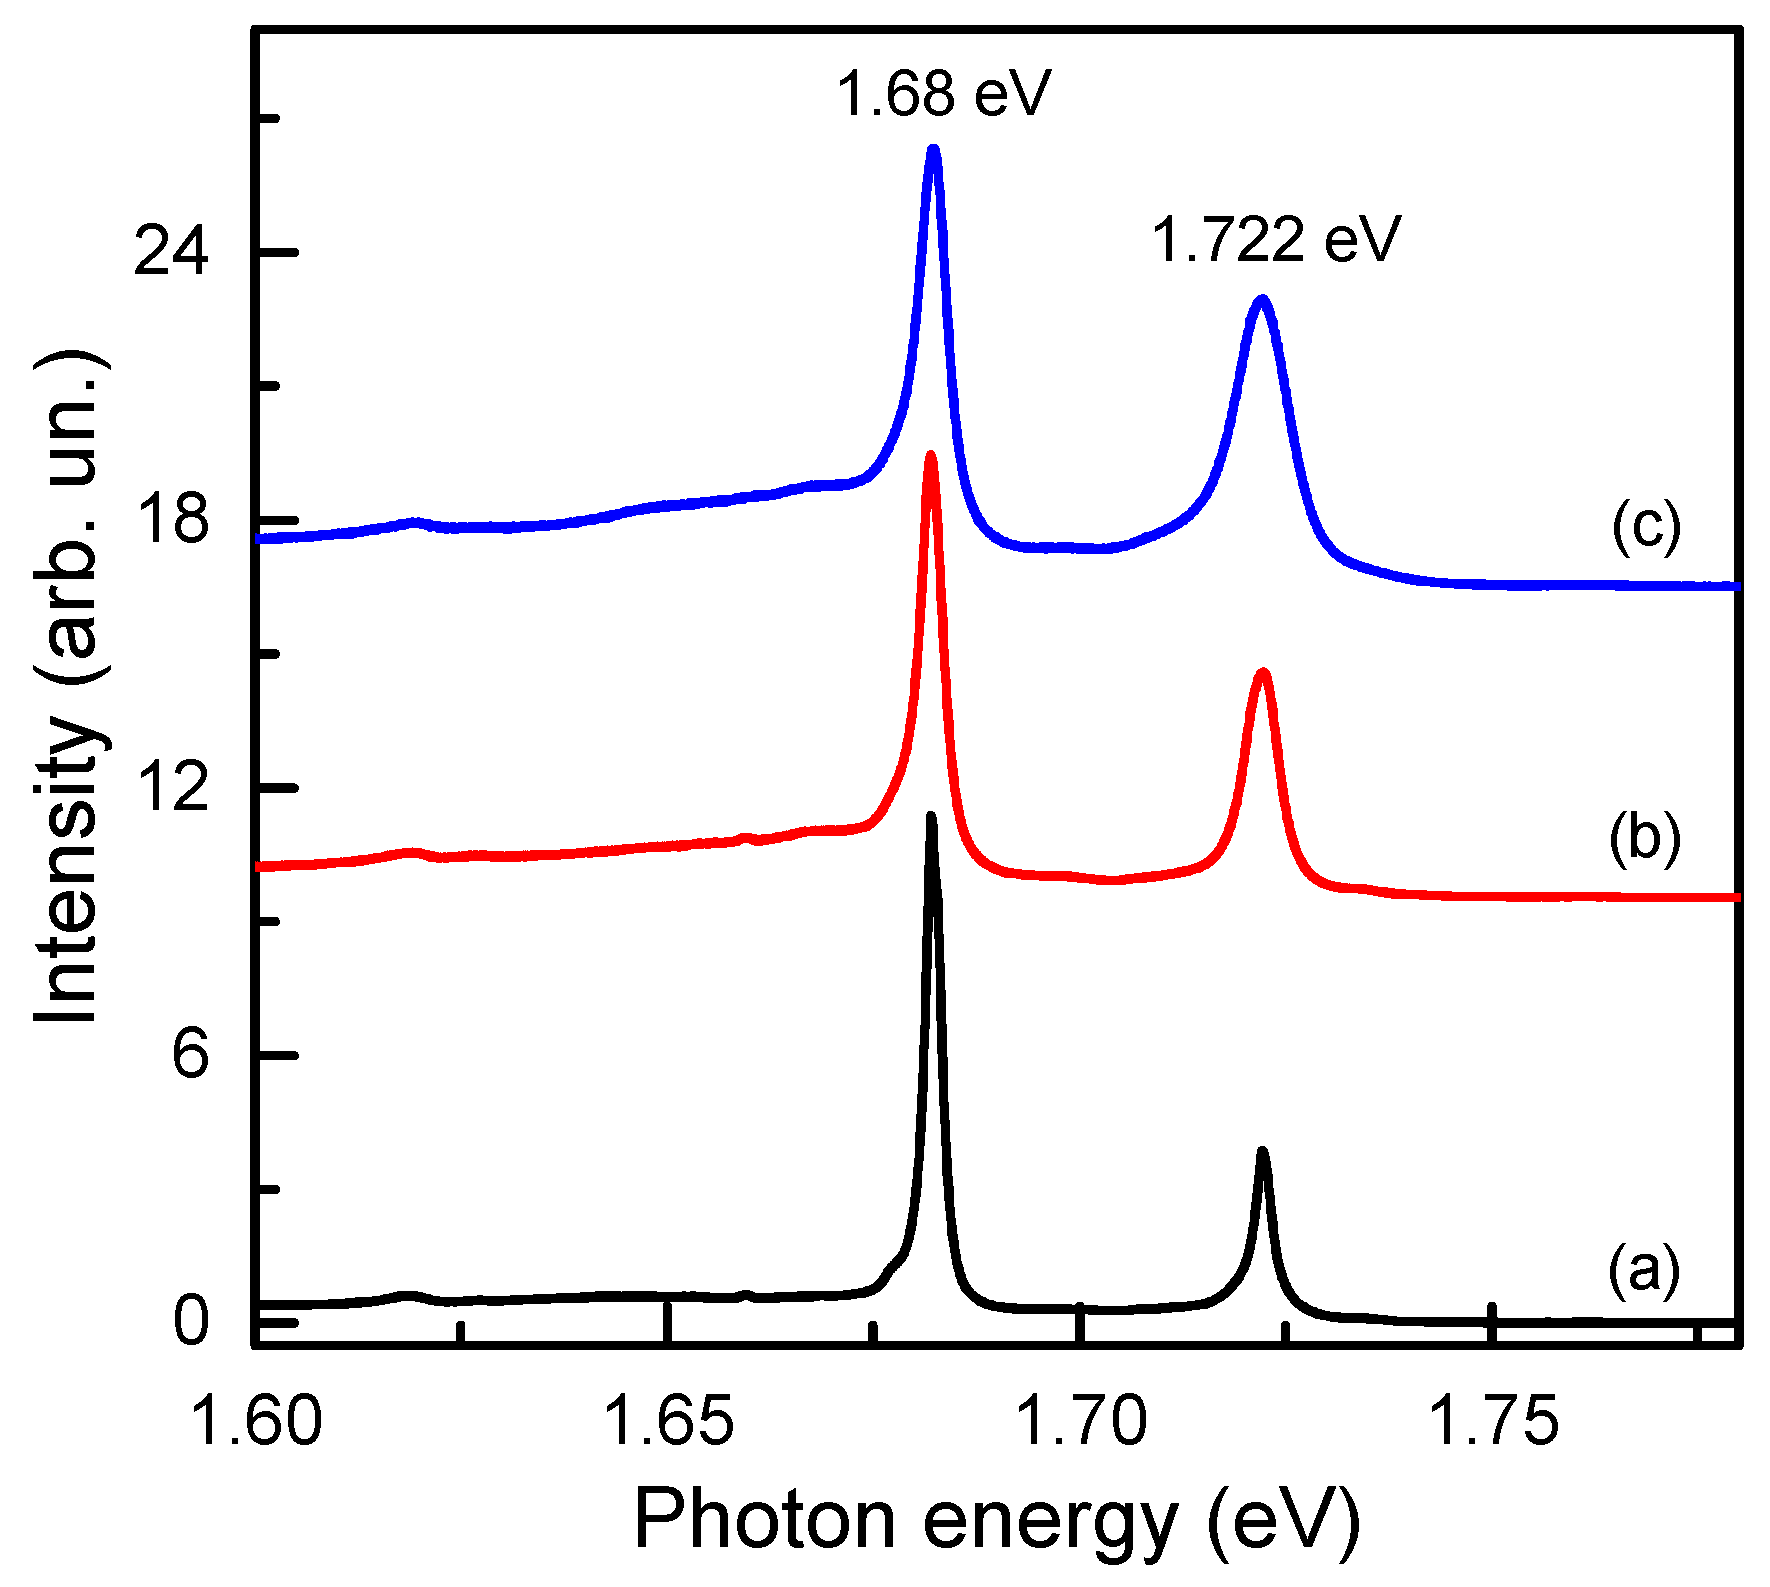
Diamond crystals grown from the compositions with higher Si contents showed changes in the PL spectra (Figure 11). Although the intensity of the 1.68 eV peak did not change significantly, it became broader so that its doublet structure could not be observed. This broadening suggests that the diamonds produced in the Mg-Si-C system with Si content ≥10 wt % have a higher level of internal strains. One possible source of these strains could be substitutional silicon defects, which also give rise to the strain-induced vibrational mode at 1338 cm−1. Another distinct feature evident from Figure 11 is that a peak at 1.722 eV, which was very weak for diamonds from the low Si content systems, became prominent in the PL spectra and attained intensities comparable to that of the 1.68 eV peak. The occurrence of the 1.722 eV peak in the spectra of diamonds grown from the Mg-Si-C system was noted previously [12]. Here, we confirm that it appears in the PL spectra of Si-doped HPHT diamonds. The nature of the defect responsible for the 1.722 eV is not clear at the moment and deserves further investigation. Nevertheless, we suppose it is very reasonable to assign this center to a defect related to silicon impurities.
3. Discussion
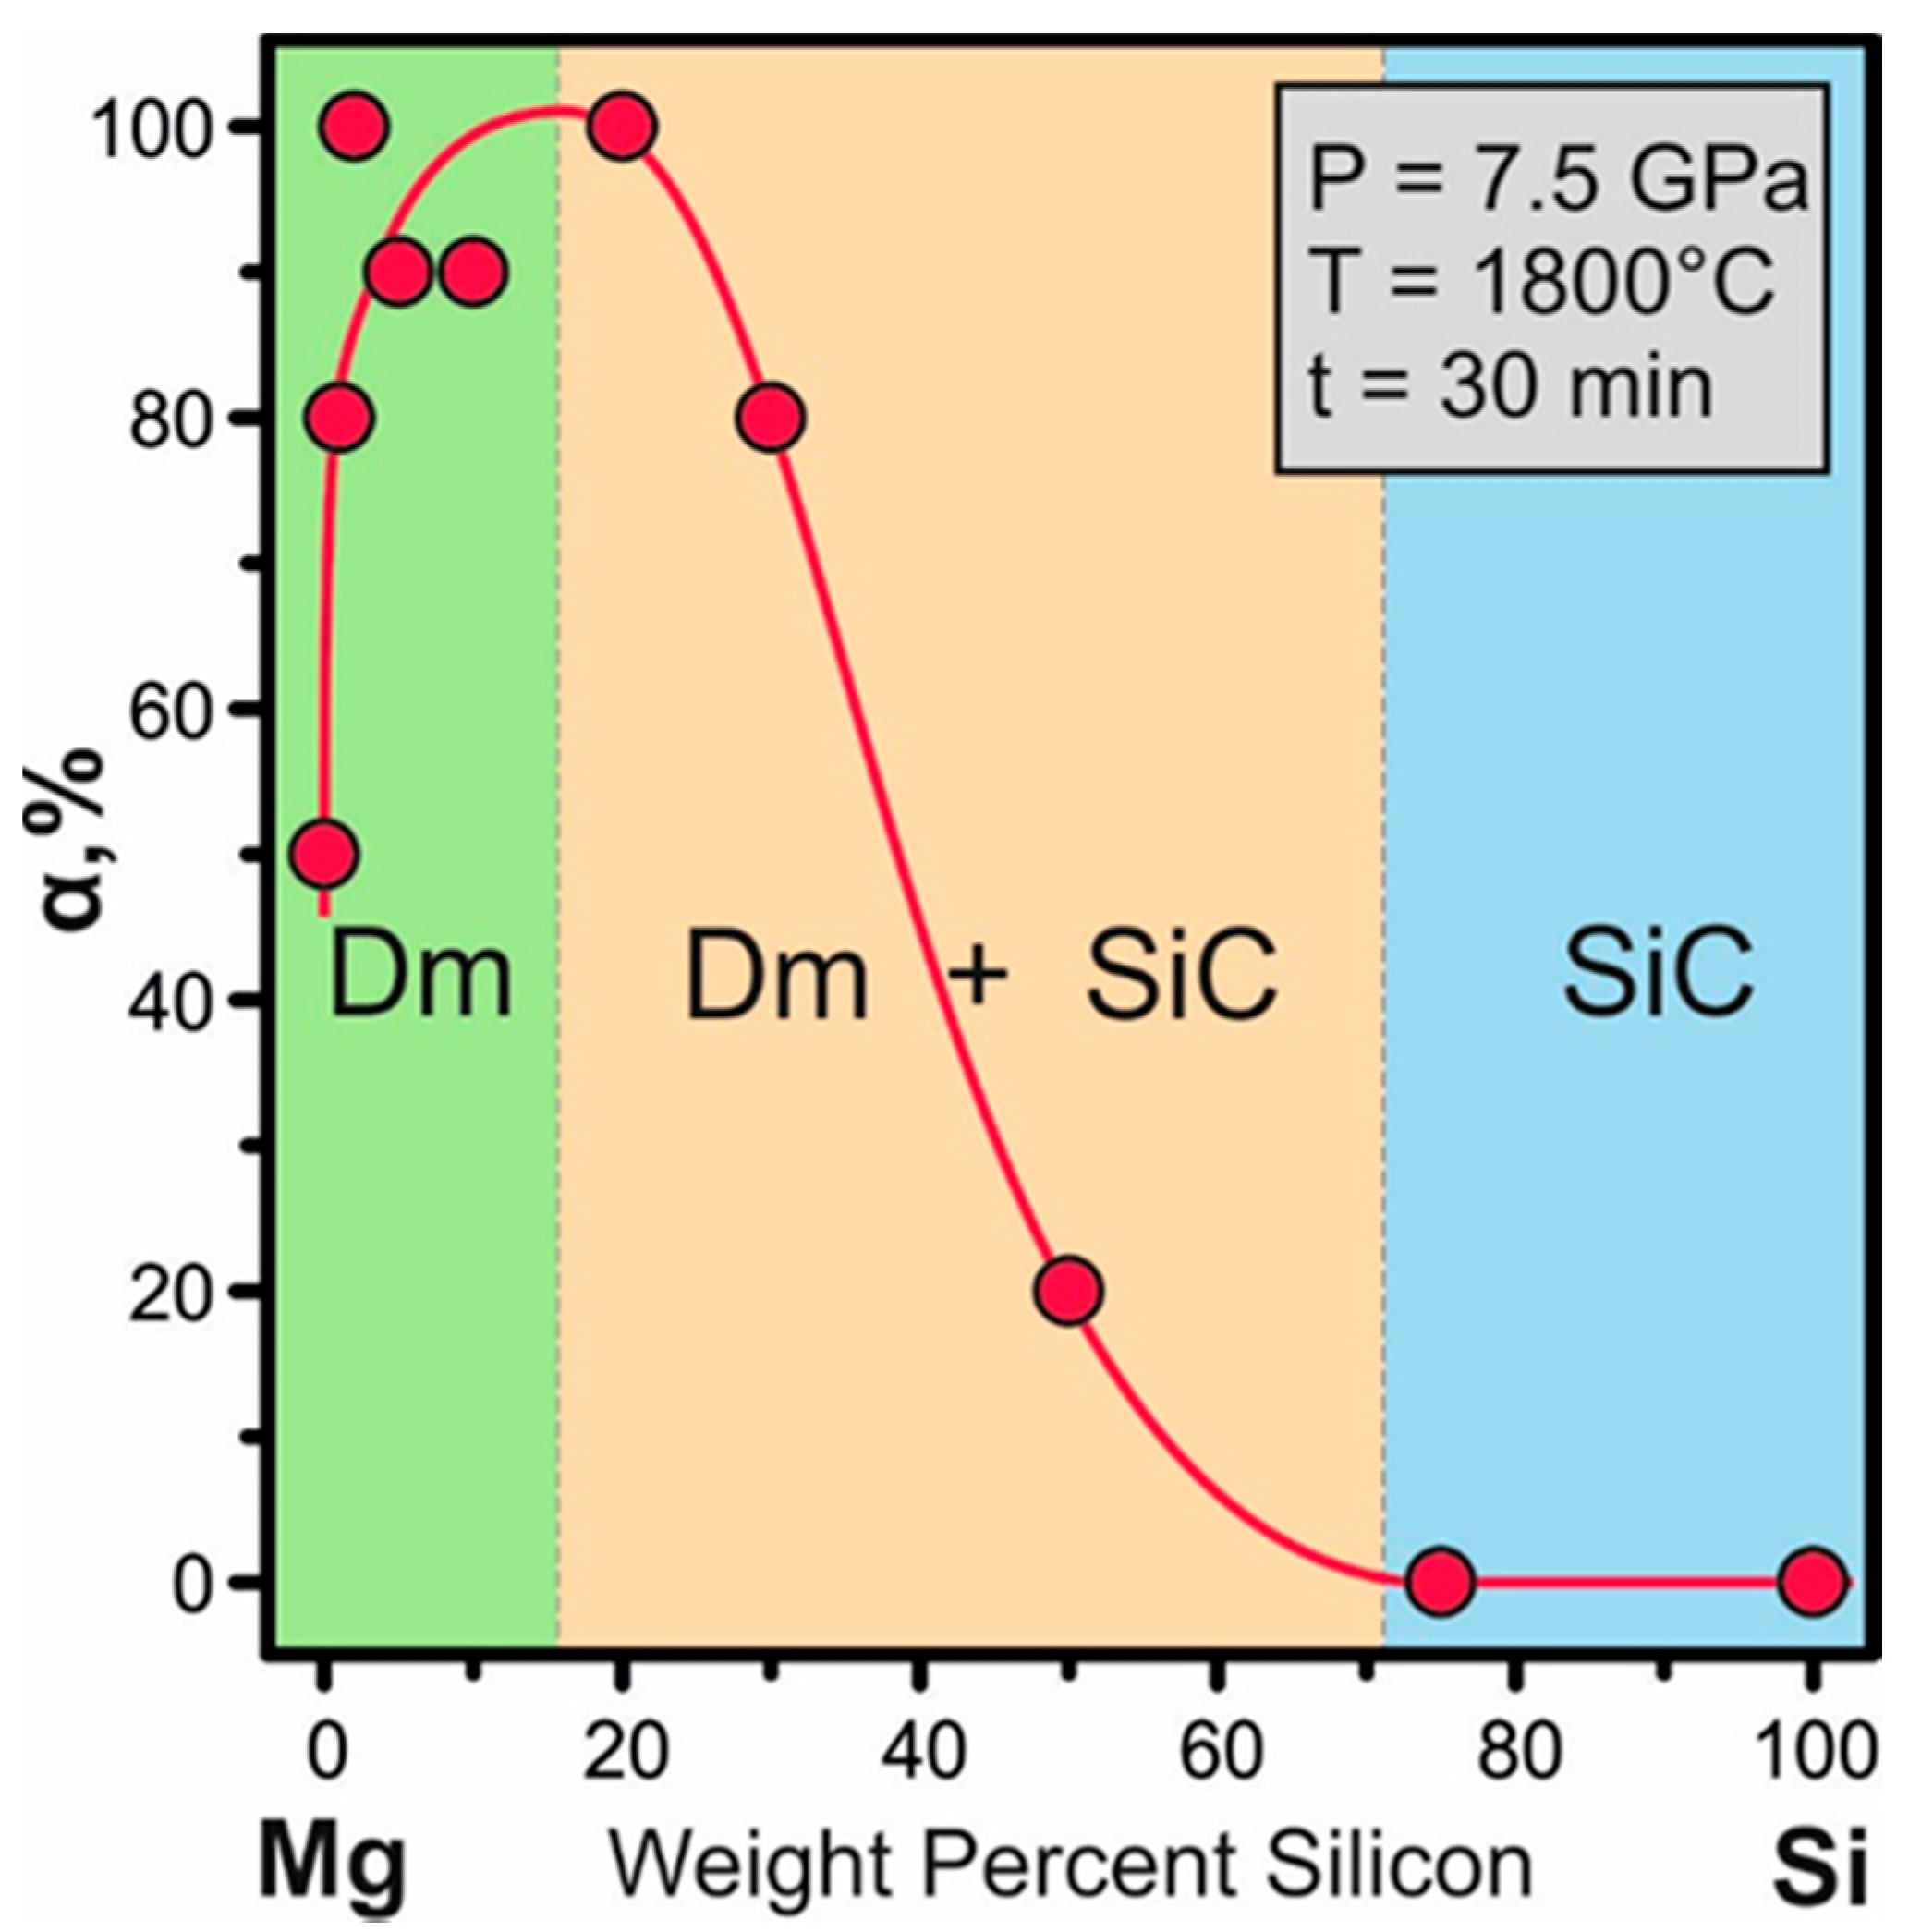
The results of this study allow us to assess the effect of the Mg/Si ratio on the crystallization of diamond and accompanying phases in the Mg-Si-C system at fixed P-T-t conditions. Figure 12 shows the degree of the graphite-to-diamond conversion (α) as a function of the silicon content in the Mg-Si-C system. It follows that the addition of even small amounts, about 1 wt %, of silicon results in a substantial increase in the conversion degree. With further increases in Si content in the range of 2 to 20 wt %, α increases to as high as 90−100%. As it was suggested previously [12], the most probable reason for increasing values of α in this range of compositions can be related to increasing carbon solubility in the binary melt of two carbide forming elements, Mg and Si. The observed sharp decrease in α for the Mg50Si50 starting composition is associated with the formation of two melts with different compositions. The first, magnesium-rich, melt ensures diamond synthesis, while the second, silicon-rich, melt does not exhibit this ability. Because of this catalyst melt partition, the amount of the diamond-forming melt in this experiment is substantially less than in other experiments with lower Si content in the system. In the case of the Mg25Si75 initial composition, there is a single melt, which is substantially enriched in Si and does not show the catalytic ability for converting graphite to diamond. It should be noted that no carbon or carbon-containing phases were detected in samples of the quenched melt. Furthermore, carbon was not detected as an impurity in all quenched phases. This can be explained by the low carbon solubility in the silicon-rich melt and the formation of silicon carbide at the graphite-melt interface, which blocks further interaction between the graphite and the melt. A similar situation takes place in the Si-C system. It should also be noted that the formation of silicon carbide occurred in all experiments with the Si content from 20 to 100 wt %. SiC was present as the cubic 3C modification in the majority of the experiments, while the hexagonal modification occurred only in the experiment with the Mg50Si50 starting composition and crystallized from the melt that did not produce diamond. As is known, preferential crystallization of cubic or hexagonal modifications of silicon carbide is affected by numerous factors, such as temperature, pressure, system composition and impurities [23,24]. The appearance of the 4H-SiC modification in this experiment is possibly related to the system composition, but clarification of this issue lies far beyond the scope of this work.
The results of this study also enable us to consider the effect of silicon on the morphology of diamond crystallized in the Mg-Si-C system. As shown previously [11], diamonds with cubic morphology, sometimes having minor {111} faces, form in the Mg-C system at 7 GPa and 1800 °C. The {100} faces are characterized by strong rectangular growth layers, the ends of which are formed exclusively by the {111} faces. Adding 1 wt % silicon leads to a rapid change in the macro- and micromorphology. Cubic morphology transforms to cube-octahedral (Figure 2a,b). Macrolayers on the {100} faces disappear. The surface relief of the {100} faces is determined by plane mirror-smooth {100} areas and numerous pyramidal pits formed exclusively by the {111} microfaces. The growth nature of the pits is confirmed by the distinct growth layers on the bounding {111} microfaces (Figure 2c). On the {111} faces of cube-octahedral crystals, macrolayers parallel to the face edges form. The ends of these layers are bound by the {111} microfaces (Figure 2a). At 2 wt % Si, the cubic faces become minor faces, but they still show plane {100} regions, small octahedral pits and very large depressions formed by the {111} faces (Figure 3a,c). The octahedral faces predominate. They exhibit pronounced macrolayers with the ends built up by the {111} faces (Figure 3b). As a result, the crystals attain a polycentric structure of the {111} faces. Figure 3 also shows that the number of macrolayer generation centers can be significantly different on different faces of the same crystal. Thus, even small changes in the Si content in the system result in substantial changes in the relative growth rates of {100} and {111} faces. Obviously, the growth rate of octahedral faces decreases relative to the growth rate of cubic faces. We may suppose that this process is accompanied by the impurity blocking of some defects on the {100} faces, which leads to the formation of numerous pyramidal growth pits. Therefore, in the Mg-C system, the morphology variation in the cube-octahedron series is unambiguously determined by the influence of silicon additive. This is in contrast to the conventional transition metal catalysts, where the cube-to-octahedron transformation of the diamond morphology is primarily determined by the P-T parameters of synthesis.
4. Materials and Methods
Synthesis experiments in the Mg-Si-C system were performed using a split-sphere multi-anvil high-pressure apparatus [25]. All experiments were conducted at a pressure of 7.5 GPa with high-pressure cells in the form of a tetragonal prism with dimensions 19 × 19 × 22 mm. A PtRh6/PtRh30 thermocouple (Krastsvetmet, Krasnoyarsk, Russia) was used in each experiment for the temperature measurements. Given the data of calibration experiments [26,27], the accuracy of temperature and pressure measurements was ±40 °C and ±0.2 GPa, respectively. The high-pressure cell and sample assemblies were the same in all experiments of this series and was similar to that used in our previous studies of the Mg-C system [11,12]. A mixture of Mg and Si powders and four 0.5 mm synthetic diamond seed crystals were packed into a thick-walled graphite capsule, 6.9 mm in diameter and 6.5 mm high, which was the carbon source. The graphite capsule was enveloped from all sides with a 0.1 mm thick molybdenum foil to prevent diffusion of the high pressure cell components during experiments. A schematic of the initial sample assembly is shown in Figure 1a. In all experiments, the main parameters were kept constant: P = 7.5 GPa, T = 1800 °C, and a run time of 30 min. Only the solvent composition was changed by varying the Mg/Si ratio. The purity of starting reagents was as follows: graphite—99.99%, magnesium—99.99%, and silicon—99.99%. After experiments, the run products were dissolved in dilute hydrochloric acid. Residual graphite and newly formed diamond were weighed to determine the degree of graphite-to-diamond conversion (α) in each experiment, α = MDm/(MDm + MGr) × 100, where MDm is the mass of synthesized diamond, and MGr is the mass of residual graphite. The recovered diamond crystals and associated phases were studied using an Axio Imager Z2m optical microscope (Carl Zeiss Microscopy, Jena, Germany) and a Tescan MIRA3 LMU scanning electron microscope (Tescan, Brno, Czech Republic). The composition of the Mg-Si alloys formed in the experiments was analyzed by the energy dispersive spectrometry (EDS) (Oxford Instruments, Abington, UK). Spectroscopic characterization of the diamond crystals was performed by means of infrared (IR) absorption, photoluminescence (PL) and Raman scattering. IR spectra were measured using a Bruker Vertex 70 Fourier transform infrared (FTIR) spectrometer fitted with a Hyperion 2000 microscope (Bruker Optics, Ettlingen, Germany). Raman/PL spectra were measured using a Horiba J.Y. LabRAM HR800 spectrometer fitted with an Olympus BX41 microscope (Horiba Jobin Yvon S.A.S., Lonjumeau, France). A 523-nm solid state laser (Laser Quantum, Stockport, UK) was used as the excitation source. For the low temperature measurements, a Linkam FTIR600 heating/freezing stage was used (Linkam Scientific Instruments, Tadworth, UK).
5. Conclusions
We investigated the effect of the Mg/Si ratio on diamond crystallization in the Mg-Si-C system at 7.5 GPa and 1800 °C. We found that, as the Si content of the system increases from 0 to 2 wt %, the degree of the graphite-to-diamond transformation increases from 50 to 100% and remains at about this level up to 20 wt % Si. We associated this with a higher carbon solubility in the binary melts of two carbide-forming elements, Mg and Si. A further increase in the silicon content of the system leads to a decrease in the degree of graphite-to-diamond transformation and then to a complete termination of diamond synthesis at Si content greater than 50 wt %. This phenomenon is associated with the shift of the melt compositions to the silicon-enriched region, which is accompanied by a significant decrease in carbon solubility. With the Si content of up to about 15 wt %, only diamond crystallizes in the Mg-Si-C system; at Si contents in the range of 20 to 50 wt %, simultaneous crystallization of diamond and silicon carbide occurs; and only SiC crystallizes at a higher Si content in the system.
The morphology diamond crystallized in the Mg-Si-C system is determined by the relative development of {100} and {111} faces and changes from cubic to octahedral as the Si content increases. In the Mg-C system, the stable growth form is cube, cube-octahedral crystals form at 1 wt % Si, and at ≥2 wt % Si the dominant growth form is octahedron. Without silicon impurity, growth of the {100} faces occurs by macrolayers, the ends of which are bound by the {111} microfaces. Upon addition of Si, macrolayers with the {111} ends form on octahedron faces, and crystals acquire the polycentric structure.
Over the entire range of the diamond producing compositions, the crystallized diamonds are nitrogen-free due to the gettering properties of magnesium and possibly silicon. As the Si content of the growth system increases, the synthesized diamonds tend to incorporate higher amounts of silicon impurities, which give rise to the localized vibrational mode at 1338 cm−1 observed in the IR spectra. The 1.68 eV Si-V centers dominate in photoluminescence spectra of the diamond crystals produced at Si contents ≤10 wt %; at higher Si contents, the 1.68 eV centers are accompanied by a system with a zero-phonon line at 1.722 eV. The established correlations between the Si content of the Mg-Si-C growth system and optical characteristics of the synthesized diamonds can be applied for developing methods of production of diamond with controlled properties.
Acknowledgments
This work was supported by the Russian Science Foundation under Grant No. 14-27-00054.
Author Contributions
Yuri Palyanov conceived and designed the experiments; Yuri Borzdov performed the experiments; Yuri Palyanov, Denis Nechaev and Yuliya Bataleva studied run products and analyzed the data; Igor Kupriyanov performed spectroscopic characterization of crystallized diamond and SiC; Yuri Palyanov and Igor Kupriyanov wrote the paper.
Conflicts of Interest
The authors declare no conflict of interest. The founding sponsors had no role in the design of the study; in the collection, analyses, or interpretation of data; in the writing of the manuscript, and in the decision to publish the results.
References
- Bundy, F.P.; Hall, H.T.; Strong, H.M.; Wentorf, J.R. Man-made diamonds. Nature 1955, 176, 51–55. [Google Scholar] [CrossRef]
- Bovenkerk, H.P.; Bundy, F.P.; Hall, H.T.; Strong, H.M.; Wentorf, J.R. Preparation of diamond. Nature 1959, 184, 1094–1098. [Google Scholar] [CrossRef]
- Kanda, H. Classification of the catalysts for diamond growth. In Advances in New Diamond Science and Technology; Saito, S., Fujimori, N., Fukunaga, O., Kamo, M., Kobashi, K., Yoshikawa, M., Eds.; MYU: Tokyo, Japan, 1994; pp. 507–512. [Google Scholar]
- Wedlake, R.J. Technology of diamond growth. In The properties of diamond; Field, J.E., Ed.; Academic Press: London, UK, 1979; pp. 501–535. [Google Scholar]
- Burns, R.C.; Davies, G.J. Growth of synthetic diamond. In The Properties of Natural and Synthetic Diamond; Field, J.E., Ed.; Academic Press: London, UK, 1992; pp. 395–422. [Google Scholar]
- Palyanov, Y.; Kupriyanov, I.; Khokhryakov, A.; Ralchenko, V. Crystal Growth of Diamond. In Handbook of Crystal Growth, 2nd ed.; Nishinaga, T., Rudolph, P., Eds.; Elsevier: Amsterdam, Holland, 2015; Volume 2a, pp. 671–713. [Google Scholar]
- Ekimov, E.A.; Sidorov, V.A.; Bauer, E.D.; Mel’nik, N.N.; Curro, N.J.; Thompson, J.D.; Stishov, S.M. Superconductivity in diamond. Nature 2004, 428, 542–545. [Google Scholar] [CrossRef] [PubMed]
- Akaishi, M.; Kanda, H.; Yamaoka, S. Phosphorous: An elemental catalyst for diamond synthesis and growth. Science 1993, 259, 1592–1593. [Google Scholar] [CrossRef] [PubMed]
- Palyanov, Y.N.; Kupriyanov, I.N.; Sokol, A.G.; Khokhryakov, A.F.; Borzdov, Y.M. Diamond growth from a phosphorus-carbon system at HPHT conditions. Cryst. Growth Des. 2011, 11, 2599–2605. [Google Scholar] [CrossRef]
- Palyanov, Y.N.; Kupriyanov, I.N.; Borzdov, Y.M.; Surovtsev, N.V. Germanium: A new catalyst for diamond synthesis and a new optically active impurity in diamond. Sci. Rep. 2015, 5, 14789. [Google Scholar] [CrossRef] [PubMed]
- Palyanov, Y.N.; Borzdov, Y.M.; Kupriyanov, I.N.; Khokhryakov, A.F.; Nechaev, D.V. Diamond crystallization from an Mg-C system at high pressure high temperature conditions. CrystEngComm 2015, 17, 4928–4936. [Google Scholar] [CrossRef]
- Palyanov, Y.N.; Kupriyanov, I.N.; Borzdov, Y.M.; Bataleva, Y.V. High-pressure synthesis and characterization of diamond from an Mg–Si–C system. CrystEngComm 2015, 17, 7323–7331. [Google Scholar] [CrossRef]
- Palyanov, Y.N.; Kupriyanov, I.N.; Borzdov, Y.M.; Khokhryakov, A.F.; Surovtsev, N.V. High-pressure synthesis and characterization of Ge-doped single crystal diamond. Cryst. Growth Des. 2016, 16, 3510–3518. [Google Scholar] [CrossRef]
- Khokhryakov, A.F.; Sokol, A.G.; Borzdov, Y.M.; Palyanov, Y.N. Morphology of diamond crystals grown in magnesium-based systems at high temperatures and high pressures. J. Cryst. Growth 2015, 426, 276–282. [Google Scholar] [CrossRef]
- Khokhryakov, A.F.; Nechaev, D.V.; Palyanov, Y.N. Unusual growth macrolayers on {100} faces of diamond crystals from magnesium-based systems. J. Cryst. Growth 2016, 455, 76–82. [Google Scholar] [CrossRef]
- Müller, T.; Hepp, C.; Pingault, B.; Neu, E.; Gsell, S.; Schreck, M.; Sternschulte, H.; Steinmüller-Nethl, D.; Becher, C.; Atatüre, M. Optical signatures of silicon-vacancy spins in diamond. Nat. Commun. 2014, 5, 3328. [Google Scholar] [CrossRef] [PubMed]
- Iwasaki, T.; Ishibashi, F.; Miyamoto, Y.; Doi, Y.; Kobayashi, S.; Miyazaki, T.; Tahara, K.; Jahnke, K.D.; Rogers, L.J.; Naydenov, B.; et al. Germanium-vacancy single color centers in diamond. Sci. Rep. 2015, 5, 12882. [Google Scholar] [CrossRef] [PubMed]
- Quantum Information Processing with Diamond; Prawer, S.; Aharonovich, I. (Eds.) Woodhead Publishing: Cambridge, UK, 2014; p. 330. [Google Scholar]
- Kovalenko, T.V.; Ivakhnenko, S.A. Properties of diamonds seed-grown in the magnesium-carbon system. J. Superhard Mater. 2013, 35, 131–136. [Google Scholar] [CrossRef]
- Collins, A.T.; Williams, A.W.S. The nature of the acceptor centre in semiconducting diamond. J. Phys. C Solid State Phys. 1971, 4, 1789–1800. [Google Scholar] [CrossRef]
- Goss, J.P.; Briddon, P.R.; Shaw, M.J. Density functional simulations of silicon-containing point defects in diamond. Phys. Rev. B 2007, 76, 075204. [Google Scholar] [CrossRef]
- Breeding, C.M.; Wang, W. Occurrence of the Si–V defect center in natural colorless gem diamonds. Diam. Relat. Mater. 2008, 17, 1335–1344. [Google Scholar] [CrossRef]
- Sugiyama, S.; Togaya, M. Phase relationship between 3C-and 6H-silicon carbide at high pressure and high temperature. J. Am. Ceram. Soc. 2001, 84, 3013–3016. [Google Scholar] [CrossRef]
- Jepps, N.W.; Page, T.F. The 6H→3C “reverse” transformation in silicon carbide compacts. J. Am. Ceram. Soc. 1981, 64, 2830–2833. [Google Scholar] [CrossRef]
- Pal’yanov, Y.N.; Sokol, A.G.; Borzdov, Y.M.; Khokhryakov, A.F. Fluid-bearing alkaline-carbonate melts as the medium for the formation of diamonds in the Earth’s mantle: an experimental study. Lithos 2002, 60, 145–159. [Google Scholar] [CrossRef]
- Palyanov, Y.N.; Borzdov, Y.M.; Khokhryakov, A.F.; Kupriyanov, I.N.; Sokol, A.G. Effect of nitrogen impurity on diamond crystal growth processes. Cryst. Growth Des. 2010, 10, 3169–3175. [Google Scholar] [CrossRef]
- Sokol, A.G.; Borzdov, Y.M.; Palyanov, Y.N.; Khokhryakov, A.F. High temperature calibration a multi-anvil high-pressure apparatus. High Press. Res. 2015, 35, 139–147. [Google Scholar] [CrossRef]
Figure 1.
General schemes of crystallization of diamond and silicon carbide in the Mg-Si-C system. (a) Initial sample assembly; (b) Crystallization of diamond; (c) Crystallization of diamond and silicon carbide; (d) Crystallization of silicon carbide. 1—molybdenum; 2—graphite capsule; 3—powder mixture of Mg and Si; 4—diamond seed crystals; 5—crystallized diamond; 6—magnesium-rich melt; 7—magnesium-rich melt film; 8—silicon-rich or silicon melt; 9—crystallized silicon carbide.
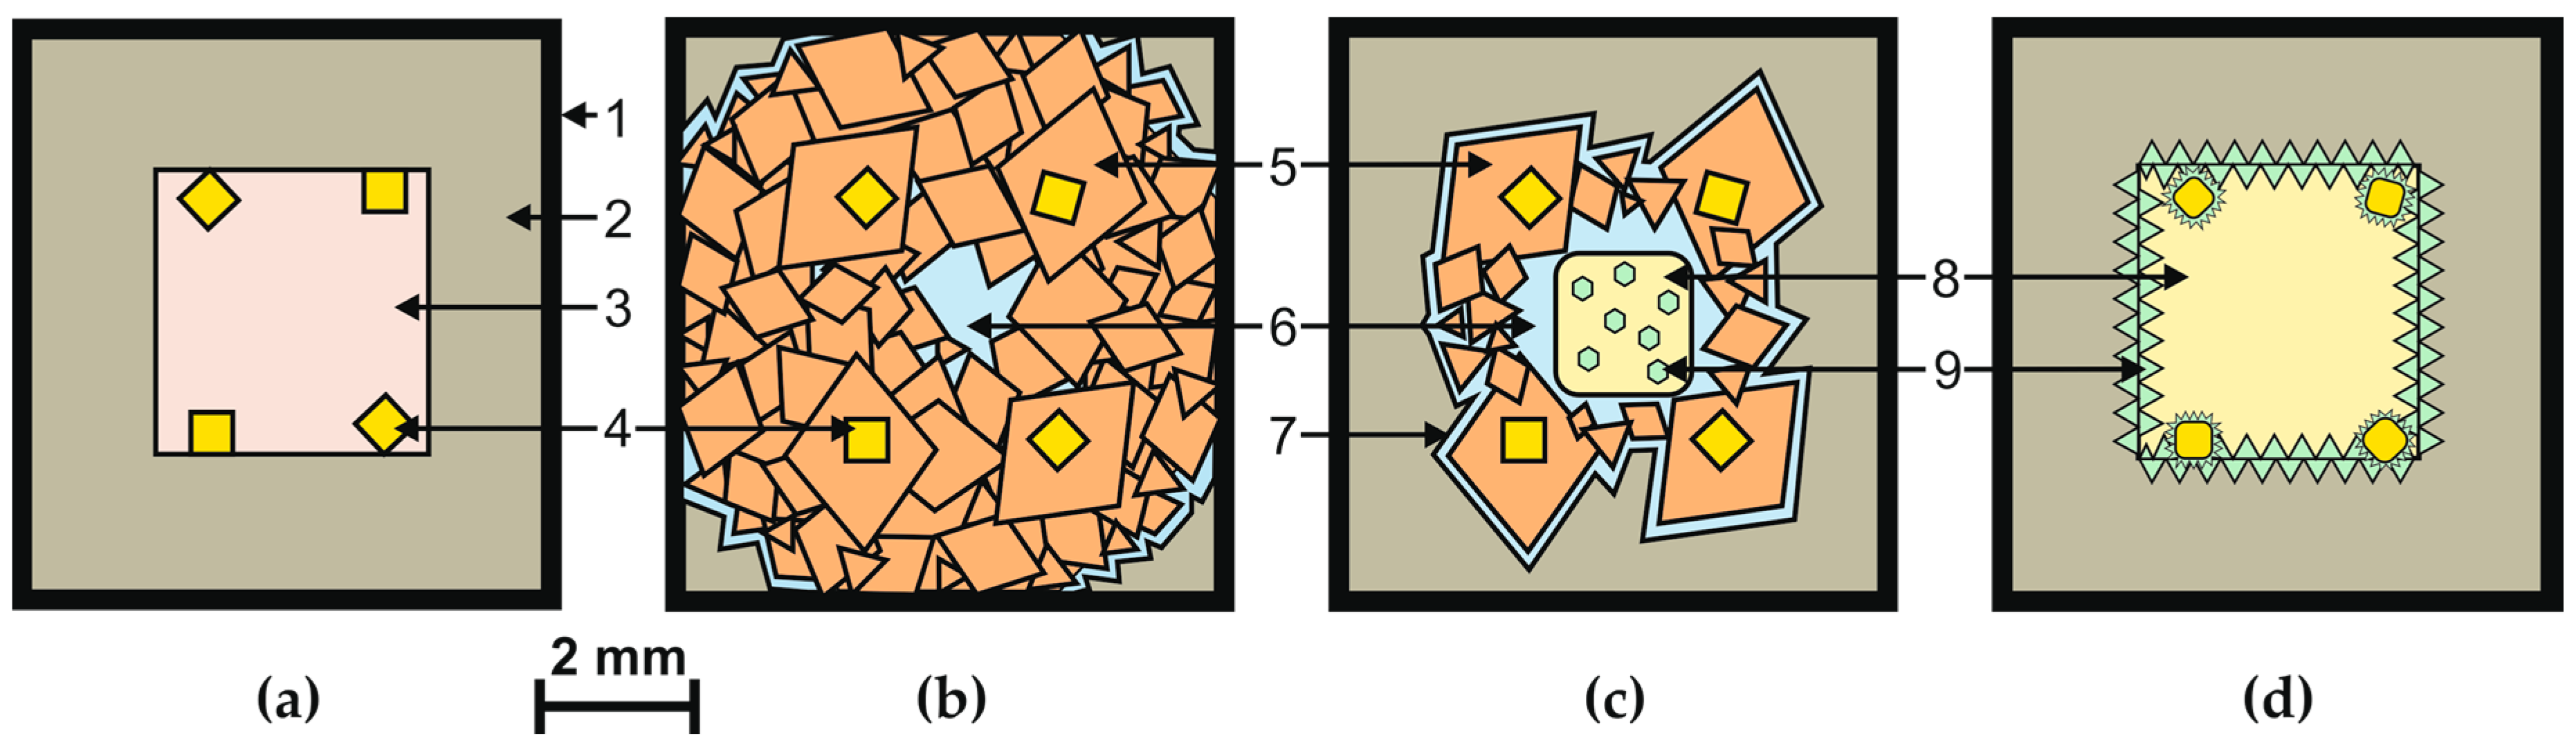
Figure 2.
Scanning electron microscopy (SEM) micrographs of a cube-octahedral diamond crystal produced in the Mg99Si1-C system. (a) General view; (b) Growth features on the {111} faces; (c) Pyramidal pits with {111} growth layers on {100} face; (b,c)—Enlarged views of areas marked with squares in (a).
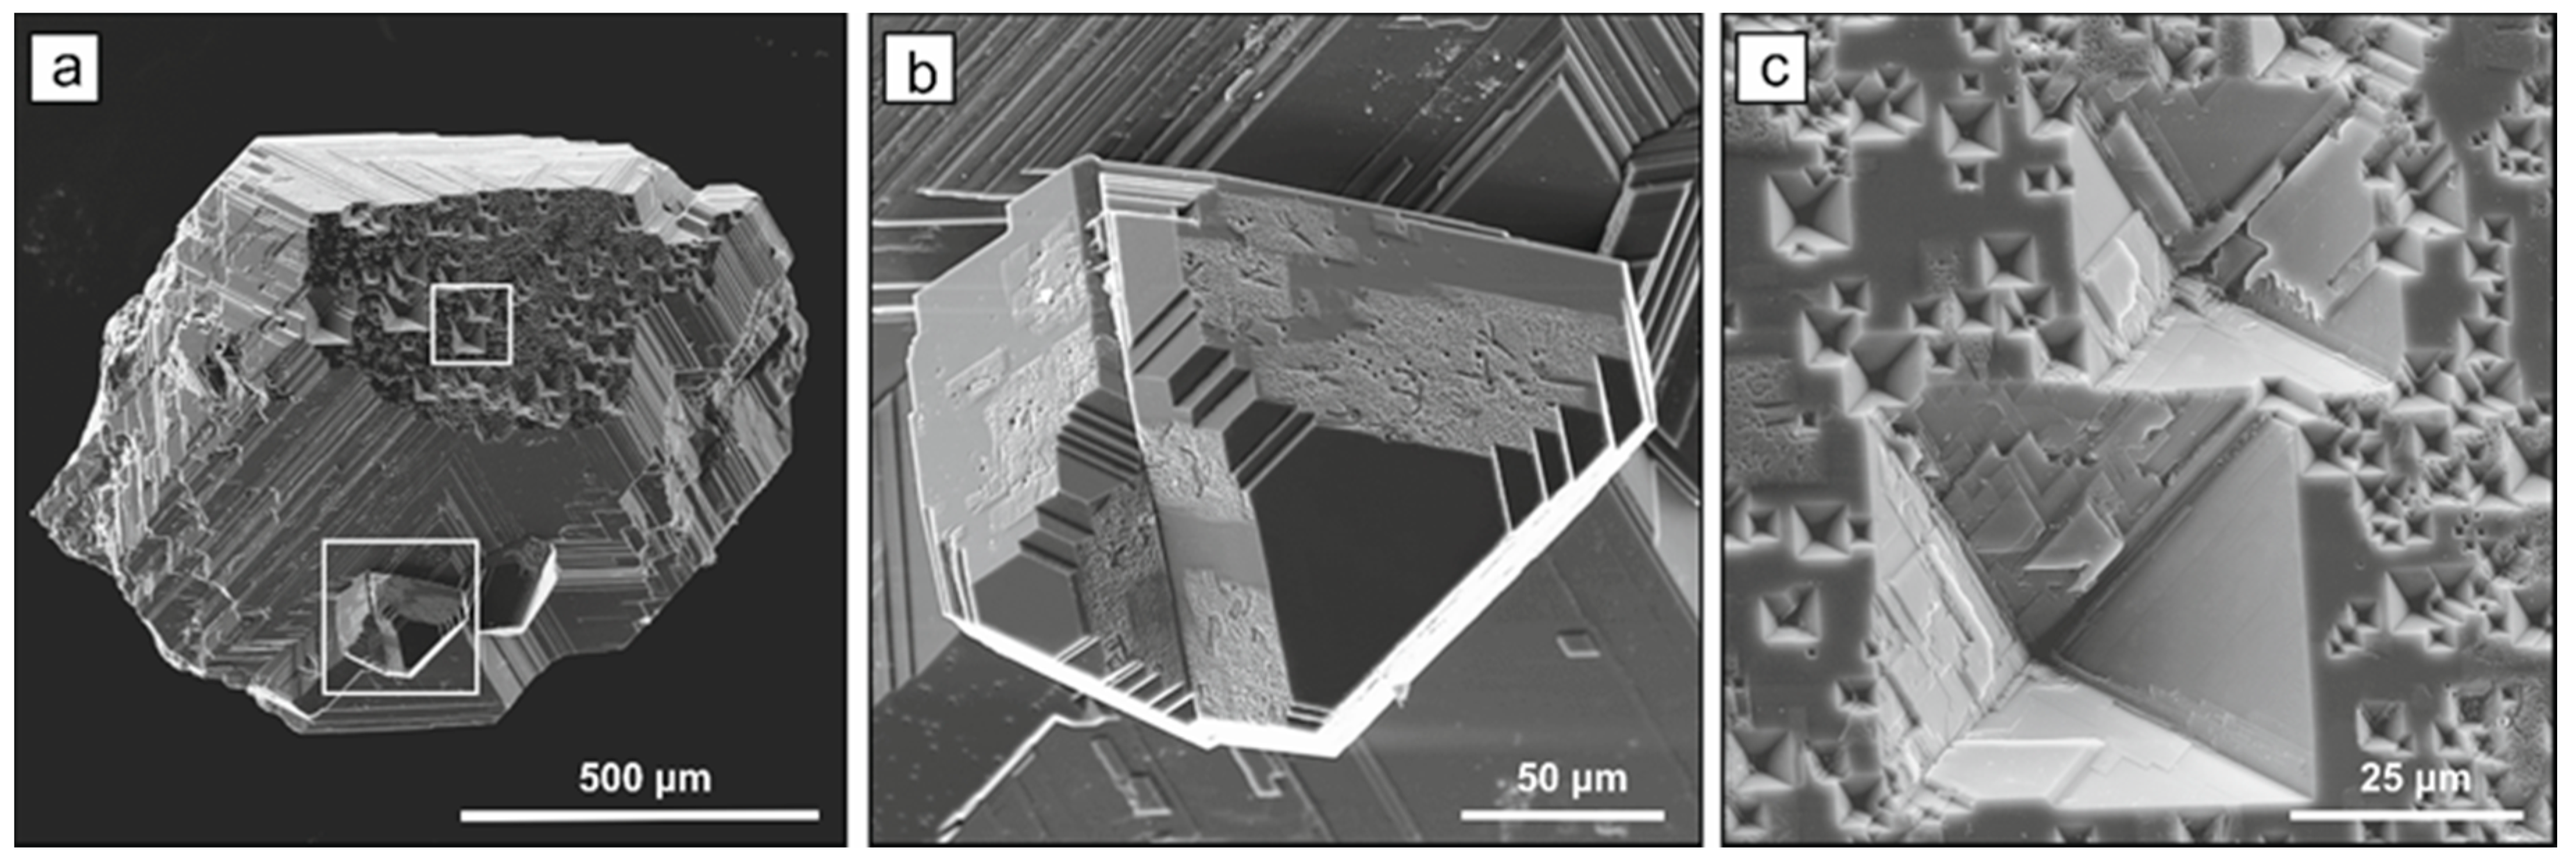
Figure 3.
SEM micrographs of a diamond crystal synthesized in the Mg98Si2-C system. (a) General view of the crystal showing dominant {111} faces and minor {100} faces; (b) Growth layers on the {111} face; (c) Growth pits on the {100} face; (b,c)—Enlarged views of areas marked with squares in (a).
Figure 3.
SEM micrographs of a diamond crystal synthesized in the Mg98Si2-C system. (a) General view of the crystal showing dominant {111} faces and minor {100} faces; (b) Growth layers on the {111} face; (c) Growth pits on the {100} face; (b,c)—Enlarged views of areas marked with squares in (a).
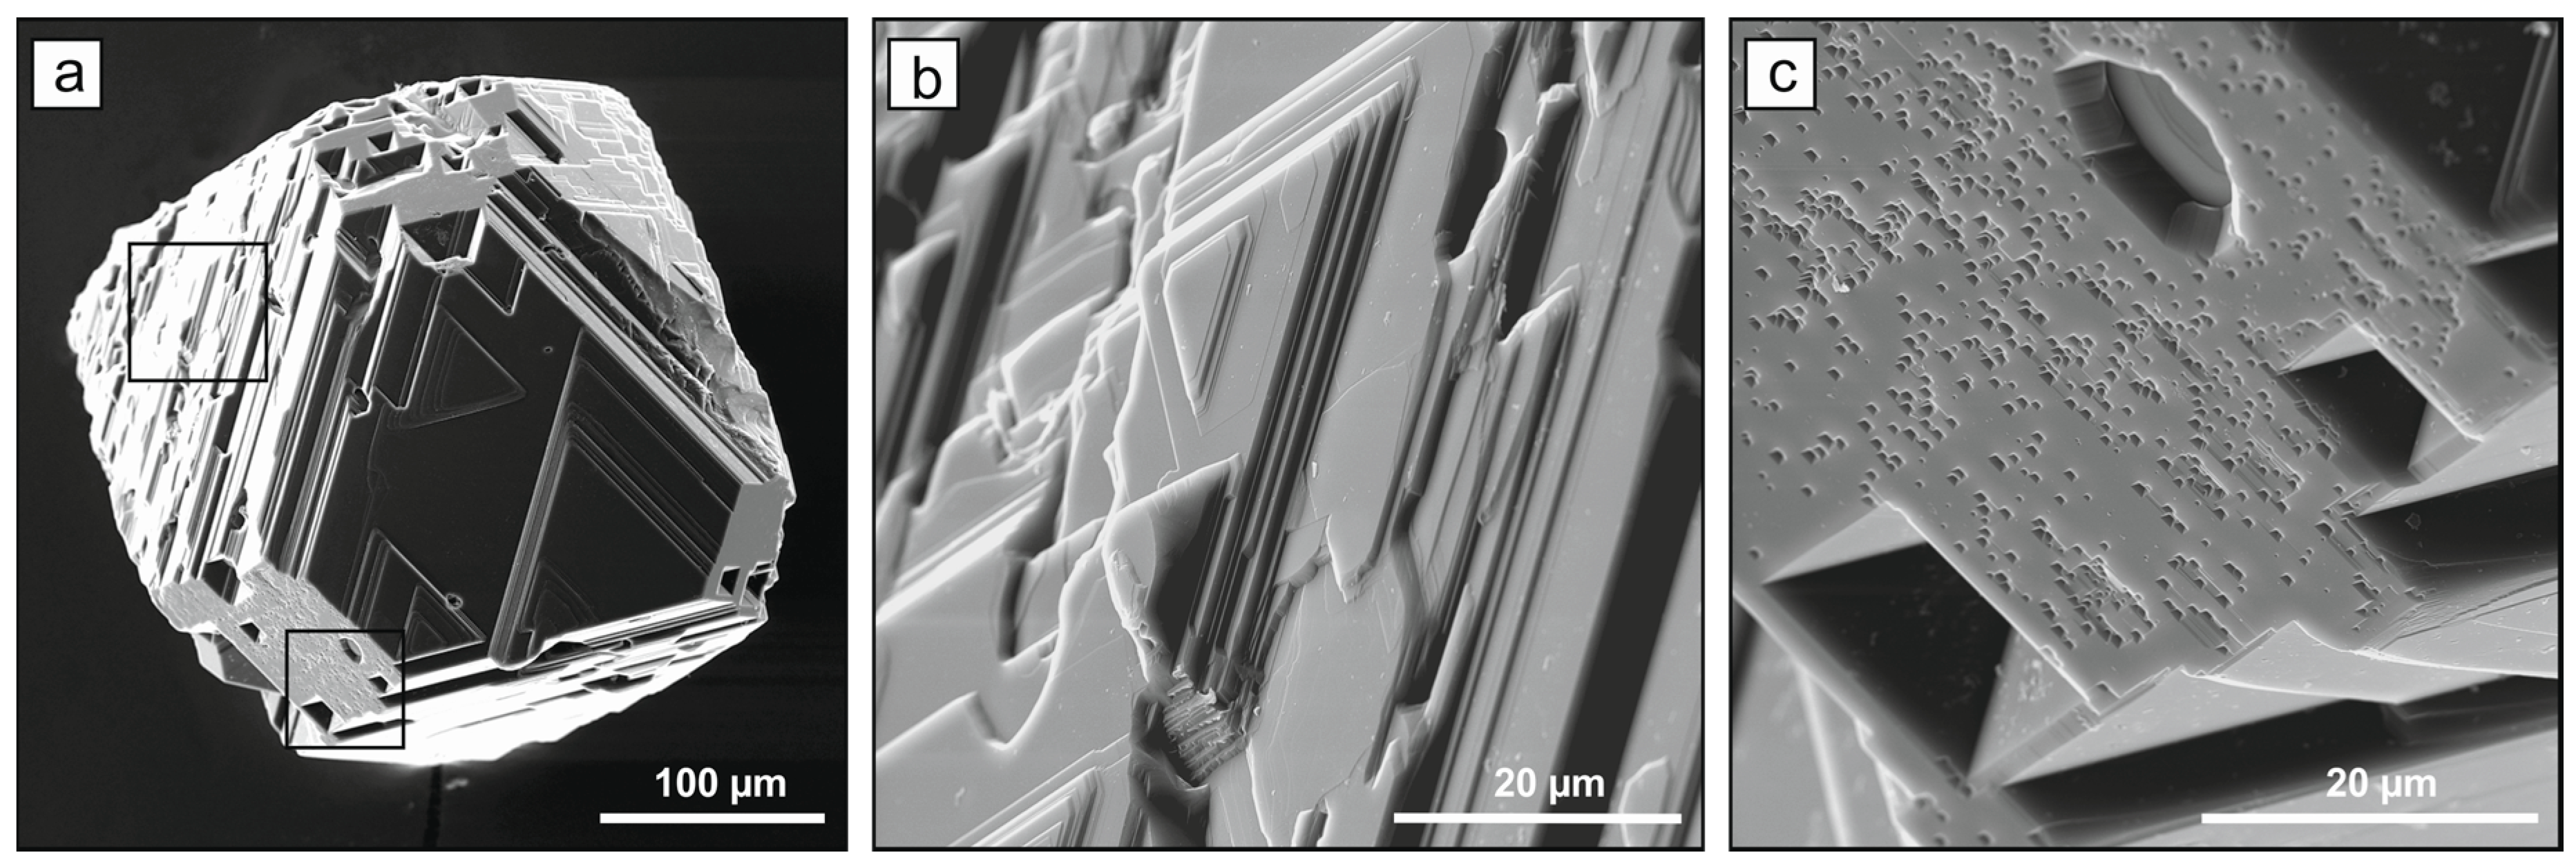
Figure 4.
SEM micrographs of a twinned diamond crystal with growth macrolayers on the {111} faces. (a) General view; (b) Enlarged view of an area marked with square in (a).
Figure 4.
SEM micrographs of a twinned diamond crystal with growth macrolayers on the {111} faces. (a) General view; (b) Enlarged view of an area marked with square in (a).

Figure 5.
SEM micrographs of an octahedral diamond crystal produced in the Mg95Si5-C. (a) General view; (b,c) Enlarged views of the {111} faces with serrate macrolayers marked with squares in (a).
Figure 5.
SEM micrographs of an octahedral diamond crystal produced in the Mg95Si5-C. (a) General view; (b,c) Enlarged views of the {111} faces with serrate macrolayers marked with squares in (a).

Figure 6.
SEM micrographs of diamond and silicon carbide. (a) A diamond block consisting of octahedral crystals in approximately parallel orientation (general view); (b) Enlarged view of (a); (c) Intergrowth of cubic SiC (tetrahedrons) with diamond.
Figure 6.
SEM micrographs of diamond and silicon carbide. (a) A diamond block consisting of octahedral crystals in approximately parallel orientation (general view); (b) Enlarged view of (a); (c) Intergrowth of cubic SiC (tetrahedrons) with diamond.

Figure 7.
Raman spectra of (a) cubic 3C-SiC crystals and (b,c) hexagonal 4H-SiC crystals of different morphologies.
Figure 7.
Raman spectra of (a) cubic 3C-SiC crystals and (b,c) hexagonal 4H-SiC crystals of different morphologies.

Figure 8.
SEM micrographs of hexagonal silicon carbide crystals of different morphologies produced in run MS-8.
Figure 8.
SEM micrographs of hexagonal silicon carbide crystals of different morphologies produced in run MS-8.

Figure 9.
Typical infrared absorption spectra recorded for diamond crystals produced in the Mg-Si-C system with different Si content. (a,b) 1; (c) 5; (d,e) 20; and (f,g) 50 wt % Si. The spectra are displaced vertically for clarity.
Figure 9.
Typical infrared absorption spectra recorded for diamond crystals produced in the Mg-Si-C system with different Si content. (a,b) 1; (c) 5; (d,e) 20; and (f,g) 50 wt % Si. The spectra are displaced vertically for clarity.

Figure 10.
Typical photoluminescence (PL) spectra of diamonds synthesized in the Mg-Si-C system with different Si content. (a) 0; (b) 1; (c) 5 and (d) 10 wt % Si. The inset shows the zero-phonon line (ZPL) region of the 1.68 eV PL system. The spectra are measured at 80 K. The spectra are displaced vertically for clarity.

Figure 11.
Typical PL spectra of diamonds synthesized in the Mg-Si-C system with different Si content. (a) 20, (b) 30 and (c) 50 wt % Si. The spectra are displaced vertically for clarity.
Figure 11.
Typical PL spectra of diamonds synthesized in the Mg-Si-C system with different Si content. (a) 20, (b) 30 and (c) 50 wt % Si. The spectra are displaced vertically for clarity.

Figure 12.
Degree of the graphite-to-diamond transformation as a function of the weight percent silicon in the Mg-Si-C system.
Figure 12.
Degree of the graphite-to-diamond transformation as a function of the weight percent silicon in the Mg-Si-C system.


Table 1.
Experimental conditions and results.
| Run N | P, GPa | T, °C | Time, min | Composition, wt % | α Gr → Dm Conversion | Diamond Morphology | SiC |
|---|---|---|---|---|---|---|---|
| MS-1 | 7.5 | 1800 | 30 | Mg | 50 | {100}, {100}>>{111} | - |
| MS-2 | 7.5 | 1800 | 30 | Mg99Si1 | 80 | {111}≈{100} | - |
| MS-3 | 7.5 | 1800 | 30 | Mg98Si2 | 100 | {111}>{100} | - |
| MS-4 | 7.5 | 1800 | 30 | Mg95Si5 | 90 | {111}>>{100} | - |
| MS-5 | 7.5 | 1800 | 30 | Mg90Si10 | 90 | {111}>>{100} | - |
| MS-6 | 7.5 | 1800 | 30 | Mg80Si20 | 100 | {111}>>{100} | 3C |
| MS-7 | 7.5 | 1800 | 30 | Mg70Si30 | 80 | {111} | 3C |
| MS-8 | 7.5 | 1800 | 30 | Mg50Si50 | 20 | {111} | 3C, 4H |
| MS-9 | 7.5 | 1800 | 30 | Mg25Si75 | 0 | - | 3C |
| MS-10 | 7.5 | 1800 | 30 | Si | 0 | - | 3C |
© 2017 by the authors. Licensee MDPI, Basel, Switzerland. This article is an open access article distributed under the terms and conditions of the Creative Commons Attribution (CC BY) license (http://creativecommons.org/licenses/by/4.0/).
Share and Cite
MDPI and ACS Style
Palyanov, Y.; Kupriyanov, I.; Borzdov, Y.; Nechaev, D.; Bataleva, Y. HPHT Diamond Crystallization in the Mg-Si-C System: Effect of Mg/Si Composition. Crystals 2017, 7, 119. https://doi.org/10.3390/cryst7050119
AMA Style
Palyanov Y, Kupriyanov I, Borzdov Y, Nechaev D, Bataleva Y. HPHT Diamond Crystallization in the Mg-Si-C System: Effect of Mg/Si Composition. Crystals. 2017; 7(5):119. https://doi.org/10.3390/cryst7050119
Chicago/Turabian StylePalyanov, Yuri, Igor Kupriyanov, Yuri Borzdov, Denis Nechaev, and Yuliya Bataleva. 2017. "HPHT Diamond Crystallization in the Mg-Si-C System: Effect of Mg/Si Composition" Crystals 7, no. 5: 119. https://doi.org/10.3390/cryst7050119
Note that from the first issue of 2016, this journal uses article numbers instead of page numbers. See further details here.