Article

A Diagram of the Structure Evolution of Pb(Zn1/3Nb2/3) O3-9%PbTiO3 Relaxor Ferroelectric Crystals with Excellent Piezoelectric Properties

1
College of Materials Science and Engineering and Shenzhen Key Laboratory of Special Functional Materials, Shenzhen University, Shenzhen 518060, China
2
College of Optoelectronic Engineering and Key Laboratory of Optoelectronic Devices and Systems of Ministry of Education and Guangdong Province, Shenzhen University, Shenzhen 518060, China
3
Department of Applied Physics and Materials Research Centre, The Hong Kong Polytechnic University, Hung Hom, Kowloon, Hong Kong
4
Center for Excellence in Superconducting Electronics, Shanghai Institute of Microsystem and Information Technology, Chinese Academy of Sciences, 865 Changning Road, Shanghai 200050, China
*
Author to whom correspondence should be addressed.
Crystals 2017, 7(5), 130; https://doi.org/10.3390/cryst7050130
Submission received: 27 March 2017 / Revised: 30 April 2017 / Accepted: 1 May 2017 / Published: 8 May 2017
(This article belongs to the Special Issue Crystal Structure of Electroceramics)

Abstract

:
Piezoelectric properties are of significant importance to medical ultrasound, actuators, sensors, and countless other device applications. The mechanism of piezoelectric properties can be deeply understood in light of structure evolutions. In this paper, we report a diagram of the structure evolutions of Pb(Zn1/3Nb2/3)0.91Ti0.09O3 (PZN-9PT) crystals with excellent piezoelectric properties among orthorhombic, tetragonal, and cubic phases, with a temperature increasing from room temperature to 220 °C. Through fitting the temperature-dependent XRD curves with Gauss and Lorenz functions, we obtained the evolutions of the content ratio of three kinds of phases (orthorhombic, tetragonal and cubic) and the lattice parameters of the PZN-9PT system with the changes of temperature. The XRD fitting results together with Raman and dielectric spectra show that the phase transitions of PZN-9PT are a typical continuous evolution process. Additionally, resonance and anti-resonance spectra show the excellent piezoelectric properties of these crystals, which probably originate from the nano twin domains, as demonstrated by TEM images. Of particular attention is that the thickness electromechanical coupling factor kt is up to 72%.

1. Introduction

Since Kuwata et al. [1] first reported that the solid solutions of rhombohedral lead zinc niobate, Pb(Zn1/3Nb2/3)O3 (PZN), and tetragonal lead titanate, PbTiO3 (PT), have a morphotropic phase boundary (MPB) near 9 mol % PT, PZN-PT has attracted much exclusive attention due to its excellent and unique properties. Recently, Zhang et al. and Sun et al. [2,3,4] demonstrated that the Pb(Zn1/3Nb2/3)0.91Ti0.09O3 (PZN-9PT) crystal exhibits an exceptionally large piezoelectric constant (d33 > 2000 pC/N) and an electromechanical coupling factor in longitudinal bar mode (k33 > 92%). These properties are expected to be applied in high-quality piezoelectric devices, such as medical ultrasonic transducers, actuators, and sonars, as replacements for conventional PZT ceramics [4,5,6,7]. In the PZN-9PT crystal system, different from the normal ferroelectric (e.g., PT) [8] with a long coherent length of order, the random distribution of B-ions (here, B represents Zn, Nb, and Ti atoms) prevents the formation of the long-range ferroelectric order [8,9]. Additionally, the charge and ionic radius differences are of great importance for the relaxor ferroelectric (RFE) properties, because they directly determine the degree of order in the B-ion sublattice and thus the coherence length of order [10,11]. Consequently, the phase diagram of the Pb(B′B″)O3-PbTiO3 systems are often more complex than the normal ferroelectrics. Through the X-ray diffraction (XRD), neutron diffraction, Raman spectrum, etc., many researchers have reported the evolution diagram of the (1-x)PZN-xPT phase transition with changes in x and temperature [12,13,14,15]. In spite of these intensive studies, their microscopic mechanisms, such as the ferroelectric phase transition in relaxor ferroelectrics, remain poorly understood. Moreover, the ratios among the different phases as the change of the system temperature always seem to be ignored by researchers, which should play an important role in understanding the phase transition mechanism.
In order to reveal the evolutions of the phase structure driven by the temperature, we have successfully grown PZN-9PT single crystals via controlled top-seeded solution growth (TSSG). Of particular importance is that the TSSG technique offers advantages in growing single crystals of good quality, low compositional segregation, and controllable morphology. A structure phase transition was observed by the in-situ variable temperature XRD, dielectric spectrum, and Raman spectra. The resonance and anti-resonance spectrum showed that the PZN-9PT crystal exhibits an excellent piezoelectric response, which probably originates from the nano twin structures in the PZN-9PT single crystal, as demonstrated by transmission electron microscopy (TEM).

2. Results and Discussion

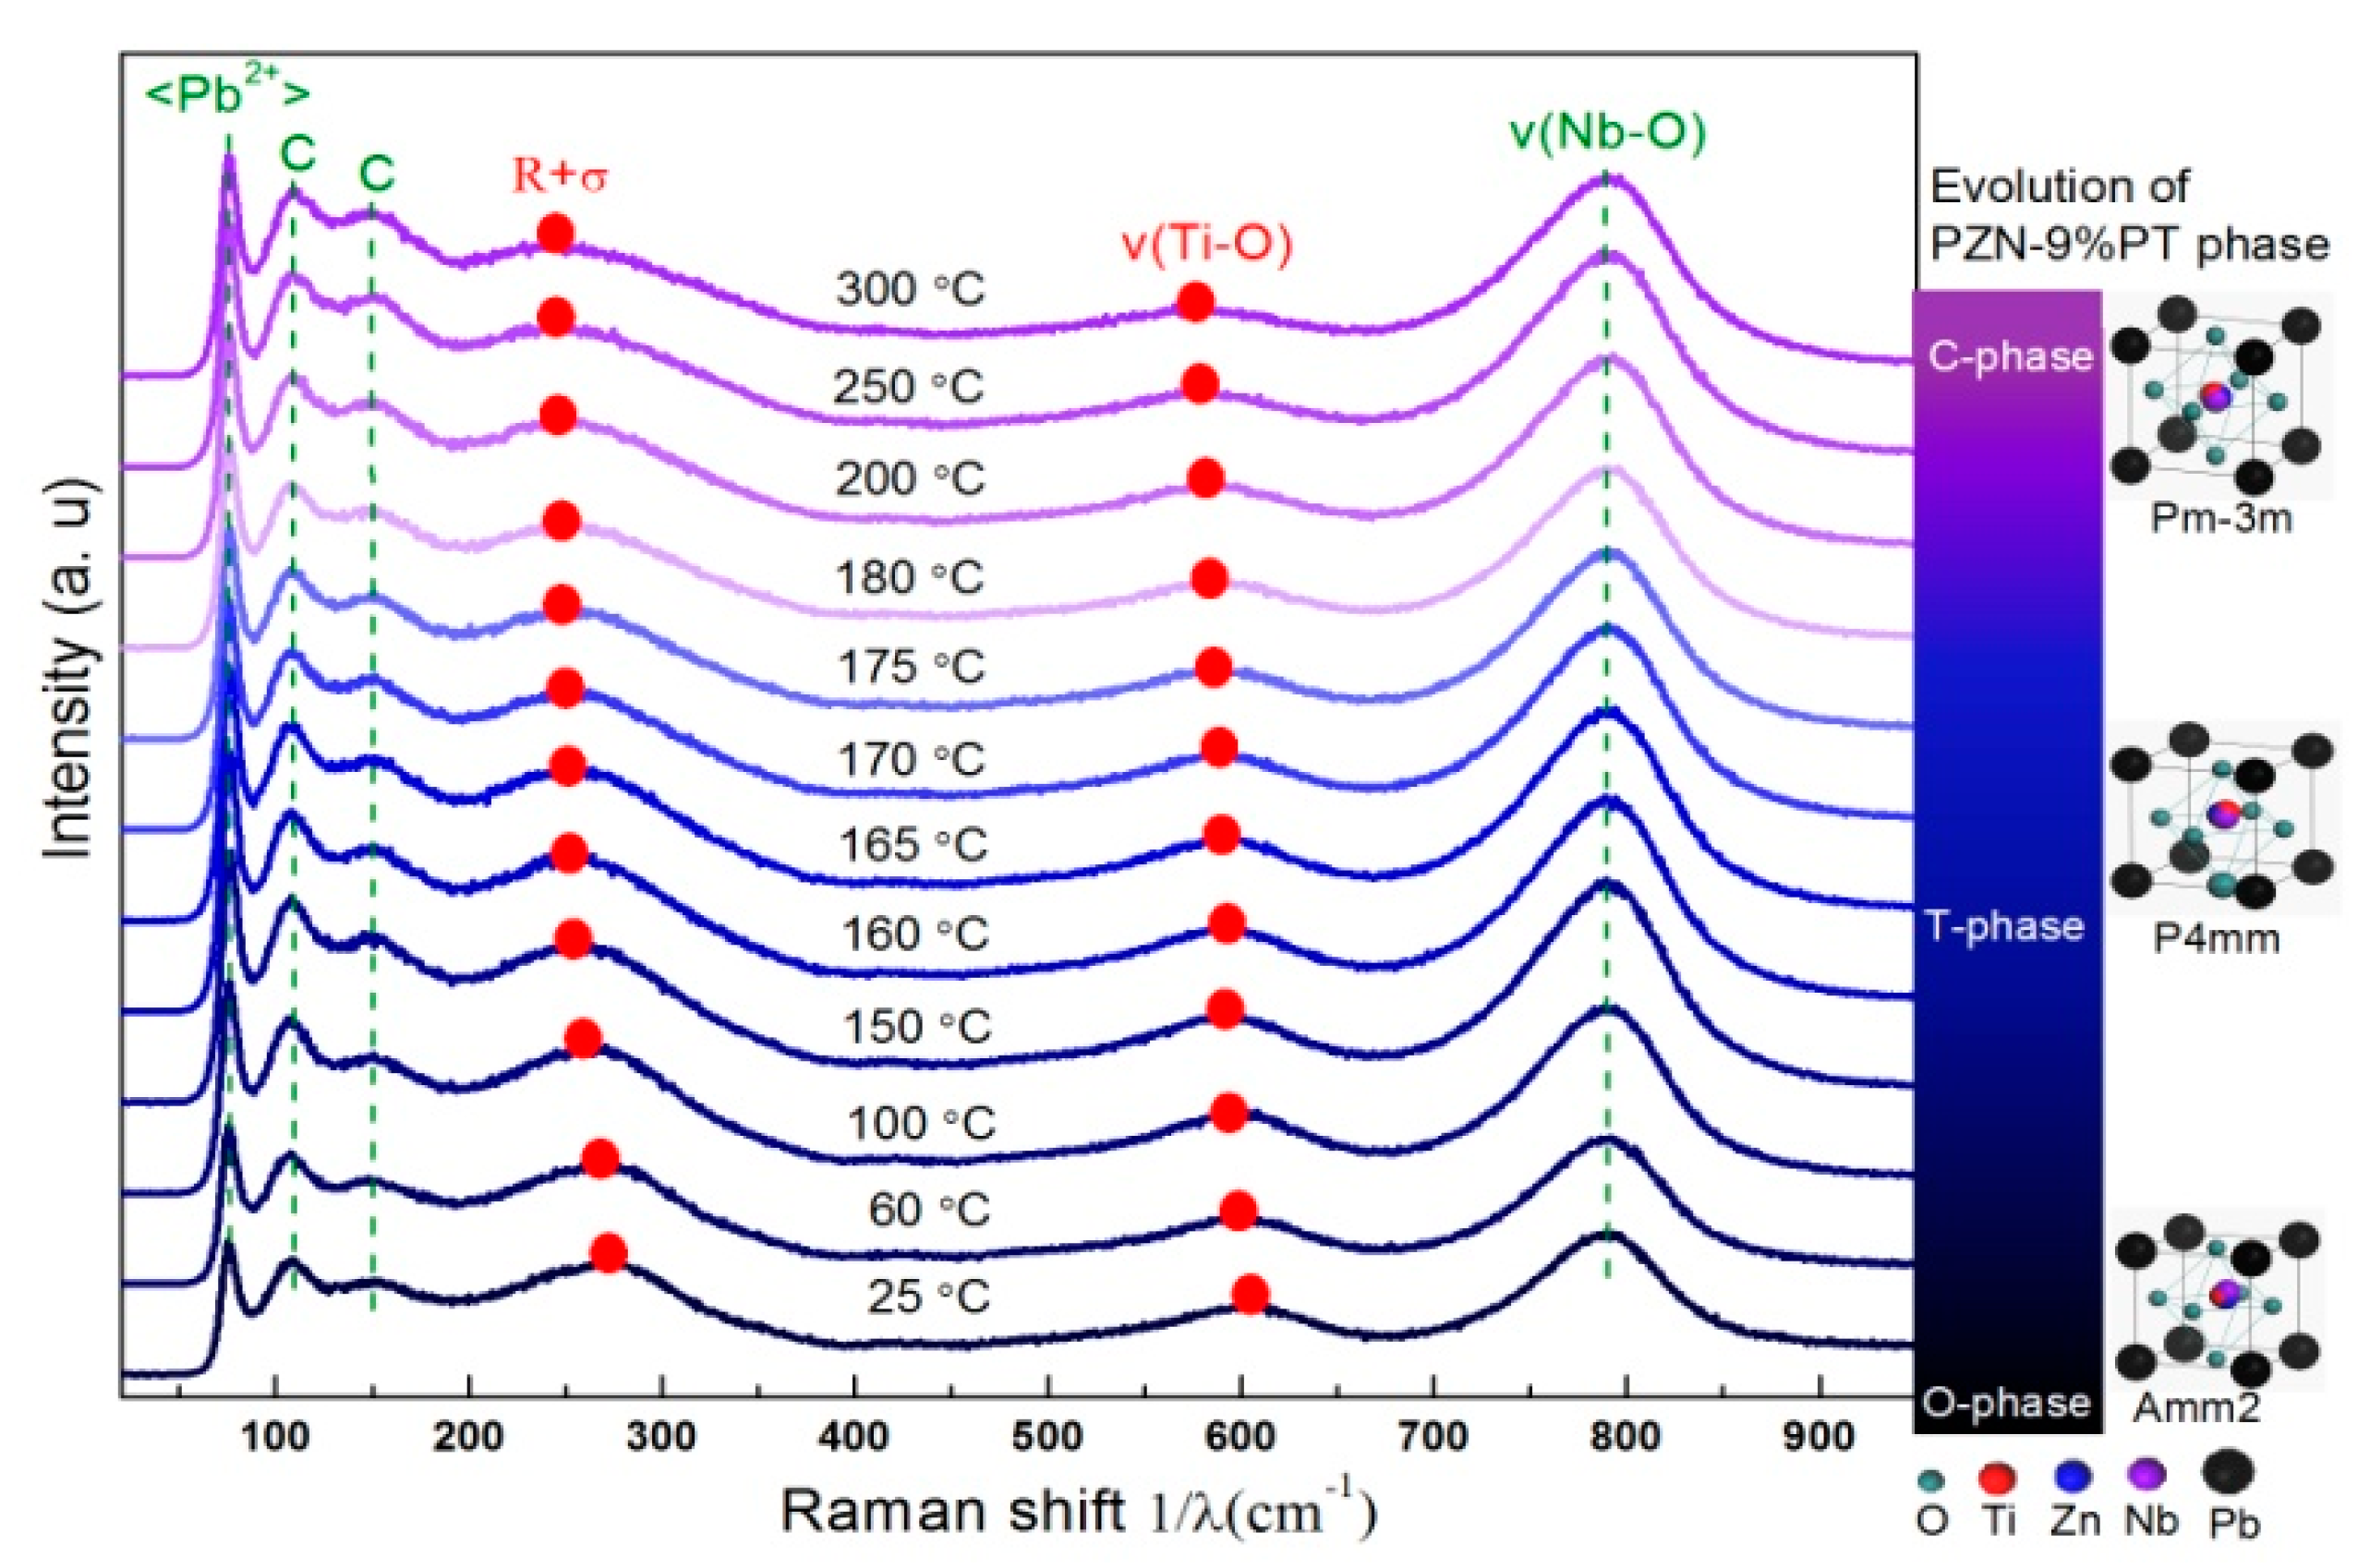
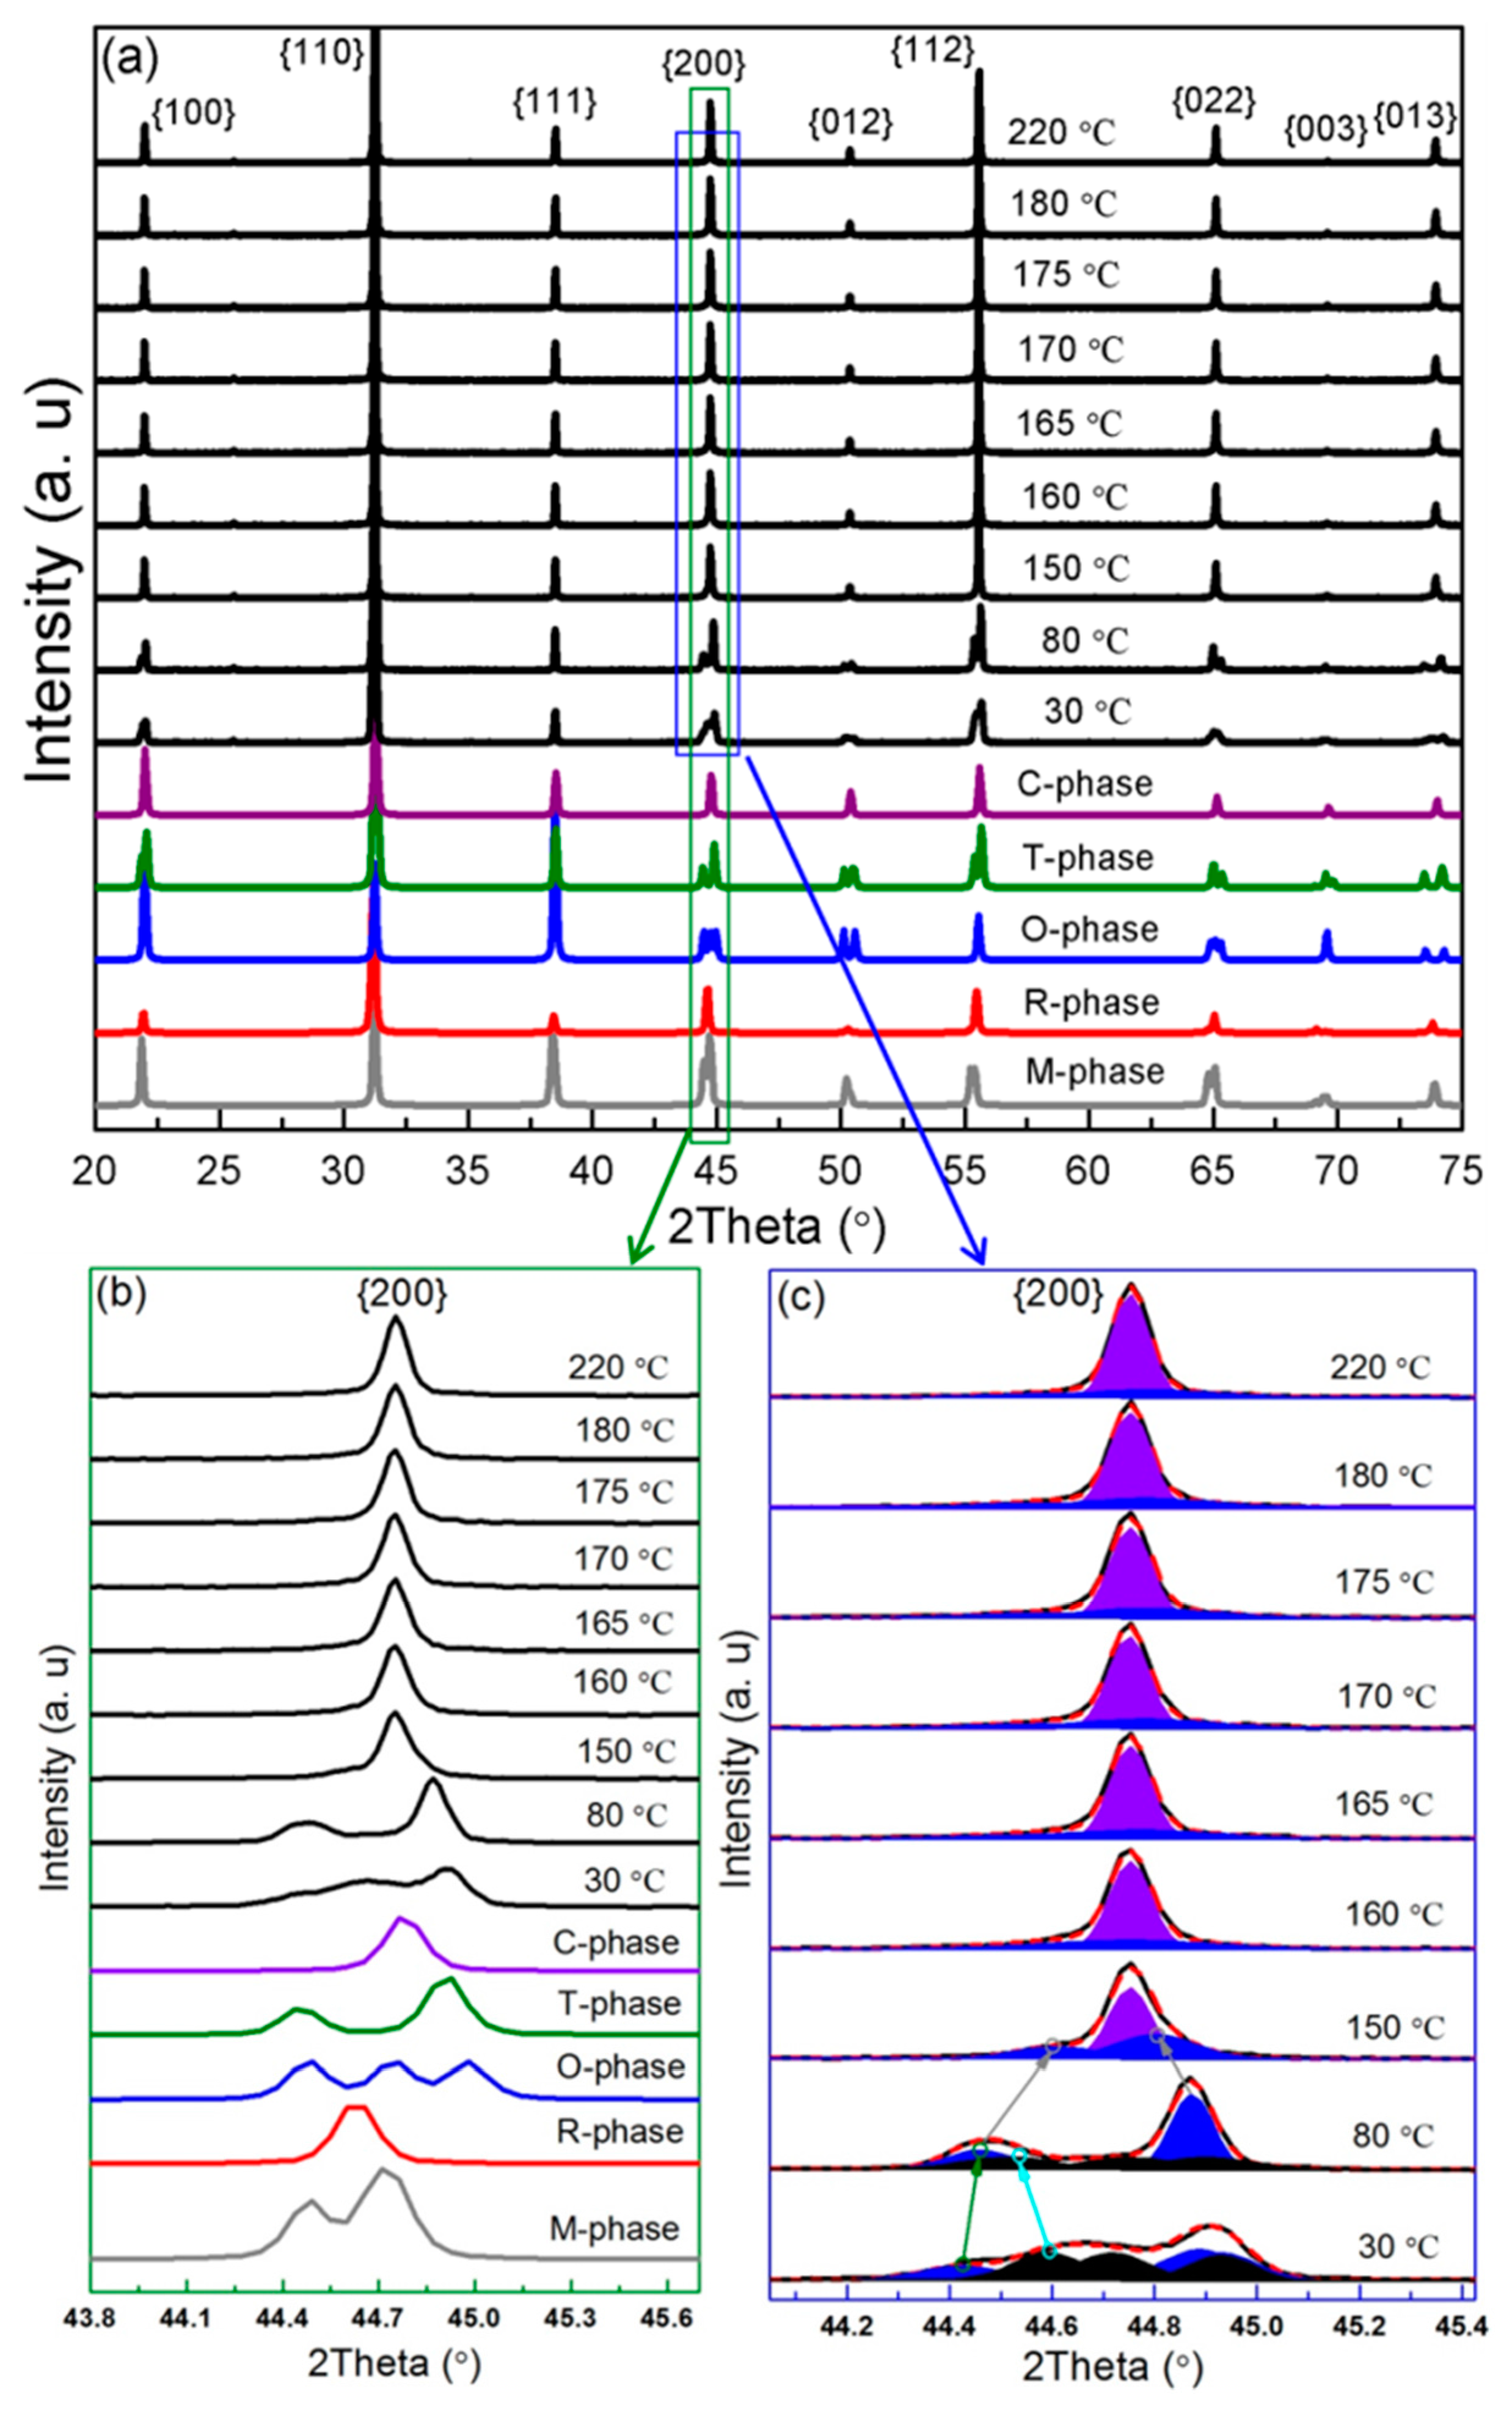
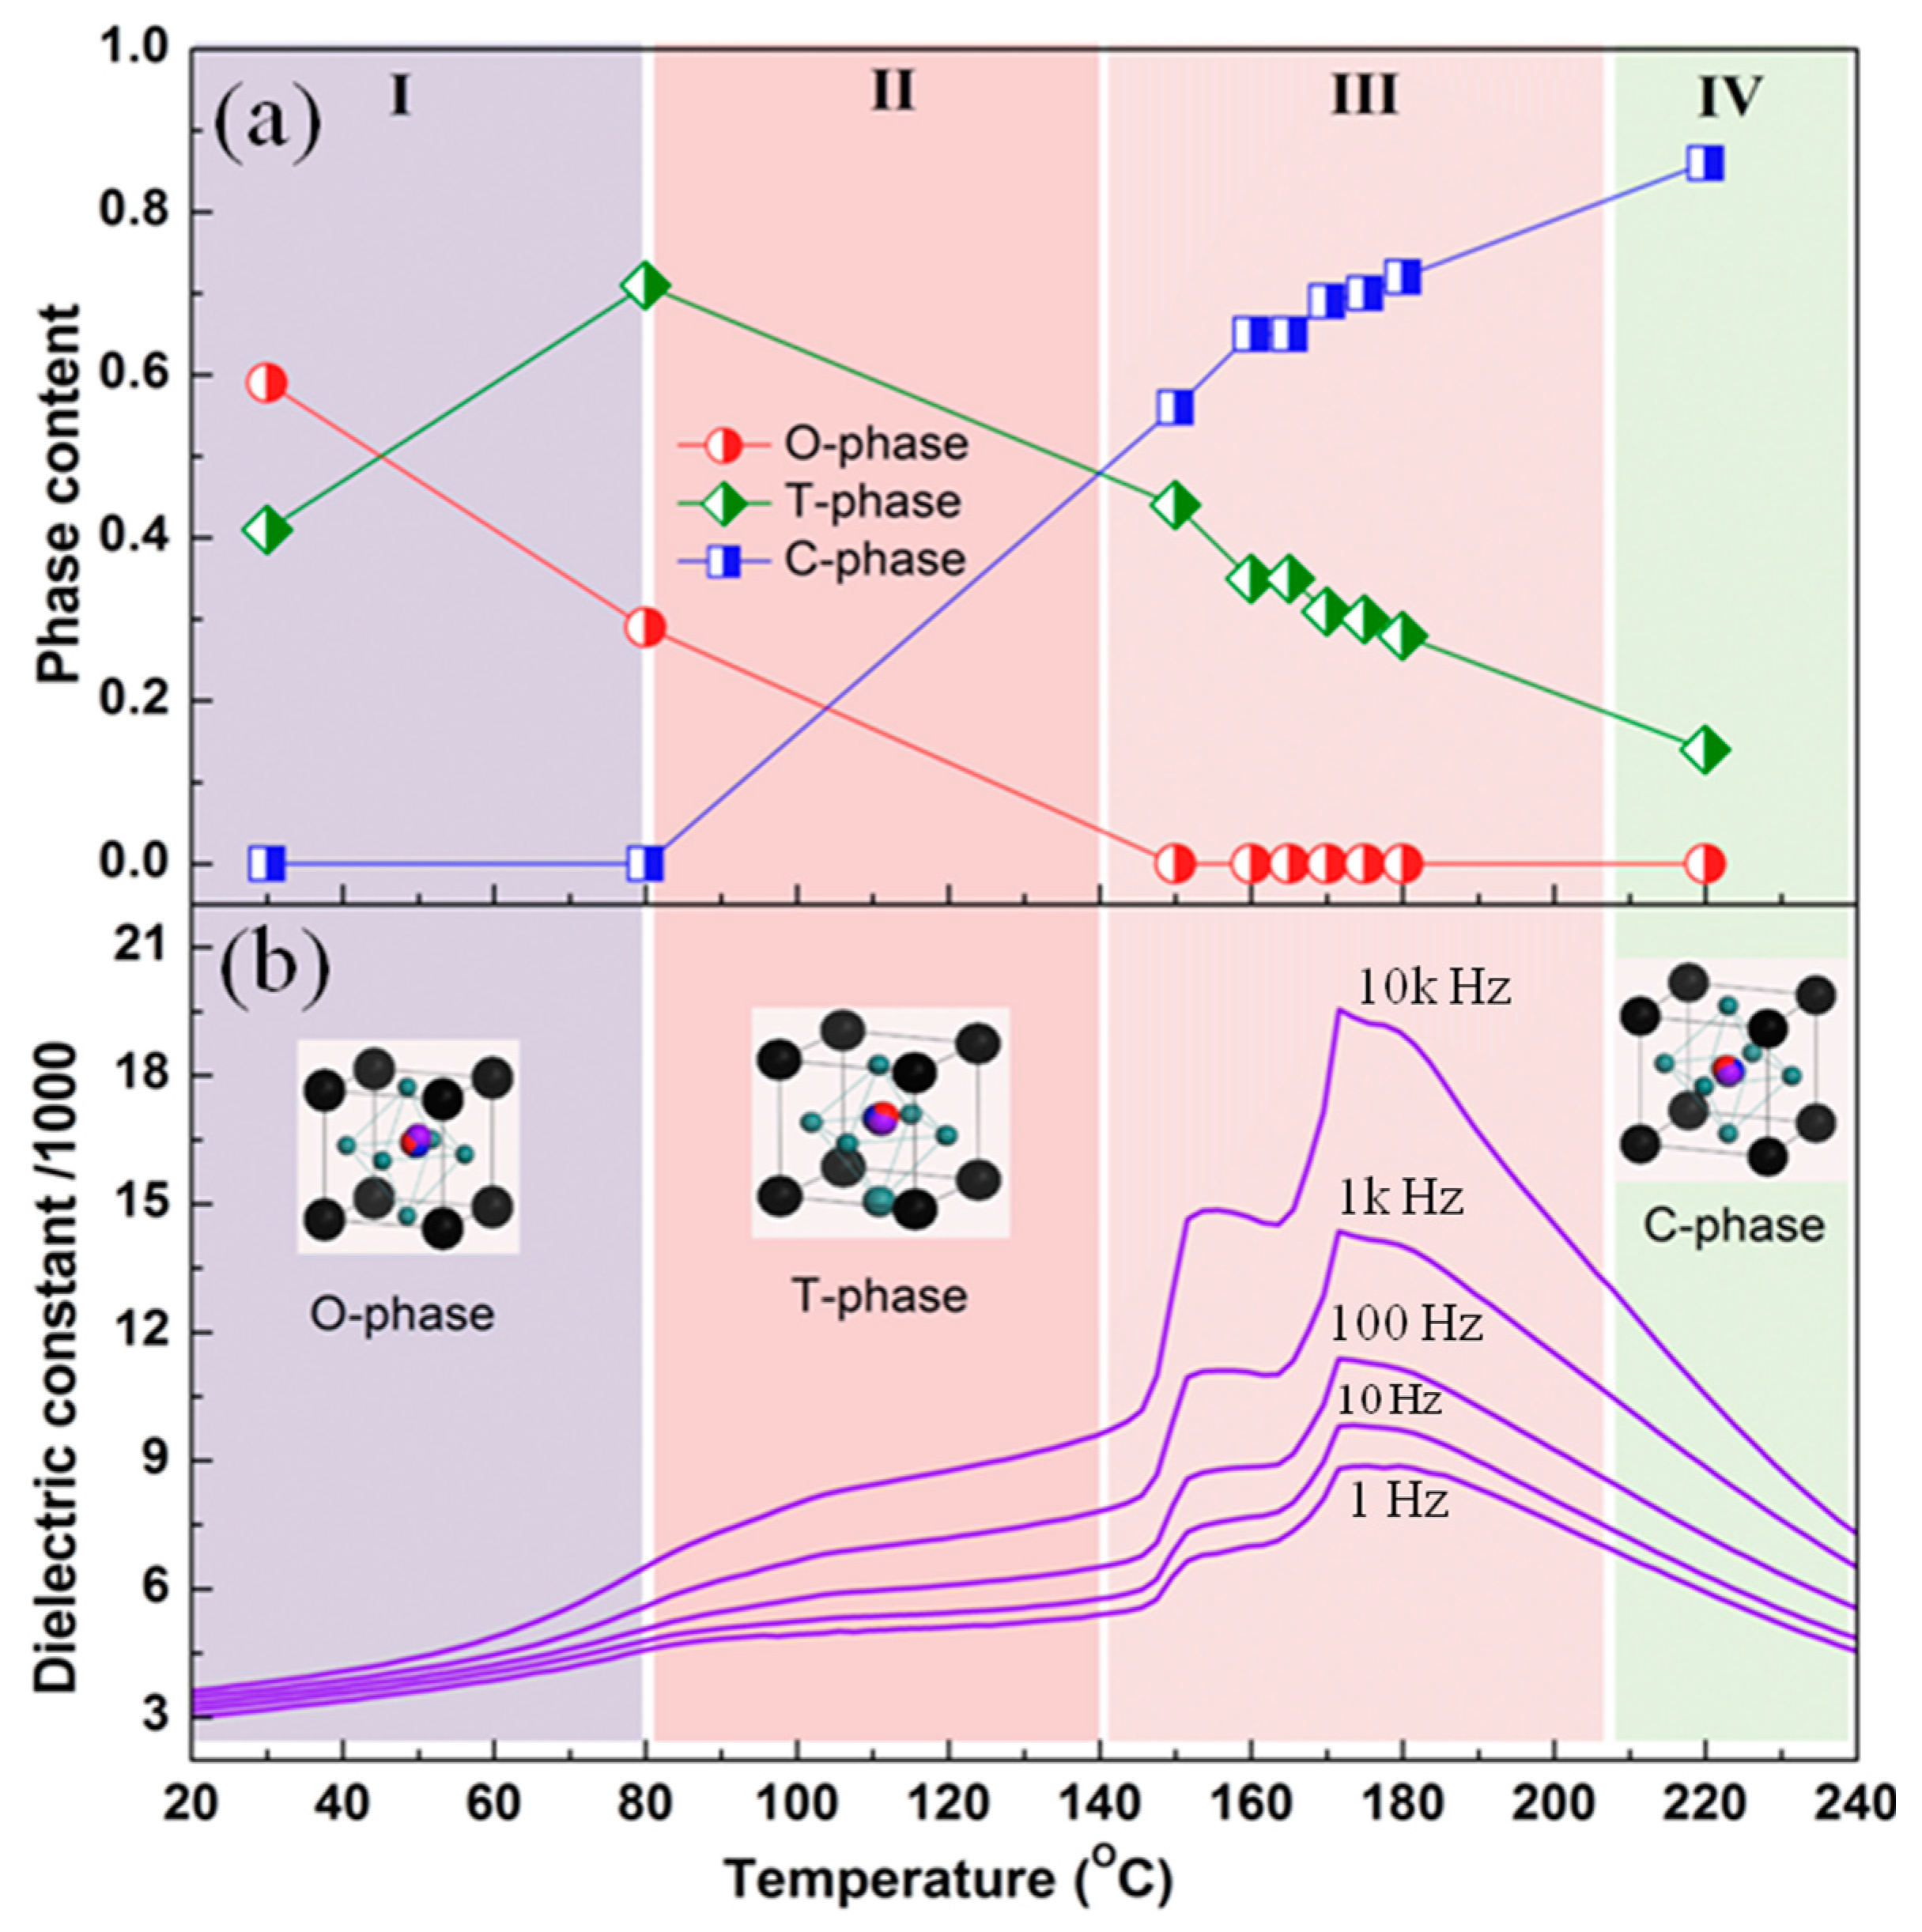
2.1. Structure Phase Transition of PZN-9PT Crystals

It is universally acknowledged that PZN-9PT single crystals have five structure phases: monoclinic (MC), rhombohedral (R), orthorhombic (O), tetragonal (T), and cubic (C), corresponding to their space groups: Pm C, R3m, Amm2, P4mm, and Pm-3m, respectively. PZN-9PT single crystals often possess the coexistent phase structures at room temperature. Ye et al. [16] and Chang et al. [17] reported the coexistence of R-phase and T-phase in PZN-9PT single crystals at room temperature. Later, Cox et al. [11,12] argued that the room temperature structure of PZN-9PT should be O-phase coexisting with T-phase. Generally speaking, for R-phase, the lattice parameters a = b = c, α = β = γ ≠ 90° (but nearly equal to 90° for PZN-9PT system), and for O-phase, a ≠ b ≠ c, α = β = γ = 90°. Based on these characteristics, we can distinguish the co-phase structures according to the XRD peak numbers of the {200} lattice plane. Figure 1a presents the survey of the variable-temperature XRD patterns of the powders made from the PZN-9PT relaxor ferroelectric single crystals. According to the changes of the XRD patterns of the PZN-9PT lattice planes: {100}, {110}, {200}, {112}, {220}, etc., it is inferred that structure phase transitions occur at about 80 °C and 150 °C for the powders of PZN-9PT. The color curve lines in Figure 1a, acquired using Poudrix software, show the calculated XRD patterns for the pure phases of PZN-9PT powders. The {002} plane families for the pure R-phase and the O-phase display one peak and three peaks, respectively, as shown in Figure 1b. The peak number of the experimental {200} result at room temperature is more than 3, indicating that PZN-9PT is not a pure O-phase at room temperature. Comparing the simulated results (shown by color lines in Figure 1a,b), it is speculated that the phase of single crystal PZN-9PT should be composed of O- and T-phases. This observation is well consistent with reports by Uesu et al. [18]. In addition, when the temperature rises to 150 °C or above, the peaks of {200} seem to merge into a single one, indicating the phase evolution from tetragonal/orthorhombic to cubic, as illustrated by the changes of blue and violet areas.
According to the above discussions, it could be concluded that the O-phase and T-phase coexist in PZN-9PT at room temperature. When the temperature increases, O-phase transforms into T-phase firstly, and then transforms into C-phase gradually. In order to provide more detailed information of the phase transition processes, the Gauss and Lorenz functions (8:2) were used to fit the XRD data. Theoretically, for a pure orthorhombic structure, the areas of the three {200} peaks are equal as well as the full width at half maximum (FWHM). However, for a pure tetragonal structure with two {002} peaks, one peak area is twice as large as the other, while the FWHM is equal. The fitting parameters can then be set according to these quantitative relationships. The red dashed lines in Figure 1c show the fitting results, where the areas of the orthorhombic, tetragonal, and cubic phases are also illustrated. It is clear that the dominant phase at room temperature is the O-phase, as shown by the black areas in Figure 1c. The peak of the O-phase at 44.6° shifts to a lower angle with increasing temperatures, which implies that the c-axis becomes longer when the phase transits from orthorhombic to tetragonal phase. Moreover, the two {200} peaks of the T-phase tend to merge into a middle angle (shown by gray arrows in Figure 1c) with increasing temperatures, suggesting a shortened c-axis and larger a- and b-axes.
Based on the fitting data, the phase contents of PZN-9PT at different temperatures could be obtained and illustrated in Figure 2a. Four easily distinguishable regions can be identified as follows: Region I (O- and T-phases coexistence), Region II (T-phase dominant), Region III (T- and C-phases coexistence), and Region IV (C-phase dominant). It can be seen that the content of O-phase decreases with increasing temperature in Regions I and II, and subsequently becomes nearly zero in Regions III and IV; T-phase increases in Region I and then decreases gradually in the other regions. From the discussions above, one can conclude that the phase transition in PZN-9PT is a gradual evolution rather than a mutational change with increasing temperature. Due to the changes of phases, the dielectric properties of PZN-9PT display a temperature-dependent behavior accordingly, as shown in Figure 2b. Dielectric curves reveal only a weak frequency dispersion in Region I, while a strong dispersion could be observed with the coexistence of T- and C-phases. It is well known that the relaxor ferroelectrics are characterized by a broad frequency-dependent dielectric peak at radio frequencies, which is associated with the dimensional changes of polar nanoregions (PNRs). By combining 9% ferroelectric PT with PZN relaxors, the structure evolution becomes quite complicated. Upon cooling, some of the C-phase transforms into the T-phase and PNRs then occur in the crystal. In Region III, the C-phase is the dominant phase and PNRs grow in size, leading to a strong frequency dispersion of dielectric curves. The peak-like behaviors in Region III could be attributed to the configuration change of PNRs and/or microdomains. Moreover, in Region II, ferroelectric T-phase constitutes a majority and PNRs/microdomains grow into macrodomains, which is less sensitive to radio frequencies.
Further evidence for the evolution of the phase structures in PZN-9PT can be found from the Raman spectra, which is very sensitive to the change in the structure, symmetry, and short-range order at nanoscale. As shown in Figure 3, six robust active modes could be observed, labeled as <Pb2+>, C, σ and R, <Ti–O>, and <Nb–O>, respectively. These modes originate from the vibrations of the Pb2+ cation, coupling between Pb2+ and the neighboring entities, B–O bending and ion-covalent BO6 vibration (B/Ti and Nb), stretching TiO6 and NbO6 modes, respectively. One can see that the σ, R, and <Ti–O> modes reveal a blue shift as well as a decrement of the peak intensity with increasing temperatures. These results are well consistent with the observations reported by Mishra et al. [19] and Cheng et al. [20]. The gradual shift of these modes also implies that the structure evolution of PZN-9PT is continuous rather than mutational, in agreement with the XRD results.

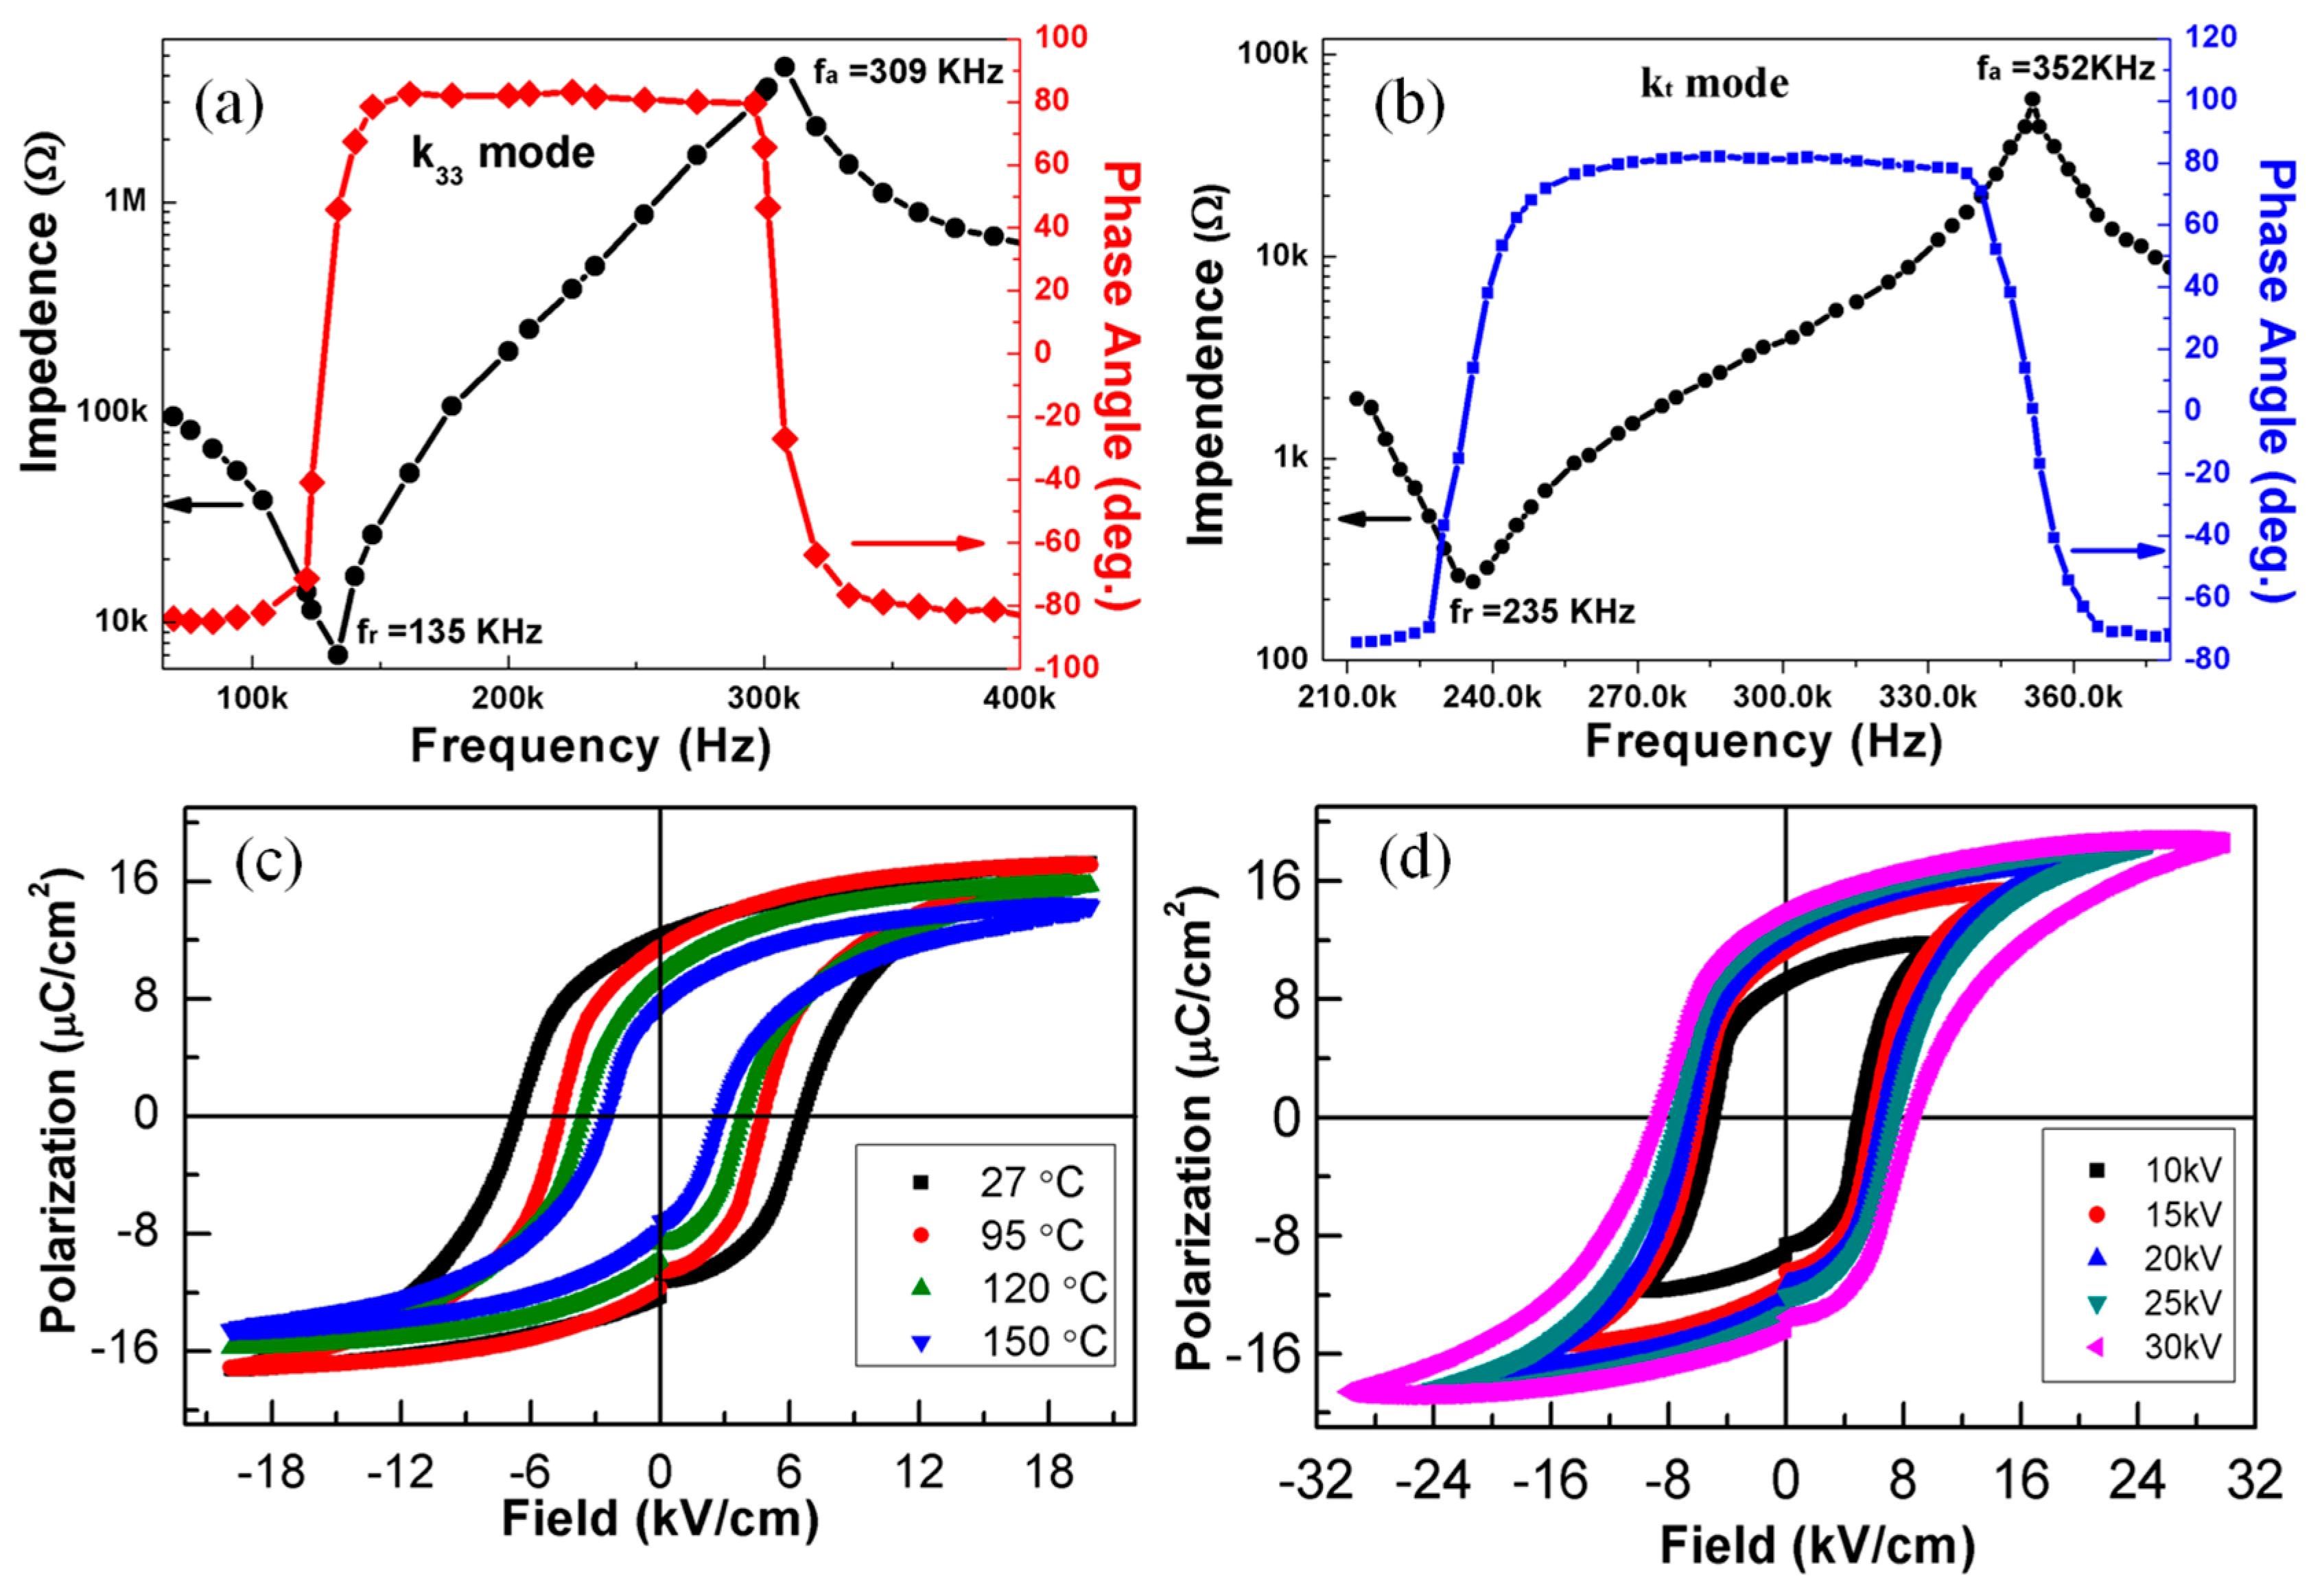
2.2. Piezoelectric Properties of PZN-9PT Crystals

On account of the multi-phase coexistence, PZN-9PT possesses excellent piezoelectric, electromechanical, and ferroelectric properties. Figure 4a,b display the longitudinal mode impedance and phase angle, and the corresponding thickness mode impedance and phase angle at room temperature, respectively. Based on the resonance frequency (fr) and anti-resonance frequency (fa), the longitudinal (k33) and thickness (kt) electromechanical coupling factors are calculated to be 92% and 72%, respectively, by the following equations [21,22]:
k 33 2 = f r f a cot ( π 2 f r f a )
and
k t 2 = π 2 f r f a tan ( π 2 f a f r f a ) .
These results indicate that the PZN-9PT single crystals exhibit high electromechanical coupling properties. It is also worth noting that the kt of TSSG-growth PZN-9PT is substantially superior to the modified Bridgman method [23]. The piezoelectric coefficient d33 is measured to be 2350 pC/N by a d33 meter. According to the resonance measurement, the d33 can be calculated to be 2240 pC/N which is slightly lower than the directly measured value.
The polarization-electric field (PE) hysteresis loops of the PZN-9PT crystal were measured as a function of electric field and temperature at 2 Hz, which is shown in Figure 4c. It can be seen that the coercive field Ec decreases with the increase in temperature, but the statured remnant polarization Pr reaches at a maximum at TO-T firstly and then decreases (Figure 4c), which results from the flexibility enhancement of domain switching and moving near the TO-T. The statured remnant polarization Pr reaches 20 μС/cm2, with a coercive electric field Ec = 9 kV/cm at room temperature (Figure 4d). This evolution between Pr and temperature indicate that the piezoelectric properties gradually become weak with the phase transition from the O-phase to the T-phase and to the C-phase. It is worth noting that the coercive field Ec of PZN-9PT single crystal is about 2~3 times larger than that of PMN–33 mol % PT, manifesting a more stable domain state in PZN–PT single crystals.

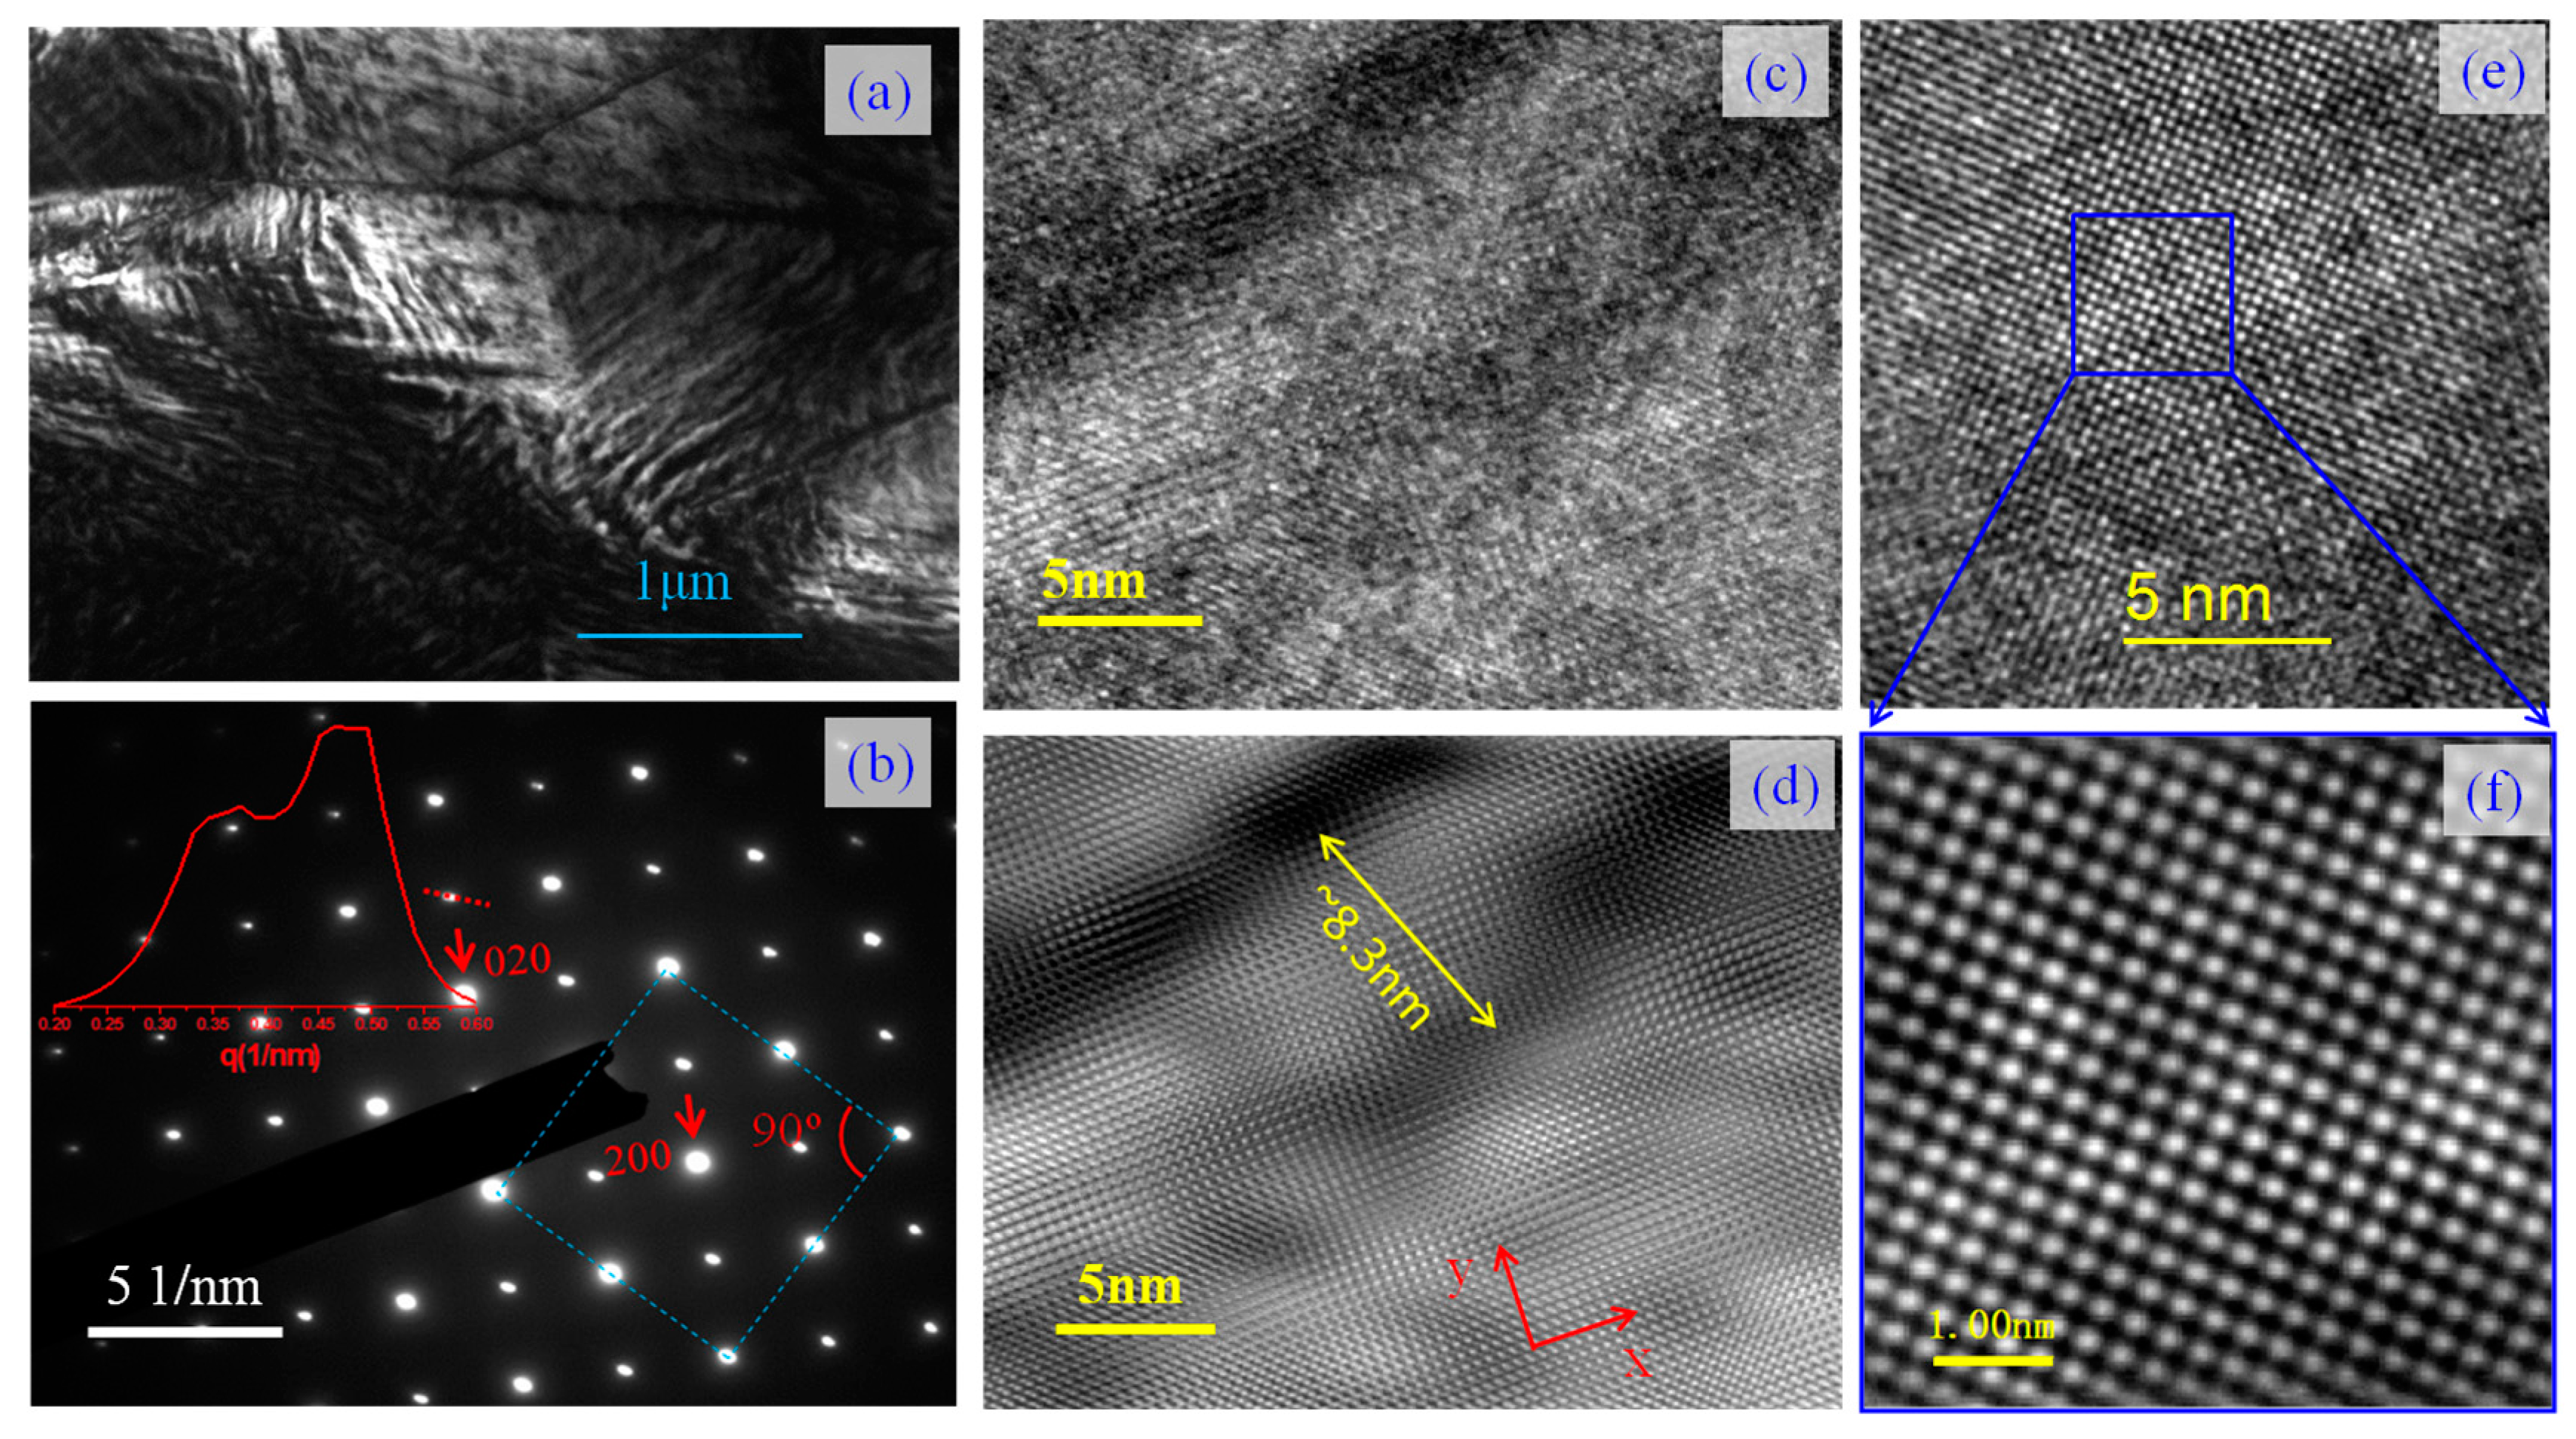
2.3. Nano Twin Domains of PZN-9PT Crystals

One probable explanation for the excellent properties of PZN–PT is the adaptive phase model based on nanoscale twinned O and T domains [24], which is evidenced in this work. The dark field TEM image (Figure 5a) shows a large number of domain-like bend striations in the order of several tens of angstrom units wide, indicating a typical relaxor domain structure. Similar domain striations were previously reported by Xu et al. [25] in the compositions near the MPB of PMN-xPT and were designated as tweed-like structures. The selected area electronic diffraction (SAED) pattern captured along the pseudocubic [001] zone axis (Figure 5b) shows that the 220 and 2-20 reflections are perpendicular to each other strictly, as illustrated by the blue dashed square. This result implies that the phase of as-grown PZN-9PT belongs neither to a monoclinic nor to a rhombohedral structure, well consistent with the XRD results. Additionally, the single crystals of PZN-9PT exhibit twin structures, as suggested by the red curve line in the upper left of Figure 5b from the profile line of the emission diffraction spot (as marked by the red dashed line in Figure 5b). This result can be further confirmed by the high resolution TEM (HRTEM) images, as shown in Figure 5d, corresponding to the inverse Fast Fourier Transformation (FFT) image from Figure 5c. The average domain size has been estimated to be about 8.3 nm in width, as labeled by the yellow double arrow in Figure 5d. Probably, the twin structures induce the crystal of PZN-9PT to exhibit the outstanding piezoelectric properties, as demonstrated in Figure 4. Moreover, from the inverse FFT image (Figure 5f) of the blue rectangle area in Figure 5e, we can calculate the lattice parameters of a and b for the PZN-9PT crystals to be about 4.05 Å and 4.03 Å, respectively, which are well consistent with the XRD results (O-phase: a = 4.031 Å, b = 4.05 Å; T-phase: a = b = 4.036 Å). Based on above observations, the correlation between the structure evolution and domain configuration reveals something interesting and important for understanding the origin of the giant piezoelectric response in PZN-PT. The continuous behavior of the phase evolution implies that PZN-9PT is in an instable regime, which may be the key factor responsible for its ultrahigh piezoelectric coefficient. Temperature-dependent TEM and/or in-situ synchrotron white-beam X-ray microdiffraction analyses [26] should be conducted in the future to establish possible correlations. It can be reliably speculated that the coexistence of the T-phase and O-phase results in large amounts of nanoscale twin domains, while the coexistence of the T-phase and the C-phase lead to nanoscale domains (including nano twin domains) and PNRs at around phase transition points and thus is responsible for the diffuse dielectric peaks.

3. Materials and Methods

3.1. Fabrication of PZN-9PT Single Crystal

The PZN-9PT single crystals were grown with a top-seeded solution. The start materials, PbO (99.9%), TiO2 (99.9%), ZnO (99.9%), and Nb2O5 (99.9%), were mixed according to the designed composition of PZN-9PT. Here, 10% of ZnO in excess of the stoichiometric ratio mole was added in the mixture to suppress the pyrochlore phase and decrease segregation simultaneously. The mixture of PbO and H3BO3 (99.9%) was used as a flux. The growing process was similar to the ones described in [27,28]. The weighed chemicals were thoroughly mixed and loaded into a platinum crucible with a size of Φ 40 × 50 mm2, which were then placed into a vertical tube furnace equipped with an automatic temperature controller to melt. The furnace was heated from room temperature to 1050 °C at a rate of 100 °C/h, held for 20 h, then slowly cooled from 1050 to 970 °C at a rate of 5 °C/h, and then from 940 to 900 °C at a rate of 0.5 °C/h. At the end of the slow cooling process, the as-grown crystal was pulled out of the melt and then annealed to room temperature at a rate of 20 °С/h.

3.2. Characterization Procedure

Firstly, the crystal component was analyzed by inductively coupled plasma optical emission spectrometry (ICP-OES). Then, in situ high-temperature XRD data were collected using the D8 Advance (Bruker, Karlsruhe, Germany) high temperature-diffractometer equipped with Cu Ka radiation and a graphite monochromator. The scan step is of 0.02° (2θ) with an angular range of 10°–70°. The as-grown single crystals were sliced into plates and bars along the [001] direction with different dimensions for the electric measurements. A sample with dimensions of 4L × 4W × 0.5T mm3 was used for dielectric and piezoelectric measurements, and another sample with dimensions of 3.5L × 2.5W × 0.6T mm3 for ferroelectric measurements. For resonance and anti-resonance measurements, a sample with dimensions of 0.9L × 0.9W × 3.12T mm3 was prepared. All the samples were polished and coated with silver paste as electrodes. The dielectric properties were measured using a computer-controlled Alpha-A broadband dielectric/impedance spectrometer (Novocontrol GmbH, Montabaur, Germany), with an AC signal of 0.3 V (peak-to-peak) applied. Measurements were carried out from −30 to 300 °C with a step of 2 °C. The same setup was used to measure the resonance frequency (fr) and anti-resonance frequency (fa) of a bar sample. Poling was performed by applying a DC electric field of 15 kV/cm along the [001] direction of the crystal at 120 °C for 15 min, and then by keeping the electric field on while cooling down to room temperature. The piezoelectric coefficient was measured using a quasi-static d33 meter (Institute of Acoustics, Chinese Academy of Sciences, model ZJ-4AN, Beijing, China). The polarization-electric field (PE) hysteresis loop was tested using an aix-ACCT TF2000 analyzer. The microstructure of the crystal sample was studied by TEM (JEOL, JEM-2100F, Tokyo, Japan). The out-of-plane feature of the ferroelectric domains was investigated by a piezoelectric force microscope (Asylum Research, Oxford, UK).

4. Conclusions

To sum up, the evolution of phase transition of the relaxor ferroelectric PZN-9PT from the orthorhombic to cubic structure is a continuous process rather than a sharp process, as demonstrated by the variable XRD and Raman spectra. This phenomenon is very similar to the phase transition of paraffin from solid to liquid. Resonance and anti-resonance spectra show that the PZN-9PT single crystals exhibit excellent piezoelectric properties, which probably originates from their twin structures, as demonstrated by TEM.

Acknowledgments

This work was supported by the Chinese Postdoctoral Science Foundation (No. 2015M572356), the National Natural Science Foundation of China (Nos. 11604214, 11604140 and 21405106), the Hong Kong, Macao and Taiwan Science & Technology Cooperation Program of China (No. 2015DFH10200), and the Science and Technology Research Items of Shenzhen (No. JCYJ20160422102802301 & KQJSCX20160226195624).

Author Contributions

Hua Zhou and Shanming Ke conceived the idea and designed the experiments; Tao Li prepared the PZN-PT single crystals; Hua Zhou, Nian Zhang, Manfang Mai, Peng Lin and Chuanwei Huang performed the experiments; Xierong Zeng, Haitao Huang, Mao Ye and Shanming Ke analyzed the data and wrote the paper; Haitao Huang, Manfang Mai and Shanming Ke revised the paper. All authors discussed the results and have given approval to the final version of the manuscript.

Conflicts of Interest

The authors declare no conflict of interest.

References

  1. Kuwata, J.; Uchino, K.; Nomura, S. Dielectric and piezoelectric properties of 0.91Pb(Zn1/3Nb2/3)O3-0.09PbTiO3 single crystals. Jpn. J. Appl. Phys. 1982, 21, 1298–1302. [Google Scholar] [CrossRef]
  2. Zhang, S.J.; Li, F.; Jiang, X.N.; Kim, J.; Luo, J.; Geng, X.C. Advantages and challenges of relaxor-PbTiO3 ferroelectric crystals for electroacoustic transducers—A review. Prog. Mater. Sci. 2015, 68, 1–66. [Google Scholar] [CrossRef] [PubMed]
  3. Sun, E.W.; Cao, W.W. Relaxor-based ferroelectric single crystals: Growth, domain engineering, characterization and applications. Prog. Mater. Sci. 2014, 65, 124–210. [Google Scholar] [CrossRef] [PubMed]
  4. Zhang, S.J.; Li, F.J. High performance ferroelectric relaxor-PbTiO3 single crystals: Status and perspective. J. Appl. Phys. 2012, 111, 031301. [Google Scholar] [CrossRef]
  5. Zhang, S.J.; Xia, R.; Lebrun, L.; Anderson, D.; Shrout, T.R. Piezoelectric materials for high power, high temperature applications. Mater. Lett. 2005, 59, 3471–3475. [Google Scholar] [CrossRef]
  6. Li, T.; Li, X.Z.; Guo, D.; Wang, Z.J.; Liu, Y.; He, C.; Chu, T.; Ai, L.D.; Pang, D.F.; Long, X.F. Phase diagram and properties of high TC/TR−TPb(In1/2Nb1/2)O3-Pb(Zn1/3Nb2/3)O3-PbTiO3 ferroelectric ceramics. J. Am. Ceram. Soc. 2013, 96, 1546–1553. [Google Scholar] [CrossRef]
  7. Haertling, G.H. Ferroelectric ceramics: history and technology. J. Am. Ceram. Soc. 1999, 82, 797–818. [Google Scholar] [CrossRef]
  8. Samara, G.A. The relaxational properties of compositionally disordered ABO3 perovskites. J. Phys. Condens. Matter 2003, 15, R367–R411. [Google Scholar] [CrossRef]
  9. Ye, Z.-G. Crystal chemistry and domain structure of relaxor piezocrystals. Curr. Opin. Solid State Mater. 2002, 6, 35–44. [Google Scholar] [CrossRef]
  10. Ye, Z.G. Relaxor ferroelectric complex pervoskites: Structure, properties and phase transitions. Key Eng. Mater. 1998, 155, 81–122. [Google Scholar] [CrossRef]
  11. Janga, H.M.; Kim, S.C. Pb(B′1/2B″1/2)O3-type perovskites: Part І. Pair-correlation theory of order-disorder phase transition. J. Mater. Res. 1997, 12, 2117–2126. [Google Scholar] [CrossRef]
  12. Wang, Y.J.; Wang, D.; Yuan, G.L.; Ma, H.; Xu, F.; Li, J.F.; Viehland, D.; Gehring, P.M. Fragile morphotropic phase boundary and phase stability in the near-surface region of the relaxor ferroelectric (1–x)Pb(Zn1/3Nb2/3)O3-xPbTiO3: [001] Field-cooled phase diagrams. Phys. Rev. B 2016, 94, 174103. [Google Scholar] [CrossRef]
  13. Cox, D.E.; Noheda, B.; Shirane, G.; Uesu, Y.; Fujishiro, K.; Yamada, Y. Universal phase diagram for high-piezoelectric perovskite systems. Appl. Phys. Lett. 2001, 79, 400–402. [Google Scholar] [CrossRef]
  14. He, C.J.; Xu, F.; Wang, J.M.; Liu, Y.W. Refractive index dispersion of relaxor ferroelectric 0.9Pb(Zn1/3Nb2/3)O3-0.1PbTiO3 single crystal. Cryst. Res. Technol. 2009, 44, 211–214. [Google Scholar] [CrossRef]
  15. Slodczyk, A.; Colomban, P. Probing the nanodomain origin and phase transition mechanisms in (un)poled PMN-PT single crystals and textured ceramics. Materials 2010, 3, 5007–5028. [Google Scholar] [CrossRef]
  16. Ye, Z.-G.; Dong, M.; Zhang, L. Domain structures and phase transitions of the relaxor-based piezo-/ferroelectric (1–x)Pb(Zn1/3Nb2/3)O3-xPbTiO3 single crystals. Ferroelectrics 1999, 229, 223–232. [Google Scholar] [CrossRef]
  17. Chang, W.S.; Lim, L.C.; Yang, P.; Ku, C.-S.; Lee, H.-Y.; Tu, C.-S. Transformation stress induced metastable tetragonal phase in (93–92)%Pb(Zn1/3Nb2/3)O3-(7–8)%PbTiO3 single crystals. J. Appl. Phys. 2010, 108, 044105. [Google Scholar] [CrossRef]
  18. Uesu, Y.; Matsuda, M.; Yamada, Y.; Fujishiro, K.; COX, D.E.; Noheda, B.; Shirane, G. Symmetry of high-piezoelectric Pb-based complex perovskites at the morphotropic phase boundary: I. neutron diffraction study on Pb(Zn1/3Nb2/3)O3-9%PbTiO3. J. Phys. Soc. Jpn. 2002, 71, 960–965. [Google Scholar] [CrossRef]
  19. Mishra, K.K.; Arora, A.K.; Tripathy, S.N.; Pradhan, D. Dielectric and polarized Raman spectroscopic studies on 0.85Pb(Zn1/3Nb2/3)O3-0.15PbTiO3 single crystal. J. Appl. Phys. 2012, 112, 073521. [Google Scholar] [CrossRef]
  20. Cheng, J.; Yang, Y.; Tong, Y.H.; Lu, S.B.; Sun, J.Y.; Zhu, K.; Liu, Y.L.; Siu, G.G.; Xu, Z.K. Study of monoclinic-tetragonal-cubic phase transition in Pb(Zn1/3Nb2/3)O3-0.08PbTiO3 single crystals by micro-Raman spectroscopy. J. Appl. Phys. 2009, 105, 053519. [Google Scholar] [CrossRef]
  21. IEEE Standard on Piezoelectricity: An American National Standard; Institute of Electricity and Electronics Engineers: New York, NY, USA, 1979.
  22. Zhang, S.J.; Randall, C.A.; Shrout, T.R. Characterization of perovskite piezoelectric single crystals of 0.43BiScO3-0.57PbTiO3 with high Curie temperature. J. Appl. Phys. 2004, 95, 4291–4295. [Google Scholar] [CrossRef]
  23. Harada, K.; Hosono, Y.; Saitoh, S.; Yamashita, Y. Crystal growth of Pb[(Zn1/3Nb2/3)0.91Ti0.09]O3 using a crucible by the supported Bridgman method. Jpn. J. Appl. Phys. 2000, 33, 3117–3120. [Google Scholar] [CrossRef]
  24. Jin, Y.M.; Wang, Y.U.; Khachaturyan, A.G.; Li, J.F.; Viehland, D. Conformal miniaturization of domains with low domain-wall energy: Monoclinic ferroelectric states near the morphotropic phase boundaries. Phys. Rev. Lett. 2003, 91, 197601. [Google Scholar] [CrossRef] [PubMed]
  25. Xu, Z.; Kim, M.; Li, J.F.; Viehland, D. Observation of a sequence of domain-like states with increasing disorder in ferroelectrics. Philos. Mag. A 1996, 74, 395–406. [Google Scholar] [CrossRef]
  26. Li, T.; Du, Z.H.; Tamura, N.; Lu, W.; Ye, M.; Zeng, X.R.; Ke, S.M.; Huang, H.T. In-situ Synchrotron X-ray Micro-Beam Observation of Phase Transition and Nanotwin Domain Structure in (1–x)PZN-xPT Single Crystals. 2017. in preparation. [Google Scholar]
  27. Long, X.F.; Ling, J.B.; Li, X.Z.; Wang, Z.J.; Ye, Z.-G. Growth and Di-/Piezoelectric properties of Al-doped PMN-30PT single crystals. Cryst. Growth Des. 2009, 9, 657–659. [Google Scholar] [CrossRef]
  28. Long, X.F.; Ye, Z.-G. Top-seeded solution growth and characterization of rhombohedral PMN-30PT piezoelectric single crystals. Acta Mater. 2007, 55, 6507–6512. [Google Scholar] [CrossRef]
Figure 1. (a) The temperature dependent XRD patterns of PZN-9PT single crystals from 30 to 220 °C. Simulated XRD patterns (color lines at the bottom of Figure 1a) for pure monoclinic (MC), rhombohedral (R), orthorhombic (O), tetragonal (T), and cubic (C) phase of PZN-9PT are also illustrated; (b,c) The amplified curves around {200} with fitting results.
Crystals 07 00130 g001
Figure 2. (a) The evolution of different phases in PZN-9PT. Four regions with different amounts of phases could be clearly distinguished; (b) The temperature dependence of the dielectric constant of PZN-9PT at selected frequencies (1, 10, 100, 1000, and 10,000 Hz).
Crystals 07 00130 g002
Figure 3. The temperature-dependent Raman spectra of PZN-9PT. Red solid circles show the shifts and intensity changes of the related Ti–O vibration peak. The right image shows a schematic of the structure evolution and corresponding atomic models.
Crystals 07 00130 g003
Figure 4. (a) Longitudinal impedance and phase angle as a function of frequency based on resonance and anti-resonance frequencies for [001]-oriented bar PZN-9PT crystals; (b) Thickness impedance and phase angle as a function of frequency for [001]-oriented square PZN-9PT crystals; (c,d) PE loops of [001]-oriented PZN-9PT crystal at different temperatures and electric fields, respectively.
Crystals 07 00130 g004
Figure 5. TEM images: (a) low TEM image; (b) SAED image; (c,e) high resolution TEM image; (d) corresponding to the inverse FFT image of (c); (f) corresponding to the inverse FFT image of the blue rectangle area in (e).
Crystals 07 00130 g005

