Article

Frequency Conversion in KTP Crystal and Its Isomorphs

1
School of Photonics, ITMO University, Kronverkskiy Prospekt, 49, 197101 Sankt-Peterburg, Russia
2
LLC Neophotonics, Obukhov Defense Avenue, 21, 192019 Sankt-Peterburg, Russia
3
Prokhorov General Physics Institute of the Russian Academy of Sciences, Vavilov Street 38, 119991 Moscow, Russia
4
Chitose Institute of Science and Technology, Chitose, Hokkaido 066-0012, Japan
5
Okamoto Optics Works, Inc., Haramachi Isogo-ku, Yokohama 235-0008, Japan
*
Authors to whom correspondence should be addressed.
Crystals 2018, 8(10), 386; https://doi.org/10.3390/cryst8100386
Submission received: 16 July 2018 / Revised: 7 September 2018 / Accepted: 29 September 2018 / Published: 10 October 2018
(This article belongs to the Special Issue KTP Crystal for Nonlinear Optical and Electrooptic Applications)

Abstract

:
We report the results of an analysis of the functional capabilities of the KTP crystal and its isomorphs for nonlinear-optical frequency conversion of all types of interactions in the transparency range of the crystal. The possibility of implementing angle, wavelength (frequency), and temperature-noncritical phase matching is shown.

1. Introduction

Since the first publication of the data on the synthesis of the KTP crystal (potassium titanyl phosphate, KTiOPO4) [1] and of the results of measuring its characteristics, it became evident that the crystal would take its rightful place for frequency conversion tasks and has fully justified these hopes [2,3,4,5].
The synthesis of this crystal stimulated the study of the possibility of creating isomorphic media with a MTiOXO4 structure, where {M = NH4, K, Rb, TI, and Cs} and {X = P and As} [6,7,8,9,10,11,12,13,14,15,16,17]. A large amount of work has been done, and new crystals have been synthesized including KTA (potassium titanyl arsenate, KTiOAsO4), RTA (rubidium titanyl arsenate, RbTiOAsO4), RTP (rubidium titanyl phosphate, RbTiOPO4), and CTA (cesium titanyl arsenate, CsTiOAsO4). Each of them has their own fields of application. Additionally, it is possible to note the works on the synthesis and investigation of such crystals as KNaTP (K1−xNaxTiOPO4), KNTA (K1−x(NH4)xTiOAsO4), KGTP (KTi1−xGaxO1−xPO4(F,OH)x), AKTP (Ag0.85K0.15TiOPO4), NHTP ((NH4)0.5H0.5TiOPO4) [18], and crystals activated by ions of rare-earth elements [19,20,21].
For a certain but rather wide range of tasks, these crystals have no alternative. They have a high effective nonlinearity coefficient (deff), rather large values of all the phase-matching widths, and of the thermal conductivity coefficient, good optical quality, small absorption, and linear expansion coefficients, as well as non-hygroscopicity. Besides, they are inexpensive in manufacture. Not very high value of the damage threshold determines the field of the most effective applications of these crystals, which includes generation of harmonics and parametric frequency conversion in the near-IR range. In these crystals, noncritical processes were realized for all parameters, i.e., angles, wavelength, and temperature. Moreover, the possibility of producing periodically and non-periodically poled structures in them at record high values of the nonlinear susceptibility coefficient d33 allowed them to find wide application for the problems of frequency conversion of low-intensity radiation in the crystal transparency range [22,23,24,25].
In addition to frequency conversion, these crystals are used as modulators and Q-switches [26,27]. Work is underway to design fibers and waveguide structures [28,29,30,31,32,33,34,35,36,37], photonic structures [38,39,40] from these media. Additionally, these crystals are very promising for the generation of THz radiation [41,42,43,44,45].
To date, a large number of reviews on these crystals have been published. It is impossible to enumerate all the problems on the generation of radiation at different wavelengths in the KTP crystal and its isomorphs, which were obtained experimentally. Nevertheless, not all their capabilities are fully defined. In this paper, we present the results of an analysis of the functional capabilities of the KTP crystal and its isomorphs for all frequency conversion tasks including generation of harmonics and sum and difference frequencies, as well as parametric generation in the range of their transparency (0.4–5.0 μm).
The KTP crystal and its isomorphs belong to mm2 point-group symmetry, with the mutual orientation of the axes XYZabc. A common property of these crystals is that the signs of the nonlinear susceptibility tensor coefficients dij are identical (in contrast to the crystals of point group 3m), and their values differ insignificantly. This leads to the fact that the distributions of the effective nonlinearity coefficients have practically the same form. Figure 1 shows the distributions of the effective nonlinearity coefficients deff in the KTP crystal for two types of interactions, ssf and fsf = sff (s-slow, f-fast) in accordance to equations from Reference [46]. The lines of white color show the phase-matching directions for the second harmonic generation (SHG), i.e., ssf (SHG at λ1 = λ2 = 3.4 μm, for which the value deff is maximal) and fsf = sff (SHG at λ1 = λ2 = 1.064 μm, as widely used). For a large number of applications, a cut of the crystal is selected on the phase-matching curve, for which deff has a maximum value. For the particular cases of ssf type shown in Figure 1, this value of deff is 0.65 pm/V at ϕ = 42° and θ = 49.7°, and for the cases of fsf = sff type we have deff = 3.42 pm/V at ϕ = 23.5° and θ = 90°. Black points at Figure 1 show these directions. The maximum value deff takes place for the second type of phase matching, i.e., sff = fsf, which is most widely used in practice.
Let us consider the functional possibilities of frequency conversion for all possible processes and types of phase matching in the crystal transparency range.

2. General Features of Frequency Conversion

The method of analysis of the functional possibilities of the KTP crystal and its isomorphs proposed in References [47,48] uses the form of presentation for the crystal figure-of-merit F O M = d e f f 2 / ( n 1 n 2 n 3 ) from the wavelengths λ1 and λ2 for uniaxial [47] and biaxial [48] crystals. Hereafter, the relation λ1 ≥ λ2 > λ3 is adopted. For all the values of the wavelengths λ1 and λ2, the value of λ3 (1/λ3 = 1/λ1 + 1/λ2) is uniquely determined, the plots of the dependences for which are given for all the results presented below. For each pair of wavelengths λ1 and λ2, a cone of phase-matching directions was calculated. Along these directions, there was one defined for which deff has a maximum value. It was used to calculate FOMD1, λ2), each value of which on the distributions presented below in Figures 2, 4, 6–10, 12–17 has its color from the right-hand palette. Here, the parameter FOMD1, λ2) corresponds to the maximum value deff on the phase-matching curve, unlike the other FOM parameter defined below in Section 3. In all the figures of the FOM1, λ2) distributions the maximum values are shown. The following data (Sellmeier equations for indices of refractions, dni/dT and dij coefficients) were used for the crystal parameters: KTP [49,50], RTP [51], RTA [52], KTA [53], and CTA [54,55]. There is one peculiarity here. All this group of crystals is grown by different technologies [56,57,58,59,60,61,62,63], in different regimes and with different composition of the initial charge. This leads to the fact that the crystals have different refractive indices. As a result, the phase-matching angles can differ by a few degrees. The data [49,50,51,52,53] used in the calculations most closely correspond to the crystals supplied by the majority of manufacturers. Below, we will show the difference between the results for FOM1, λ2) using various optical and thermo-optical parameters of the KTP crystal.
It is known (see, e.g., [63,64]) that the coefficients of the nonlinear susceptibility tensor dijk are characterized by dispersion. However, due to the lack of complete data for all crystals, dispersion was not taken into account in the calculations. We used typical values [46] in the crystal transparency range. The variation in the values of dijk in this range does not change the general character of the distributions.
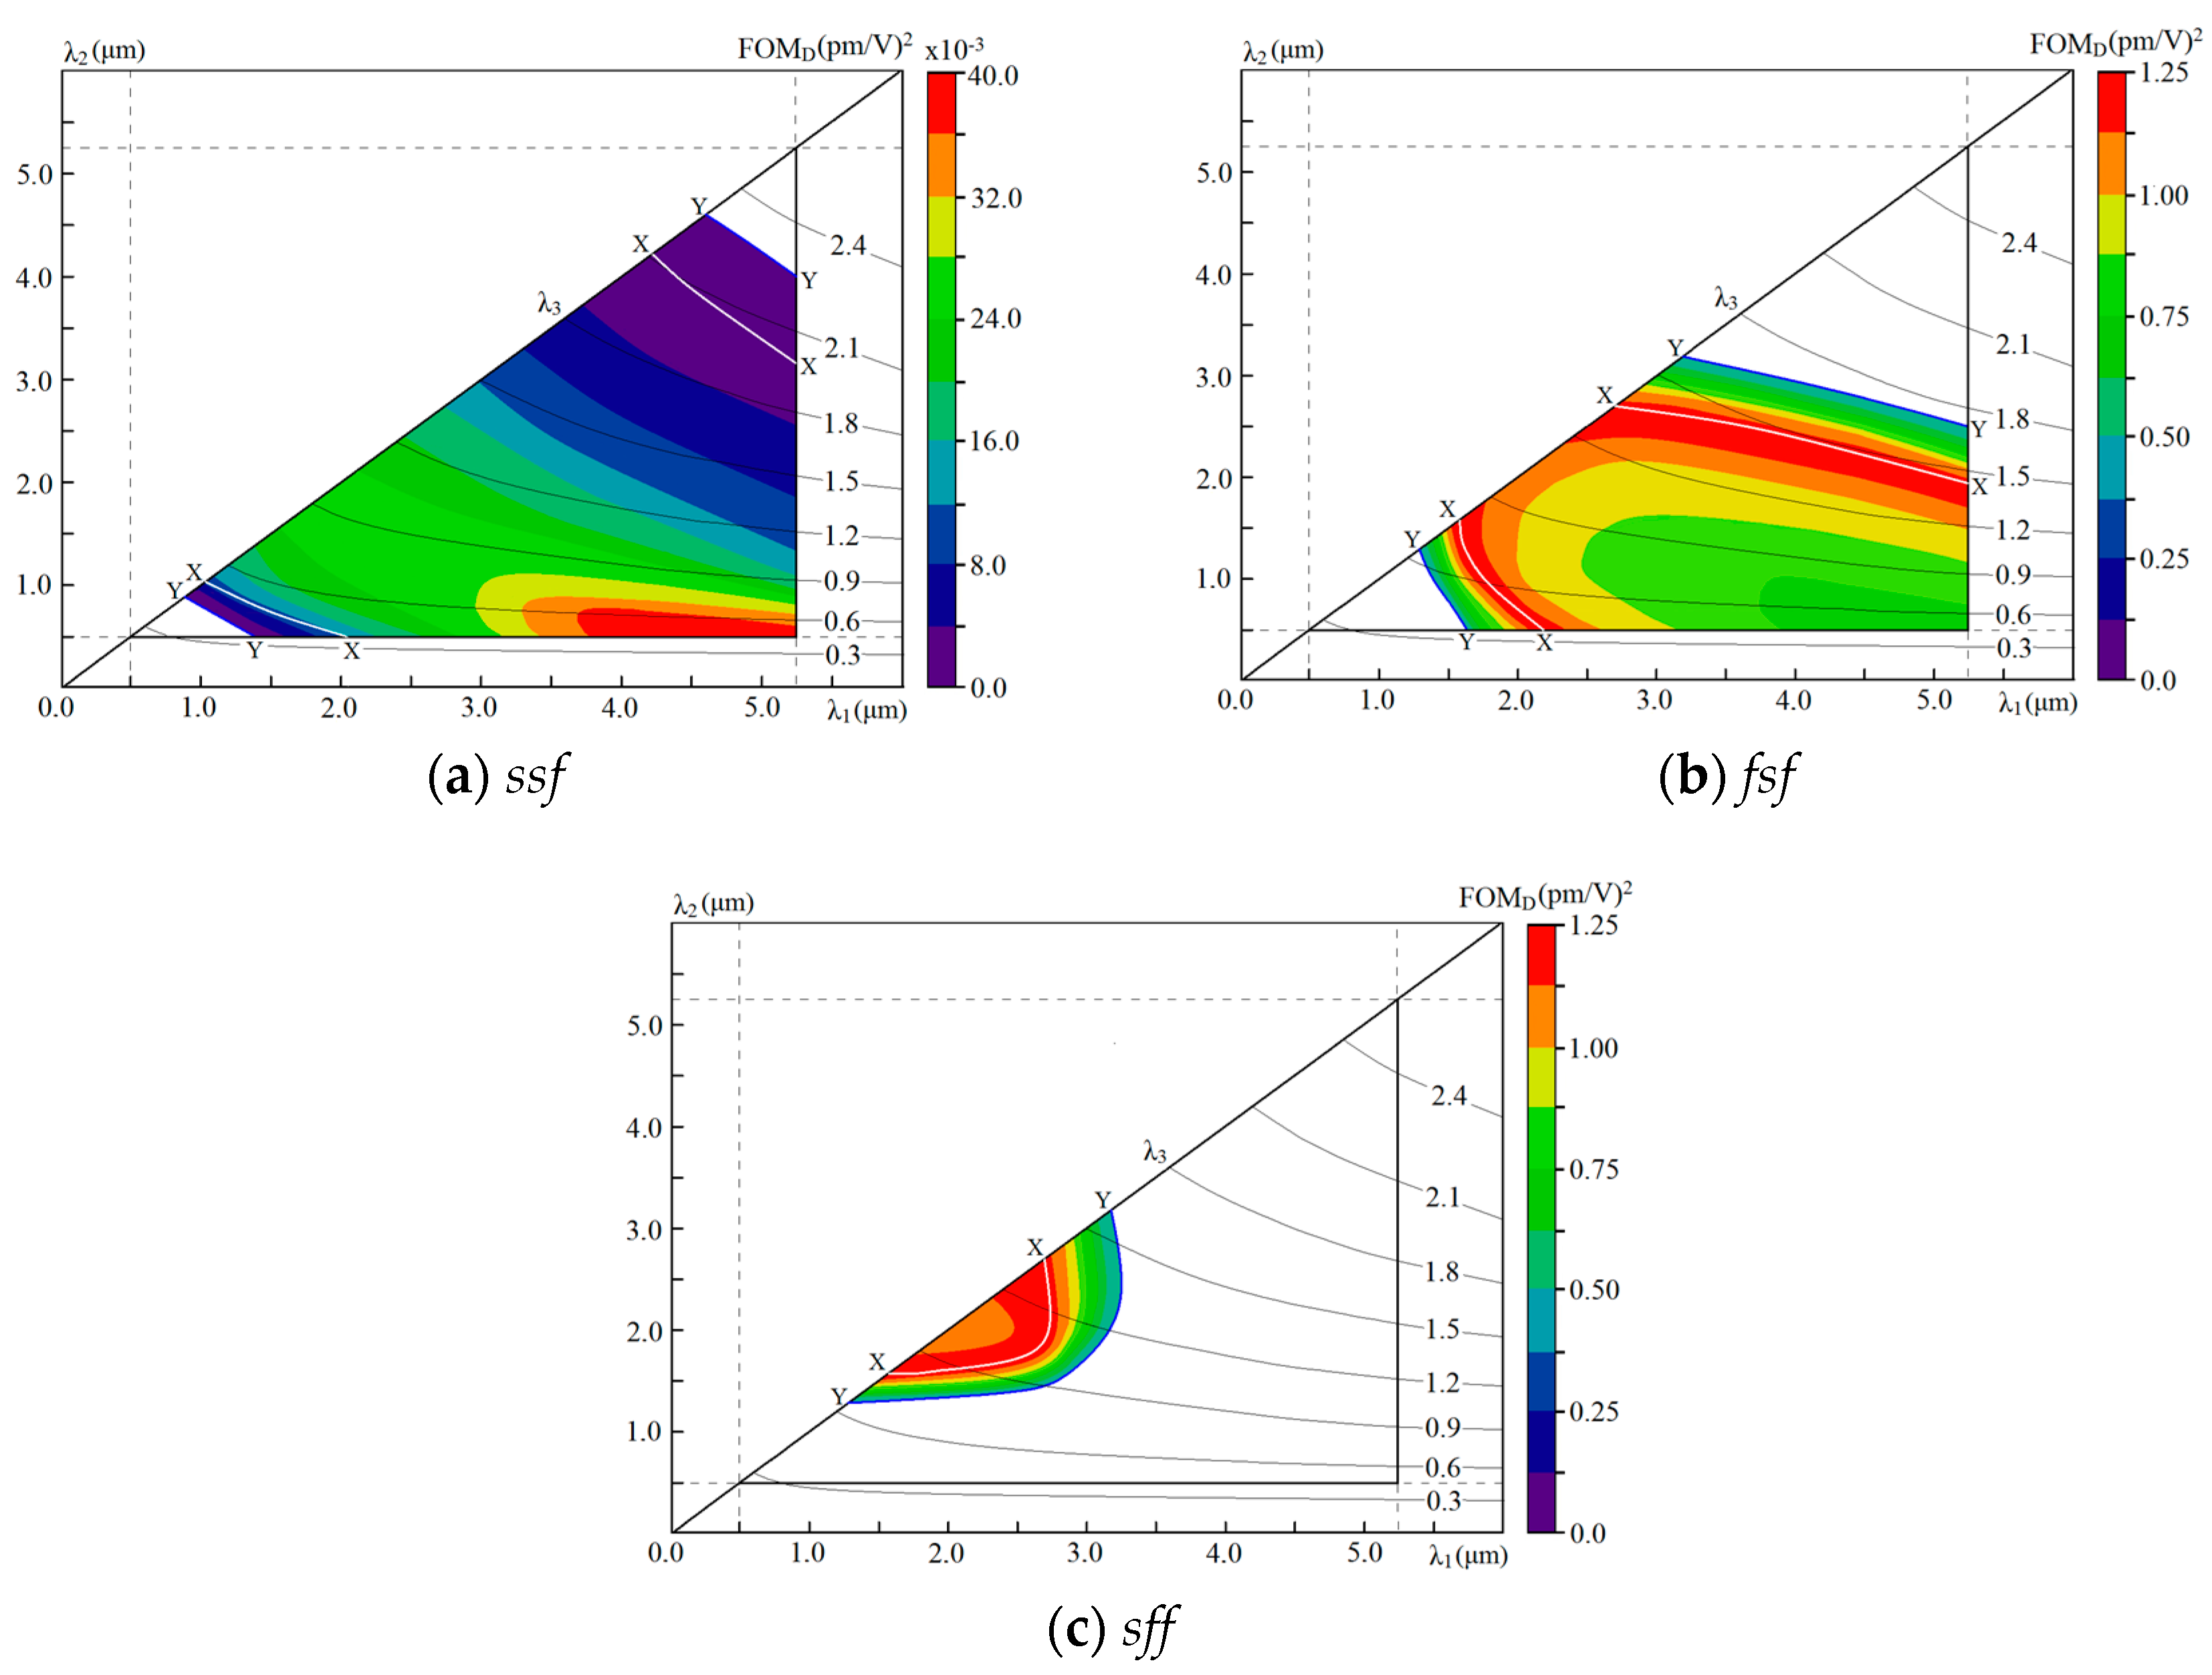
Figure 2 shows the FOMD1, λ2) distributions for the wavelengths λ1 and λ2 for all types of interactions for the KTP crystal in its transparency range (the boundaries of the range are shown by external dashed lines). For the used ratio of wavelengths λi, the results appear below the diagonal of the graph. It is easy to see that for ssf-type interaction the distribution is symmetric with respect to the diagonal. For sff and fsf types, the results are mutually complementary with respect to the diagonal. Black color lines correspond to λ3 (1/λ1 + 1/λ2 = 1/λ3).
Almost throughout the crystal transparency range, phase matching is realized for the first and second types of interactions. The boundary of the FOMD1, λ2) distribution determines combinations of wavelengths at which angular noncritical phase matching takes place. This is most fully obvious for the sff type of interaction in Figure 2. For all crystals of the KTP group, phase matching with a change in wavelength appears and disappears along the y axis [65]. In this case, it is noncritical in angles ϕ and θ. In all the figures, a combination of wavelengths for which phase matching exists along the x axis is shown by the white line. For SHG, this is realized at λ1 = λ2 = 1.078 μm and λ1 = λ2 = 3.18 μm. This is also angular noncritical phase matching. For type-II phase matching along the x axis, the coefficient deff has a maximum value. Thus, at all combinations of wavelengths with phase matching along the x axis, the maximum conversion efficiency can be obtained.
For this group of crystals, phase matching along the z axis is absent. In the KTP crystal, the maximum value of the wavelength for the sum frequency generation is possible with type-II phase matching for SHG at λ1 = λ2 = 3.308 μm, whereas the minimum value of the wavelength for SHG is observed at λ1 = λ2 = 0.994 μm. The minimum value of the wavelength with ssf- and fsf-type interactions can be obtained by sum frequency generation (SFG) at the boundary of the transparency range.
The character of the FOMD1, λ2) distribution for the ssf type in the main part of the wavelength region of the transparency range is determined by the fact that the terms with different elements of the tensor dij with opposite signs contribute to the nonlinear polarizability of the medium. For a value of λ1 at the boundary of the transparency range, a large variance for the angle of the optical axis Vz(λ), a large difference Vz1)–Vz2), leads to an increase in the values of deff. But even in this region the maximum value of FOMD1, λ2) for the ssf type is less than that for fsf and sff types, the region of phase matching for ssf type being maximal.
The presented results allow us to determine the possible tuning range of optical parametric oscillators. For a given value of λ3, the phase matching region shows the tuning range for λ1 and λ2. This can all be achieved at a maximum value of deff. It can be seen from the results of Figure 2 that the largest tuning range can be obtained by changing the phase-matching angle in the xz plane.
The maximum pump wavelength for KTP is 1.7 μm. The largest tuning range can be obtained for λ3 = 0.8–1.2 μm. In this case, the wavelength range is λ1 = 1.1–4.5 μm. This can all be achieved at a maximum value of deff in the xy plane, since the value of FOMD1, λ2) is determined for these values.
The method of analysis proposed in References [47,48] allows us to determine combinations of wavelengths at which the regime of frequency-noncritical phase matching (FNCPM) is realized. The condition dΔk/dλ = 0 corresponds to it. Figure 3 shows the wavelength dependence of the phase-matching angle θphm and the coefficient deff in the xz plane for the SHG with the type-II interaction in the KTP crystal. One can see that these dependences exhibit a consistent variation of these parameters. In this case, the FNCPM regime can be determined by the equality /dλ = 0. Consequently, the minimum value of FOMD1, λ2) for the KTP crystal on the straight line representing SHG (Figure 2) corresponds to the FNCPM regime.
Similarly, the combination of the wavelengths λ1 and λ2 for FNCPM can be determined for all the frequency conversion processes, i.e., generation of the third (THG), fourth (FoHG), fifth (FiHG) harmonics, and SFG (in Figure 4 they are indicated by the red line). In the FNCPM regime, the minimum values of FOMD1, λ2) along the straight line will correspond to the above frequency conversion processes. For fsf and sff interactions types in Figure 4, the dashed lines show the combination of λ1 and λ2 of the FNCPM regime. It should also be noted that FNCPM takes place for the combinations of the wavelengths λ1 and λ2 on all these lines, which are tangent to the isolines of the FOMD1, λ2) distributions. The FNCPM regime is realized accurately for the given ratio of the wavelengths. In addition, it can also be obtained in the vicinity of these values of λ1 and λ2 on the phase-matching curve [66], but at a smaller value of deff. The dash-dotted line in Figure 4 shows the combinations of the wavelengths for the FNCPM regime in the yz plane, which occurs in the KTP crystal and its isomorphs.
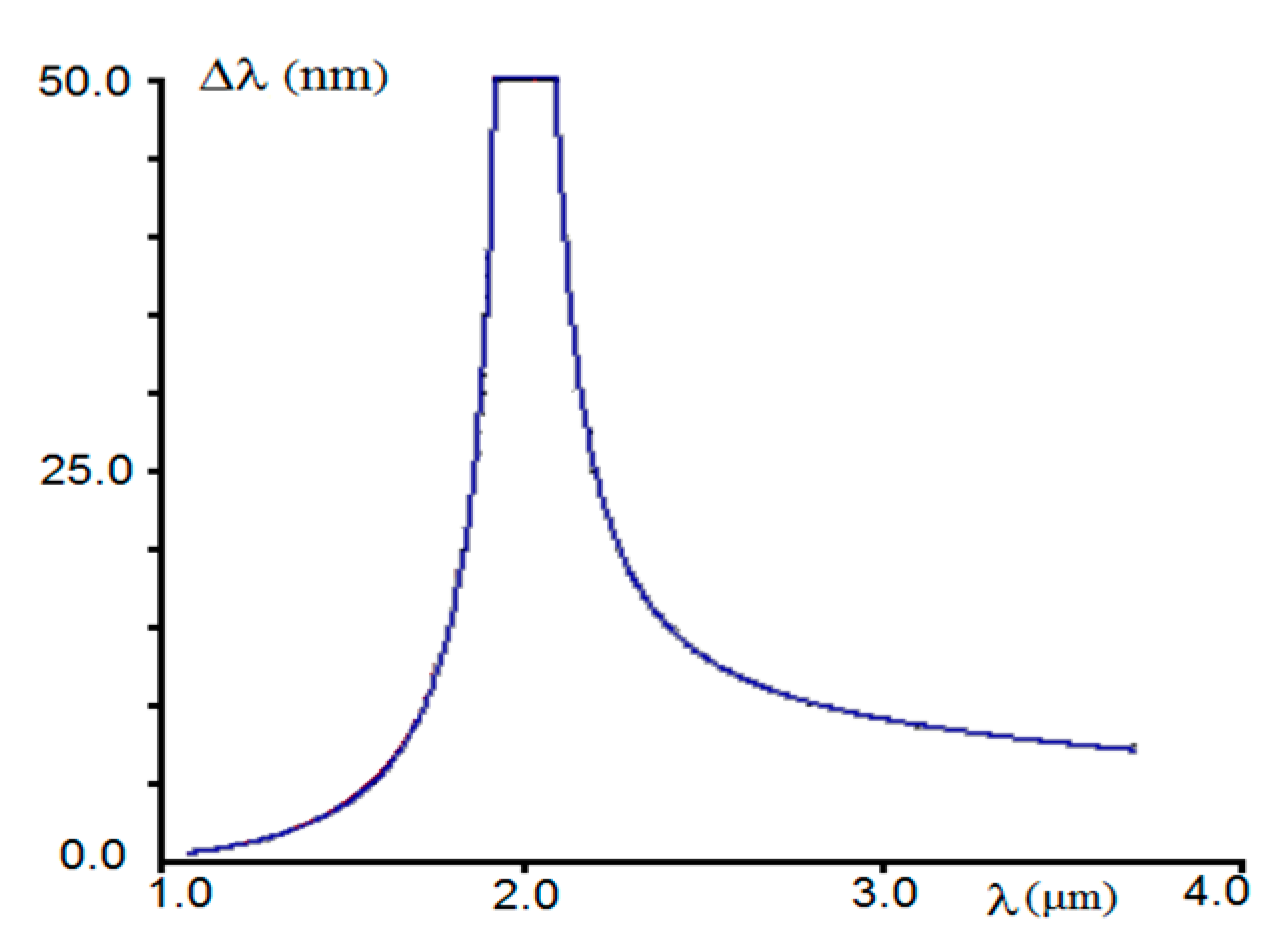
The general character of the change in FOMD1, λ2) also shows the ratio of the spectral widths of phase matching at various combinations of λ1 and λ2. Figure 4a shows that, for example, for SHG, the rate of change in the value of FOMD1, λ2) in the short-wave region is much larger than that in the long-wavelength region. A small rate of change in FOMD1, λ2) corresponds to a slow change in the phase-matching angle θphm. In this case, the spectral width of phase matching in the long-wavelength region is greater than that in the short-wavelength region. This is confirmed by with the calculated wavelength dependences of the spectral width of phase matching for SHG in the KTP crystal (Figure 5): 0.6 nm⋅cm in short-wavelength region, and 7.2 nm⋅cm in the long-wavelength region. They differ by more than an order of magnitude.
The FNCPM regime is also possible when the frequency of ultra-short pulses is converted into a field of quasi-continuous wave (quasi-CW) radiation. Figure 6 shows the special case of the FOMD1, λ2) distribution for sum frequency generation for type-II phase matching with broadband radiation at λ1 = 2.4 μm and quasi-CW radiation at λ2 = 1.75 μm. In this case, the spectral width of phase matching with respect to λ1 is 170 nm⋅cm1/2. This possibility follows from the fact that in the case when the tangent to the isolines of the FOMD1, λ2) distribution is parallel to the axis, the value of deff does not change in a wide range of the wavelengths. Taking into account the results of Figure 2, we find that in a wide range of the wavelengths, the phase-matching angle preserves its value. For the KTP crystal, for example, in the xz plane, this is the angle θphm. The character of the FOMD1, λ2) distribution with a minimal value in the central region (Figure 6) shows that the FNCPM is possible in a wide range of the wavelengths. Additionally, possible is the FNCPM regime with a different ratio of the spectral widths of two wavelengths λ1 and λ2.
Figure 7, Figure 8, Figure 9 and Figure 10 show the results for RTP (Figure 7), KTA (Figure 8), RTA (Figure 9), and CTA (Figure 10) crystals, which are similar to those in Figure 2 for KTP.
In general, the character of the distributions for all these crystals is similar to that for KTP. As in the case of KTP, for the ssf type, phase matching exists almost everywhere in the crystal transparency range. However, the value of deff for it is significantly less than that for fsf and sff types. For the fsf type, phase matching is realized in most of the crystal transparency range.
In the case of the CTA crystal, in the vicinity of the x axis the rate of change in FOMD1, λ2) in the complete wavelengths range is much less than that for other crystals. This corresponds to the fact that the spectral width of phase matching for CTA is larger. At a wavelength of 1.548 μm, the spectral width in CTA is 4.3 nm⋅cm, whereas the spectral width in KTP at 1.076 μm is 0.6 nm⋅cm. In all crystals, the FNCPM regime can be obtained both for the generation of harmonics and sum and difference frequencies.

3. Temperature-Noncritical Processes of Frequency Conversion

The above results in the form of FOMD1, λ2) distributions allow us to determine combinations of the wavelengths for which deff has a maximum value and for which angle and frequency-noncritical phase matching takes place. It is also possible to implement temperature-noncritical phase matching (TNCPM) by determining the value of FOMT1, λ2) on the phase-matching cone along the directions for which dΔk/dT = 0. This regime of frequency conversion in the KTP crystal has been repeatedly obtained by various authors [67,68,69,70,71,72,73]. As in the case of angle and frequency-noncritical phase matching, the first-order derivative with respect to temperature dΔk/dT = 0 determines the TNCPM direction. The temperature width is determined by derivatives of a higher order.
It is important that the TNCPM direction is not strictly fixed in the crystal. It has dispersion as well as phase-matching and optical axis directions. To analyze the feasibility of the TNCPM regime and its dispersion, it was proposed [73] to determine the directions (cone) of temperature-noncritical interactions (TNCIs) independently of the phase-matching condition for which Δk (ϕ, θ) = 0. These are the directions along which dΔk (ϕ, θ)/dT = 0, no matter if phase matching takes place or not. The intersection of the phase-matching and TNCI cones determines the direction of TNCPM, since in this direction Δk (ϕ, θ) and dΔk(ϕ, θ)/dT are simultaneously equal to zero. With changing the radiation wavelength, both cones (phase matching and TNCI) change, which leads to a change in the TNCPM direction. This shows that this regime takes place in a finite range of wavelengths for a given frequency conversion process.
Figure 11 shows the angular dependences for phase matching and TNCI of ssf and fsf interactions types for SHG in the KTP crystal at different wavelengths. For the ssf-type interaction, the TNCPM regime is initially obtained at a wavelength of λ1 = λ2 = 0.747 μm in the xy plane (ϕ = 64°, θ = 90°). As the wavelength of the radiation increases, the direction of TNCPM changes, and the values of the angles ϕ and θ change. At a wavelength of λ1 = λ2 = 1.064 μm, the TNCPM regime takes place at ϕ = 48° and θ = 43°, and at λ1 = λ2 = 3.48 μm it occurs in the xz plane (ϕ = 0°, θ = 54°). Thus, for SHG with the ssf type of interaction, the TNCPM regime can be obtained in the range from 0.774 to 3.48 μm with a change in the direction from the xy plane to the xz plane. The results of Figure 1a demonstrate that, in the principal planes xy, yz and xz of the crystal (up to the optical axis), deff = 0, and the results of Figure 11a,c are of no practical value. The maximum conversion efficiency for the ssf type with TNCPM can be obtained at λ1 = λ2 of about 3.25 μm.
For the sff-type interaction, the TNCPM regime can be obtained in the wavelength range 1.002–3.180 μm. The character of the change in the direction of TNCPM is such that it appears in the xy plane at a wavelength of 1.002 μm (ϕ = 72°, θ = 90°) (Figure 11d). As the wavelength increases, the directions change, but TNCPM with a maximum wavelength does not intersect the main planes of the crystal. The results for the sff type in Figure 1b demonstrate that the maximum value of deff (along the x axis) cannot be obtained. The value of FOMT1, λ2) is 3–4 times smaller than the value along the x axis. But at a wavelength of 3.18 μm TNCPM takes place along the x axis. In this case, there is TNCPM, angular noncritical phase matching and a maximal value of deff. The result of Figure 11 agrees with the experimental data obtained in Refs. [67,68,69,70,71,72].
For the KTP crystal, the FOMT1, λ2) distributions with TNCPM are shown in Figure 12 for all types of interactions. The region for the existence of phase matching (the wavelength region with phase matching without TNCPM), corresponding to Figure 2, is shown by gray. Here, the phase matching is temperature critical. The distribution from the regions with different levels/color corresponds to the temperature-noncritical phase matching (wavelength region with TNCPM).
A comparison of Figure 2 and Figure 11 for the KTP crystal shows that the values of FOM1, λ2) are different for the same combinations of the wavelengths. When these values are equal for the KTP crystal, the TNCPM direction lies in the main plane, where deff has a maximum value. In the case of SHG, this takes place for fsf = sff type phase matching at a wavelength of 3.18 μm (Figure 11).
Additionally, it is possible at different combinations of λ1 and λ2. With FOMD1, λ2) differs from FOMT1, λ2), the direction of TNCPM has the most common orientation: 90° > θ > 0° and 90° > ϕ > 0°. In this case, deff will be less than the maximum possible value for the selected combination of wavelengths.
The FOMT1, λ2) distributions, similar to those in Figure 12, are presented for KTA (Figure 13), RTP (Figure 14), RTA (Figure 15), and CTA (Figure 16) crystals. One can see from these figures that only in the KTP and RTP crystals there are directions in the crystal transparency range along which TNCPM is realized. For KTA and RTA crystals, the TNCPM region is much smaller than the phase-matching region. For the CTA crystal, no TNCPM is realized at any combination of wavelengths λ1 and λ2.
In analyzing the results of Figure 12, Figure 13, Figure 14, Figure 15 and Figure 16, it is necessary to pay attention to one peculiarity. For example, more than 10 papers have been published for the KTP crystal in which the Sellmeier equations ni(λ) are given for the principal values of the refractive indices, and the data are lesser extent, from the values of ni(λ). As noted above, the following data were used to calculate the FOMT1, λ2) distributions for the KTP crystal (Figure 12): ni(λ) [49], dni(λ)/dT [50]. They give a fairly good agreement with the results of calculations and the experimental data for phase-matching angles, mainly in the visible and near-IR ranges. Additionally, a good agreement was obtained for the temperature widths of phase-matching. A comparison of the experimental results with the TNCPM [70] was carried out using the data for dni(λ)/dT from [50]. As a result, a good agreement was obtained.
Later, more precise measurements of the parameters were made for the KTP crystal [49]. The obtained data for ni(λ) are in very good agreement with the results of calculations for the phase-matching angles in the crystal transparency range. The data for dni(λ)/dT in Reference [49] give good agreement for the temperature-critical phase matching in the visible-near-IR range. But in the crystal transparency range of the KTP crystal, the FOMT1, λ2) distributions (see Figure 17) considerably differ from the results of Figure 12. The ranges of wavelengths within which TNCPM is present also differ. Comparison of the results in Figure 12 and Figure 17 raises the problem of refinement of the data on dni(λ)/dT in the KTP crystal transparency range. At the same time, it is necessary to measure the temperature derivatives for refractive indices of the second and higher orders to determine the temperature widths of phase matching [72,73]. Based on this, at present, the reliability of the above results for RTP, KTA, RTA, and CTA crystals cannot be guaranteed (Figure 13, Figure 14, Figure 15 and Figure 16). Much less research was carried out for these crystals than for the KTP crystal.
Without pretending to rigorous determination of the results (see Figure 12, Figure 13, Figure 14, Figure 15 and Figure 16) at this stage, it can be formally noted that in the largest wavelength region, the TNCPM regime takes place for phosphate crystals (KTP and RTP). In a much smaller region, the TNCPM is realized for crystals containing arsenic (RTA and KTA). The presence of cesium in the crystal together with arsenic (CTA) leads to the fact that the TNCPM regime is absent in the crystal transparency. This is confirmed by the results of Reference [54], in which the temperature width of phase matching did not exceed 11.1 °С⋅cm for different frequency conversion processes in the range 0.532–2.02 μm. All this requires an appropriate analysis.

4. Conclusions

The paper presents the results showing the functional capabilities of the KTP crystal and its isomorphs for nonlinear-optical frequency conversion in the range of their transparency for all types of interactions with maximal value of effective nonlinear coefficient. Combinations of wavelengths are shown, at which angle-, wavelength, and temperature-noncritical phase matching is realized. The boundary of distribution corresponds to angular noncritical phase matching along y axis. Additionally, the obtained results show angular noncritical phase matching along x and z axes. The wavelength noncritical phase matching corresponds to the extremum on distribution.
Realization of temperature noncritical phase matching is represented. This regime can be realized in wide band of wavelengths in some crystals. One can see from obtained results that only in the KTP and RTP crystals there are directions in the crystal transparency range along which TNCPM is realized. For KTA and RTA crystals, the TNCPM region is much smaller than the phase-matching region. For the CTA crystal, no TNCPM is realized at any combination of wavelengths.

Author Contributions

All authors contributed equally to this work.

Funding

This work was supported by the Presidium of RAS (Program I.7 “Modern problems of photonics, the probing of inhomogeneous media and materials”).

Conflicts of Interest

The authors declare no conflict of interest.

References

  1. Zumsteg, F.C.; Bierlein, J.D.; Gier, T.E. KxRb1−xTiOPO4: A new nonlinear optical material. J. Appl. Phys. 1976, 47, 4980–4985. [Google Scholar] [CrossRef]
  2. Dezhong, S.; Chaoen, H. A new nonlinear optical crystal KTP. Prog. Cryst. Growth Charact. 1985, 11, 269–274. [Google Scholar] [CrossRef]
  3. Jacco, J.C. KTiOPO4 (KTP)—Past, present, and future. Proc. SPIE 1988, 968, 93–99. [Google Scholar]
  4. Bierlein, J.D. Potassium titanyl phosphate (KTP): Properties, recent advances and new applications. Proc. SPIE 1989, 1104, 2–12. [Google Scholar]
  5. Bierlein, J.D.; Vanherzeele, H. Potassium titanyl phosphate: Properties and new applications. J. Opt. Soc. Am. B 1989, 6, 622–633. [Google Scholar] [CrossRef]
  6. Stucky, G.D.; Phillips, M.L.F.; Gier, T.E. The potassium titanyl phosphate structure field: A model for new nonlinear optical materials. Chem. Mater. 1989, 1, 492–509. [Google Scholar] [CrossRef]
  7. Cheng, L.K.; Bierlein, J.D. Crystal growth of KTiOPO4 isomorphs from tungstate and molybdate fluxes. J. Cryst. Growth 1991, 110, 697–703. [Google Scholar] [CrossRef]
  8. Thomas, P.A.; Mayo, S.C.; Watts, B.E. Crystal structures of RbTiOAsO4, KTiO(P0.58,As0.42)O4, RbTiOPO4 and (Rb0.465,K0.535)TiOPO4, and analysis of pseudo symmetry in crystals of the KTiOPO4 family. Acta Cryst. B 1992, 48, 401–407. [Google Scholar] [CrossRef]
  9. Cheng, L.K.; Bierlein, J.D. KTP and isomorphs—Recent progress in device and material development. Ferroelectrics 1993, 142, 209–228. [Google Scholar] [CrossRef]
  10. Cheng, L.K.; Cheng, L.T.; Bierlein, J.D.; Zumsteg, F.C.; Ballman, A.A. Properties of doped and undoped crystals of single domain KTiOAsO4. Appl. Phys. Lett. 1993, 62, 346–348. [Google Scholar] [CrossRef]
  11. Cheng, L.K.; Cheng, L.T.; Galperin, J.; Hotsenpiller, P.A.M.; Bierlein, J.D. Crystal growth and characterization of KTiOPO4 isomorphs from the self-fluxes. J. Cryst. Growth 1994, 137, 107–115. [Google Scholar] [CrossRef]
  12. Wang, J.; Wei, J.; Liu, Y.; Shi, L.; Jiang, M.; Hu, X.; Jiang, S. Growth and properties of some KTP family crystals. Proc. SPIE 1996, 2897, 10–16. [Google Scholar]
  13. Wang, J.; Wei, J.; Liu, Y.; Yin, X.; Hid, X.; Shao, Z.; Jiang, M. A survey of research on KTP and its analogue crystals. Prog. Cryst. Growth Charact. Mater. 2000, 40, 3–15. [Google Scholar] [CrossRef]
  14. Zhang, K.; Wang, X. Structure sensitive properties of KTP-type crystals. Chin. Sci. Bull. 2001, 46, 2028–2036. [Google Scholar]
  15. Roth, M.; Tseitlin, M.; Angert, N. Composition-dependent electro-optic and nonlinear optical properties of KTP-family crystals. Opt. Mater. 2006, 28, 71–76. [Google Scholar] [CrossRef]
  16. Sorokina, N.I.; Voronkova, V.I. Structure and properties of crystals in the potassium titanyl phosphate family: A review. Crystallogr. Rep. 2007, 52, 80–93. [Google Scholar] [CrossRef]
  17. Satyanarayan, M.N.; Deepthy, A.; Bhat, H.L. Potassium titanyl phosphate and its isomorphs: Growth, properties, and applications. Crit. Rev. Solid State Mater. Sci. 2010, 24, 103–191. [Google Scholar] [CrossRef]
  18. Phillips, M.L.F.; Harrison, W.T.A.; Gier, T.E.; Stucky, G.D. SHG tuning in the KTP structure field. Proc. SPIE 1989, 1104, 225–231. [Google Scholar]
  19. Thomas, P.A.; Glazer, A.M.; Watts, B.E. Crystal structure and nonlinear optical properties of KSnOPO4 and their comparison with KTiOPO4. Acta Crystallogr. B 1999, 46, 333–343. [Google Scholar] [CrossRef]
  20. Solé, R.; Nikolov, V.; Koseva, I.; Peshev, P.; Ruiz, X.; Zaldo, C.; Martín, M.J.; Aguilo, M.; Díaz, F. Conditions and possibilities for rare-earth doping of KTiOPO4 flux-grown single crystals. Chem. Mater. 1997, 9, 2745–2749. [Google Scholar] [CrossRef]
  21. Gavaldà, J.; Carvajal, J.J.; Mateos, X.; Aguiló, M.; Díaz, F. Dielectric properties of Yb3+ and Nb5+ doped RbTiOPO4 single crystals. J. Appl. Phys. 2012, 111, 034106. [Google Scholar] [CrossRef]
  22. Urenski, P.; Rosenman, G.; Molotskii, M. Polarization reversal and domain anisotropy in flux-grown KTiOPO4 and isomorphic crystals. J. Mater. Res. 2001, 16, 1493–1499. [Google Scholar] [CrossRef]
  23. Shur, V.Y.; Pelegova, E.V.; Akhmatkhanov, A.R.; Baturin, I.S. Periodically poled crystals of KTP family: A review. Ferroelectrics 2016, 496, 49–69. [Google Scholar] [CrossRef]
  24. Laudenbach, F.; Jin, R.-B.; Greganti, C.; Hentschel, M.; Walther, P.; Hübel, H. Numerical Investigation of Photon-Pair Generation in Periodically Poled MTiOXO4 (M = K, Rb, Cs; X = P, As). Phys. Rev. Appl. 2017, 8, 024035. [Google Scholar] [CrossRef]
  25. Houe, M.; Townsend, P.D. An introduction to methods of periodic poling for second-harmonic generation. J. Phys. D Appl. Phys. 1995, 28, 1747–1763. [Google Scholar] [CrossRef]
  26. Laubacher, D.B.; Guerra, V.L.; Chouinard, M.P.; Liou, J.-Y.; Wyat, P.H. Fabrication and performance of KTP optoelectronic modulators. Proc. SPIE 1988, 993, 80–86. [Google Scholar]
  27. Bierlein, J.D.; Arweiler, C.B. Electro-optic and dielectric properties of KTiOPO4. Appl. Phys. Lett. 1986, 49, 917–919. [Google Scholar] [CrossRef]
  28. Bierlein, J.D.; Ferretti, A.; Brixner, L.H.; Hsu, W.Y. Fabrication and characterization of optical waveguides in KTiOPO4. Appl. Phys. Lett. 1987, 50, 1216–1218. [Google Scholar] [CrossRef]
  29. Noda, K.-I.; Sakamoto, W.; Yogo, T.; Hirano, S.-I. Alkoxy-Derived KTiOPO4 (KTP) Fibers. J. Am. Ceram. Soc. 1997, 80, 2437–2440. [Google Scholar] [CrossRef]
  30. Butt, M.A.; Pujol, M.C.; Solé, R.; Ródenas, A.; Lifante, G.; Aguiló, M.; Díaz, F.; Khonina, S.N.; Skidanov, R.V.; Verma, P. Fabrication of optical waveguides in RbTiOPO4 single crystals by using different techniques. Proc. SPIE 2016, 9807, 98070C. [Google Scholar]
  31. Karpiński, M.; Radzewicz, C.; Banaszek, K. Experimental characterization of three-wave mixing in a multimode nonlinear KTiOPO4 waveguide. Appl. Phys. Lett. 2009, 94, 181105. [Google Scholar] [CrossRef]
  32. Webjorn, J.; Siala, S.; Nam, D.W.; Waarts, R.G.; Lang, R.J. Visible laser sources based on frequency doubling in nonlinear waveguides. IEEE J. Quant. Electron. 1997, 33, 1673–1686. [Google Scholar] [CrossRef]
  33. Butt, M.A.; Nguyen, H.D.; Ródenas, A.; Romero, C.; Moreno, P.; Aldana, J.R.V.; Aguiló, M.; Solé, R.M.; Pujol, M.C.; Díaz, F. Low-repetition rate femtosecond laser writing of optical waveguides in KTP crystals: analysis of anisotropic refractive index changes. Opt. Express. 2015, 23, 15343–15355. [Google Scholar] [CrossRef] [PubMed]
  34. Bierlein, J.D.; Ferretti, A.; Roelofs, M. KTiOPO4 (KTP): A new material for optical waveguide applications. Proc. SPIE 1989, 994, 160–168. [Google Scholar]
  35. Cugat, J.; Solé, R.; Carvajal, J.J.; Mateos, X.; Massons, J.; Lifante, G.; Díaz, F.; Aguiló1, M. Channel waveguides on RbTiOPO4 by Cs+ ion exchange. Opt. Lett. 2013, 38, 323–325. [Google Scholar] [CrossRef] [PubMed]
  36. Butt, M.A.; Pujol, M.C.; Solé, R.; Ródenas, A.; Lifante, G.; Wilkinson, J.S.; Aguiló, M.; Díaz, F. Channel waveguides and Mach-Zehnder structures on RbTiOPO4 by Cs+ ion exchange. Opt. Mater. Express. 2015, 5, 1183–1194. [Google Scholar] [CrossRef]
  37. Butt, M.A.; Solé, R.; Pujol, M.C.; Ródenas, A.; Lifante, G.; Choudary, A.; Murugran, G.S.; Shepherd, D.P.; Wilkinson, J.S.; Aguiló, M.; et al. Fabrication of Y-splitters and Mach-Zehnder Structures on (Yb, Nb): RbTiOPO4/ RbTiOPO4 Epitaxial Layers by Reactive Ion Etching. J. Lightwave Technol. 2015, 33, 1863–1871. [Google Scholar] [CrossRef]
  38. Hagerman, M.E.; Poeppelmeier, K.R. Review of the Structure and Processing-Defect-Property Relationships of Potassium Titanyl Phosphate: A Strategy for Novel Thin-Film Photonic Devices. Chem. Mater. 1995, 7, 602–621. [Google Scholar] [CrossRef]
  39. Berger, V. Nonlinear Photonic Crystals. Phys. Rev. Lett. 1998, 81, 4136–4139. [Google Scholar] [CrossRef]
  40. Golcondaa, R.K.; Carvajal, J.J.; Pujol, M.C.; Mateos, X.; Aguiló, M.; Diaz, F.; Vázquez de Aldana, J.R.; Romero, C.; Méndez, C.; Moreno, P.; et al. Fabrication of photonic structures in crystals of the KTiOPO4 family by ultrafast laser ablation. Phys. Procedia 2010, 8, 126–135. [Google Scholar] [CrossRef]
  41. Mounaix, P.; Sarger, L.; Caumes, J.P.; Freysz, E. Characterization of non-linear potassium crystals in the terahertz frequency domain. Opt. Commun. 2004, 242, 631–639. [Google Scholar] [CrossRef]
  42. Kitaeva, G.K. Terahertz generation by means of optical lasers. Laser Phys. Lett. 2008, 5, 559–576. [Google Scholar] [CrossRef]
  43. Antsygin, V.D.; Kaplun, A.B.; Mamrashev, A.A.; Nikolaev, N.A.; Potaturkin, O.I. Terahertz optical properties of potassium titanyl phosphate crystals. Opt. Express 2014, 22, 25436–25443. [Google Scholar] [CrossRef] [PubMed]
  44. Wu, M.-H.; Chiu, Y.-C.; Wang, T.-D.; Zhao, G.; Zukauskas, A.; Laurell, F.; Huang, Y.-C. Terahertz parametric generation and amplification from potassium titanyl phosphate in comparison with lithium niobate and lithium tantalate. Opt. Express 2016, 24, 25964–25973. [Google Scholar] [CrossRef] [PubMed]
  45. Li, Z.; Wang, S.; Wang, M.; Wang, W. Terahertz generation based on cascaded difference frequency generation with periodically-poled KTiOPO4. Curr. Opt. Photonics 2017, 1, 138–142. [Google Scholar] [CrossRef]
  46. Nikogosyan, D.N. Nonlinear Optical Crystals: A Complete Survey; Springer Science & Business Media: New York, NY, USA, 2005; p. 405. [Google Scholar]
  47. Andreev, Y.M.; Arapov, Y.D.; Grechin, S.G.; Kasyanov, I.V.; Nikolaev, P.P. Functional possibilities of nonlinear crystals for frequency conversion: uniaxial crystals. Quantum Electron. 2016, 46, 33–38. [Google Scholar] [CrossRef]
  48. Andreev, Y.M.; Arapov, Y.D.; Grechin, S.G.; Kasyanov, I.V.; Nikolaev, P.P. Functional possibilities of nonlinear crystals for laser frequency conversion: Biaxial crystals. Quantum Electron. 2016, 46, 995–1001. [Google Scholar] [CrossRef]
  49. Kato, K.; Takaoka, E. Sellmeier and thermo-optic dispersion formulas for KTP. Appl. Opt. 2002, 41, 5040–5044. [Google Scholar] [CrossRef] [PubMed]
  50. Kato, K. Temperature insensitive SHG at 0,531 μm in KTP. IEEE J. Quant. Electron. 1992, 28, 1974–1976. [Google Scholar] [CrossRef]
  51. Mikami, T.; Okamoto, T.; Kato, K. Sellmeier and thermo-optic dispersion formulas for RbTiOPO4. Opt. Mater. 2009, 31, 1628–1630. [Google Scholar] [CrossRef]
  52. Kato, K.; Takaoka, E.; Umemura, N. Thermo-optic dispersion formula for RbTiOAsO4. Jpn. J. Appl. Phys. 2003, 42, 6420–6423. [Google Scholar] [CrossRef]
  53. Kato, K.; Umemura, N. Sellmeier and thermo-optic dispersion formulas for KTiOAsО4. In Proceedings of the Conference on Lasers and Electro-Optics, San Jose, CA, USA, 4–9 May 2008; Optical Society of America: Washington, DC, USA, 2008. [Google Scholar]
  54. Mikami1, T.; Okamoto, T.; Kato, K. Sellmeier and thermo-optic dispersion formulas for CsTiOAsO4. J. Appl. Phys. 2011, 109, 023108. [Google Scholar] [CrossRef]
  55. Jacco, J.C.; Loiacono, G.M.; Jaso, M.; Mizell, G.; Greenberg, B. Flux growth and properties of KTiOPO4. J. Cryst. Growth 1984, 70, 484–488. [Google Scholar] [CrossRef]
  56. Gashurov, G.; Belt, R.F. Growth of KTP. In Tunable Solid State Lasers for Remote Sensing, Proceedings of the NASA Conference Stanford University, Stanford, CA, USA, 1–3 October 1984; Byer, R.L., Gustafson, E.K., Trebino, R., Eds.; Springer: New York, NY, USA, 1985; p. 119. [Google Scholar]
  57. Laudise, R.A.; Cava, R.J.; Caporaso, A.J. Phase relations, solubility and growth of potassium titanyl Phosphate, KTP. J. Cryst. Growth 1986, 74, 275–280. [Google Scholar] [CrossRef]
  58. Ballman, A.A.; Brown, H.; Olson, D.H.; Rice, C.E. Growth of potassiuim titanyl phosphate (KTP) from molten tungstate melts. J. Cryst. Growth 1986, 75, 390–394. [Google Scholar] [CrossRef]
  59. Bordui, P.F.; Jacco, J.C.; Loiacono, G.M.; Stolzenberger, R.A.; Zola, J.J. Growth of large single crystals of KTiOPO4 (KTP) from high-temperature solution using heat pipe based furnace system. J. Cryst. Growth 1987, 84, 403–408. [Google Scholar] [CrossRef]
  60. Voronkova, V.I.; Yanovskii, V.K. Flux growth and properties of the KTiOPO4 family crystals. Neorg. Mater. 1988, 24, 273–277. [Google Scholar]
  61. Sasaki, T.; Miyamoto, A.; Yokotani, A.; Nakai, S. Growth and optical characterization of large potassium titanyl phosphate crystals. J. Cryst. Growth 1993, 128, 950–955. [Google Scholar] [CrossRef]
  62. Orlova, E.I.; Kharitonova, E.P.; Novikova, N.E.; Verin, I.A.; Alekseeva, O.A.; Sorokina, N.I.; Voronkova, V.I. Synthesis, properties, and structure of potassium titanyl phosphate single crystals doped with hafnium. Crystallogr. Rep. 2010, 55, 404–411. [Google Scholar] [CrossRef]
  63. Alford, W.J.; Smith, A.V. Wavelength variation of the second-order nonlinear coefficients of KNbO3, KTiOPO4, KTiOAsO4, LiNbO3, LiIO3, β-BaB2O4, KH2PO4, and LiB3O5 crystals: A test of Miller wavelength scaling. J. Opt. Soc. Am. B 2001, 18, 524–533. [Google Scholar] [CrossRef]
  64. Pack, M.V.; Armstrong, D.J.; Smith, A.V. Measurement of the χ(2) tensors of KTiOPO4, KTiOAsO4, RbTiOPO4, and RbTiOAsO4 crystals. Appl. Opt. 2004, 43, 3319–3323. [Google Scholar] [CrossRef] [PubMed]
  65. Grechin, S.G.; Grechin, S.S.; Dmitriev, V.G. Complete classification of interaction types for the second-harmonic generation in biaxial nonlinear crystals. Quantum Electron. 2000, 30, 377–386. [Google Scholar] [CrossRef]
  66. Grechin, S.G.; Grechin, S.S. Phase matching and frequency-noncritical interactions upon frequency conversion of femtosecond pulses. Quantum Electron. 2006, 36, 45–50. [Google Scholar] [CrossRef]
  67. Baumert, J.C.; Schellenberg, F.M.; Lenth, W.; Risk, W.P.; Bjorklund, G.C. Generation of blue cw coherent radiation by sum frequency mixing in KTiOPO4. Appl. Phys. Lett. 1987, 51, 2192–2194. [Google Scholar] [CrossRef]
  68. Risk, W.P.; Payne, R.N.; Lenth, W.; Harder, C.; Meier, H. Noncritically phase-matched frequency doubling using 994 nm dye laser and diode laser radiation in KTiOPO4. Appl. Phys. Lett. 1989, 55, 1179–1181. [Google Scholar] [CrossRef]
  69. Kishimoto, T.; Imamura, K.; Ito, M. Temperature stable SHG of Nd:YAG laser by KTiOPO4. Ann. Meet. Jpn. Soc. Appl. Phys. 1991, 29PB–11. [Google Scholar]
  70. Grechin, S.G.; Dmitriev, V.G.; Dyakov, V.A.; Pryalkin, V.I. Anomalously temperature-noncritical phase matching in frequency conversion in nonlinear crystals. Quantum Electron. 1998, 28, 937–938. [Google Scholar] [CrossRef]
  71. Grechin, S.G.; Dmitriev, V.G.; Dyakov, V.A.; Pryalkin, V.I. Temperature-independent phase matching for second-harmonic generation in a KTP crystal. Quantum Electron. 1999, 29, 77–91. [Google Scholar] [CrossRef]
  72. Grechin, S.G.; Dmitriev, V.G.; Dyakov, V.A.; Pryalkin, V.I. Temperature noncritical processes for propagated in optical crystals laser radiation. Bull. Russ. Acad. Sci. Phys. 2002, 66, 1103–1107. [Google Scholar]
  73. Grechin, S.G.; Dmitriev, V.G.; Dyakov, V.A.; Pryalkin, V.I. Dispersion of the temperature-noncritical frequency conversion and birefringence in biaxial optical crystals. Quantum Electron. 2004, 34, 461–466. [Google Scholar] [CrossRef]
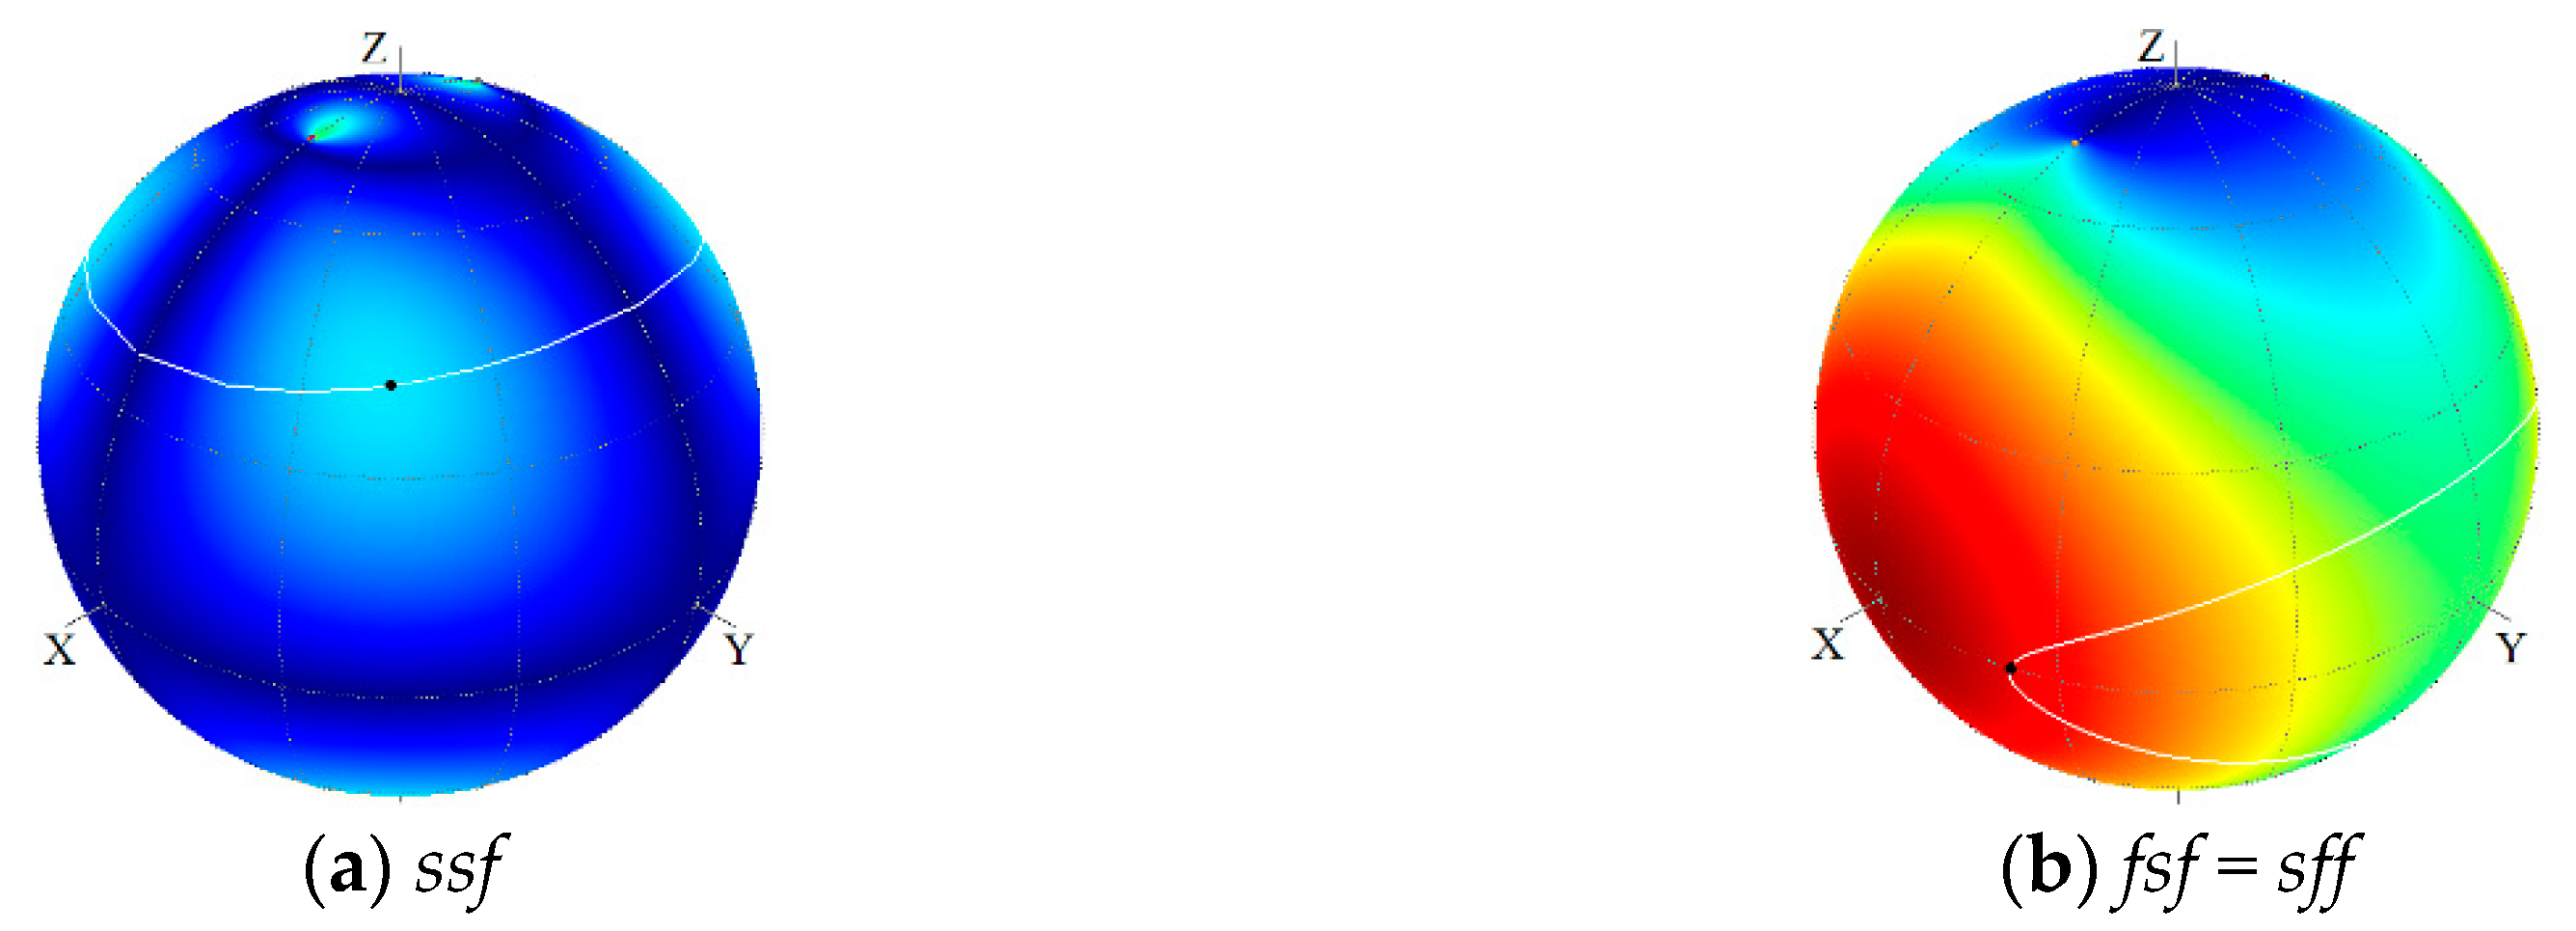
Figure 1. Distribution of deff(ϕ, θ) and phase-matching directions for SHG in KTP crystal: (a) ssf-, and (b) sff = fsf types of interactions.
Crystals 08 00386 g001
Figure 2. FOMD1, λ2) distributions for KTP crystal for all types of interactions: (a) ssf, (b) fsf, (c) sff.
Crystals 08 00386 g002
Figure 3. Distributions of phase-matching angle θ and deff coefficient versus wavelength for SHG in KTP crystal with (sff) = (fsf) type of interaction.
Crystals 08 00386 g003
Figure 4. Distributions FOMD1, λ2) for KTP crystal with FNCPM.
Crystals 08 00386 g004
Figure 5. Dependence of spectral width versus wavelength for SHG in xy plane.
Crystals 08 00386 g005
Figure 6. Distributions FOMD1, λ2) for KTP crystal with FNCPM for pulse with λ1.
Crystals 08 00386 g006
Figure 7. FOMD1, λ2) distributions for RTP crystal for all types of interactions: (a) ssf, (b) fsf, (c) sff.
Crystals 08 00386 g007
Figure 8. FOMD1, λ2) distributions for KTA crystal for all types of interactions: (a) ssf, (b) fsf, (c) sff.
Crystals 08 00386 g008
Figure 9. FOMD1, λ2) distributions for RTA crystal for all types of interactions: (a) ssf, (b) fsf, (c) sff.
Crystals 08 00386 g009
Figure 10. FOMD1, λ2) distributions for CTA crystal for all types of interactions: (a) ssf, (b) fsf, (c) sff.
Crystals 08 00386 g010
Figure 11. Angular dependencies of PhM and TNCI directions for SHG in KTP crystal at different wavelengths for (ac): ssf, and (df): sff types of interactions.
Crystals 08 00386 g011
Figure 12. FOMT1, λ2) distributions for KTP crystal for all types of interactions: (a) ssf, (b) fsf, (c) sff.
Crystals 08 00386 g012
Figure 13. FOMT1, λ2) distributions for RTP crystal for all types of interactions: (a) ssf, (b) fsf, (c) sff.
Crystals 08 00386 g013
Figure 14. FOMT1, λ2) distributions for KTA crystal for all types of interactions: (a) ssf, (b) fsf, (c) sff.
Crystals 08 00386 g014
Figure 15. FOMT (λ1, λ2) distribution for RTA crystal for all types of interactions: (a) ssf, (b) fsf, (c) sff.
Crystals 08 00386 g015
Figure 16. FOMT1, λ2) distribution for СTA crystal for all types of interactions: (a) ssf, (b) fsf, (c) sff.
Crystals 08 00386 g016
Figure 17. FOMT1, λ2) distribution for KTP crystal for all types of interactions with data on dni/dT from [49]: (a) ssf, (b) fsf, (c) sff.
Crystals 08 00386 g017