Facile Low Temperature Hydrothermal Synthesis of BaTiO3 Nanoparticles Studied by In Situ X-ray Diffraction

 , ,
, ,
Abstract
:1. Introduction
2. Materials and Methods
2.1. Synthesis
2.2. Characterization
3. Results
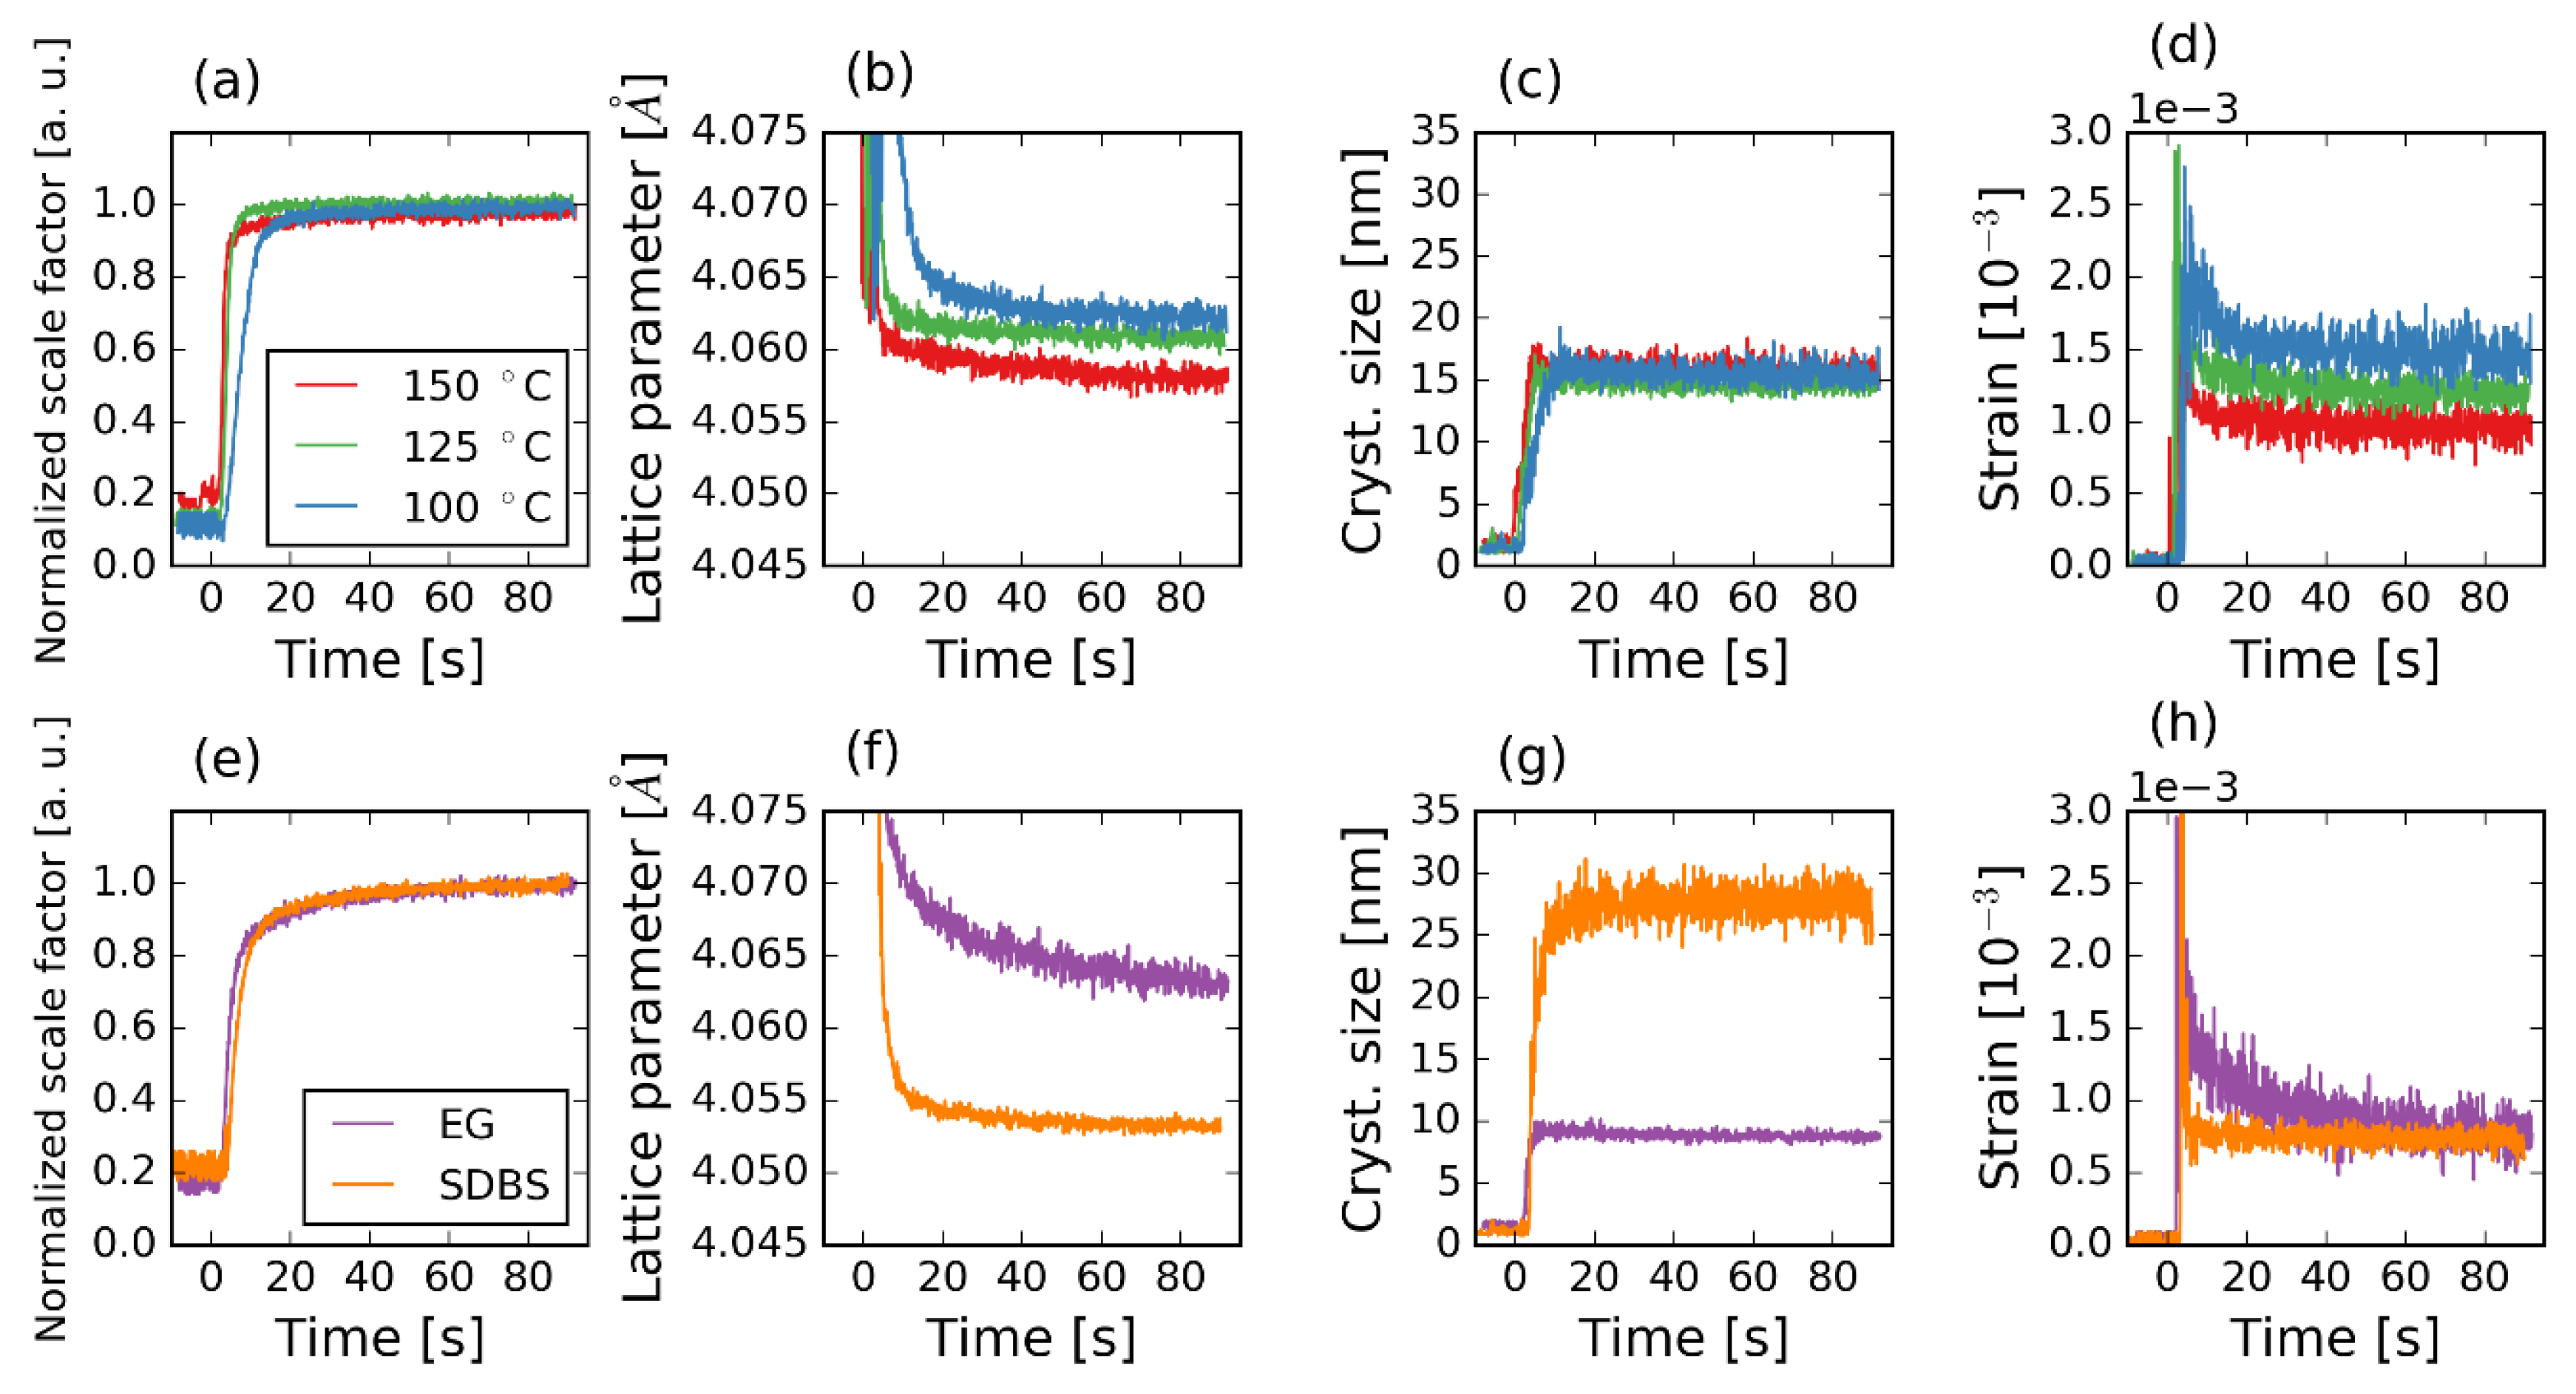
3.1. Ti-Slurry
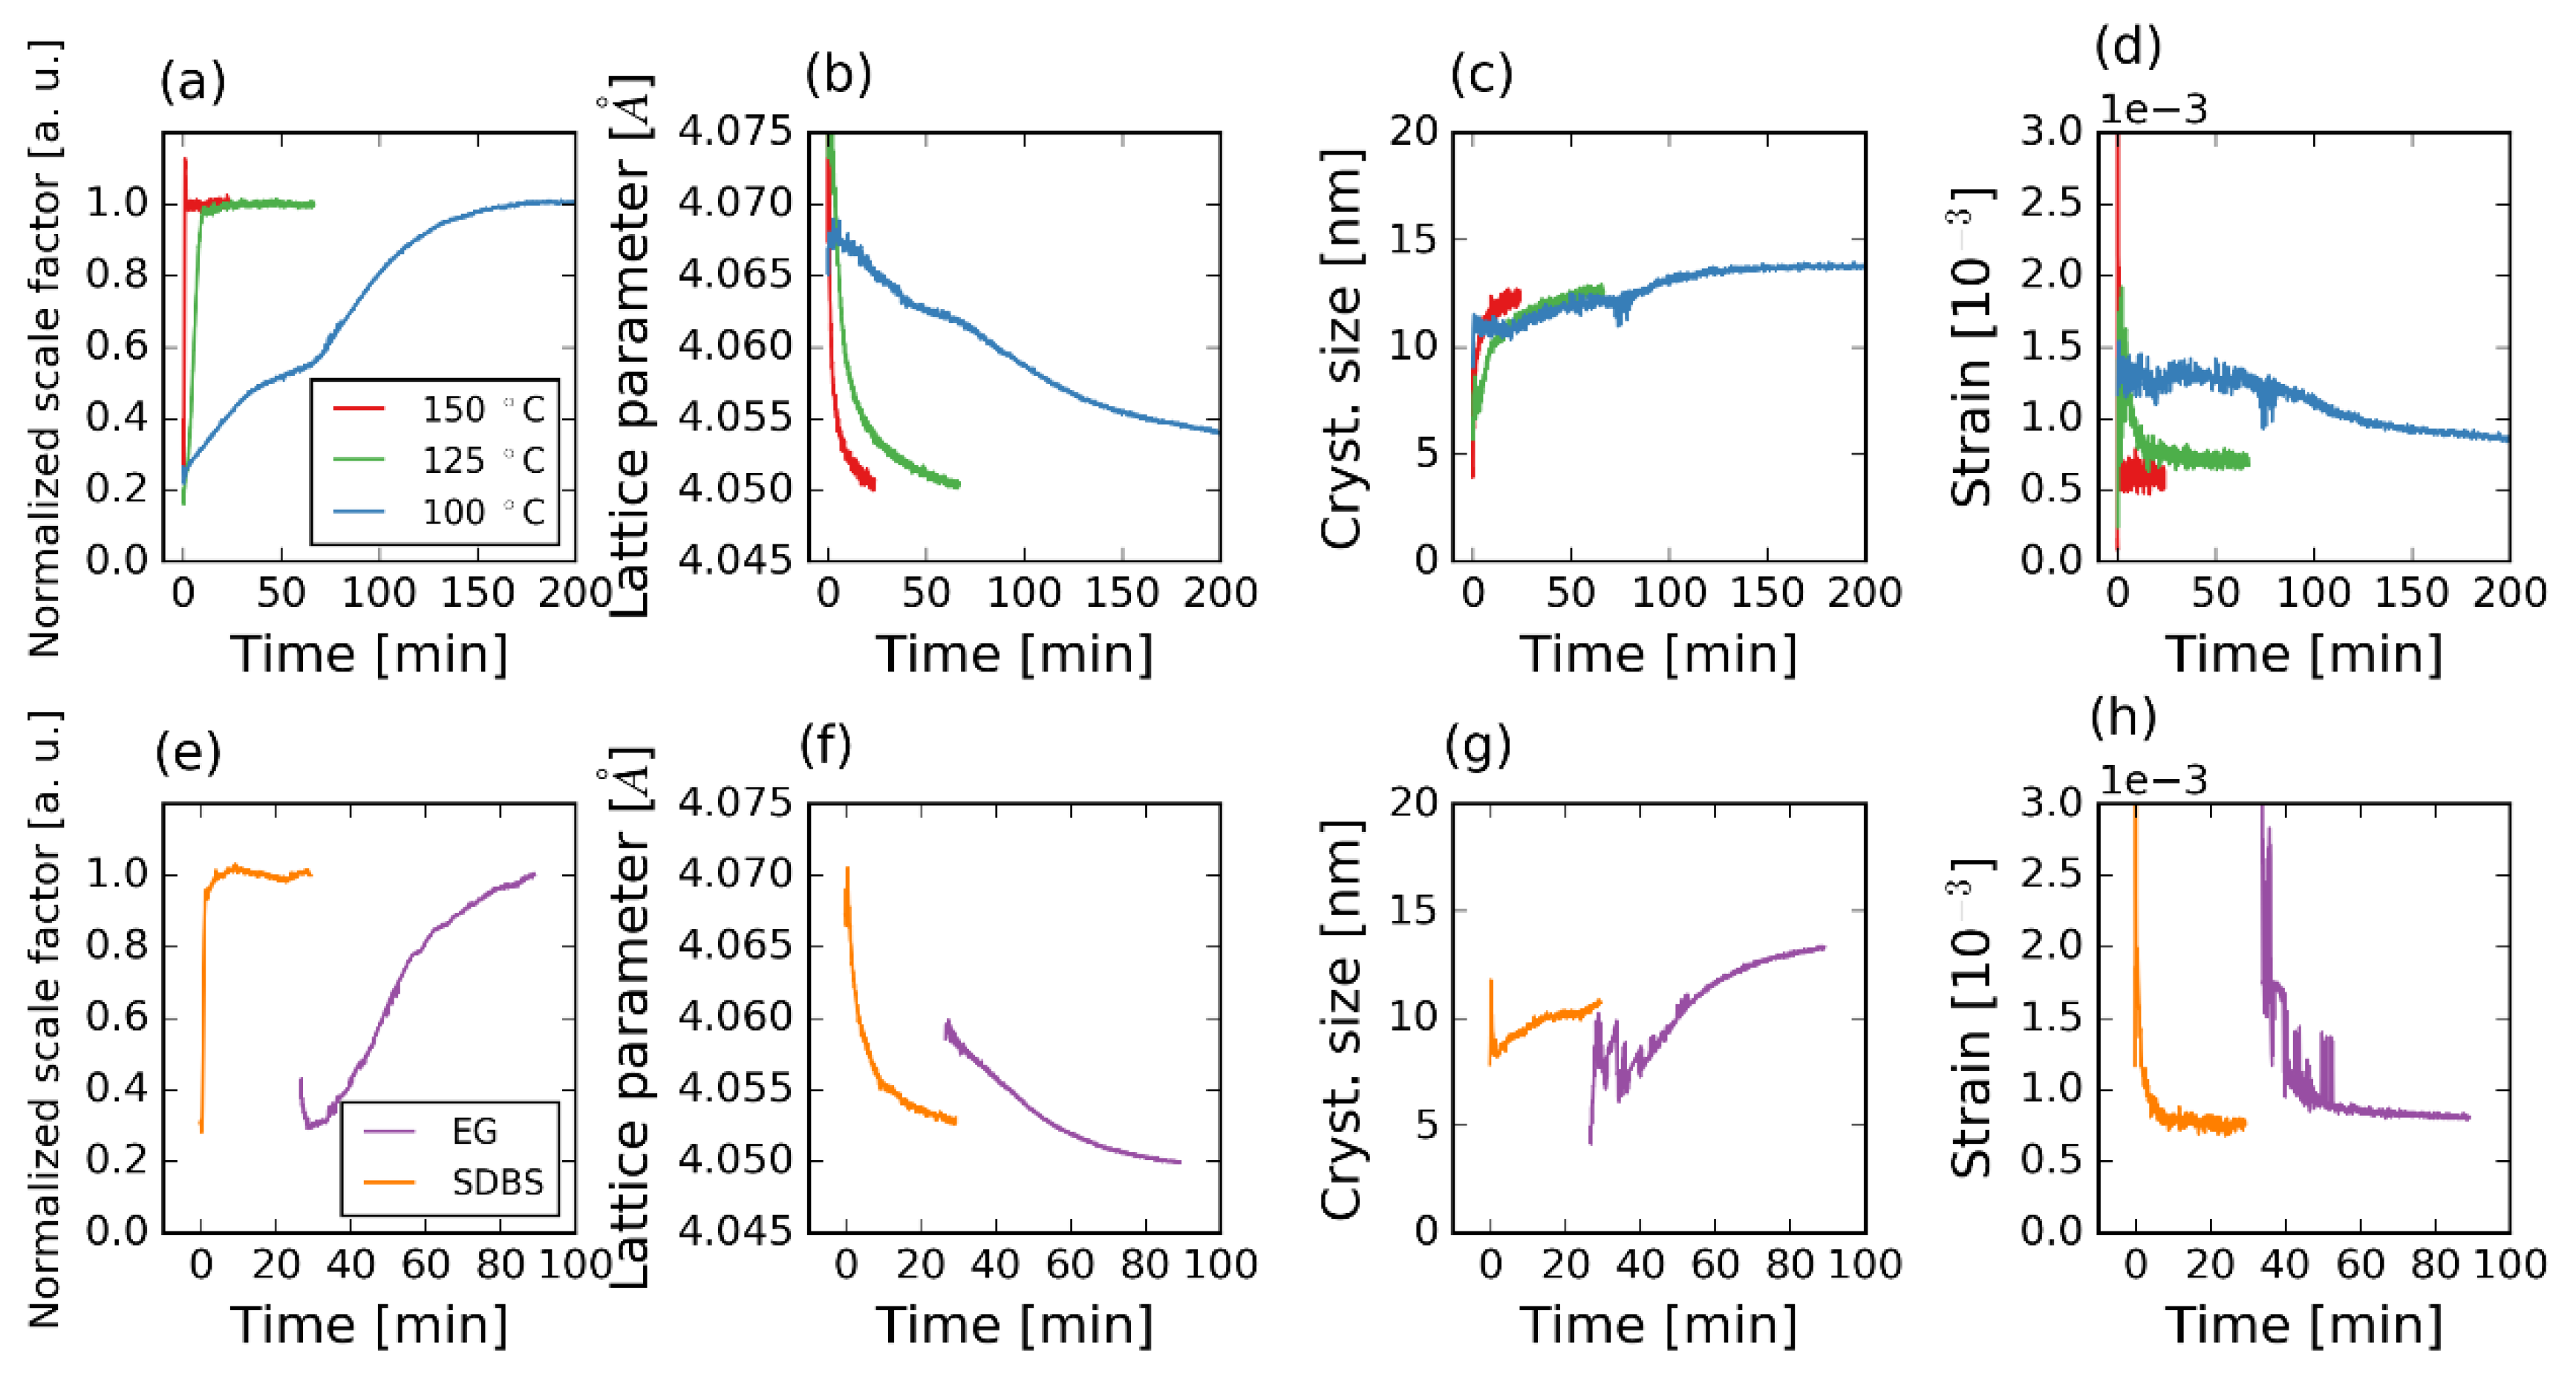
3.2. Ti-CAsol
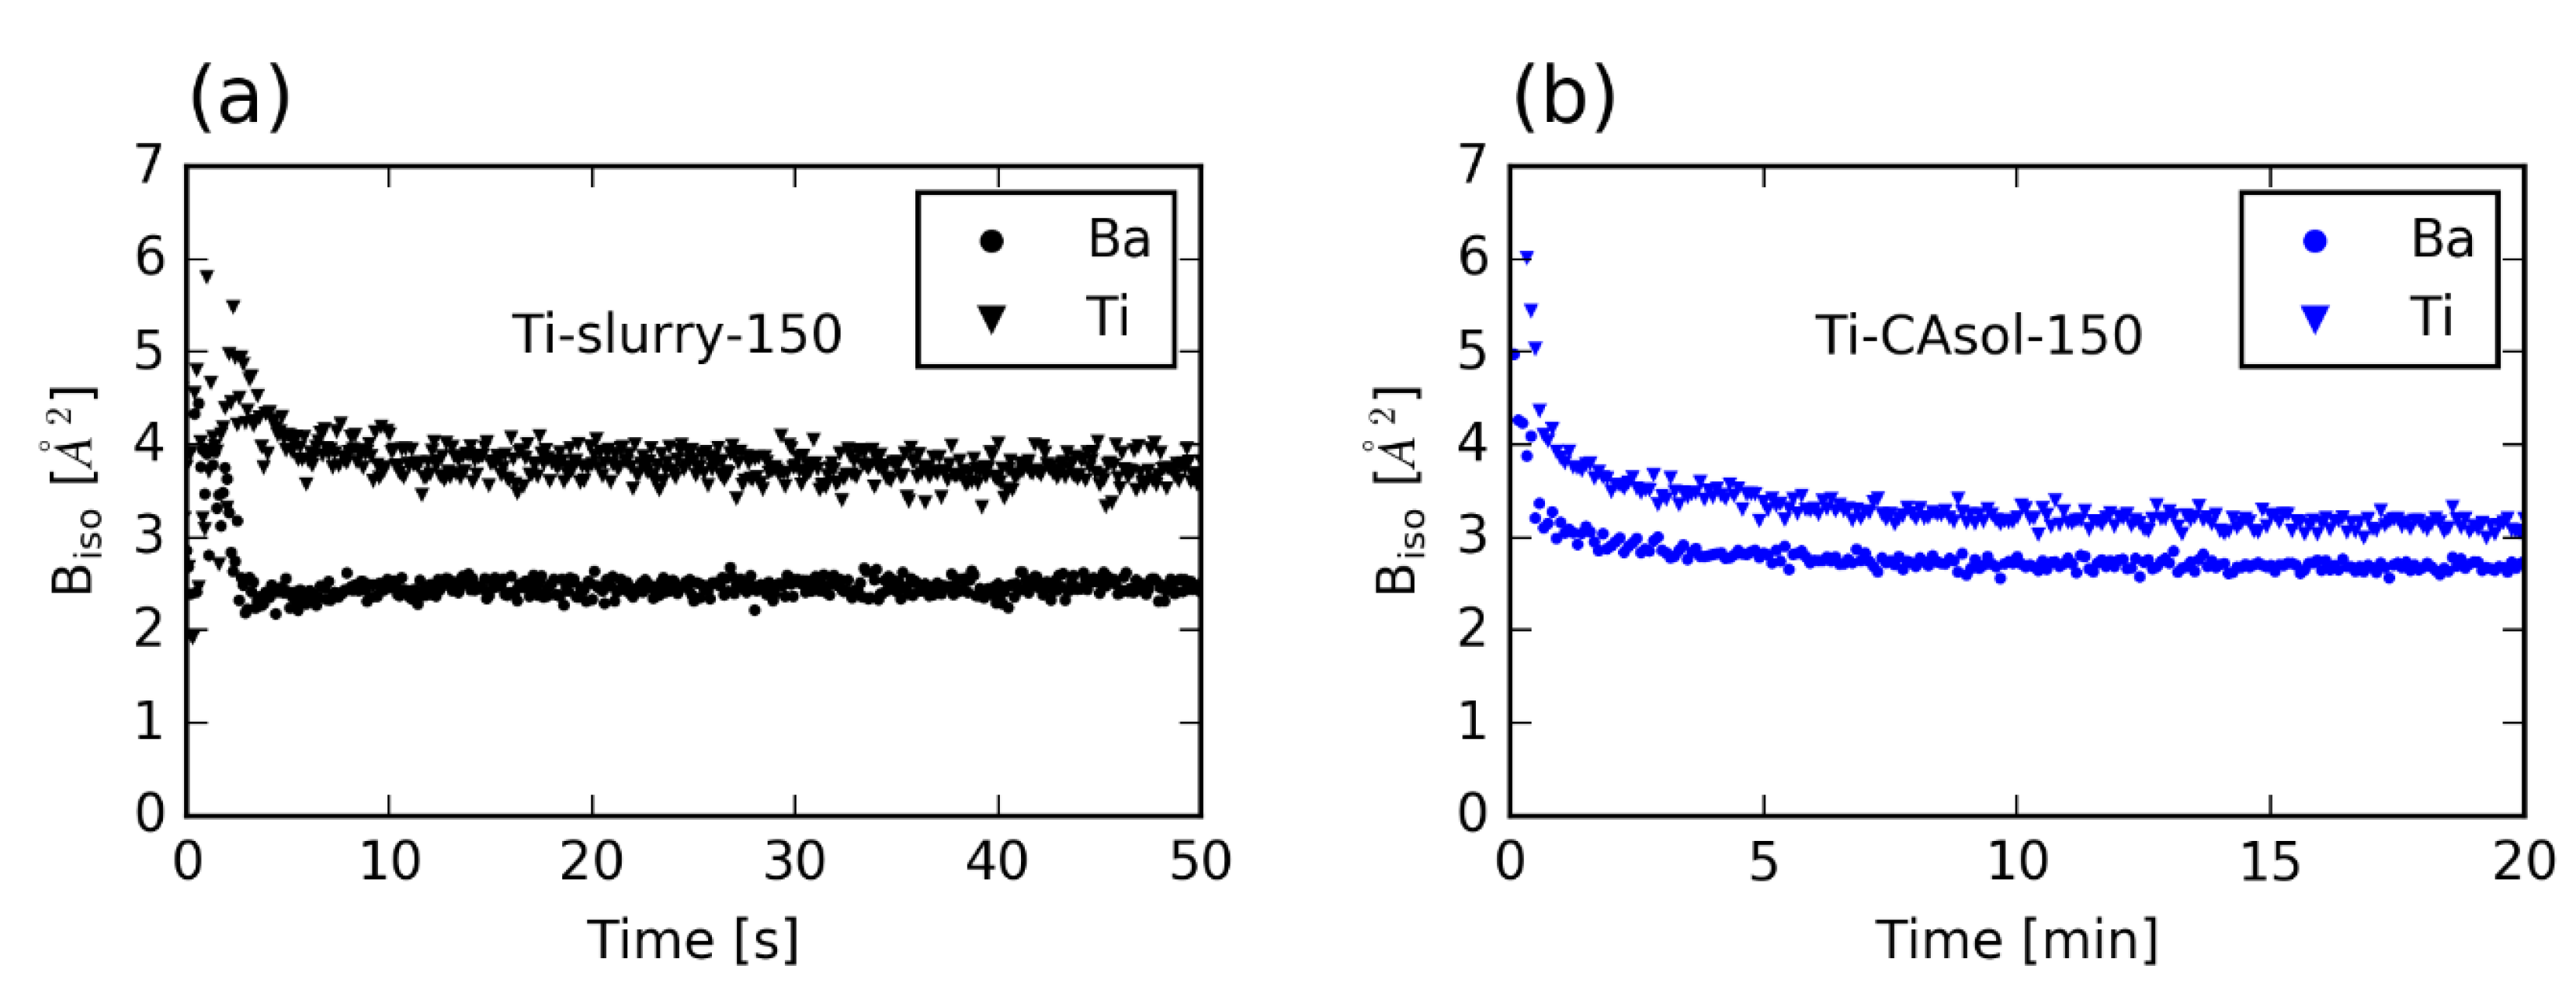
3.3. Atomic Displacement Parameters
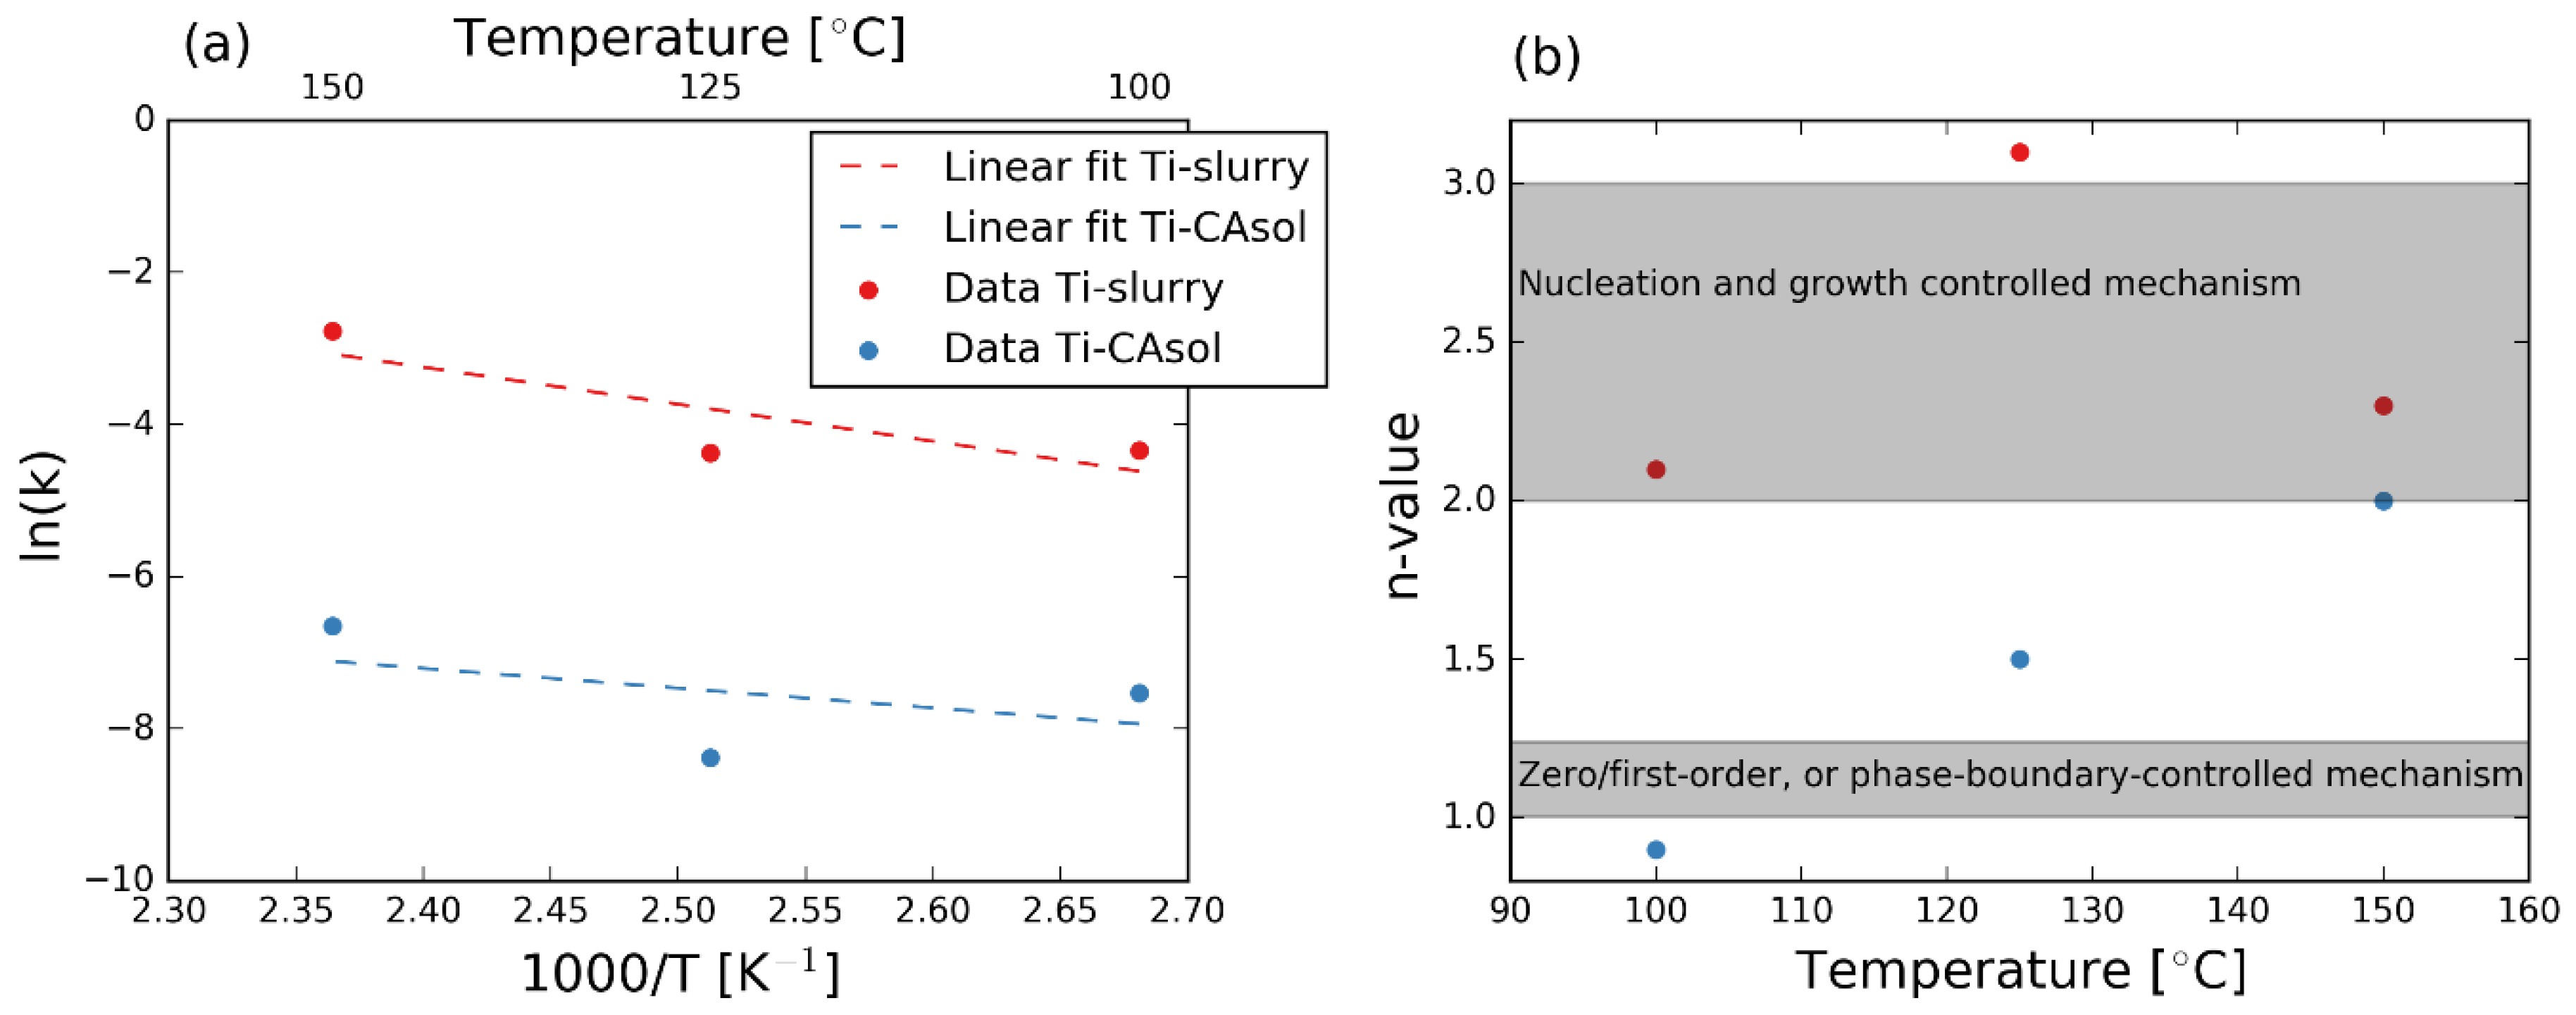
3.4. Kinetics of the Reactions
3.5. Phase Composition
4. Discussion
4.1. Kinetics
4.2. Refined Crystal Structure Parameters
4.3. Effect of Surfactants
5. Conclusions
Supplementary Materials
Author Contributions
Funding
Acknowledgments
Conflicts of Interest
References
- Varghese, J.; Whatmore, R.W.; Holmes, J.D. Ferroelectric nanoparticles, wires and tubes: Synthesis, characterisation and applications. J. Mater. Chem. C 2013, 1, 2618–2638. [Google Scholar] [CrossRef]
- Villafuerte-Castrejon, M.E.; Moran, E.; Reyes-Montero, A.; Vivar-Ocampo, R.; Pena-Jimenez, J.A.; Rea-Lopez, S.O.; Pardo, L. Towards Lead-Free Piezoceramics: Facing a Synthesis Challenge. Materials 2016, 9, 27. [Google Scholar] [CrossRef] [PubMed]
- Shandilya, M.; Rai, R.; Singh, J. Review: Hydrothermal technology for smart materials. Adv. Appl. Ceram. 2016, 115, 354–376. [Google Scholar] [CrossRef]
- Gomes, M.A.; Lima, A.S.; Eguiluz, K.I.B.; Salazar-Banda, G.R. Wet chemical synthesis of rare earth-doped barium titanate nanoparticles. J. Mater. Sci. 2016, 51, 4709–4727. [Google Scholar] [CrossRef]
- Modeshia, D.R.; Walton, R.I. Solvothermal synthesis of perovskites and pyrochlores: Crystallisation of functional oxides under mild conditions. Chem. Soc. Rev. 2010, 39, 4303–4325. [Google Scholar] [CrossRef] [PubMed]
- Sun, W.; Pang, Y.; Li, J.; Ao, W. Particle Coarsening II: Growth Kinetics of Hydrothermal BaTiO3. Chem. Mater. 2007, 19, 1772–1779. [Google Scholar] [CrossRef]
- Inada, M.; Enomoto, N.; Hayashi, K.; Hojo, J.; Komarneni, S. Facile synthesis of nanorods of tetragonal barium titanate using ethylene glycol. Ceram. Int. 2015, 41, 5581–5587. [Google Scholar] [CrossRef]
- Cai, W.; Rao, T.; Wang, A.; Hu, J.; Wang, J.; Zhong, J.; Xiang, W. A simple and controllable hydrothermal route for the synthesis of monodispersed cube-like barium titanate nanocrystals. Ceram. Int. 2015, 41, 4514–4522. [Google Scholar] [CrossRef]
- Dutta, P.K.; Gregg, J.R. Hydrothermal synthesis of tetragonal barium titanate (BaTiO3). Chem. Mater. 1992, 4, 843–846. [Google Scholar] [CrossRef]
- Li, J.; Inukai, K.; Tsuruta, A.; Takahashi, Y.; Shin, W. Synthesis of highly disperse tetragonal BaTiO3 nanoparticles with core-shell by a hydrothermal method. J. Asian Ceram. Soc. 2017, 5, 444–451. [Google Scholar] [CrossRef]
- Avrami, M. Kinetics of Phase Change. I General Theory. J. Chem. Phys. 1939, 7, 1103–1112. [Google Scholar] [CrossRef]
- Nørby, P.; Roelsgaard, M.; Søndergaard, M.; Iversen, B.B. Hydrothermal Synthesis of CoSb2O4: In Situ Powder X-ray Diffraction, Crystal Structure, and Electrochemical Properties. Cryst. Growth Des. 2016, 16, 834–841. [Google Scholar] [CrossRef]
- Andersen, H.L.; Jensen, K.M.Ø.; Tyrsted, C.; Bøjesen, E.D.; Christensen, M. Size and Size Distribution Control of γ-Fe2O3 Nanocrystallites: An in Situ Study. Cryst. Growth Des. 2014, 14, 1307–1313. [Google Scholar] [CrossRef]
- Eltzholtz, J.R.; Tyrsted, C.; Jensen, K.M.O.; Bremholm, M.; Christensen, M.; Becker-Christensen, J.; Iversen, B.B. Pulsed supercritical synthesis of anatase TiO2 nanoparticles in a water-isopropanol mixture studied by in situ powder X-ray diffraction. Nanoscale 2013, 5, 2372–2378. [Google Scholar] [CrossRef] [PubMed]
- Hertl, W. Kinetics of Barium Titanate Synthesis. J. Am. Ceram. Soc. 1988, 71, 879–883. [Google Scholar] [CrossRef]
- Eckert, J.O.; Hung-Houston, C.C.; Gersten, B.L.; Lencka, M.M.; Riman, R.E. Kinetics and Mechanisms of Hydrothermal Synthesis of Barium Titanate. J. Am. Ceram. Soc. 1996, 79, 2929–2939. [Google Scholar] [CrossRef]
- Özen, M.; Mertens, M.; Snijkers, F.; Cool, P. Hydrothermal synthesis and formation mechanism of tetragonal barium titanate in a highly concentrated alkaline solution. Ceram. Int. 2016, 42, 10967–10975. [Google Scholar] [CrossRef]
- Becker, J.; Bremholm, M.; Tyrsted, C.; Pauw, B.; Jensen, K.M.O.; Eltzholt, J.; Christensen, M.; Iversen, B.B. Experimental setup for in situ X-ray SAXS/WAXS/PDF studies of the formation and growth of nanoparticles in near- and supercritical fluids. J. Appl. Crystallogr. 2010, 43, 729–736. [Google Scholar] [CrossRef]
- Sun, Y.; Ren, Y. In Situ Synchrotron X-ray Techniques for Real-Time Probing of Colloidal Nanoparticle Synthesis. Part. Part. Syst. Charact. 2013, 30, 399–419. [Google Scholar] [CrossRef]
- Jensen, K.M.; Tyrsted, C.; Bremholm, M.; Iversen, B.B. In situ studies of solvothermal synthesis of energy materials. ChemSusChem 2014, 7, 1594–1611. [Google Scholar] [CrossRef] [PubMed]
- Walton, R.I.; Millange, F.; Smith, R.I.; Hansen, T.C.; O’Hare, D. Real time observation of the hydrothermal crystallization of barium titanate using in situ neutron powder diffraction. J. Am. Chem. Soc. 2001, 123, 12547–12555. [Google Scholar] [CrossRef] [PubMed]
- Philippot, G.; Jensen, K.M.O.; Christensen, M.; Elissalde, C.; Maglione, M.; Iversen, B.B.; Aymonier, C. Coupling in situ synchrotron radiation with ex situ spectroscopy characterizations to study the formation of Ba1−xSrxTiO3 nanoparticles in supercritical fluids. J. Supercrit. Fluids 2014, 87, 111–117. [Google Scholar] [CrossRef]
- Dyadkin, V.; Pattison, P.; Dmitriev, V.; Chernyshov, D. A new multipurpose diffractometer PILATUS@SNBL. J. Synchrotron Radiat. 2016, 23, 825–829. [Google Scholar] [CrossRef] [PubMed]
- Skjærvø, S.L.; Wells, K.H.; Sommer, S.; Vu, T.-D.; Tolchard, J.R.; van Beek, W.; Grande, T.; Iversen, B.B.; Einarsrud, M.-A. Rationalization of Hydrothermal Synthesis of NaNbO3 by Rapid in Situ Time-Resolved Synchrotron X-ray Diffraction. Cryst. Growth Des. 2018, 18, 770–774. [Google Scholar] [CrossRef]
- Dalod, A.R.M.; Grendal, O.G.; Skjærvø, S.L.; Inzani, K.; Selbach, S.M.; Henriksen, L.; van Beek, W.; Grande, T.; Einarsrud, M.-A. Controlling Oriented Attachment and in Situ Functionalization of TiO2 Nanoparticles During Hydrothermal Synthesis with APTES. J. Phys. Chem. C 2017, 121, 11897–11906. [Google Scholar] [CrossRef]
- Evans, J.S.O. Advanced Input Files & Parametric Quantitative Analysis Using Topas. Mater. Sci. Forum 2010, 650, 1–9. [Google Scholar] [CrossRef]
- Thompson, P.; Cox, D.E.; Hastings, J.B. Rietveld refinement of Debye-Scherrer synchrotron X-ray data from Al2O3. J. Appl. Crystallogr. 1987, 20, 79–83. [Google Scholar] [CrossRef]
- Dalod, A.R.M.; Henriksen, L.; Grande, T.; Einarsrud, M.-A. Functionalized TiO2 nanoparticles by single-step hydrothermal synthesis: The role of the silane coupling agents. Beilstein J. Nanotechnol. 2017, 8, 304–312. [Google Scholar] [CrossRef] [PubMed]
- Yoshiasa, A.; Nakatani, T.; Nakatsuka, A.; Okube, M.; Sugiyama, K.; Mashimo, T. High-temperature single-crystal X-ray diffraction study of tetragonal and cubic perovskite-type PbTiO3 phases. Acta Crystallogr. Sect. B 2016, 72, 381–388. [Google Scholar] [CrossRef] [PubMed]
- Peterson, K.M.; Heaney, P.J.; Post, J.E. A kinetic analysis of the transformation from akaganeite to hematite: An in situ time-resolved X-ray diffraction study. Chem. Geol. 2016, 444, 27–36. [Google Scholar] [CrossRef]
- Walton, R.I.; Norquist, A.; Smith, R.I.; O’Hare, D. Recent results from the in situ study of hydrothermal crystallisations using time-resolved X-ray and neutron diffraction methods. Faraday Discuss. 2002, 122, 331–341. [Google Scholar] [CrossRef]
- Ovramenko, N.A.; Shevts, L.I.; Ovcharenko, F.D.; Kornilovich, B.Y. Kinetics of Hydrothermal Synthesis of Barium Metatitanate. IzV. Akad. Nauk SSSR Neorg. Mater. 1979, 15, 1982–1985. [Google Scholar]
- Balzar, D.; Audebrand, N.; Daymond, M.R.; Fitch, A.; Hewat, A.; Langford, J.I.; Le Bail, A.; Louer, D.; Masson, O.; McCowan, C.N.; et al. Size-strain line-broadening analysis of the ceria round-robin sample. J. Appl. Crystallogr. 2004, 37, 911–924. [Google Scholar] [CrossRef]
- Yan, T.; Shen, Z.-G.; Zhang, W.-W.; Chen, J.-F. Size dependence on the ferroelectric transition of nanosized BaTiO3 particles. Mater. Chem. Phys. 2006, 98, 450–455. [Google Scholar] [CrossRef]
- Aoyagi, S.; Kuroiwa, Y.; Sawada, A.; Yamashita, I.; Atake, T. Composite Structure of BaTiO3 Nanoparticle Investigated by SR X-ray Diffraction. J. Phys. Soc. Jpn. 2002, 71, 1218–1221. [Google Scholar] [CrossRef]
- He, Y. Heat capacity, thermal conductivity, and thermal expansion of barium titanate-based ceramics. Thermochim. Acta 2004, 419, 135–141. [Google Scholar] [CrossRef]
- Wang, G.Z.; Yu, Y.D.; Grande, T.; Einarsrud, M.A. Synthesis of KNbO3 Nanorods by Hydrothermal Method. J. Nanosci. Nanotechnol. 2009, 9, 1465–1469. [Google Scholar] [CrossRef] [PubMed]
- Wang, G.; Rørvik, P.M.; van Helvoort, A.T.J.; Holmestad, R.; Grande, T.; Einarsrud, M.-A. Self-Assembled Growth of PbTiO3 Nanoparticles into Microspheres and Bur-like Structures. Chem. Mater. 2007, 19, 2213–2221. [Google Scholar] [CrossRef]


| Name a | Temperature [°C] | Pressure [bar] | EG | SDBS | Wavelength b [Å] | Time Resolution c [s] | Final Product |
|---|---|---|---|---|---|---|---|
| Ti-slurry-100 | 100 | 200 | no | no | 0.7242 | 0.1 | BT |
| Ti-slurry-125 | 125 | 200 | no | no | 0.7242 | 0.1 | BT |
| Ti-slurry-150 | 150 | 200 | no | no | 0.7242 | 0.1 | BT |
| Ti-slurry-EG | 125 | 200 | yes | no | 0.7242 | 0.1 | BT |
| Ti-slurry-SDBS | 125 | 200 | no | yes | 0.7762 | 0.1 | BT |
| Ti-CAsol-100 | 100 | 200 | no | no | 0.7129 | 10 | BT + BC |
| Ti-CAsol-125 | 125 | 200 | no | no | 0.7129 | 5 | BT |
| Ti-CAsol-150 | 150 | 200 | no | no | 0.7129 | 5 | BT |
| Ti-CAsol-EG | 125 | 200 | yes | no | 0.7242 | 5 | BT + BC |
| Ti-CAsol-SDBS | 125 | 200 | no | yes | 0.7129 | 5 | BT |
| Sample | k [s−1] | n a | R2 [a.u.] | Ea [kJ/mol] |
|---|---|---|---|---|
| Ti-slurry-100 | 0.0130(6) | 2.1 | 0.99 | 41 |
| Ti-slurry-125 | 0.0126(6) | 3.1 | 0.99 | |
| Ti-slurry-150 | 0.063(5) | 2.3 | 0.97 | |
| Ti-CAsol-100 | 0.00054(6) | 0.9 | 0.97 | 22 |
| Ti-CAsol-125 | 0.00023(3) | 1.5 | 0.99 | |
| Ti-CAsol-150 | 0.0013(4) | 2.0 | 0.93 |
© 2018 by the authors. Licensee MDPI, Basel, Switzerland. This article is an open access article distributed under the terms and conditions of the Creative Commons Attribution (CC BY) license (http://creativecommons.org/licenses/by/4.0/).
Share and Cite
Grendal, O.G.; Blichfeld, A.B.; Skjærvø, S.L.; Van Beek, W.; Selbach, S.M.; Grande, T.; Einarsrud, M.-A. Facile Low Temperature Hydrothermal Synthesis of BaTiO3 Nanoparticles Studied by In Situ X-ray Diffraction. Crystals 2018, 8, 253. https://doi.org/10.3390/cryst8060253
Grendal OG, Blichfeld AB, Skjærvø SL, Van Beek W, Selbach SM, Grande T, Einarsrud M-A. Facile Low Temperature Hydrothermal Synthesis of BaTiO3 Nanoparticles Studied by In Situ X-ray Diffraction. Crystals. 2018; 8(6):253. https://doi.org/10.3390/cryst8060253
Chicago/Turabian StyleGrendal, Ola G., Anders B. Blichfeld, Susanne L. Skjærvø, Wouter Van Beek, Sverre M. Selbach, Tor Grande, and Mari-Ann Einarsrud. 2018. "Facile Low Temperature Hydrothermal Synthesis of BaTiO3 Nanoparticles Studied by In Situ X-ray Diffraction" Crystals 8, no. 6: 253. https://doi.org/10.3390/cryst8060253
APA StyleGrendal, O. G., Blichfeld, A. B., Skjærvø, S. L., Van Beek, W., Selbach, S. M., Grande, T., & Einarsrud, M.-A. (2018). Facile Low Temperature Hydrothermal Synthesis of BaTiO3 Nanoparticles Studied by In Situ X-ray Diffraction. Crystals, 8(6), 253. https://doi.org/10.3390/cryst8060253