Anatase TiO2-Decorated Graphitic Carbon Nitride for Photocatalytic Conversion of Carbon Dioxide


1
Department of Chemical Engineering, Feng Chia University, Taichung 40724, Taiwan
2
Department of Materials Science and Engineering, Feng Chia University, Taichung 40724, Taiwan
*
Author to whom correspondence should be addressed.
Polymers 2019, 11(1), 146; https://doi.org/10.3390/polym11010146
Submission received: 7 December 2018
/
Revised: 7 January 2019
/
Accepted: 8 January 2019
/
Published: 16 January 2019
(This article belongs to the Special Issue Polymeric Photocatalysts and Gas Sensors)
Abstract
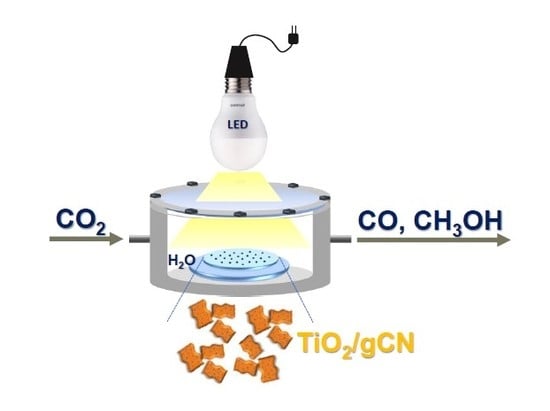
:Three types of graphitic carbon nitride (gCN) nanosheets were derived from direct thermal condensation of urea, melamine, and dicyandiamide, respectively. As the sample (uCN) synthesized from urea exhibited porous morphology and highest surface area among other gCN, anatase TiO2 nanoparticles were then in-situ deposited on uCN via solvothermal process without further calcination. The resultant Ti/uCN_x samples remained with higher surface area and exhibited visible-light activity. The derived band structure of each sample also confirmed its ability to photoreduce CO2. XPS results revealed surface compositions of each sample. Those functional groups governed adsorption of reactant, interfacial interaction, electron transfer rate, and consequently influenced the yield of products. Carbon monoxide and methanol were detected from LED-lamp illuminated samples under appropriate moisture content. Samples with higher ratio of terminal amine groups produced more CO. The presence of hydroxyl groups promoted the initial conversion of methanol. The obtained Ti/uCN_0.5 and Ti/uCN_1.5 samples exhibited better quantum efficiency toward CO2 conversion and demonstrated stability to consistently produce CO under cycling photoreaction.
1. Introduction
The polymeric semiconductor, graphitic carbon nitride (gCN), has attracted much attention due to its narrow and tunable bandgap for various photocatalytic applications [1,2,3,4,5]. Among them, artificial photosynthesis has been considered a challenging but promising and beneficial strategy to convert greenhouse gas CO2 into valuable products by using photocatalysts under sunlight [1,6,7,8]. Recently, researchers using gCN based photocatalytic system for photoreduction of CO2 have shown great progress [1,7,8,9,10,11,12,13,14,15,16,17,18,19]. To improve its photocatalytic activity, the morphology of gCN has been modified or various heterojunctions have been developed to increase surface area of gCN or to more effectively separate photoinduced charge carriers on gCN. TiO2 is the most popular photocatalyst for CO2 reduction. The presence of conductive graphitic network next to TiO2 would enhance electron–hole separation, increase the concentration of electron on the TiO2 surface, and even improve CO2 adsorption through π–π conjugation. The reaction of N–C=N with CO2 as carbamate confirmed that the gCN structure may accelerate the reduction of CO2 [20,21]. In addition, the product yield or selectivity was tunable by changing the relative ratio of gCN and TiO2 [16,17]. Even a relatively porous gCN with larger surface area showed higher photoactivity on CO2 conversion under visible light [18].
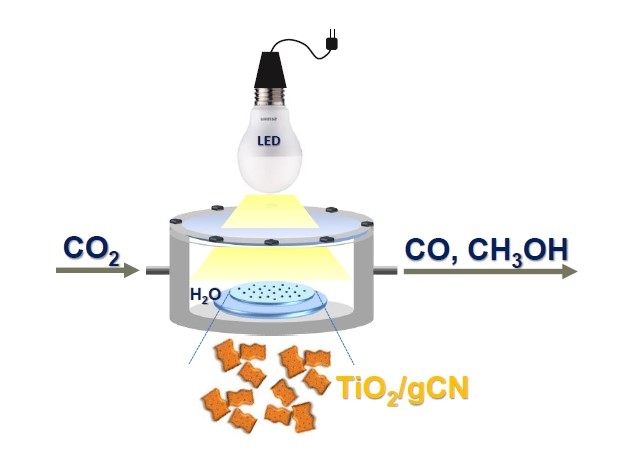
In this work, gCN was selected as the carbon-based substrate for TiO2 to evaluate its photocatalytic efficiency toward CO2 conversion under illumination by a 14-Watt LED light bulb. The anatase TiO2 nanoparticles were successfully synthesized via solvothermal process and deposited on gCN derived from different monomers. The effects of gCN chemical structures and relative TiO2 contents on the efficiency of CO2 conversion were comprehensively investigated.
2. Materials and Methods
2.1. Materials
Graphite powder (325 mesh), melamine (99%), dicyandiamide (99%) and titanium (IV) n-butoxide (TBOT, 99%) were purchased from Alfa Aesar (Lancashire, United Kingdom). Acetic acid (HAc, 99.7%), sulfuric acid (97%), hydrogen chloride (35%), and dihydrogen dioxide (30%) were provided from Showa (Saitama, Japan). n-Butanol (BtOH, 99.5%) from Scharlau (Barcelona, Spain) and urea from Uniregion Biotech (Miaoli, Taiwan) were used without further purification.
2.2. Synthesis of TiO2-Decorated gCN Nanosheets
Three types of graphitic carbon nitride, mCN, uCN, and dCN, were synthesized from the pyrolysis of melamine, urea, and dicyandiamide, respectively, from room temperature, at a rate of 6 °C/min, to 550 °C maintaining at 550 °C for further 3 h. According to the characterization results, an adequate amount (0.25–2.00 g) of uCN was selected and dispersed in n-butanol with the assistance of ultrasonication, followed by the addition of 4.27 mL titanium butoxide (TBOT) and adequate acetic acid. TBOT was then hydrolyzed by stoichiometric amounts of slowly released water from esterification of n-butanol and acetic acid. The well-mixed 50-mL solution was placed in a 100-mL Teflon-lined stainless-steel autoclave and maintained at 180 °C for 12 h. During the solvothermal process, the produced titanium hydroxide could react with the amine groups on uCN to anchor titania nanoparticles. After centrifugation, the obtained precipitate was washed with ethanol several times and followed by freeze-drying to acquire TiO2-decorated gCN. The sample name was denoted T-uCN-x, where x, ranging from 0.25 to 2, indicates the mass ratio of uCN to theoretical TiO2 mass converting from added TBOT amount.
2.3. Characterization
The crystalline structure of synthesized nanosheets were determined by an X-ray diffractometer (XRD, D8SSS, BRUKER, Billerica, MA, USA) using Cu Kα radiation (λ = 0.154 nm) at an accelerating voltage of 40 kV and current of 30 mA to study the crystalline structure of powders. An X-ray photoelectron spectrometer (XPS, PHI5000, ULVAC-PHI, Kanagawa, Japan) was used to probe the surface composition of samples. The field emission scanning electron microscope (SEM, JSM-7401F, JEOL, Tokyo, Japan) was performed at an acceleration voltage of 15 kV to observe the morphology of nanoparticles. The field emission transmission electron microscope (TEM, JEM-2100F, JEOL, Tokyo, Japan) equipped with EDS (X-MAX, OXFORD INSTRUMENT, Abingdon, United Kingdom) was also applied at an acceleration voltage of 200 kV to observe the morphology of carbon nanosheets and the dispersion of TiO2. The UV-VIS diffuse reflectance spectra of powder samples were acquired on a spectrophotometer (F-7000, HITACHI, Tokyo, Japan) with an integrating sphere at room temperature. Thermogravimetric analysis (TGA) of each sample was carried out with a TGA-Q500 from TA INSTRUMENT (New Castle, DE, USA) at a heating rate of 20 °C/min under air. The photoluminescence (PL) of samples were measured on a fluorescence spectrophotometer (F-4500, HITACHI, Tokyo, Japan) using an excitation wavelength of 315 nm. A surface area and porosimetry analyzer (ASAP2020, MICROMERITICS, Norcross, GA, USA) was utilized to determine the BET surface area and pore size distribution of samples.
The photocatalytic reduction of CO2 was conducted in a batch reactor (100 mL) at ambient temperature. Powder sample (0.1 g) were dispersed on the bottom of a stainless-steel cylindrical reactor with the diameter of 12 cm and the height of 8 cm. A quartz window (3 cm in diameter) on the top of the reactor was designed for visible light illumination. According to manufacturer data, the luminous flux of the LED light bulb (14 W, PHILIPS, Taiwan) is 1400 lumens (lm). A luxometer (LT LUTRON, Taiwan) was utilized to measure the intensity of the visible light reaching the surface of catalysts in the reactor, which was 14,400 lux (14,400 lm/m2 or approximately 0.06 W). Another UVX radiometer (ANALYTIKJENA, Jena, Germany) equipped with UVC (254 nm) and UVA (365 nm) probes was also applied to measure UV intensity. Very weak UV intensity was detected by the probes, which was 2 μW/cm2 for UVC and 1.7 μW/cm2 for UVA. That is, the total photons (both visible and UV lights) reached the surface of catalysts were 0.02344 moles after 12 h illumination. Before illumination, the reactor was cleaned and placed in a vacuum oven at 40 °C for 1 h to remove gaseous impurity from the reactor. High purity CO2 (99.999%) was then purged through a water bubbler at room temperature into the reactor at a flowrate of 70 mL/min for 30 min. The outlet and inlet of the reactor were then closed and ready for the photoreaction. A gas chromatography (YL6500, YL INSTRUMENT, Gyeonggi-do, Korea) equipped with a highly sensitive pulsed-discharge helium ionization detector (PDHID, YL INSTRUMENT, Gyeonggi-do, Korea) was employed to analyze the products of photoreduction. The carrier gas was He, and two separation columns from Ohio Valley Specialty, including Porapack N for the detection of H2, O2, CO and CH4, and Molecular Sieve 5A for CO2, H2O and other C1–C2 hydrocarbons, were connected in series to simultaneously analyze all possible products from one injection. The volume of each injection was 1 mL of gas product withdrawn from the photoreactor by a gas-tight syringe.
3. Results and Discussion
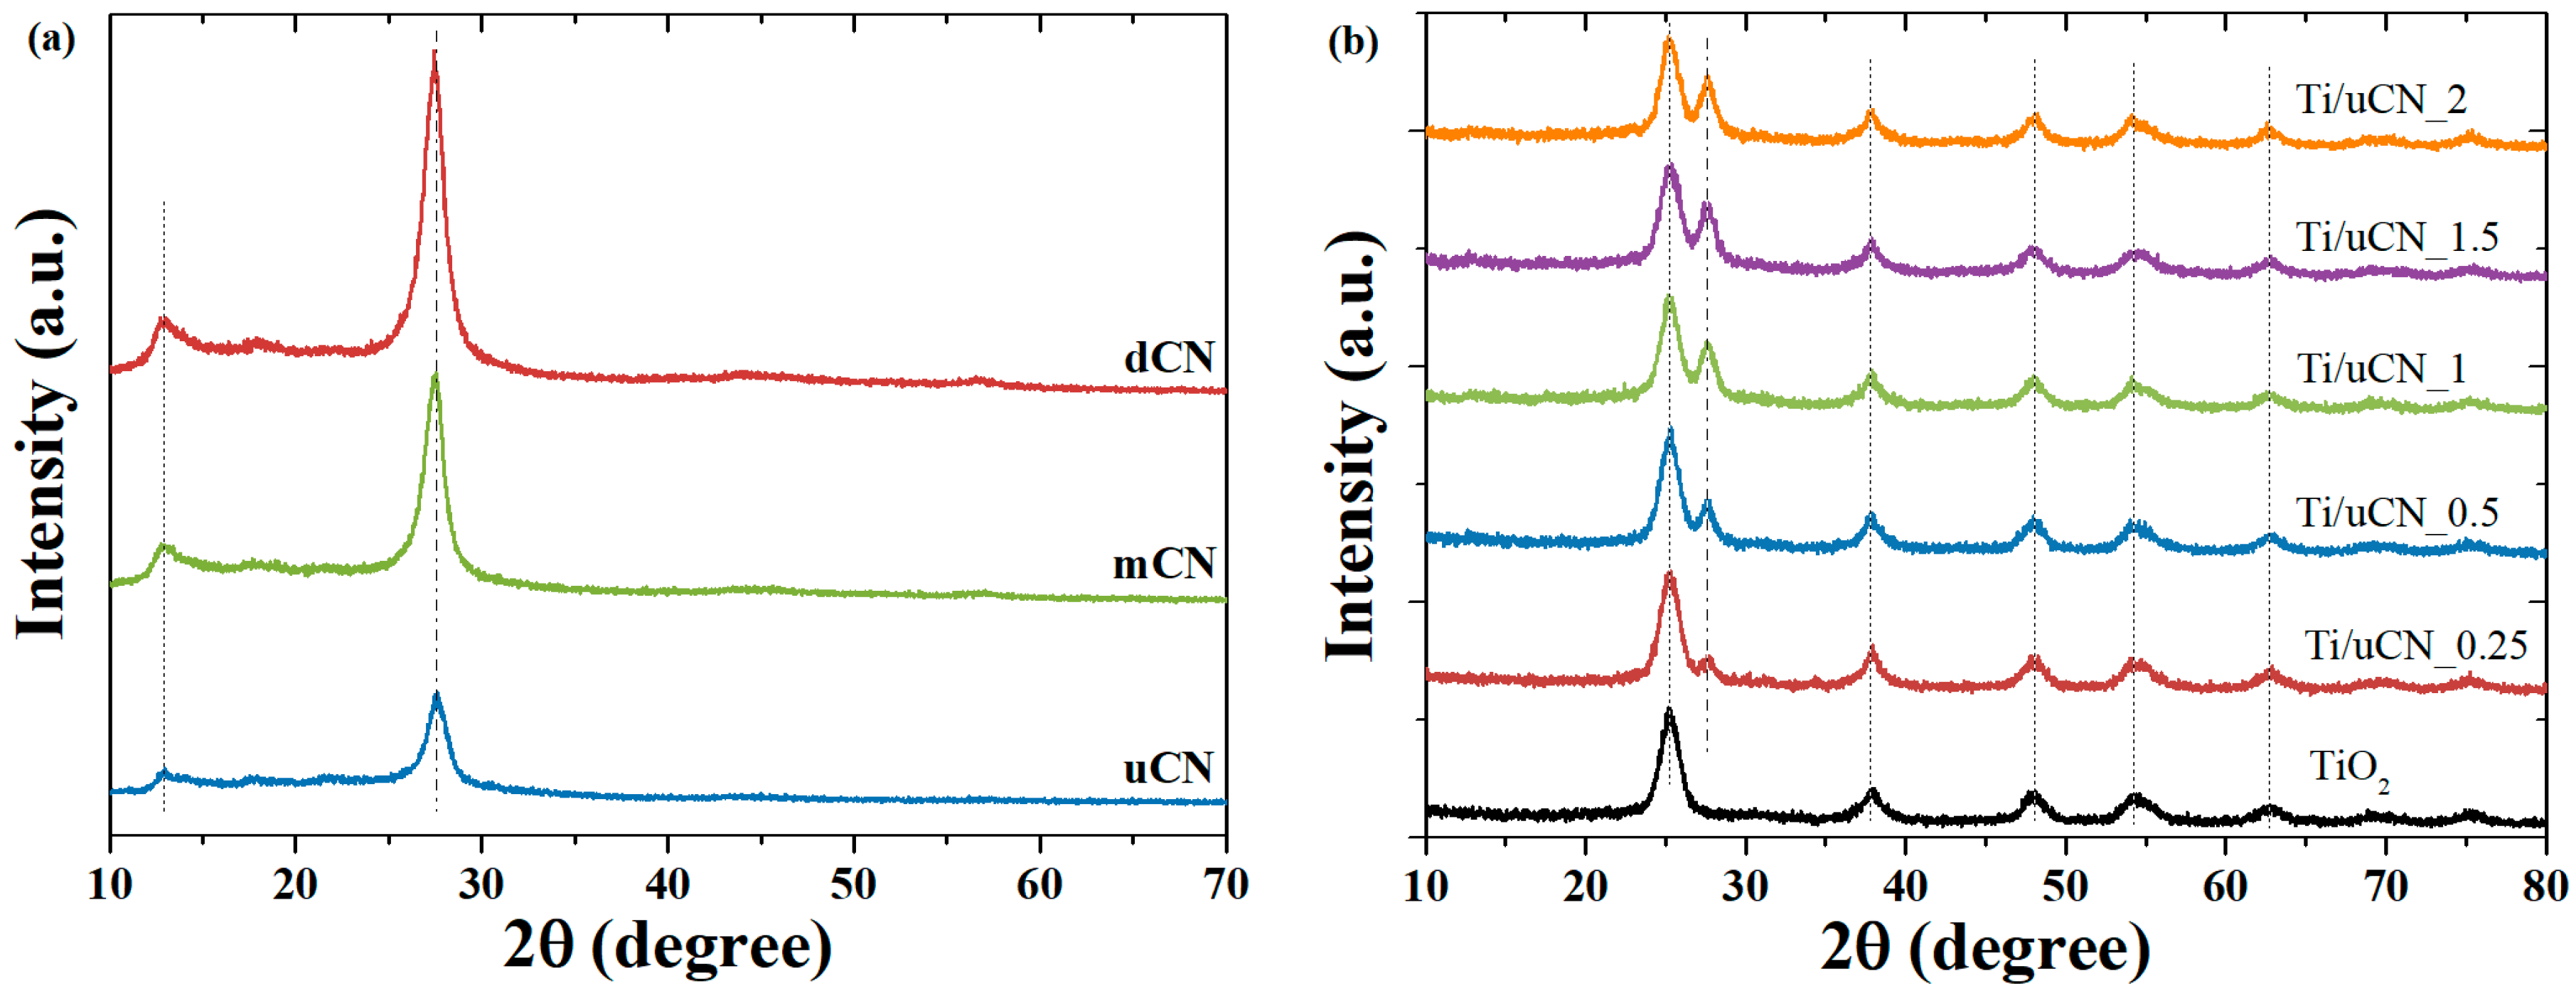
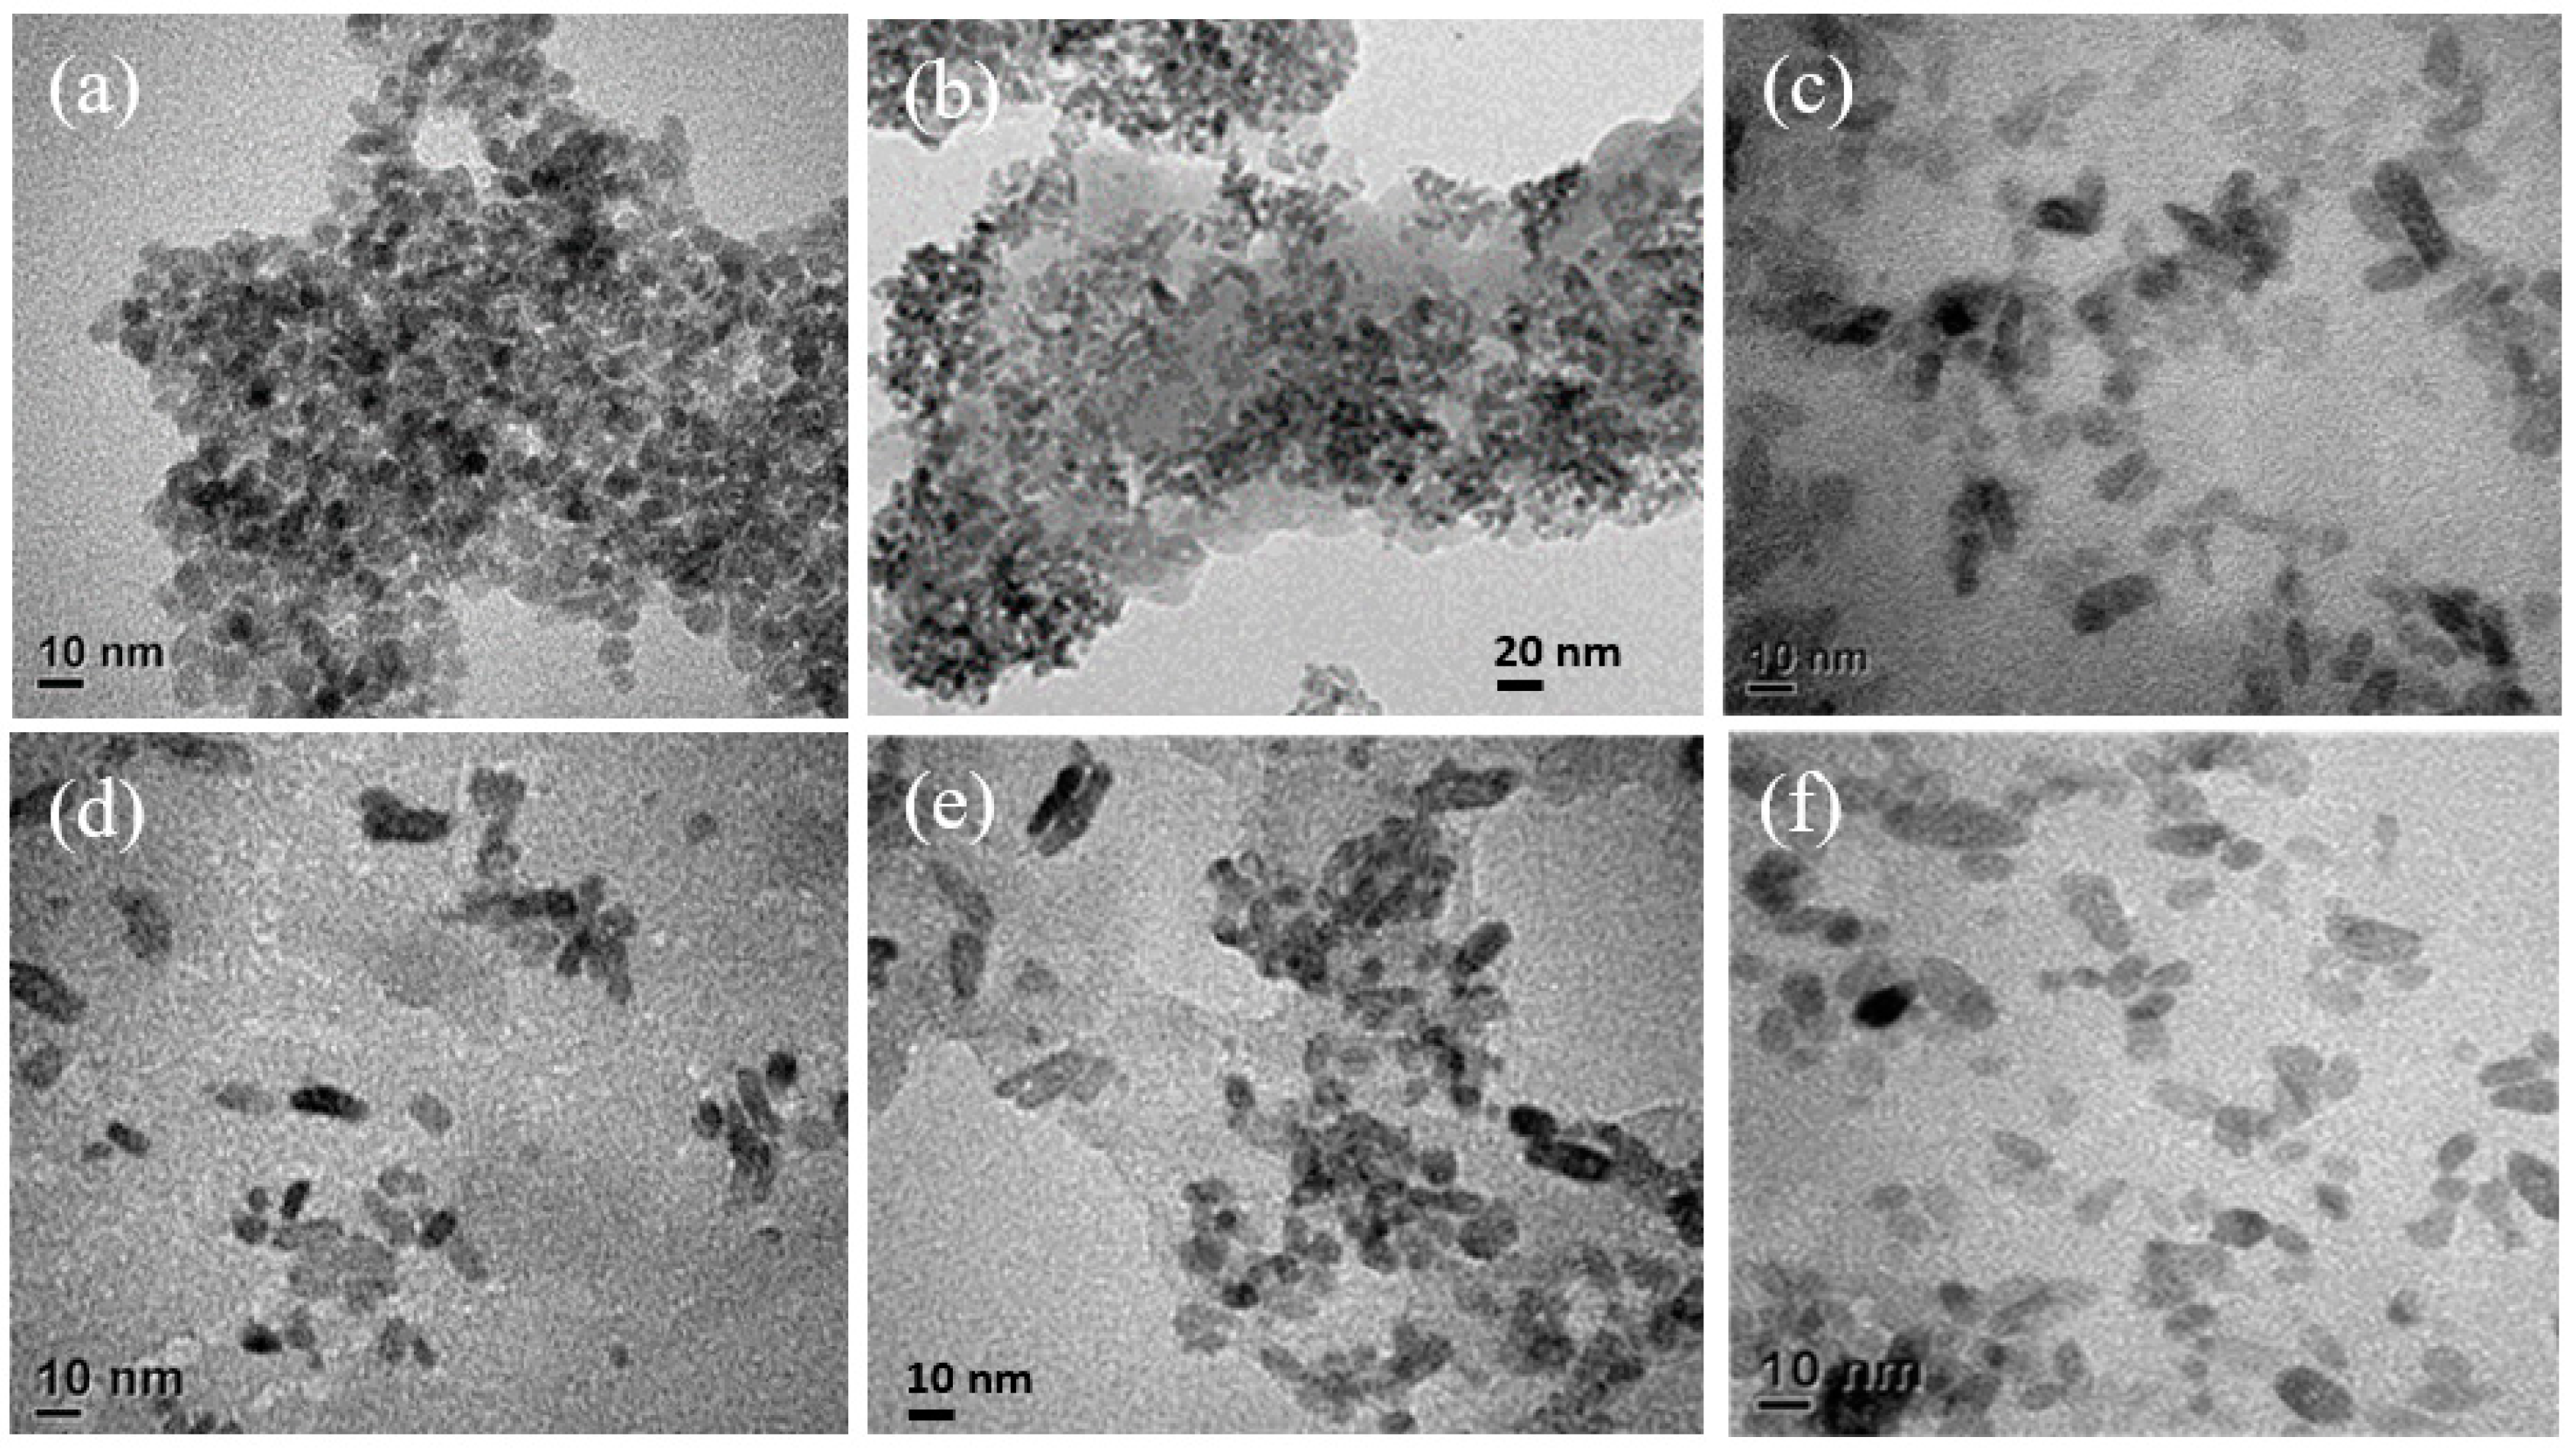
The XRD patterns of three types of gCN and Ti-uCN nanosheets are shown in Figure 1. The characteristic (002) peak at around 27.5° is ascribed to the stacking of conjugated aromatic structure of gCN with the interlayer distance of 0.324 nm [2,5,19]. The weak one appeared at 13.0° was indexed as (100) plane, the in-planar tri-s-triazine units of gCN [22]. The difference in the position of (002) or (100) peaks between each gCN was negligible. During the deposition of gCN by the solvothermal process, the distance of the inter-planar stacking of (002) remained that the peaks at 27.5° were observed from all Ti/uCN-x samples. Besides, the characteristic anatase peaks, dot lines indicated in Figure 1b, confirmed the crystallinity of anatase from Ti/uCN-x. According to Scherrer’s equation, the crystalline size of anatase particles was around 10 nm. The decorated anatase TiO2 nanoparticles on each gCN nanosheets can also be observed from the following TEM images. Three gCN nanosheets derived from various precursors showed diverse morphology and surface area. Figure 2 displays the SEM and TEM images of each gCN. The porous morphology of uCN revealed from Figure 2a,a′ is consistent with its high surface area of 88 m2/g, which is the highest among others and literature value [22]. The presence of mesopores (~13 nm) within uCN enhanced the harvesting of light due to more frequent light-scattering [23]. Both mCN and dCN exhibited low surface area of 14 m2/g (Table 1). As uCN exhibited the highest surface area, uCN was selected to decorate TiO2. The BET surface area of TiO2 decorated uCN was as high as 170 m2/g, which is slightly lower than in-house TiO2 powders. The morphology of a series of TiO2-decorated uCN nanosheets could be observed from the high resolution TEM images (Figure 3). For comparison, the morphology of in-house TiO2 nanoparticles derived from identical process parameters except the addition of gCN is displayed in Figure 3a. The typical TiO2 nanoparticles were spherical and around 10 nm in diameter. As shown in Figure 3b, the surface of uCN was highly covered with TiO2 spheres with the diameter less than 10 nm as the mass ratio of uCN to TiO2 is 0.25, i.e., Ti/uCN_0.25. With the increase in uCN content, the shapes of TiO2 converted from sphere to rod, where the diameter remained less than 10 nm and the length varied with the uCN content. The axial growth of TiO2 particles was significant from samples containing more uCN. The curve layers presented in uCN (Figure 2a′) might be relevant to the formation of rod-like TiO2.
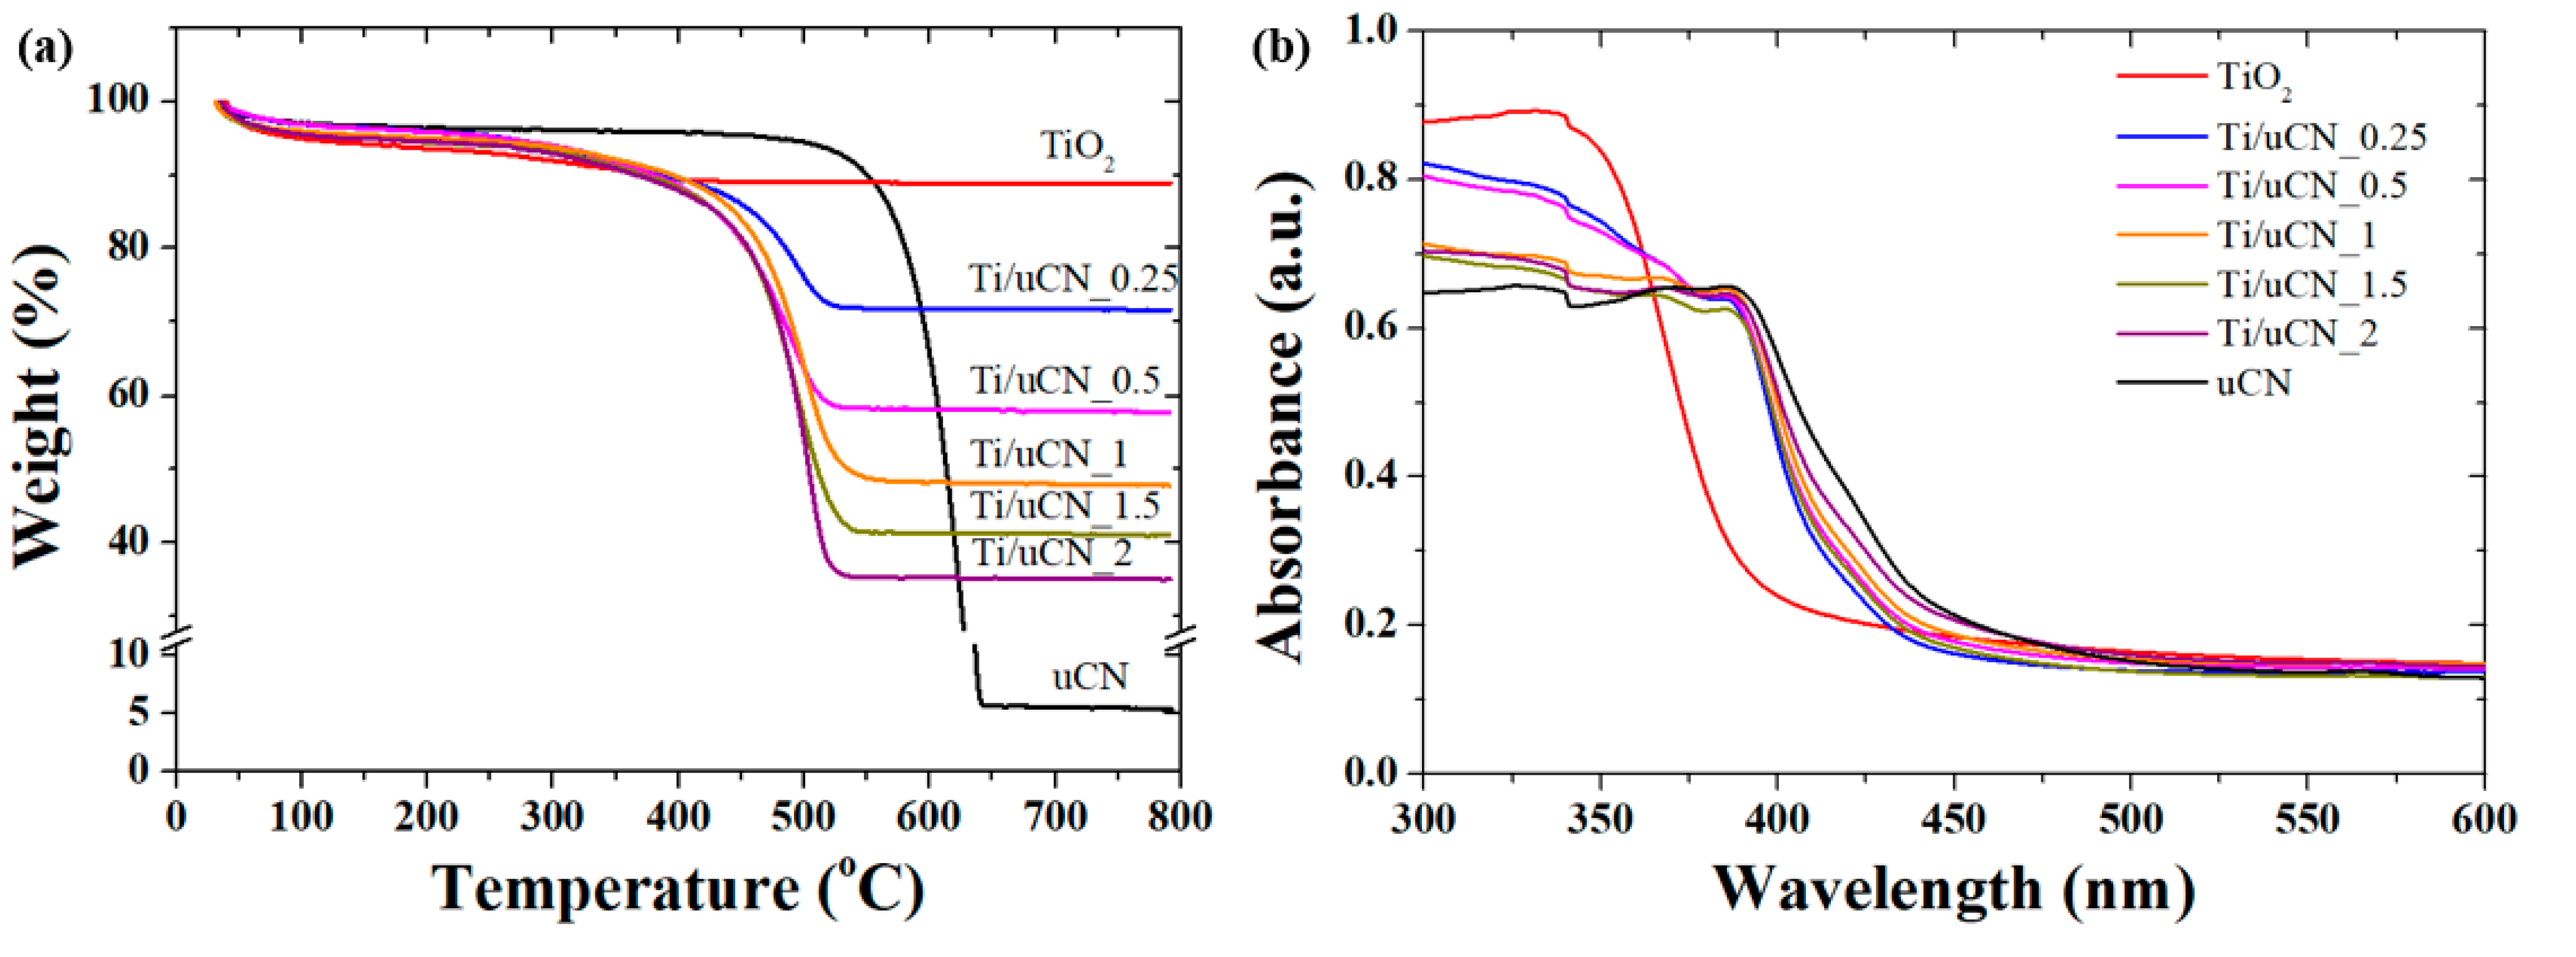
The thermogravimetric curves of uCN, TiO2 and Ti/uCN_x in the air are shown in Figure 4a to evaluate the thermal stability of samples and estimate the content of titania on uCN. For uCN, the initial weight loss, which might be attributed to the loss of adsorbed water molecules, was less than 5% up to 550 °C, indicating its excellent thermal stability [24]. A significant decrease in weight was followed and ceased at 650 °C with the char yield of 5 wt %. With the presence of TiO2 nanoparticles on gCN, the thermal degradation of gCN occurred at a lower temperature of 450 °C, comparing to pure gCN, and completed at 550 °C. The char yield of Ti/uCN_x decreased with increasing x value as the char yield was an indicator of TiO2 content in each sample. Based on the residual weight of each curve, the relative gCN or TiO2 content in each sample was estimated and the results are listed in Table 1. The calculated values were similar to ideal ones, which were obtained by adding the precursor amounts.
The UV-vis diffuse reflectance spectra of TiO2, uCN, and a series of TiO2-decorated uCN nanosheets are depicted in Figure 4b. A significant red shift on the absorption edge was observed from Ti/uCN_x samples compared to reference TiO2 nanoparticles. The indirect bandgap of each sample was determined by Tauc plot [25] and the results are summarized in Table 1. The bandgap of reference in-house TiO2 and commercial P25 TiO2 was 3.2 eV and 3.1 eV, respectively, which is consistent to literature values. The red shift in bandgap energy of Ti/uCN_x was revealed, decreasing from 2.94 eV to 2.88 eV with increasing gCN contents. The intrinsic uCN exhibited a bandgap energy of 2.72 eV, which is slightly smaller than other gCN samples. It has been reported that better condensation degree of gCN-precursor led to stronger conjugative effect and consequently showed reduced bandgap and stronger PL signals [26]. The photoluminescence (PL) spectra of each gCN sample under the excitation at 315 nm at ambient condition are displayed in Figure 4c. The PL intensity of uCN was stronger than other gCN samples, indicating higher order of conjugated units from uCN. The PL wavelength at 456 nm is correlated to the free excitonic emission, as it is consistent to the determined band gap energy of 2.72 eV from UV-Vis spectrum of uCN [27]. The shorter wavelength emission may suggest the intra-transition of electrons from LUMO-π* state to the HOMO- state [27,28,29]. On the other hand, the tailing of PL in longer wavelength suggested the presence of structure detects. The difference in the shapes between three gCN samples suggested varied band structures of gCN [27]. The broad and intense PL emission in the visible range was observed for each Ti/uCN_x. In contrast, weak PL was observed from the reference in-house TiO2 and commercial P25 samples under the same excitation. Notably, despite lower uCN content, the intensity of PL emitted from Ti/uCN_x was stronger than that from uCN. The presence of TiO2 in uCN may promote the charge transfer from TiO2 to uCN, or the conjugation system was improved during TiO2 decoration process, and, consequently, more radiative relaxation occurred [27,29].
The valence band positions of each gCN and Ti/uCN_x samples were estimated by extrapolating a linear fit to the lower binding energy edge of the valence band photoemission to the baseline of XPS valence band (VB) spectra shown in Figure 4d. The VB edge potential was around 1.41 eV for uCN, 1.39 eV for mCN, and 1.14 eV for dCN, which are close to literature values [30,31]. Comparing to gCN, a more positive VB potential of 1.94 eV was obtained from in-house TiO2 sample. For Ti/uCN_x samples, their VB edge significantly varied with the composition and was in the range of 1.76–2.38 eV. According to estimated VB edge and bandgap energies, the conduction band (CB) band edge of each sample was estimated. Therefore, the band structure of each sample was plotted and CO2 reduction potentials with reference to NHE at pH 7 were designated (Figure 4e) [32,33]. A series of Ti/uCN_x samples showed more negative CB potentials than those of most CO2 reduction pathways, indicating their ability to reduce CO2. Notably, the oxidation capability of Ti/uCN_0.5, Ti/uCN_1, Ti/uCN_1.5, and Ti/uCN_2 was stronger than that of pure TiO2 based on their relative VB position. On the other hand, the reduction ability of those samples was in the opposite trend as the difference in bandgap energy between samples was relatively small. The ranking of the potential of VB or CB edge was not directly relevant to the following CO2 conversion yield (Figure 5). For example, Ti/uCN_0.25 exhibited highest reduction potential, however, weaker absorption of visible light (larger band gap) may contribute to its lower activity. In comparison to Ti/uCN_1.5 and Ti/uCN_2, which exhibited similar VB and CB edges, the low activity of Ti/uCN_2 may result from its low surface area. In summary, the decoration of TiO2 on uCN influenced the band edge and band gap energies. These factors combining with surface area, charge transfer mobility and surface functional groups contributed to its activity to convert CO2.
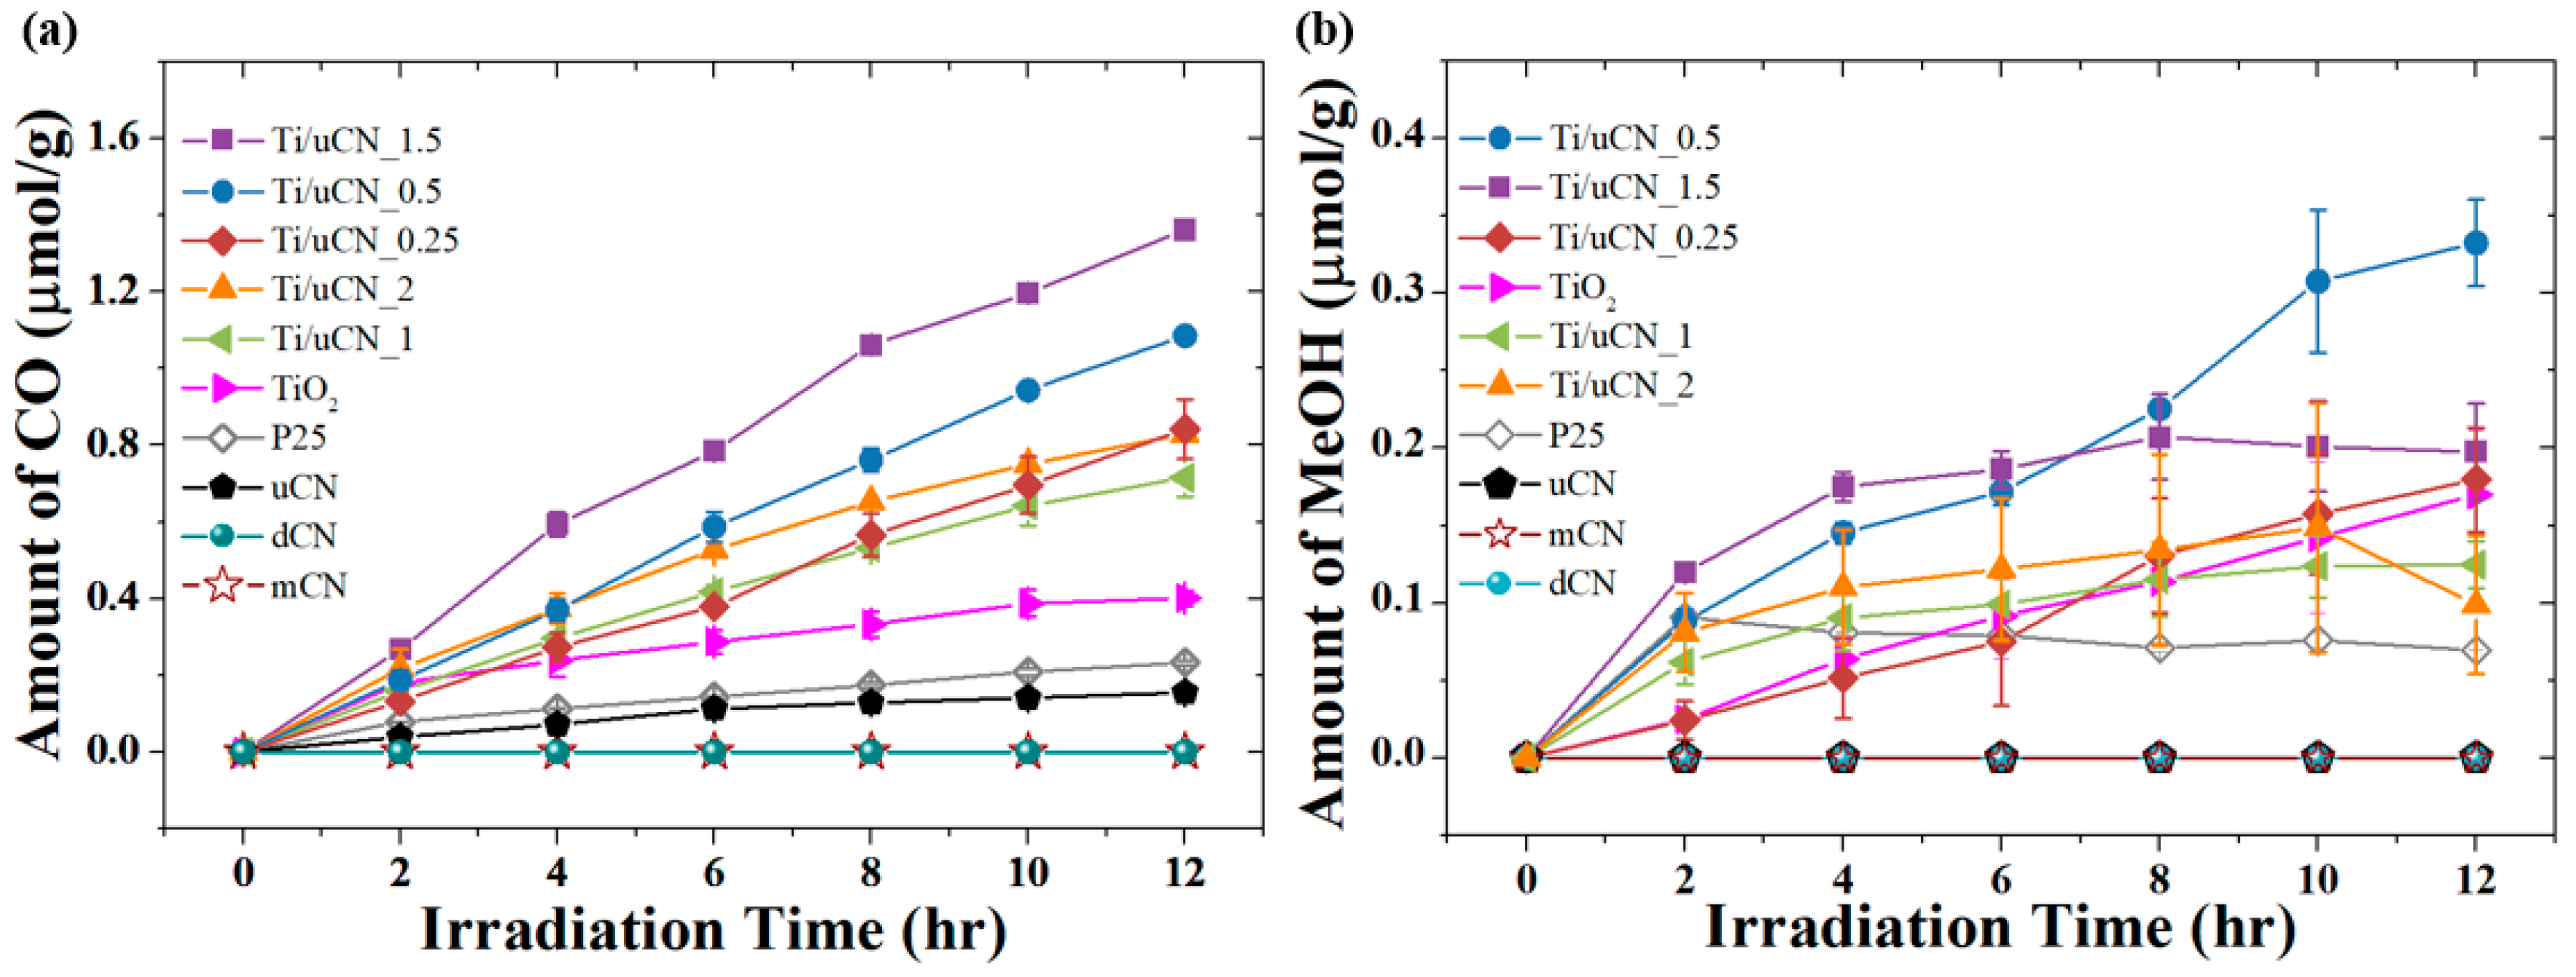
The ability of samples to convert CO2 under visible light illumination was evaluated by comparing their total yields of products. In this work, carbon monoxide (CO) was the main product and simultaneously trace amount of methanol (MeOH) was also obtained from samples. The time courses of CO and MeOH yields from each sample under LED illumination are plotted in Figure 5a,b, respectively. For pure gCN samples, only uCN could convert CO2 into CO under current experimental condition. After 10-h irradiation, in-house TiO2 produced 0.4 μmol/g CO, which is twice the yield from commercial P25, but levelled off upon further illumination. With the presence of uCN in TiO2, the increase in CO yield was observed from all Ti/uCN_x samples. Ti/uCN_1.5 exhibited the highest CO yield of 1.4 μmol/g after 12-h illumination, followed by Ti/uCN_0.5, which produced 1.1 μmol/g of CO. Notably, there were very small amounts of UVC and UVA lights reaching the surface of samples, as mentioned in Experimental Section, that even pure TiO2 could produce CO or MeOH in this work. On the other hand, Ti/uCN_0.5 showed higher selectivity to MeOH production than Ti/uCN_1.5 under the same reaction condition. The yield of MeOH was around 0.3 μmol/g from 12-h illuminated Ti/uCN_0.5. The production rate of MeOH from Ti/uCN_1.5 was highest during first 2-h illumination, however, the yield of MeOH levelled-off upon further illumination. Recall that Ti/uCN_1.5 emitted the weakest PL signal, therefore exhibiting better charge transfer toward the production of CO. In addition to Ti/uCN_1.5, other samples, Ti/uCN_1, Ti/uCN_2 and P25, showed similar phenomena as the shift from MeOH to other products occurred from those samples. Continuous production of MeOH was observed from in-house TiO2, Ti/uCN_0.25 and Ti/uCN_0.5, which contained more TiO2. As displayed in Figure 5, the standard deviation of MeOH yield was larger than that of CO yield. The reason is that three syringes were used to withdraw gas sample from the reactor at each data point to obtain an average value of product yield. The condensation of MeOH within syringe may occur during the waiting of GC analysis. In this work, trace amount of MeOH produced from Ti/uCN_x and reference TiO2 samples, but not from three gCN samples.
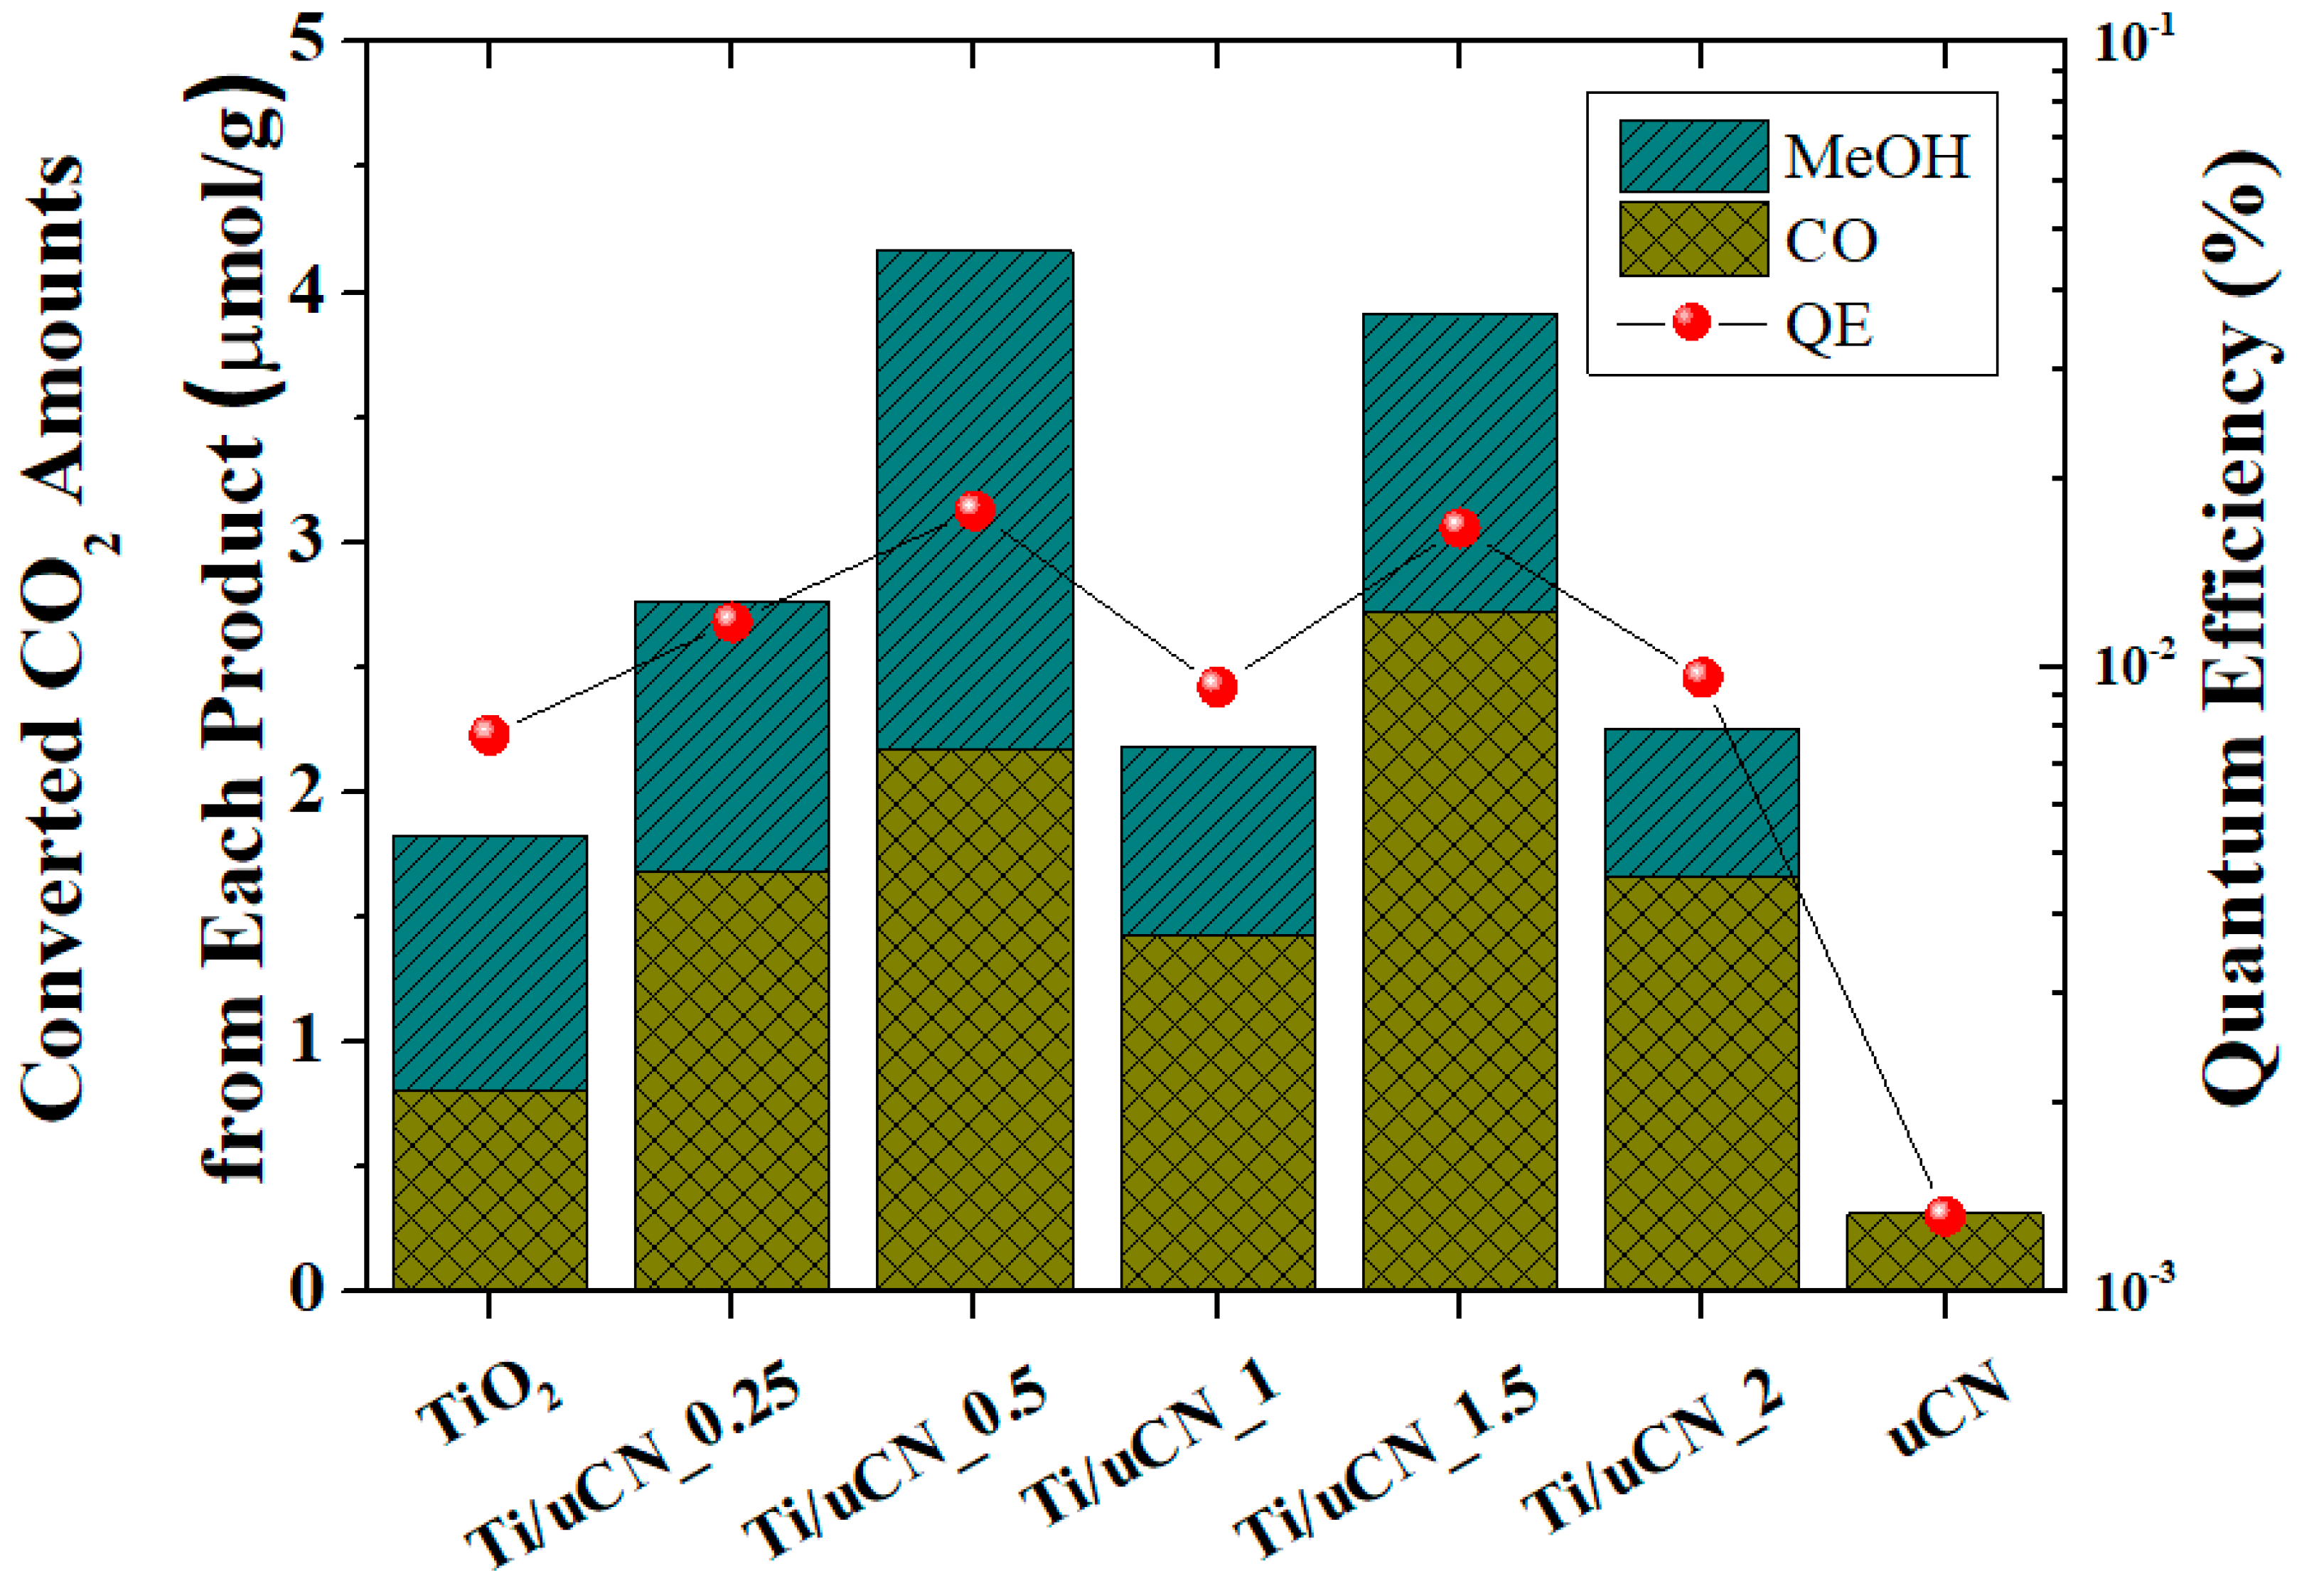
To easily compare current results with the literature, the quantum efficiency (QE) of each sample was estimated [34]. QE is defined as the total numbers of electrons required to convert CO2 into CO (two electrons) or MeOH (six electrons) divided by the incident photons at designated illumination period. As shown in Figure 6, the QE of each sample under 12-h LED illumination increased from 10−3% to 10−2% upon the combination of TiO2 with uCN. The sample Ti/uCN_1.5 exhibited the QE of 0.017% and the sample Ti/uCN_0.5 exhibited the highest QE of 0.018%, which is higher than other research groups using high-watt Xe lamps or doping with noble metals on gCN [19,35,36,37,38,39].
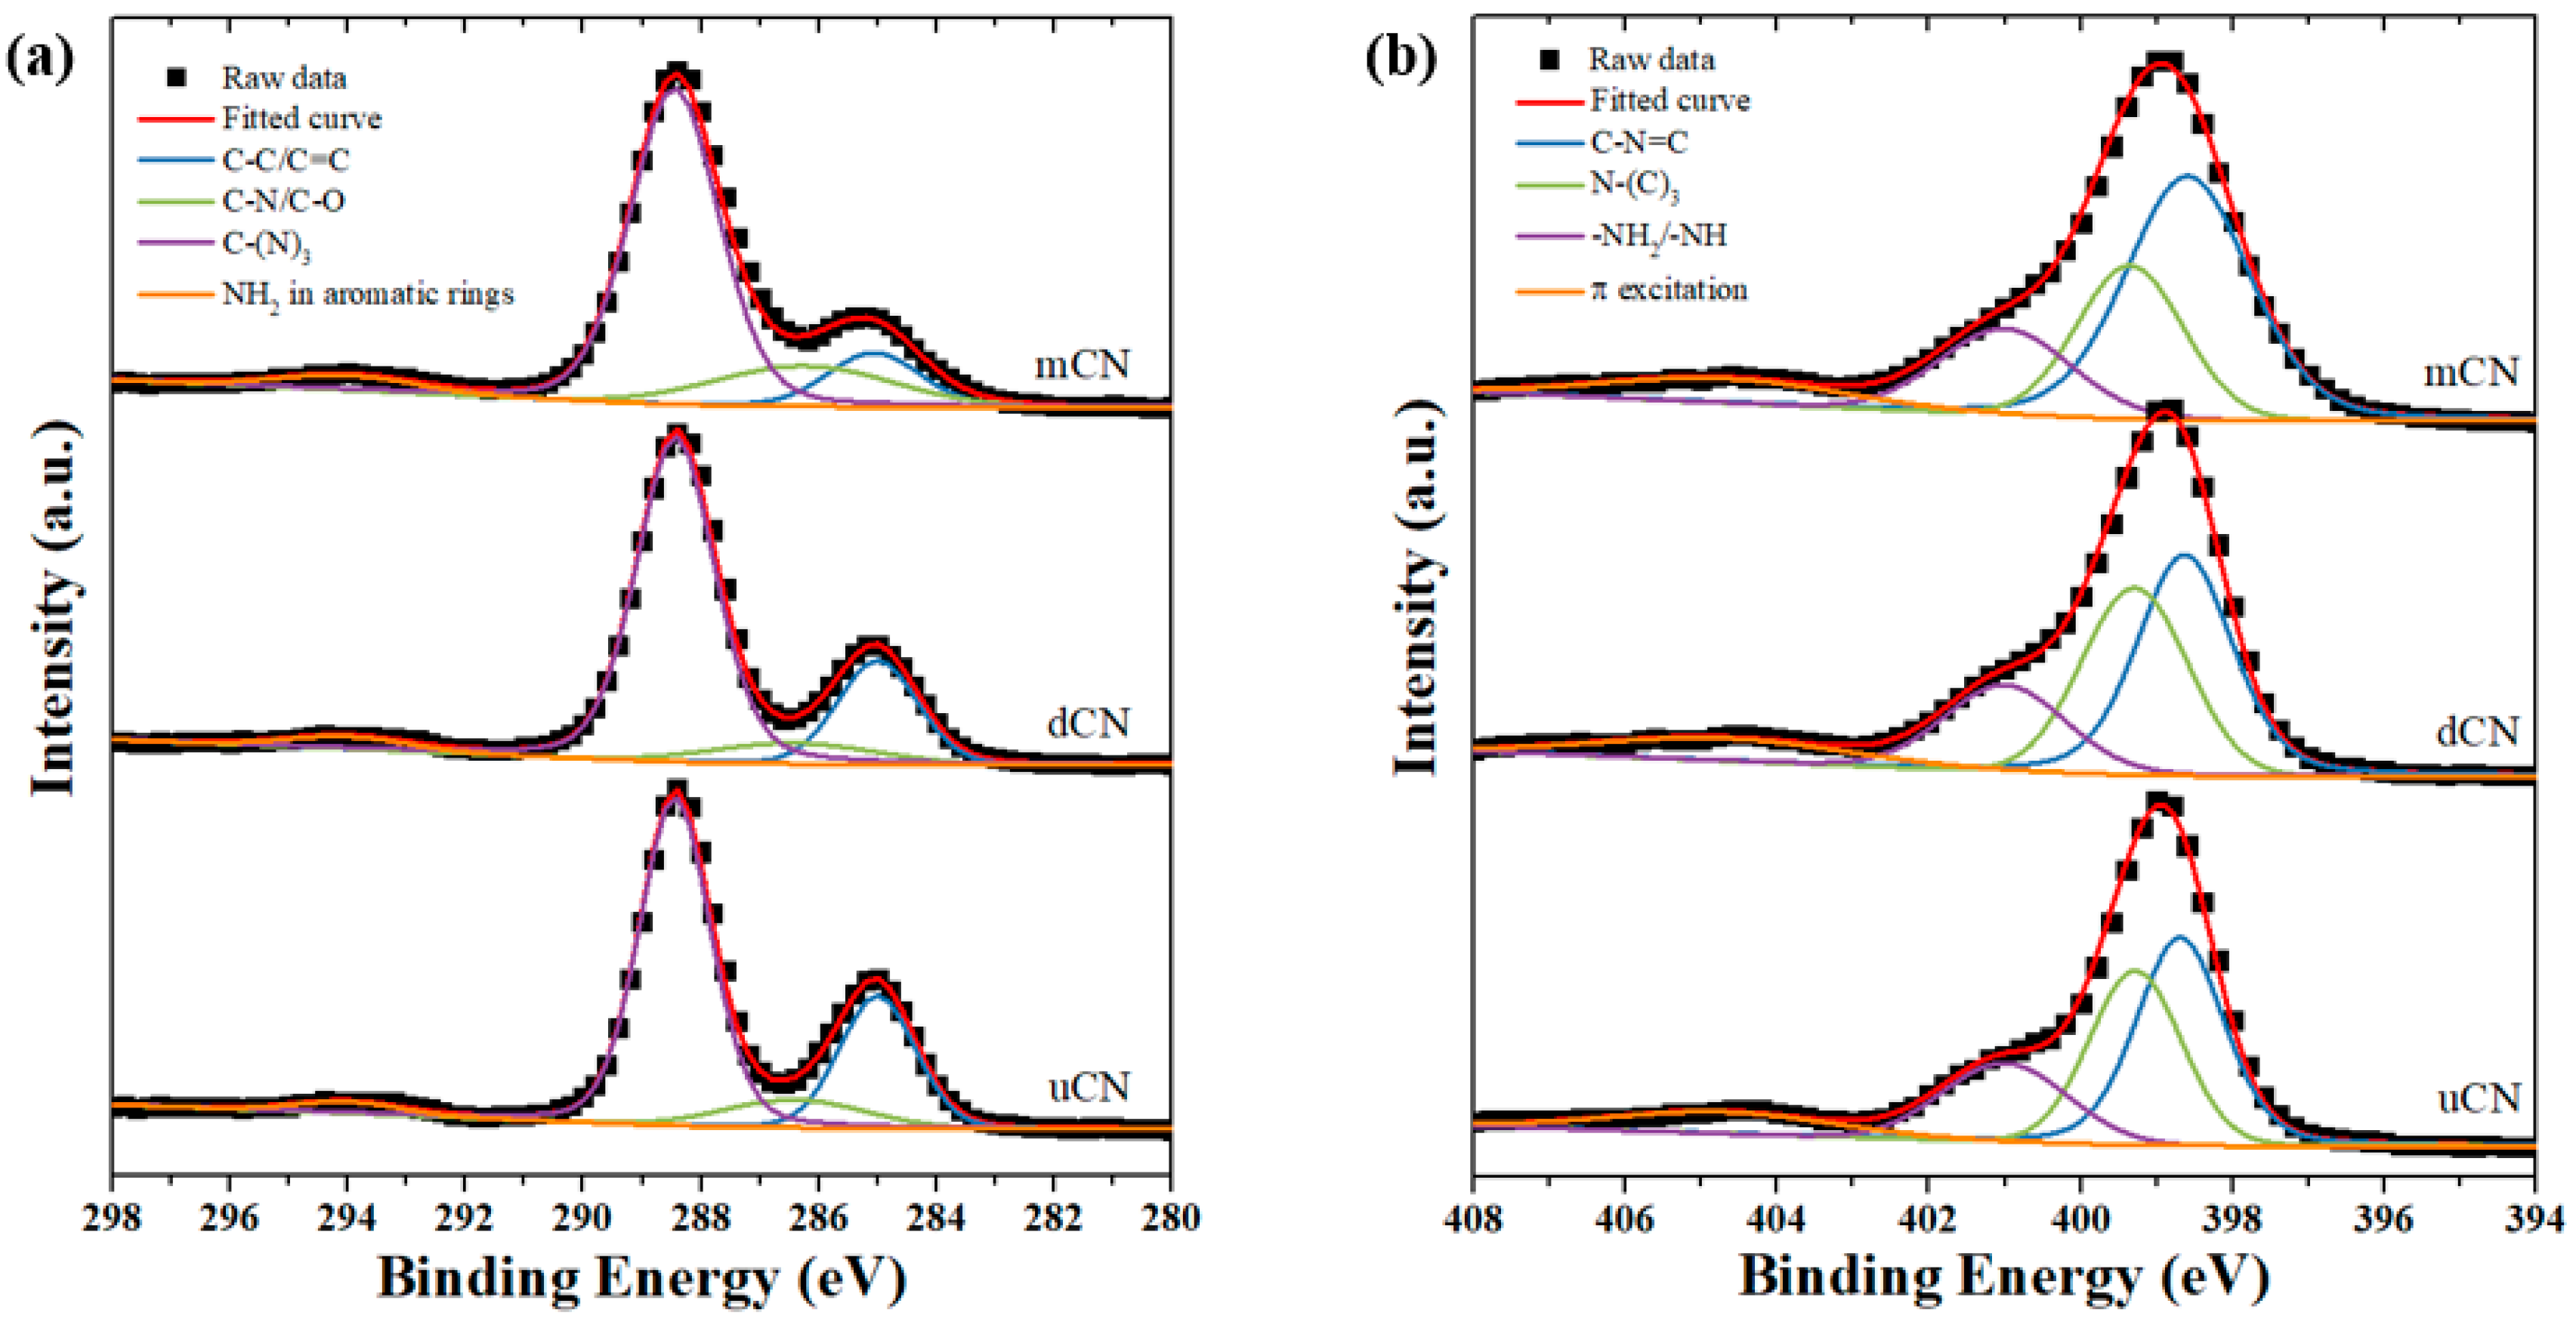
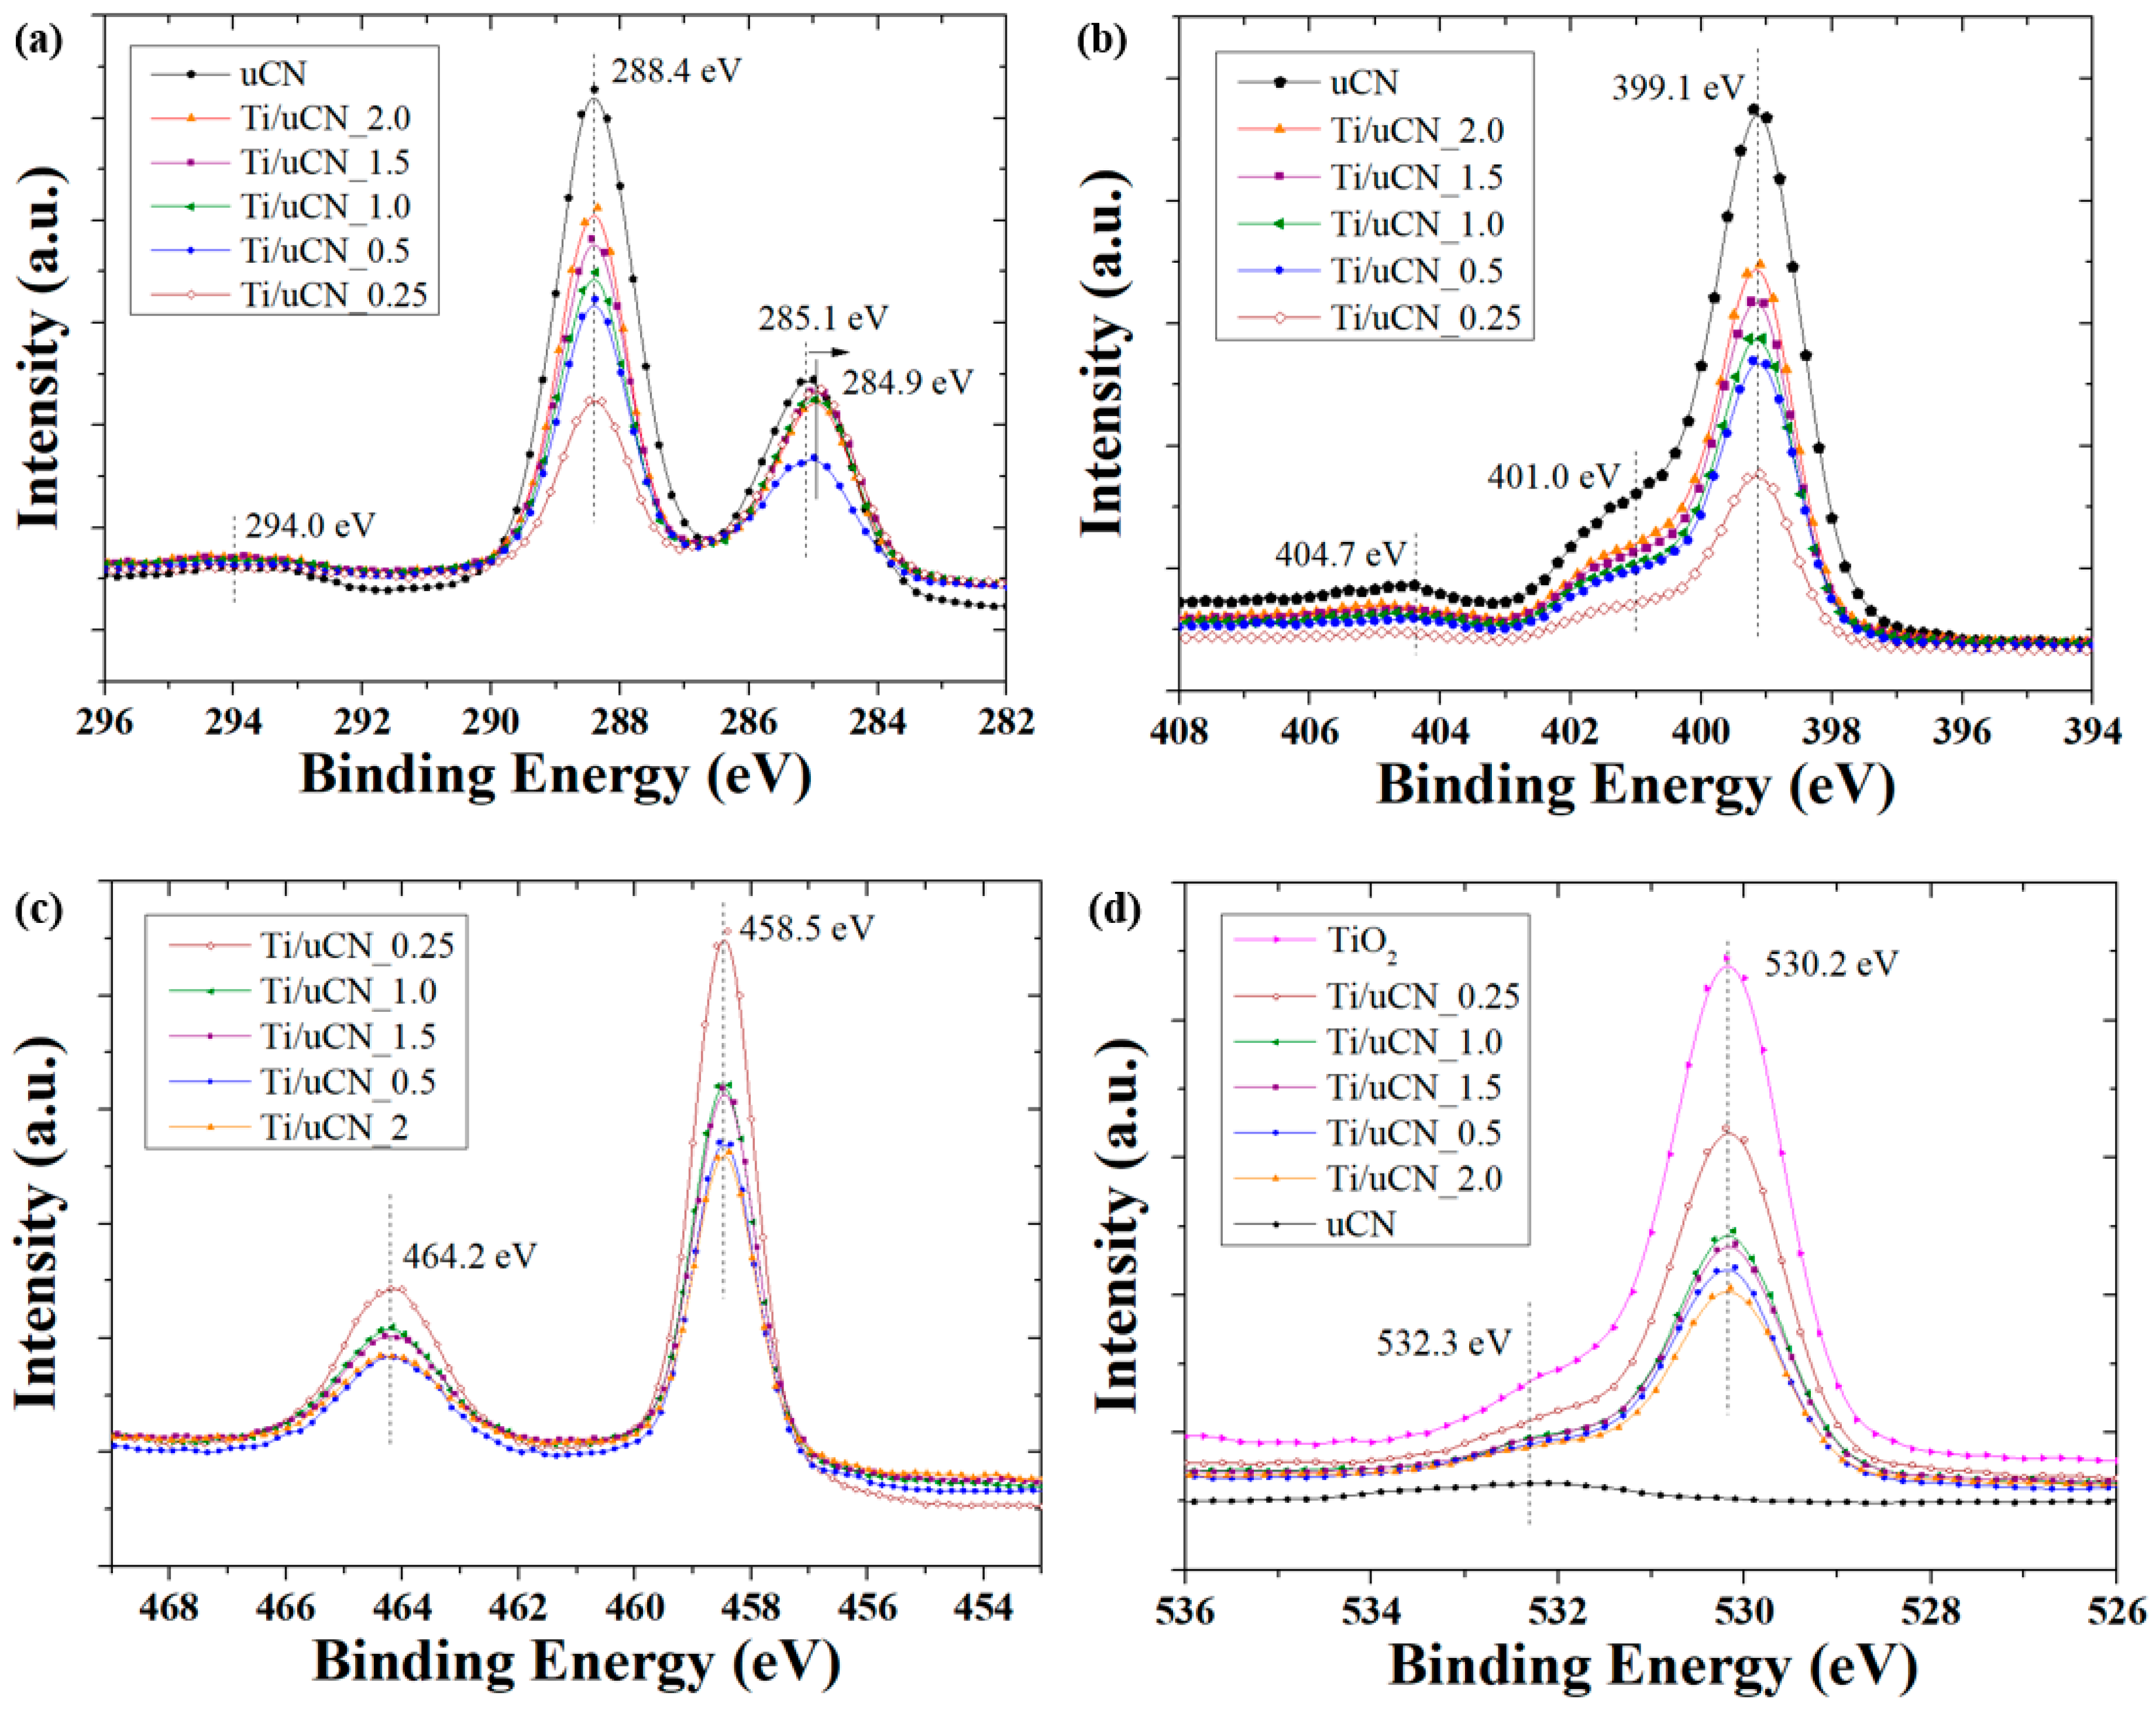
XPS spectra of a series of Ti/uCN_x samples were analyzed to correlate the surface functional groups of samples to their activity of CO2 conversion. The XPS C1s spectra of three gCN and their deconvoluted curves are plotted in Figure 7a. The C components centered at 285.1 eV were sp2 graphite structure and those at 286.4 eV were related to C–NH2 or C–O bonds, which might be attributed to the adsorption of H2O or CO2 [9,20,30]. The other peak displayed on 288.5 eV corresponded to the characteristic N=C–N2 or C–(N)3 bonds in tri-s-triazine units [5,24,30]. The XPS N1s spectra of each gCN sample, shown in Figure 7b, also revealed these characteristic nitrogen signals at 398.6 eV for C–N=C, 399.3 eV for N–(C)3, 401.0 eV for –NH2/=NH and 404.7 eV for π excitation [9,10,19,27,40]. With the presence of TiO2 on gCN, the XPS spectra of C1s, N1s, O2p and Ti2p core electrons are shown in Figure 8a–d. The characteristic tri-s-triazine units, featuring the peaks at 288.4 eV and 399.1 eV, were observed from all Ti/uCN_x samples and the peak intensity was consistent with the corresponding uCN amount, i.e. x value. The shift in the position of peaks corresponding to graphitic sp2 graphite structure was observed from all Ti/uCN_x samples, suggesting the existence of interaction between two phases [41,42]. However, the Ti–O–C bonds could not be obviously deconvoluted from C1s or Ti2p spectra, but from O1s spectra of Ti/uCN_x samples [25,43]. The XPS spectra in Ti2p region presented the dominant Ti–O bonds with the splitting of Ti2p electrons of 5.7 eV, further confirming the anatase phase of TiO2.
The surface compositions of C–, N– and O-containing functional groups were estimated by integrating each deconvoluted peak. The results are summarized in Table 2 and Table 3. Samples with higher ratio of terminal amine groups, –NH2 or =NH (401.0 eV), and Ti–O–C (533.3 eV) tended to higher CO yield as more CO2 adsorption and stronger interaction may improve their photocatalytic conversion [44,45,46]. Recently, the mechanism of CO formation from CO2 has been proposed [47]. The formation of carbamate is essential for the following production of CO. Two adjacent bare nitrogen atoms at the edge of gCN tend to attract protons and CO2, respectively, and then assist the activation of CO2 into carbamate. Therefore, the higher conversion efficiency achieved by samples with higher terminal amine groups may provide appropriate adsorption sites to active CO2 transfer into the intermediate of CO. On the other hand, the formation of MeOH requires more complex charge transfer steps and the presence of abundant hydrogen sources, e.g. water or hydrogen [45,48,49,50]. We also noticed that adequate amount of water in the photoreactor was essential to produce MeOH from CO2. In our case, MeOH was not the main product because we only provided small amounts of water vapors in the reactor. Therefore, the presence of more OH groups on catalysts will promote more adsorption of water molecules on the surface leading to higher MeOH yield. However, the produced MeOH may then act as sacrificial agent to promote the other reactions. That is, the decay in MeOH yield was attributed to further charge transfer and formation of other products.
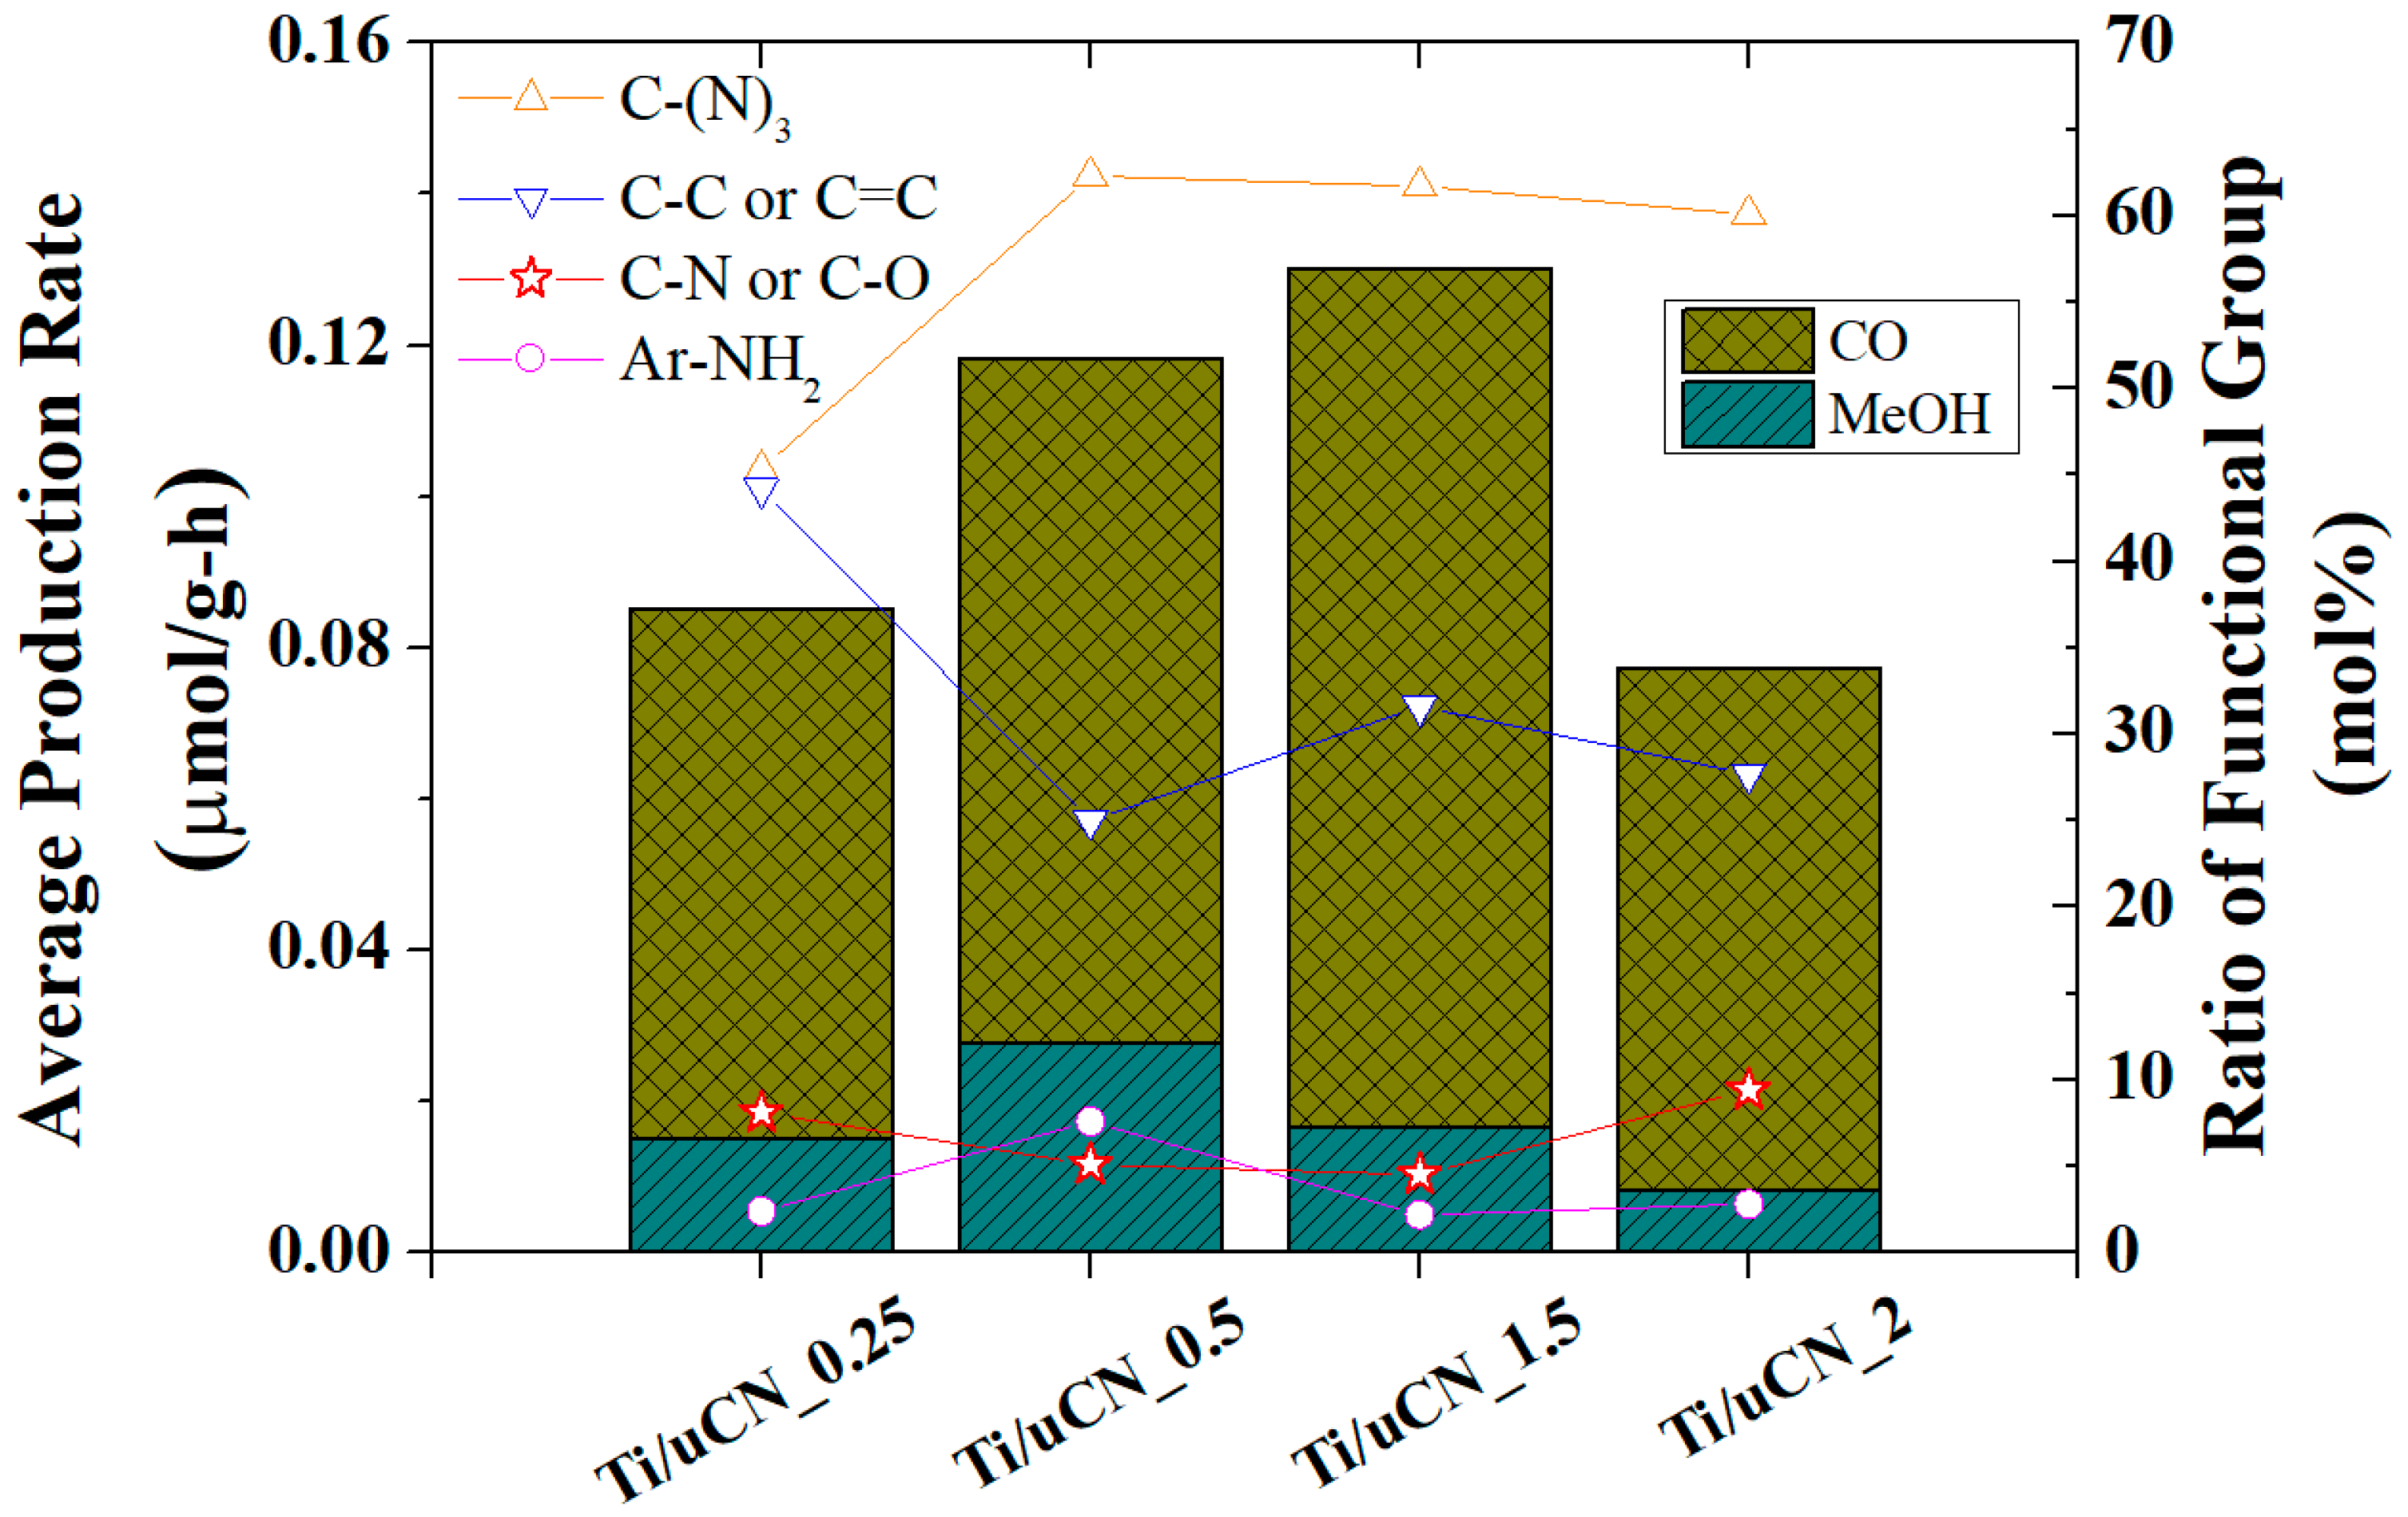
In Figure 9, the average production rate, which is the accumulated yields from both CO and MeOH divided by the illumination time (12 h), of each sample is displayed in stacked columns and the relative composition of carbon-contained functional groups are symbols with guide lines. However, the product yield was not linearly relevant to the content of a specific functionality on each sample as the composition of surface functional groups were not the only factor governing the photoactivity of each sample. The ability to absorb visible light, the reduction potential, the surface area and the surface functional groups of samples attribute to the resultant activity or the selectivity of products. For example, Ti/uCN_0.25 exhibited highest reduction potential, weaker absorption of visible light (larger band gap), which might contribute to its lowest activity. In addition, the imperfection of tri-s-triazine units would inhibit the transfer of charge carriers; consequently, samples containing lower ratio of C–(N)3 groups or higher C–C/C=C groups exhibited lower activity. It elucidates again the low activity of Ti/uCN_0.25. The presence of Ti–O–C indicates the interaction between TiO2 and uCN. Therefore, samples containing more Ti–O–C suggest stronger interaction between two phases. For Ti/uCN_1, the lowest CB position combined with the lowest ratio of Ti–O–C component led to its lowest activity among other Ti/uCN_x. Both Ti/uCN_0.5 and Ti/uCN_1.5 have higher ratio of C-(N)3 groups, lower ratio of C–C/C=C groups, and relatively high content of Ti–O–C indicating more efficient charge transfer within their matrix. In comparison of Ti/uCN_1.5 and Ti/uCN_2, which exhibited similar VB and CB edges and similar surface composition, the low activity of Ti/uCN_2 may result from the significant reduce in surface area. The higher methanol production rate from Ti/uCN_0.5 might be attributed to its higher content of terminal NH2 groups than Ti/uCN_1.5. The initially produced methanol from Ti/uCN_1.5 converted into other products such as CO upon further illumination.
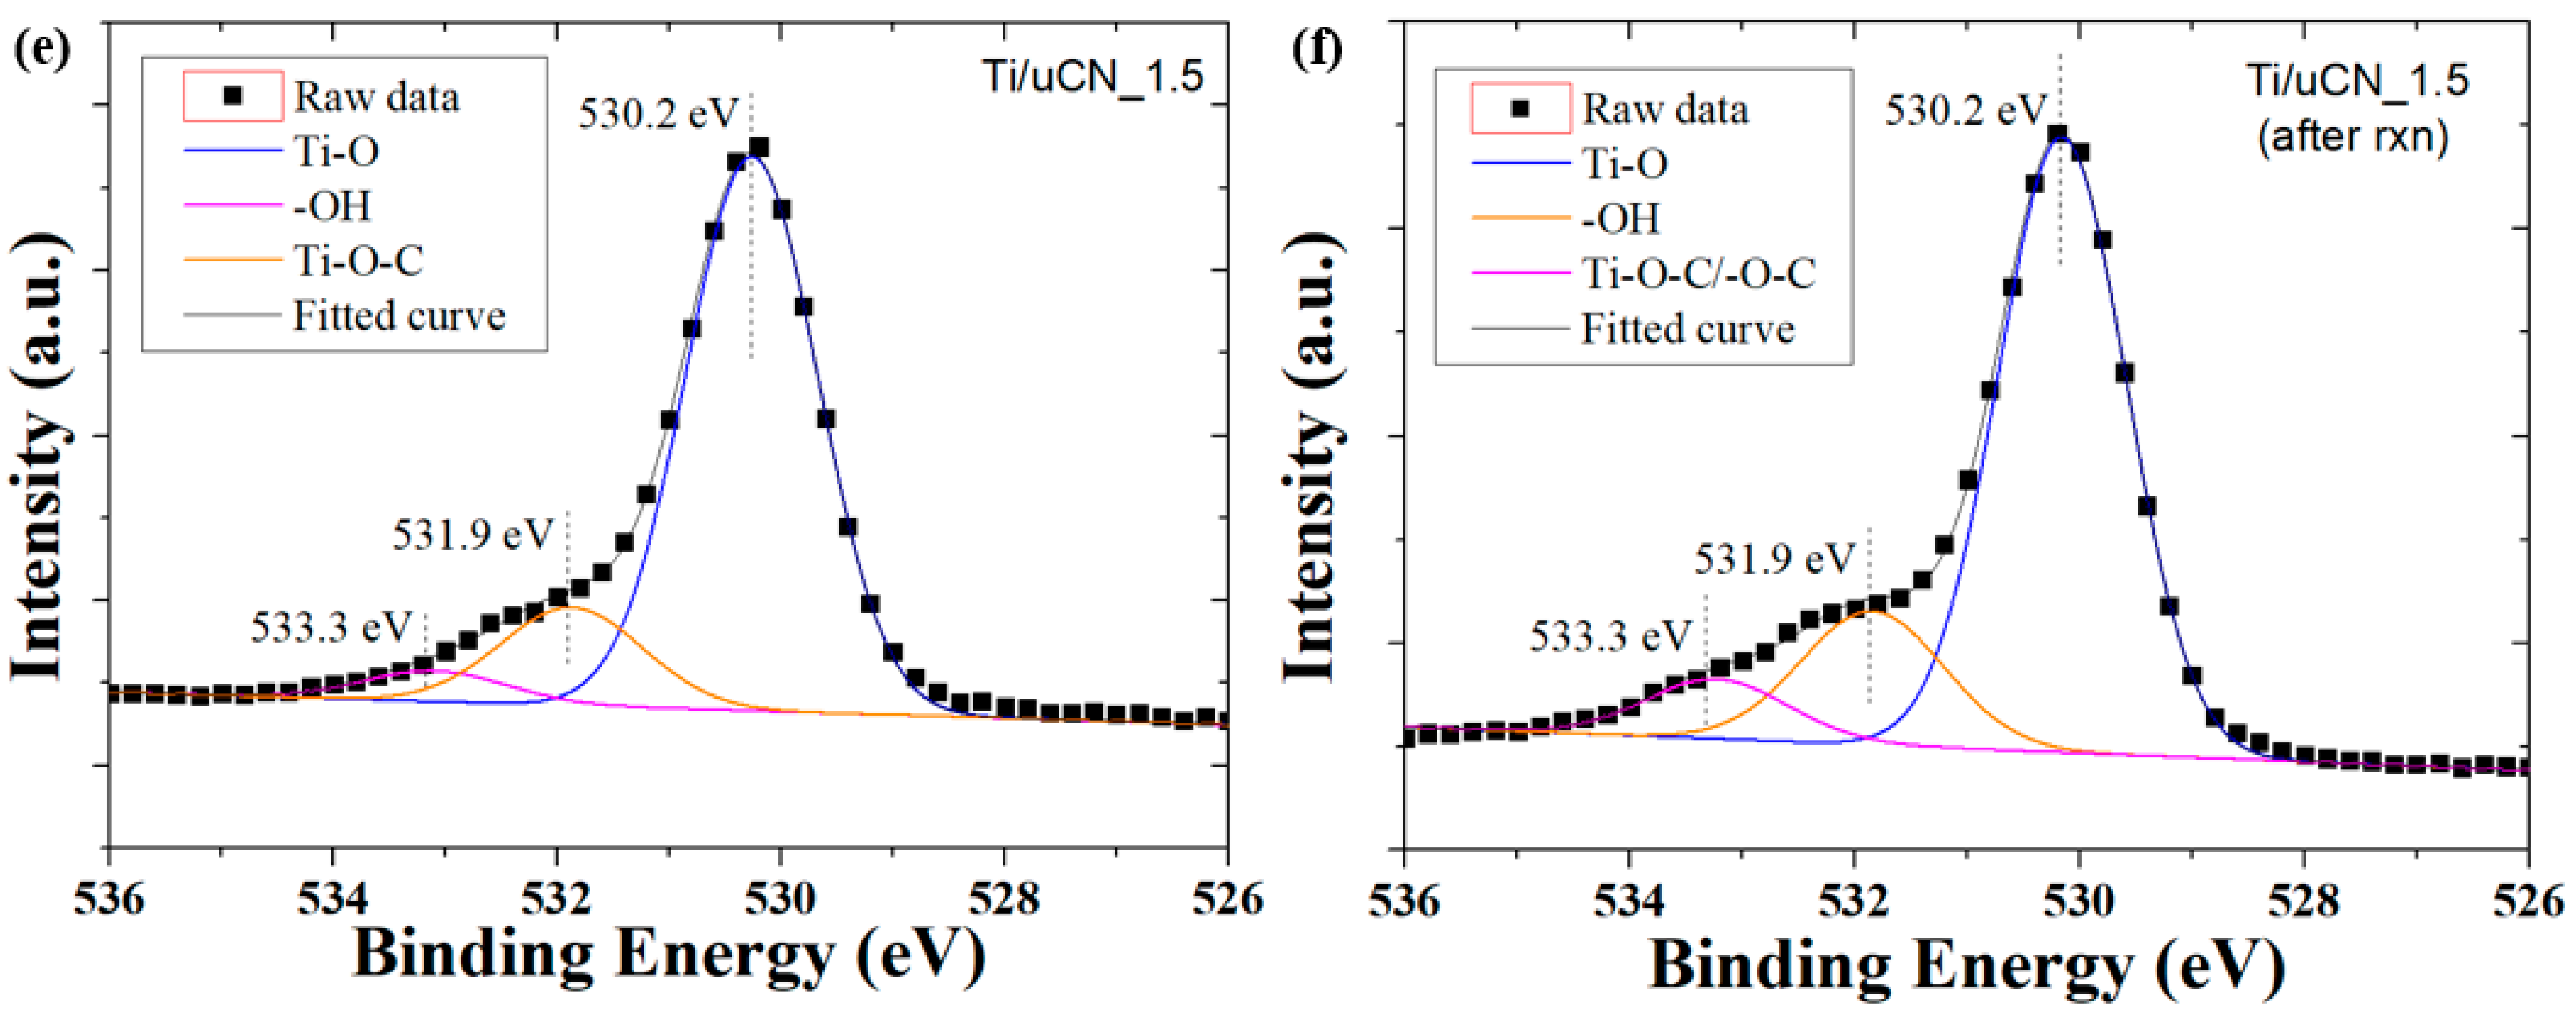
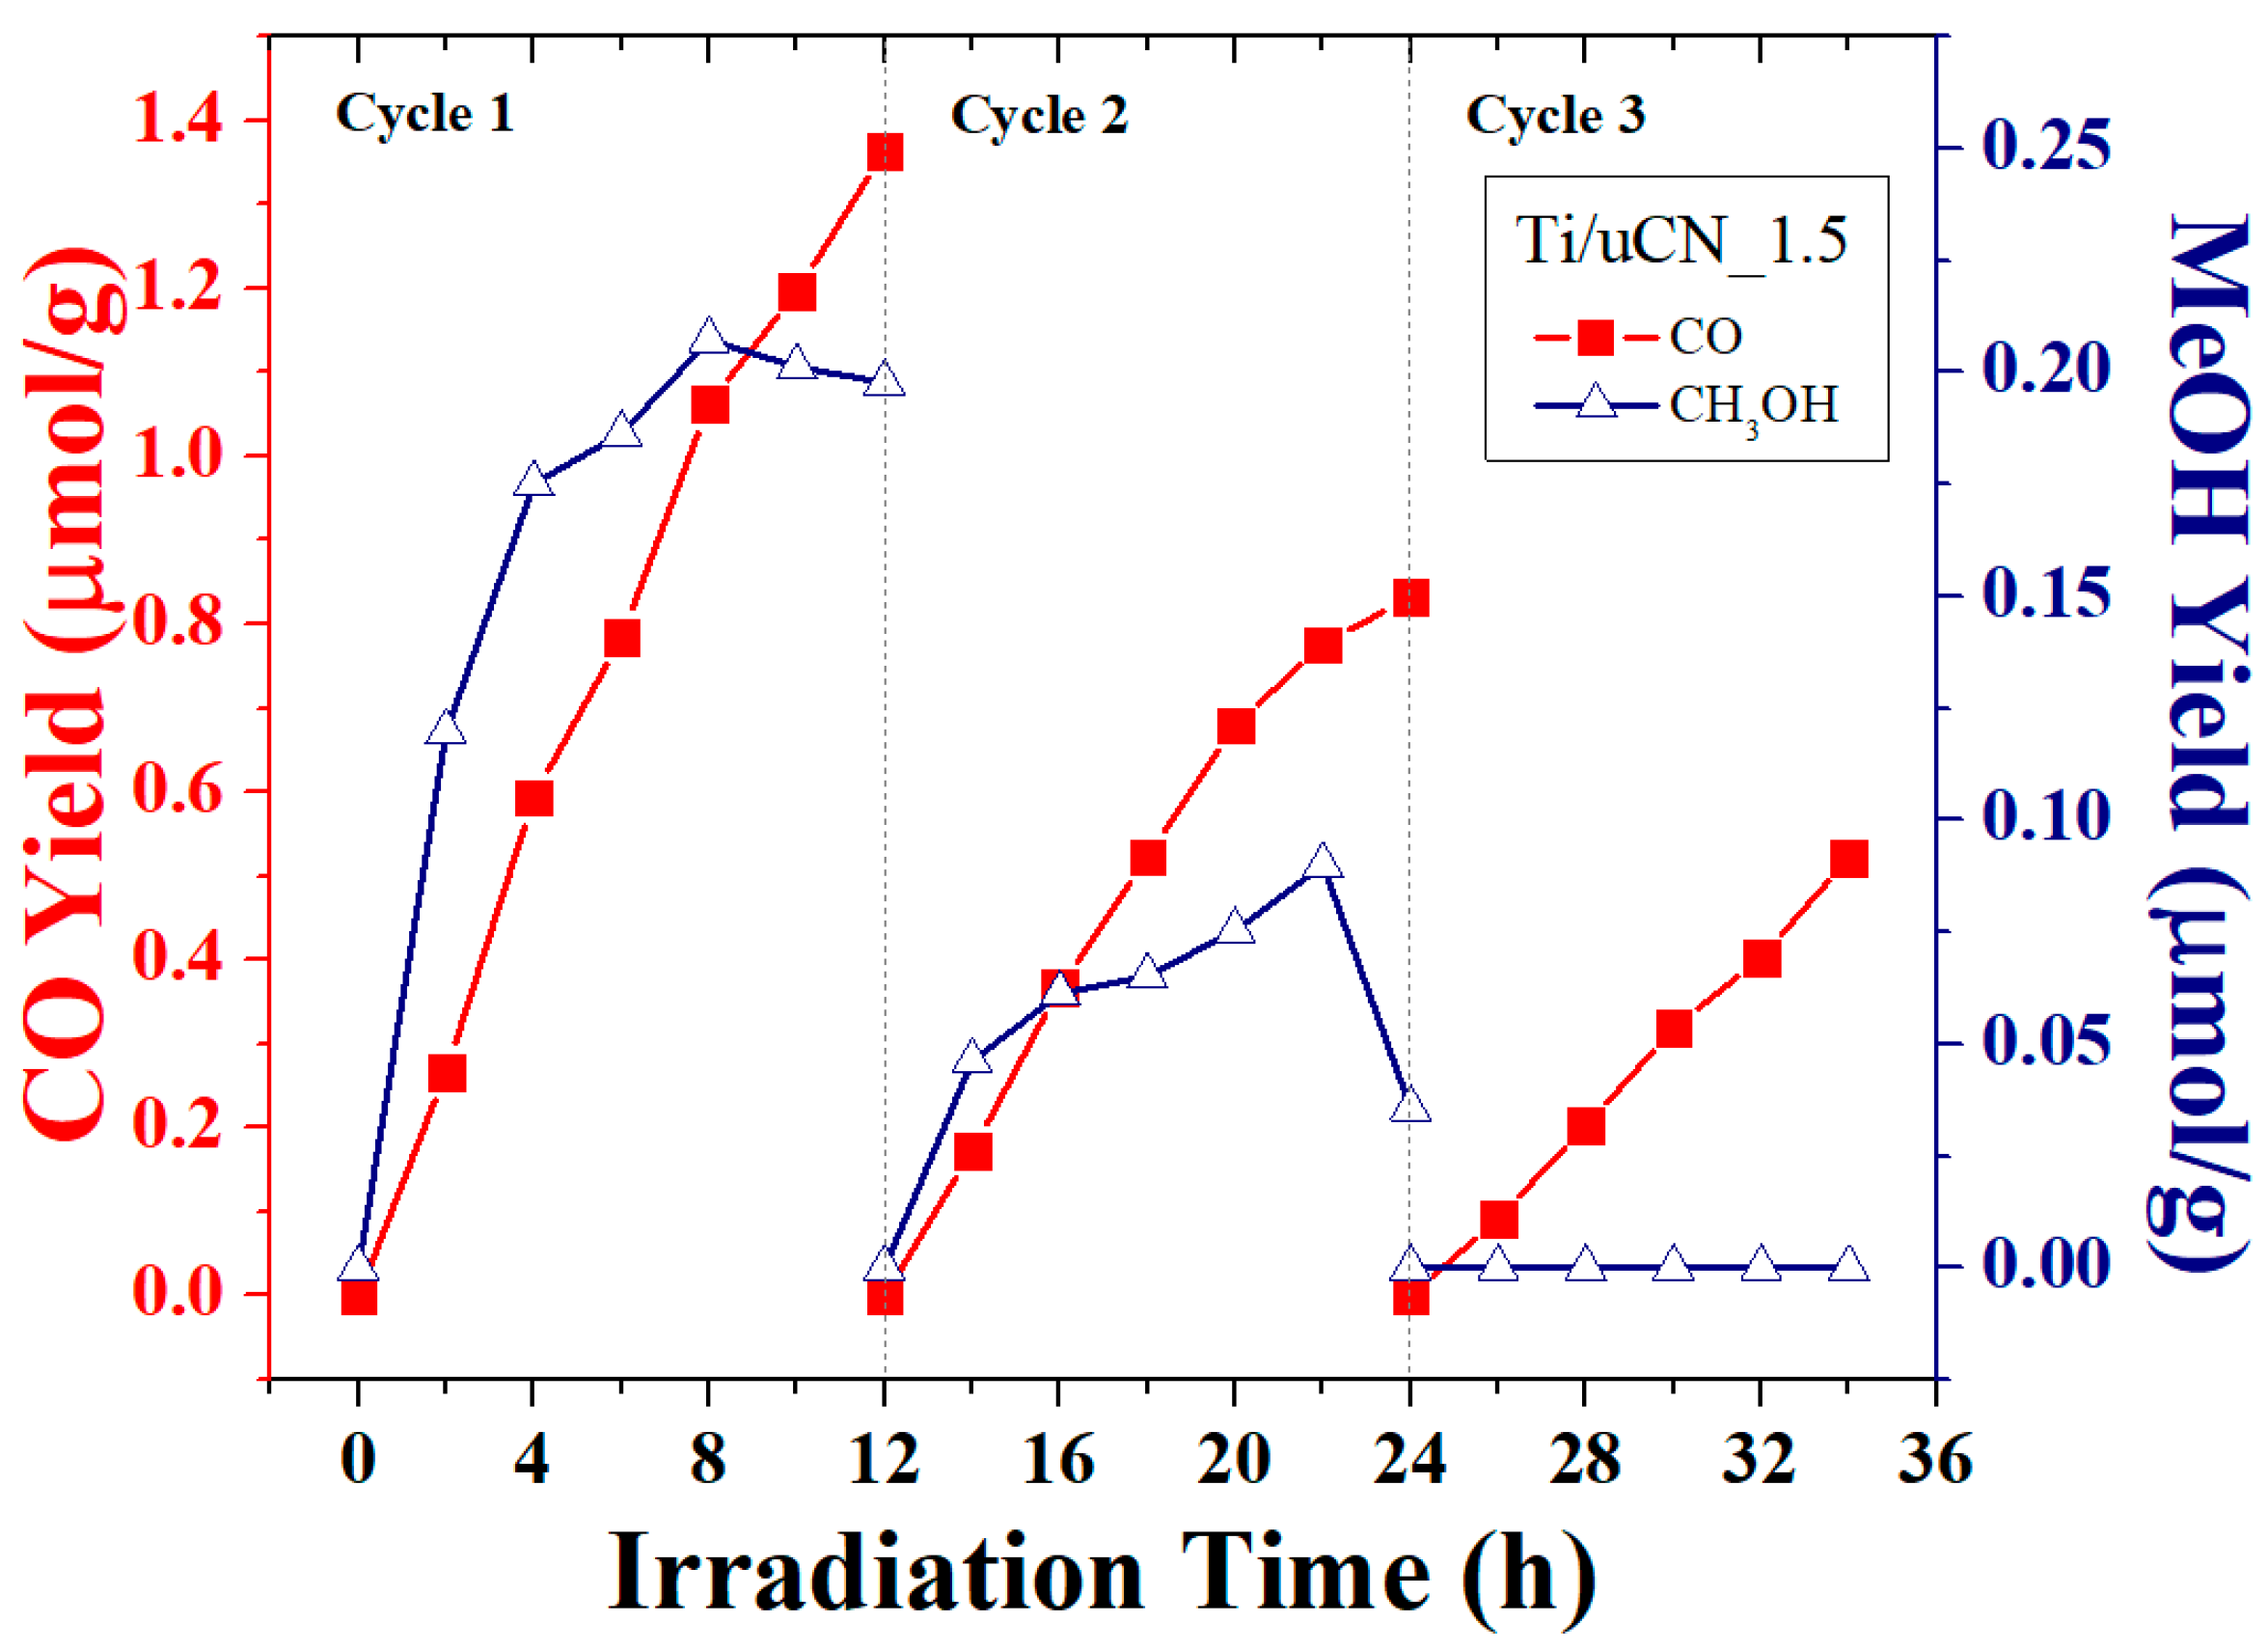
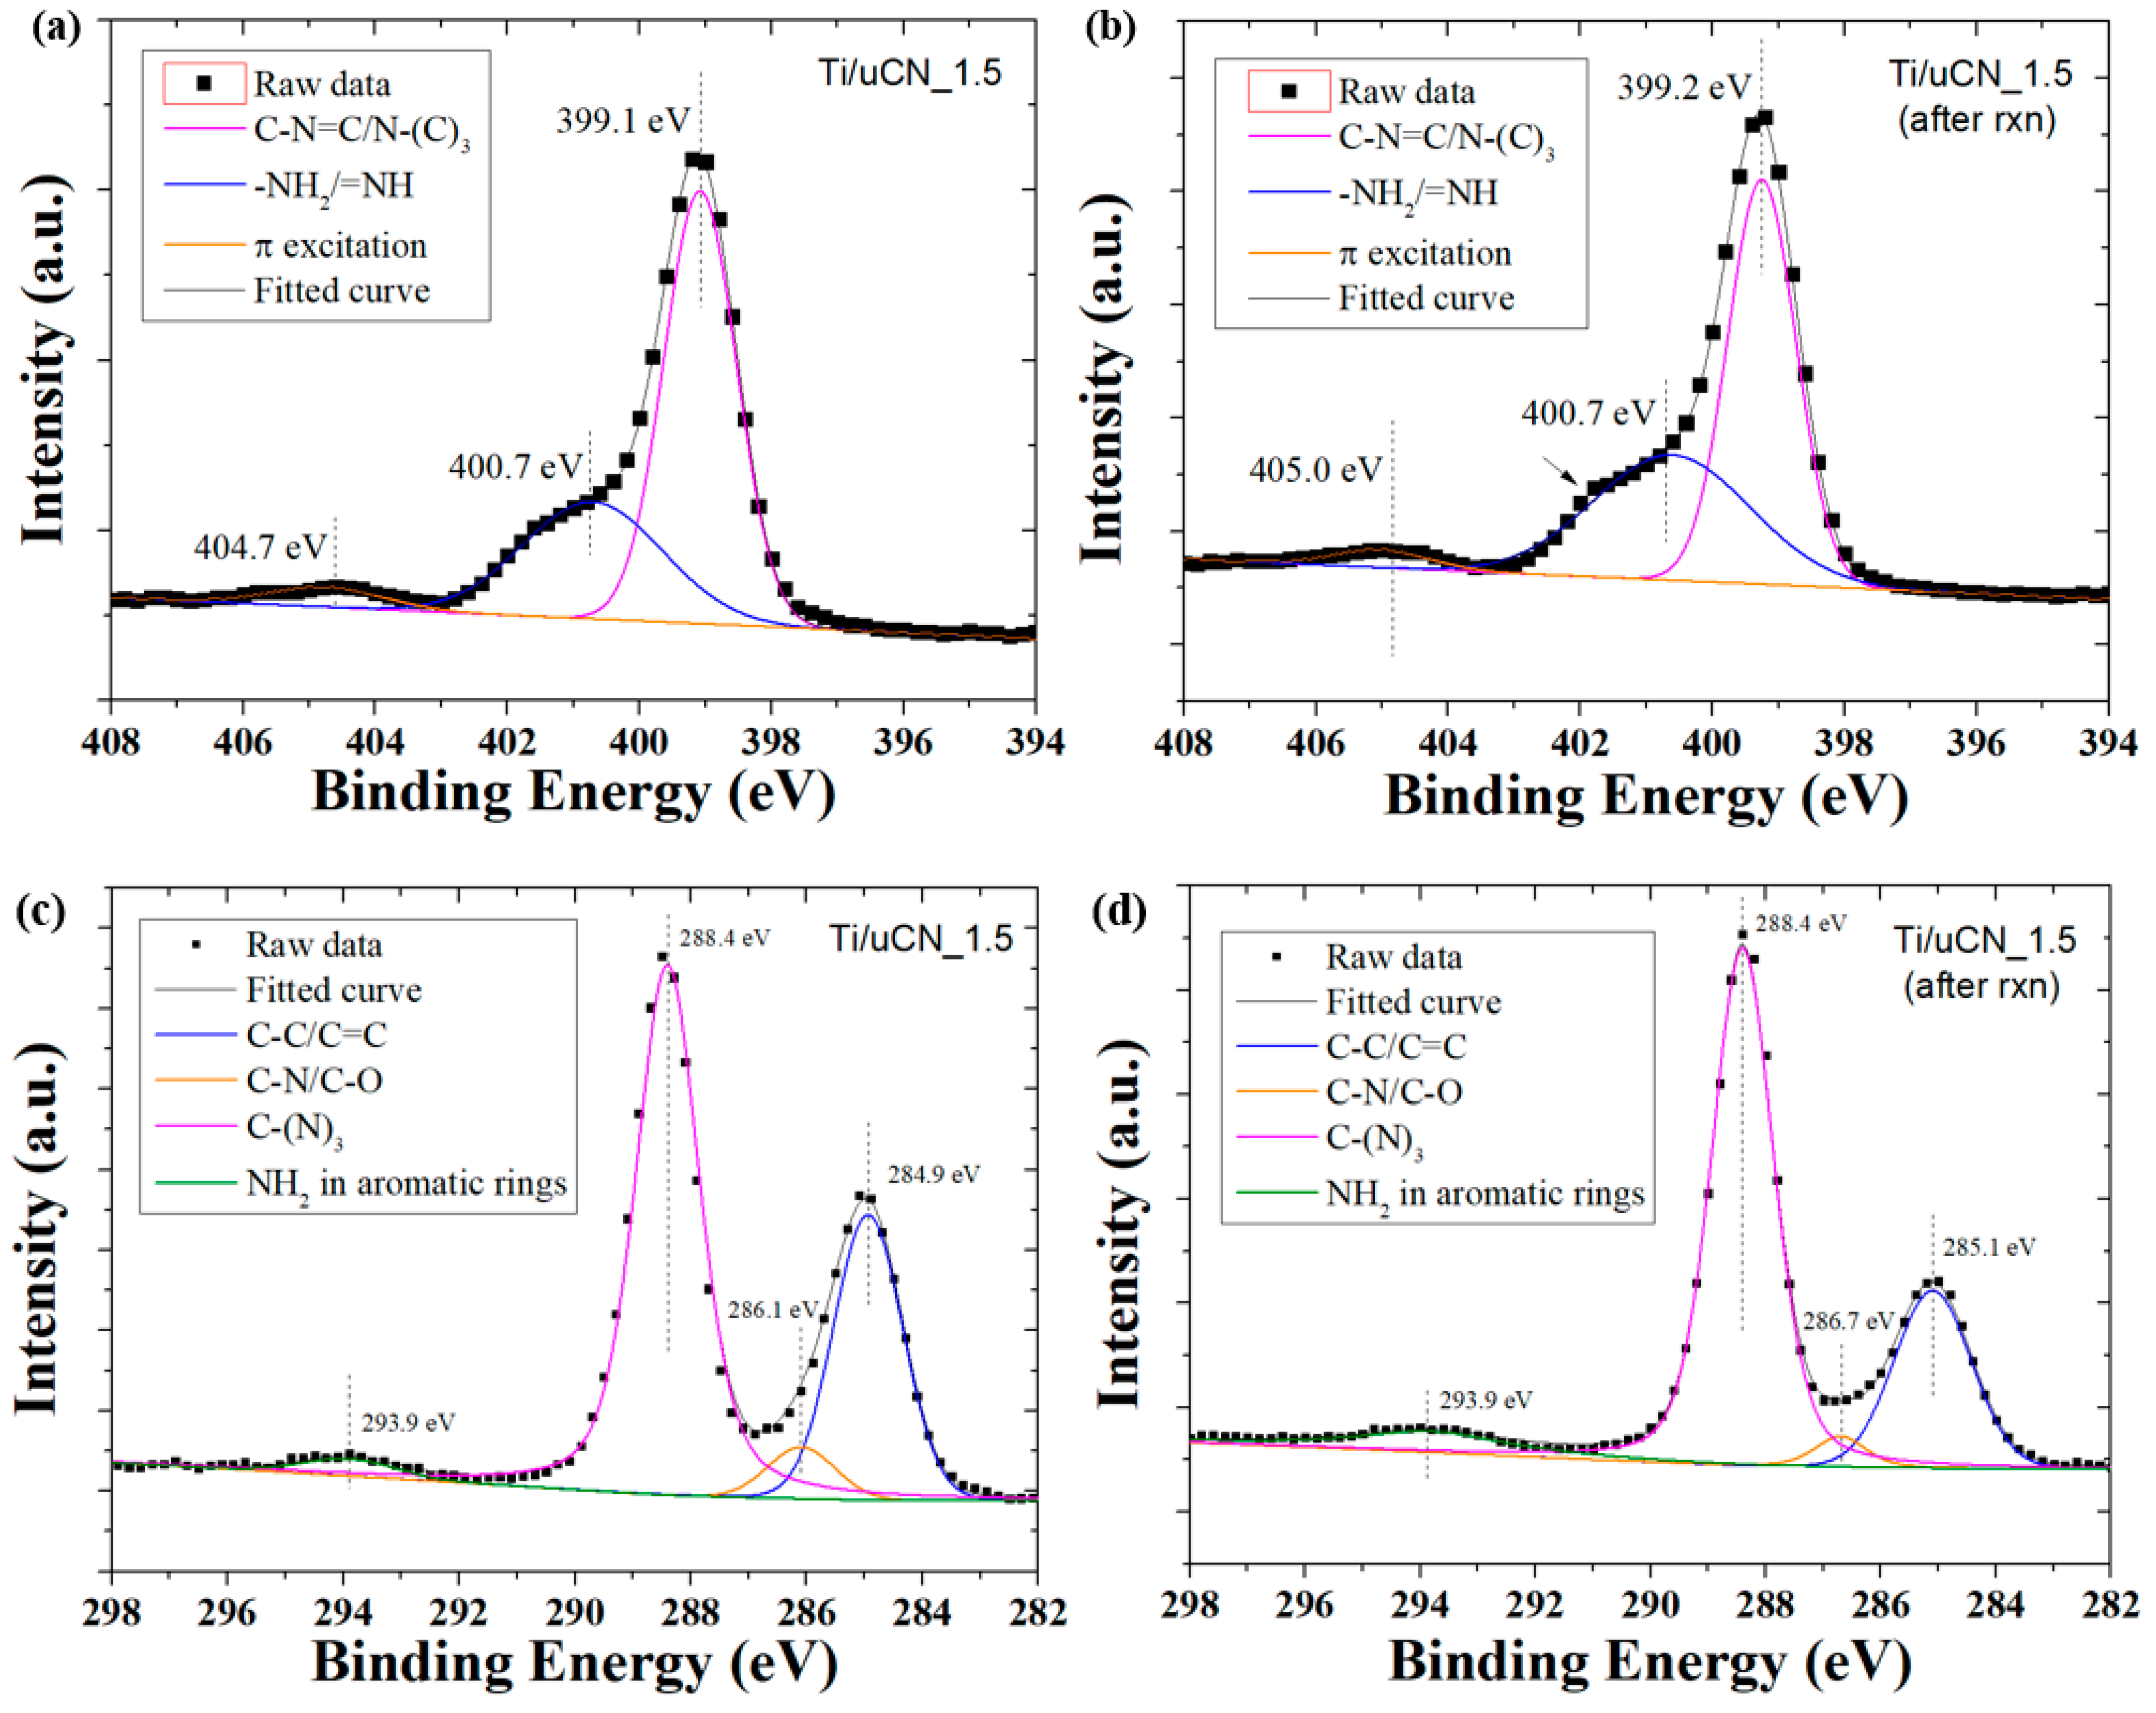
The cycling test of each sample was conducted to investigate its stability. Figure 10 plots the ability of Ti/uCN_1.5 to convert CO2 into CO or MeOH under each reaction cycle. Although the decrease in CO yield was revealed after each reaction cycle, a stable production rate of 0.05 μmol/g-h was achieved at Cycle 3. The XPS spectra together with the deconvoluted curves of Ti/uCN_1.5 before and after photoreaction are shown in Figure 11. The surface components of this sample after photoreduction are summarized in Table 2 and Table 3. The slight shift in binding energy of graphitic groups and significant decrease in the amount of C–C/C=C groups were revealed from Ti/uCN_1.5 sample after reaction. Moreover, the increase in structure defects (around 400.7 eV) and the coverage of active sites (increasing impurity at 533.3 eV) on samples may result in the decrease in photoactivity. Notably, after each reaction cycle, the sample within the reactor was merely placed in a vacuum oven at 80 °C for 2 h. Further activation process was required to retain the intrinsic photoactivity of Ti/uCN_1.5.
4. Conclusions
In this work, anatase TiO2 nanoparticles were successfully synthesized under solvothermal process and simultaneously deposited on uCN. The uCN containing TiO2 samples exhibited high surface area and sufficient reduction potential to reduce gaseous CO2 under illumination of 14-Watt LED light bulb without using sacrificial agents. The composition of surface functionality on each sample was not the only factor governing the photoactivity of each sample. The ability to absorb visible light, the reduction potential, the surface area and the surface functional groups of samples all attributed to the resultant activity or the selectivity of products. The obtained Ti/uCN_0.5 and Ti/uCN_1.5 samples exhibited better quantum efficiency toward CO2 conversion and would consistently produce CO over cycling test.
Author Contributions
Conceptualization, I.-H.T.; Data curation, I.-H.T.; Funding acquisition, I.-H.T.; Investigation, Y.-M.S. and P.-Y.C.; Methodology, I.-H.T.; Project administration, I.-H.T.; Resources, C.-Y.C.; Supervision, I.-H.T.; Visualization, I.-H.T.; Writing—Original Draft, I.-H.T.; and Writing—Review and Editing, I.-H.T.
Acknowledgments
The authors would like to acknowledge the financial supports from the Ministry of Science and Technology of Taiwan under the grant numbers of MOST 104-2221-E-035-074-MY3, MOST 106-2221-E-035-035-MY2 and MOST 107-2218-E-035-010. The authors also appreciate the Precision Instrument Support Center of Feng Chia University for providing BET and TGA measurement facilities.
Conflicts of Interest
The authors declare no conflict of interest.
References
- Lu, L.H.; Lv, Z.Z.; Si, Y.J.; Liu, M.Y.; Zhang, S. Recent progress on band and surface engineering of graphitic carbon nitride for artificial photosynthesis. Appl. Surf. Sci. 2018, 462, 693–712. [Google Scholar] [CrossRef]
- Wang, X.; Maeda, K.; Thomas, A.; Takanabe, K.; Xin, G.; Carlsson, J.M.; Domen, K.; Antonietti, M. A metal-free polymeric photocatalyst for hydrogen production from water under visible light. Nat. Mater. 2009, 8, 76–80. [Google Scholar] [CrossRef] [PubMed]
- Liu, G.; Niu, P.; Sun, C.H.; Smith, S.C.; Chen, Z.G.; Lu, G.Q.; Cheng, H.M. Unique electronic structure induced high photoreactivity of sulfur-doped graphitic C3N4. J. Am. Chem. Soc. 2010, 132, 11642–11648. [Google Scholar] [CrossRef] [PubMed]
- Dong, G.P.; Zhang, Y.H.; Pan, Q.W.; Qiu, J.R. A fantastic graphitic carbon nitride (g-C3N4) material: Electronic structure, photocatalytic and photoelectronic properties. J. Photochem. Photobiol. C Photochem. Rev. 2014, 20, 33–50. [Google Scholar] [CrossRef]
- Li, K.; Gao, S.M.; Wang, Q.Y.; Xu, H.; Wang, Z.Y.; Huang, B.B.; Dai, Y.; Lu, J. In-situ-reduced synthesis of Ti3+ self-doped TiO2/g-C3N4 heterojunctions with high photocatalytic performance under led light irradiation. ACS Appl. Mater. Interfaces 2015, 7, 9023–9030. [Google Scholar] [CrossRef]
- Tseng, I.H.; Chang, W.C.; Wu, J.C.S. Photoreduction of CO2 using sol-gel derived titania and titania-supported copper catalysts. Appl. Catal. B Environ. 2002, 37, 37–48. [Google Scholar] [CrossRef]
- Chang, P.Y.; Tseng, I.H. Photocatalytic conversion of gas phase carbon dioxide by graphitic carbon nitride decorated with cuprous oxide with various morphologies. J. CO2 Util. 2018, 26, 511–521. [Google Scholar] [CrossRef]
- Ohno, T.; Murakami, N.; Koyanagi, T.; Yang, Y. Photocatalytic reduction of CO2 over a hybrid photocatalyst composed of WO3 and graphitic carbon nitride (g-C3N4) under visible light. J. CO2 Util. 2014, 6, 17–25. [Google Scholar] [CrossRef]
- Sun, Z.X.; Wang, H.Q.; Wu, Z.B.A.; Wang, L.Z. G-C3N4 based composite photocatalysts for photocatalytic CO2 reduction. Catal. Today 2018, 300, 160–172. [Google Scholar] [CrossRef]
- Shi, G.D.; Yang, L.; Liu, Z.W.; Chen, X.; Zhou, J.Q.; Yu, Y. Photocatalytic reduction of CO2 to CO over copper decorated g-c3n4 nanosheets with enhanced yield and selectivity. Appl. Surf. Sci. 2018, 427, 1165–1173. [Google Scholar] [CrossRef]
- Jiang, Z.F.; Wan, W.M.; Li, H.M.; Yuan, S.Q.; Zhao, H.J.; Wong, P.K. A hierarchical z-scheme alpha-Fe2O3/g-C3N4 hybrid for enhanced photocatalytic CO2 reduction. Adv. Mater. 2018, 30, 9. [Google Scholar] [CrossRef]
- Xia, P.F.; Zhu, B.C.; Yu, J.G.; Cao, S.W.; Jaroniec, M. Ultra-thin nanosheet assemblies of graphitic carbon nitride for enhanced photocatalytic CO2 reduction. J. Mater. Chem. A 2017, 5, 3230–3238. [Google Scholar] [CrossRef]
- Tahir, B.; Tahir, M.; Amin, N.A.S. Photo-induced CO2 reduction by Ch4/H2O to fuels over Cu-modified g-C3N4 nanorods under simulated solar energy. Appl. Surf. Sci. 2017, 419, 875–885. [Google Scholar] [CrossRef]
- Zhang, L.H.; Jin, Z.Y.; Lu, H.; Lin, T.Q.; Ruan, S.C.; Zhao, X.S.; Zeng, Y.J. Improving the visible-light photocatalytic activity of graphitic carbon nitride by carbon black doping. ACS Omega 2018, 3, 15009–15017. [Google Scholar] [CrossRef]
- Qin, J.; Wang, S.; Ren, H.; Hou, Y.; Wang, X. Photocatalytic reduction of CO2 by graphitic carbon nitride polymers derived from urea and barbituric acid. Appl. Catal. B Environ. 2015, 179, 1–8. [Google Scholar] [CrossRef]
- Dai, K.; Lu, L.H.; Liang, C.H.; Liu, Q.; Zhu, G.P. Heterojunction of facet coupled g-C3N4/surface-fluorinated TiO2 nanosheets for organic pollutants degradation under visible led light irradiation. Appl. Catal. B Environ. 2014, 156, 331–340. [Google Scholar] [CrossRef]
- Zhou, S.; Liu, Y.; Li, J.M.; Wang, Y.J.; Jiang, G.Y.; Zhao, Z.; Wang, D.X.; Duan, A.J.; Liu, J.; Wei, Y.C. Facile in situ synthesis of graphitic carbon nitride (g-C3N4)-n-TiO2 heterojunction as an efficient photocatalyst for the selective photoreduction of CO2 to CO. Appl. Catal. B Environ. 2014, 158, 20–29. [Google Scholar] [CrossRef]
- Mao, J.; Peng, T.Y.; Zhang, X.H.; Li, K.; Ye, L.Q.; Zan, L. Effect of graphitic carbon nitride microstructures on the activity and selectivity of photocatalytic CO2 reduction under visible light. Catal. Sci. Technol. 2013, 3, 1253–1260. [Google Scholar] [CrossRef]
- Yu, J.G.; Wang, K.; Xiao, W.; Cheng, B. Photocatalytic reduction of CO2 into hydrocarbon solar fuels over g-C3N4-pt nanocomposite photocatalysts. Phys. Chem. Chem. Phys. 2014, 16, 11492–11501. [Google Scholar] [CrossRef] [PubMed]
- Thomas, A.; Fischer, A.; Goettmann, F.; Antonietti, M.; Muller, J.O.; Schlogl, R.; Carlsson, J.M. Graphitic carbon nitride materials: Variation of structure and morphology and their use as metal-free catalysts. J. Mater. Chem. 2008, 18, 4893–4908. [Google Scholar] [CrossRef]
- Goettmann, F.; Thomas, A.; Antonietti, M. Metal-free activation CO2 by mesoporous graphitic carbon nitride. Angew. Chem. Int. Ed. 2007, 46, 2717–2720. [Google Scholar] [CrossRef] [PubMed]
- Zhu, B.C.; Xia, P.F.; Ho, W.K.; Yu, J.G. Isoelectric point and adsorption activity of porous g-C3N4. Appl. Surf. Sci. 2015, 344, 188–195. [Google Scholar] [CrossRef]
- Tang, H.; Chang, S.; Jiang, L.; Tang, G.; Liang, W. Novel spindle-shaped nanoporous TiO2 coupled graphitic g-C3N4 nanosheets with enhanced visible-light photocatalytic activity. Ceram. Int. 2016, 42, 18443–18452. [Google Scholar] [CrossRef]
- Bahuguna, A.; Choudhary, P.; Chhabra, T.; Krishnan, V. Ammonia-doped polyaniline-graphitic carbon nitride nanocomposite as a heterogeneous green catalyst for synthesis of indole-substituted 4h-chromenes. ACS Omega 2018, 3, 12163–12178. [Google Scholar] [CrossRef]
- Tseng, I.H.; Sung, Y.-M.; Chang, P.-Y.; Lin, S.-W. Photocatalytic performance of titania nanosheets templated by graphene oxide. J. Photochem. Photobiol. A Chem. 2017, 339, 1–11. [Google Scholar] [CrossRef]
- Zhang, Y.W.; Liu, J.H.; Wu, G.; Chen, W. Porous graphitic carbon nitride synthesized via direct polymerization of urea for efficient sunlight-driven photocatalytic hydrogen production. Nanoscale 2012, 4, 5300–5303. [Google Scholar] [CrossRef] [PubMed]
- Choudhury, B.; Paul, K.K.; Sanyal, D.; Hazarika, A.; Giri, P.K. Evolution of nitrogen-related defects in graphitic carbon nitride nanosheets probed by positron annihilation and photoluminescence spectroscopy. J. Phys. Chem. C 2018, 122, 9209–9219. [Google Scholar] [CrossRef]
- Das, D.; Banerjee, D.; Pahari, D.; Ghorai, U.K.; Sarkar, S.; Das, N.S.; Chattopadhyay, K.K. Defect induced tuning of photoluminescence property in graphitic carbon nitride nanosheets through synthesis conditions. J. Lumines. 2017, 185, 155–165. [Google Scholar] [CrossRef]
- Praus, P.; Svoboda, L.; Ritz, M.; Troppova, I.; Sihor, M.; Koci, K. Graphitic carbon nitride: Synthesis, characterization and photocatalytic decomposition of nitrous oxide. Mater. Chem. Phys. 2017, 193, 438–446. [Google Scholar] [CrossRef]
- Kang, Y.Y.; Yang, Y.Q.; Yin, L.C.; Kang, X.D.; Liu, G.; Cheng, H.M. An amorphous carbon nitride photocatalyst with greatly extended visible-light-responsive range for photocatalytic hydrogen generation. Adv. Mater. 2015, 27, 4572–4577. [Google Scholar] [CrossRef]
- Guo, S.E.; Deng, Z.P.; Li, M.X.; Jiang, B.J.; Tian, C.G.; Pan, Q.J.; Fu, H.G. Phosphorus-doped carbon nitride tubes with a layered micro-nanostructure for enhanced visible-light photocatalytic hydrogen evolution. Angew. Chem. Int. Ed. 2016, 55, 1830–1834. [Google Scholar] [CrossRef]
- Shen, M.; Zhang, L.X.; Shi, J.L. Converting CO2 into fuels by graphitic carbon nitride-based photocatalysts. Nanotechnology 2018, 29. [Google Scholar] [CrossRef] [PubMed]
- Indrakanti, V.P.; Kubicki, J.D.; Schobert, H.H. Photoinduced activation of CO2 on ti-based heterogeneous catalysts: Current state, chemical physics-based insights and outlook. Energy Environ. Sci. 2009, 2, 745–758. [Google Scholar] [CrossRef]
- Xiong, Z.; Kuang, C.C.; Lin, K.Y.; Lei, Z.; Chen, X.X.; Gong, B.G.; Yang, J.P.; Zhao, Y.C.; Zhang, J.Y.; Xia, B.Y.; et al. Enhanced CO2 photocatalytic reduction through simultaneously accelerated H2 evolution and CO2 hydrogenation in a twin photoreactor. J. CO2 Util. 2018, 24, 500–508. [Google Scholar] [CrossRef]
- Yu, W.L.; Xu, D.F.; Peng, T.Y. Enhanced photocatalytic activity of g-C3N4 for selective CO2 reduction to CH3OH via facile coupling of ZnO: A direct z-scheme mechanism. J. Mater. Chem. A 2015, 3, 19936–19947. [Google Scholar] [CrossRef]
- He, Y.M.; Zhang, L.H.; Fan, M.H.; Wang, X.X.; Walbridge, M.L.; Nong, Q.Y.; Wu, Y.; Zhao, L.H. Z-scheme SnO2-x/g-C3N4 composite as an efficient photocatalyst for dye degradation and photocatalytic CO2 reduction. Sol. Energy Mater. Sol. Cells 2015, 137, 175–184. [Google Scholar] [CrossRef]
- Huang, Y.; Fu, M.; He, T. Synthesis of g-C3N4/BiVO4 nanocomposite photocatalyst and its application in photocatalytic reduction of CO2. Acta Phys. Chim. Sin. 2015, 31, 1145–1152. [Google Scholar]
- Zhang, X.J.; Wang, L.; Du, Q.C.; Wang, Z.Y.; Ma, S.G.; Yu, M. Photocatalytic CO2 reduction over B4C/C3N4 with internal electric field under visible light irradiation. J. Colloid Interface Sci. 2016, 464, 89–95. [Google Scholar] [CrossRef]
- Bai, Y.; Chen, T.; Wang, P.Q.; Wang, L.; Ye, L.Q.; Shi, X.; Bai, W. Size-dependent role of gold in g-C3N4/BiOBr/Au system for photocatalytic CO2 reduction and dye degradation. Sol. Energy Mater. Sol. Cells 2016, 157, 406–414. [Google Scholar] [CrossRef]
- Bian, J.C.; Huang, C.; Zhang, R.Q. Graphitic carbon nitride film: An emerging star for catalytic and optoelectronic applications. ChemSusChem 2016, 9, 2723–2735. [Google Scholar] [CrossRef]
- Zhang, Y.J.; Schnepp, Z.; Cao, J.Y.; Ouyang, S.X.; Li, Y.; Ye, J.H.; Liu, S.Q. Biopolymer-activated graphitic carbon nitride towards a sustainable photocathode material. Sci. Rep. 2013, 3, 5. [Google Scholar] [CrossRef] [PubMed]
- Tan, L.H.; Xu, J.H.; Li, S.Y.; Li, D.N.; Dai, Y.M.; Kou, B.; Chen, Y. Direct growth of cuo nanorods on graphitic carbon nitride with synergistic effect on thermal decomposition of ammonium perchlorate. Materials 2017, 10, 484. [Google Scholar] [CrossRef]
- Fu, Y.Q.; Du, H.J.; Zhang, S.; Huang, W.M. Xps characterization of surface and interfacial structure of sputtered tini films on si substrate. Mater. Sci. Eng. A 2005, 403, 25–31. [Google Scholar] [CrossRef]
- Peng, H.-L.; Zhong, F.-Y.; Zhang, J.-B.; Zhang, J.-Y.; Wu, P.-K.; Huang, K.; Fan, J.-P.; Jiang, L.-L. Graphitic carbon nitride functionalized with polyethylenimine for highly effective capture of carbon dioxide. Ind. Eng. Chem. Res. 2018, 57, 11031–11038. [Google Scholar] [CrossRef]
- Fu, J.W.; Zhu, B.C.; Jiang, C.J.; Cheng, B.; You, W.; Yu, J.G. Hierarchical porous o-doped g-C3N4 with enhanced photocatalytic CO2 reduction activity. Small 2017, 13, 9. [Google Scholar] [CrossRef] [PubMed]
- Sun, Z.; Wang, S.; Li, Q.; Lyu, M.; Butburee, T.; Luo, B.; Wang, H.; Fischer, J.M.T.A.; Zhang, C.; Wu, Z.; et al. Enriching CO2 activation sites on graphitic carbon nitride with simultaneous introduction of electron-transfer promoters for superior photocatalytic CO2-to-fuel conversion. Adv. Sustain. Syst. 2017, 1, 1700003. [Google Scholar] [CrossRef]
- Wu, H.-Z.; Bandaru, S.; Huang, X.-L.; Liu, J.; Li, L.; Wang, Z.-L. Theoretical insight into the mechanism of photoreduction CO2 to CO by graphitic carbon nitride. Phys. Chem. Chem. Phys. 2018. [Google Scholar] [CrossRef]
- Gondal, M.A.; Lais, A.; Dastageer, M.A.; Yang, D.; Shen, K.; Chang, X. Photocatalytic conversion of CO2 into methanol using graphitic carbon nitride under solar, UV laser and broadband radiations. Int. J. Energy Res. 2017, 41, 2162–2172. [Google Scholar] [CrossRef]
- Sarkar, A.; Gracia-Espino, E.; Wagberg, T.; Shchukarev, A.; Mohl, M.; Rautio, A.R.; Pitkanen, O.; Sharifi, T.; Kordas, K.; Mikkola, J.P. Photocatalytic reduction of CO2 with H2O over modified TiO2 nanofibers: Understanding the reduction pathway. Nano Res. 2016, 9, 1956–1968. [Google Scholar] [CrossRef]
- Wang, B.Y.; Chen, W.; Song, Y.F.; Li, G.H.; Wei, W.; Fang, J.H.; Sun, Y.H. Recent progress in the photocatalytic reduction of aqueous carbon dioxide. Catal. Today 2018, 311, 23–39. [Google Scholar] [CrossRef]
Figure 1.
XRD patterns of: (a) gCN; and (b) Ti-uCN.

Figure 2.
SEM and TEM images of: (a,a′) uCN; (b,b′) mCN; and (c,c′) dCN.
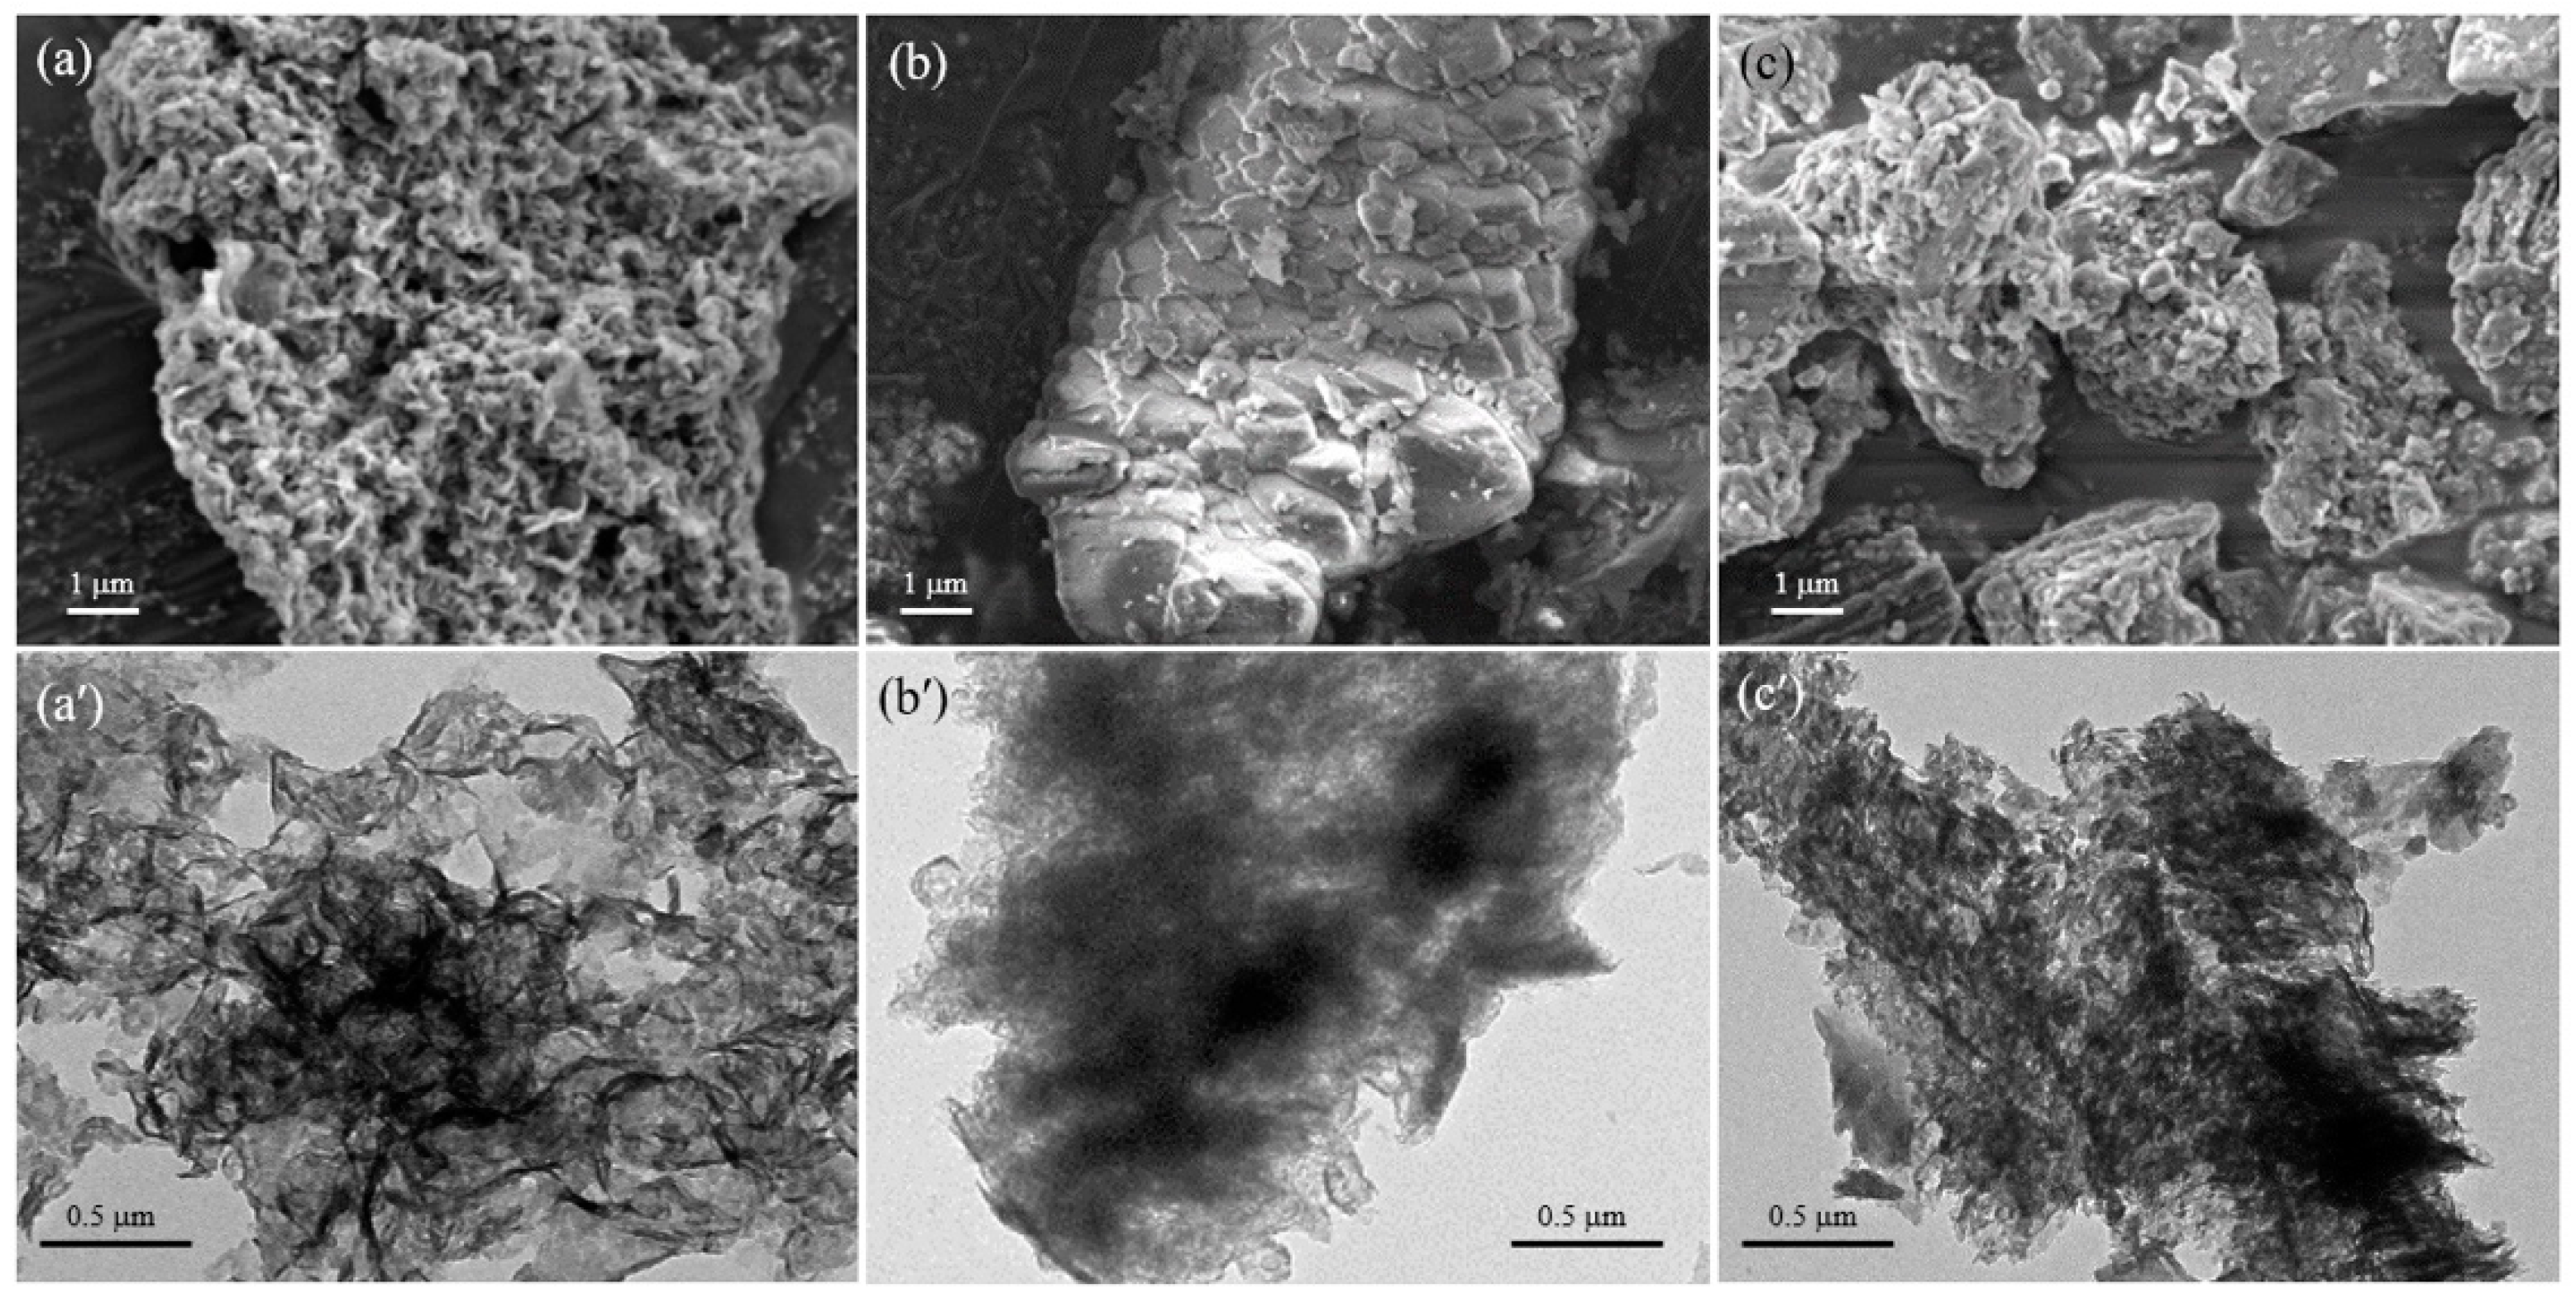
Figure 3.
TEM images of: (a) TiO2; (b) Ti/uCN_0.25; (c) Ti/uCN_0.5; (d) Ti/uCN_1; (e) Ti/uCN_1.5; and (f) Ti/uCN_2.
Figure 3.
TEM images of: (a) TiO2; (b) Ti/uCN_0.25; (c) Ti/uCN_0.5; (d) Ti/uCN_1; (e) Ti/uCN_1.5; and (f) Ti/uCN_2.

Figure 4.
(a) Thermogravimetric curves; (b) UV-Vis spectra; and (c) photoluminescence spectra (Ex. λ = 315 nm); (d) XPS valence band spectra of uCN, TiO2 and Ti/uCN_x; and (e) schematic band edge position of samples with respect to redox potentials of species measured at pH 7.
Figure 4.
(a) Thermogravimetric curves; (b) UV-Vis spectra; and (c) photoluminescence spectra (Ex. λ = 315 nm); (d) XPS valence band spectra of uCN, TiO2 and Ti/uCN_x; and (e) schematic band edge position of samples with respect to redox potentials of species measured at pH 7.

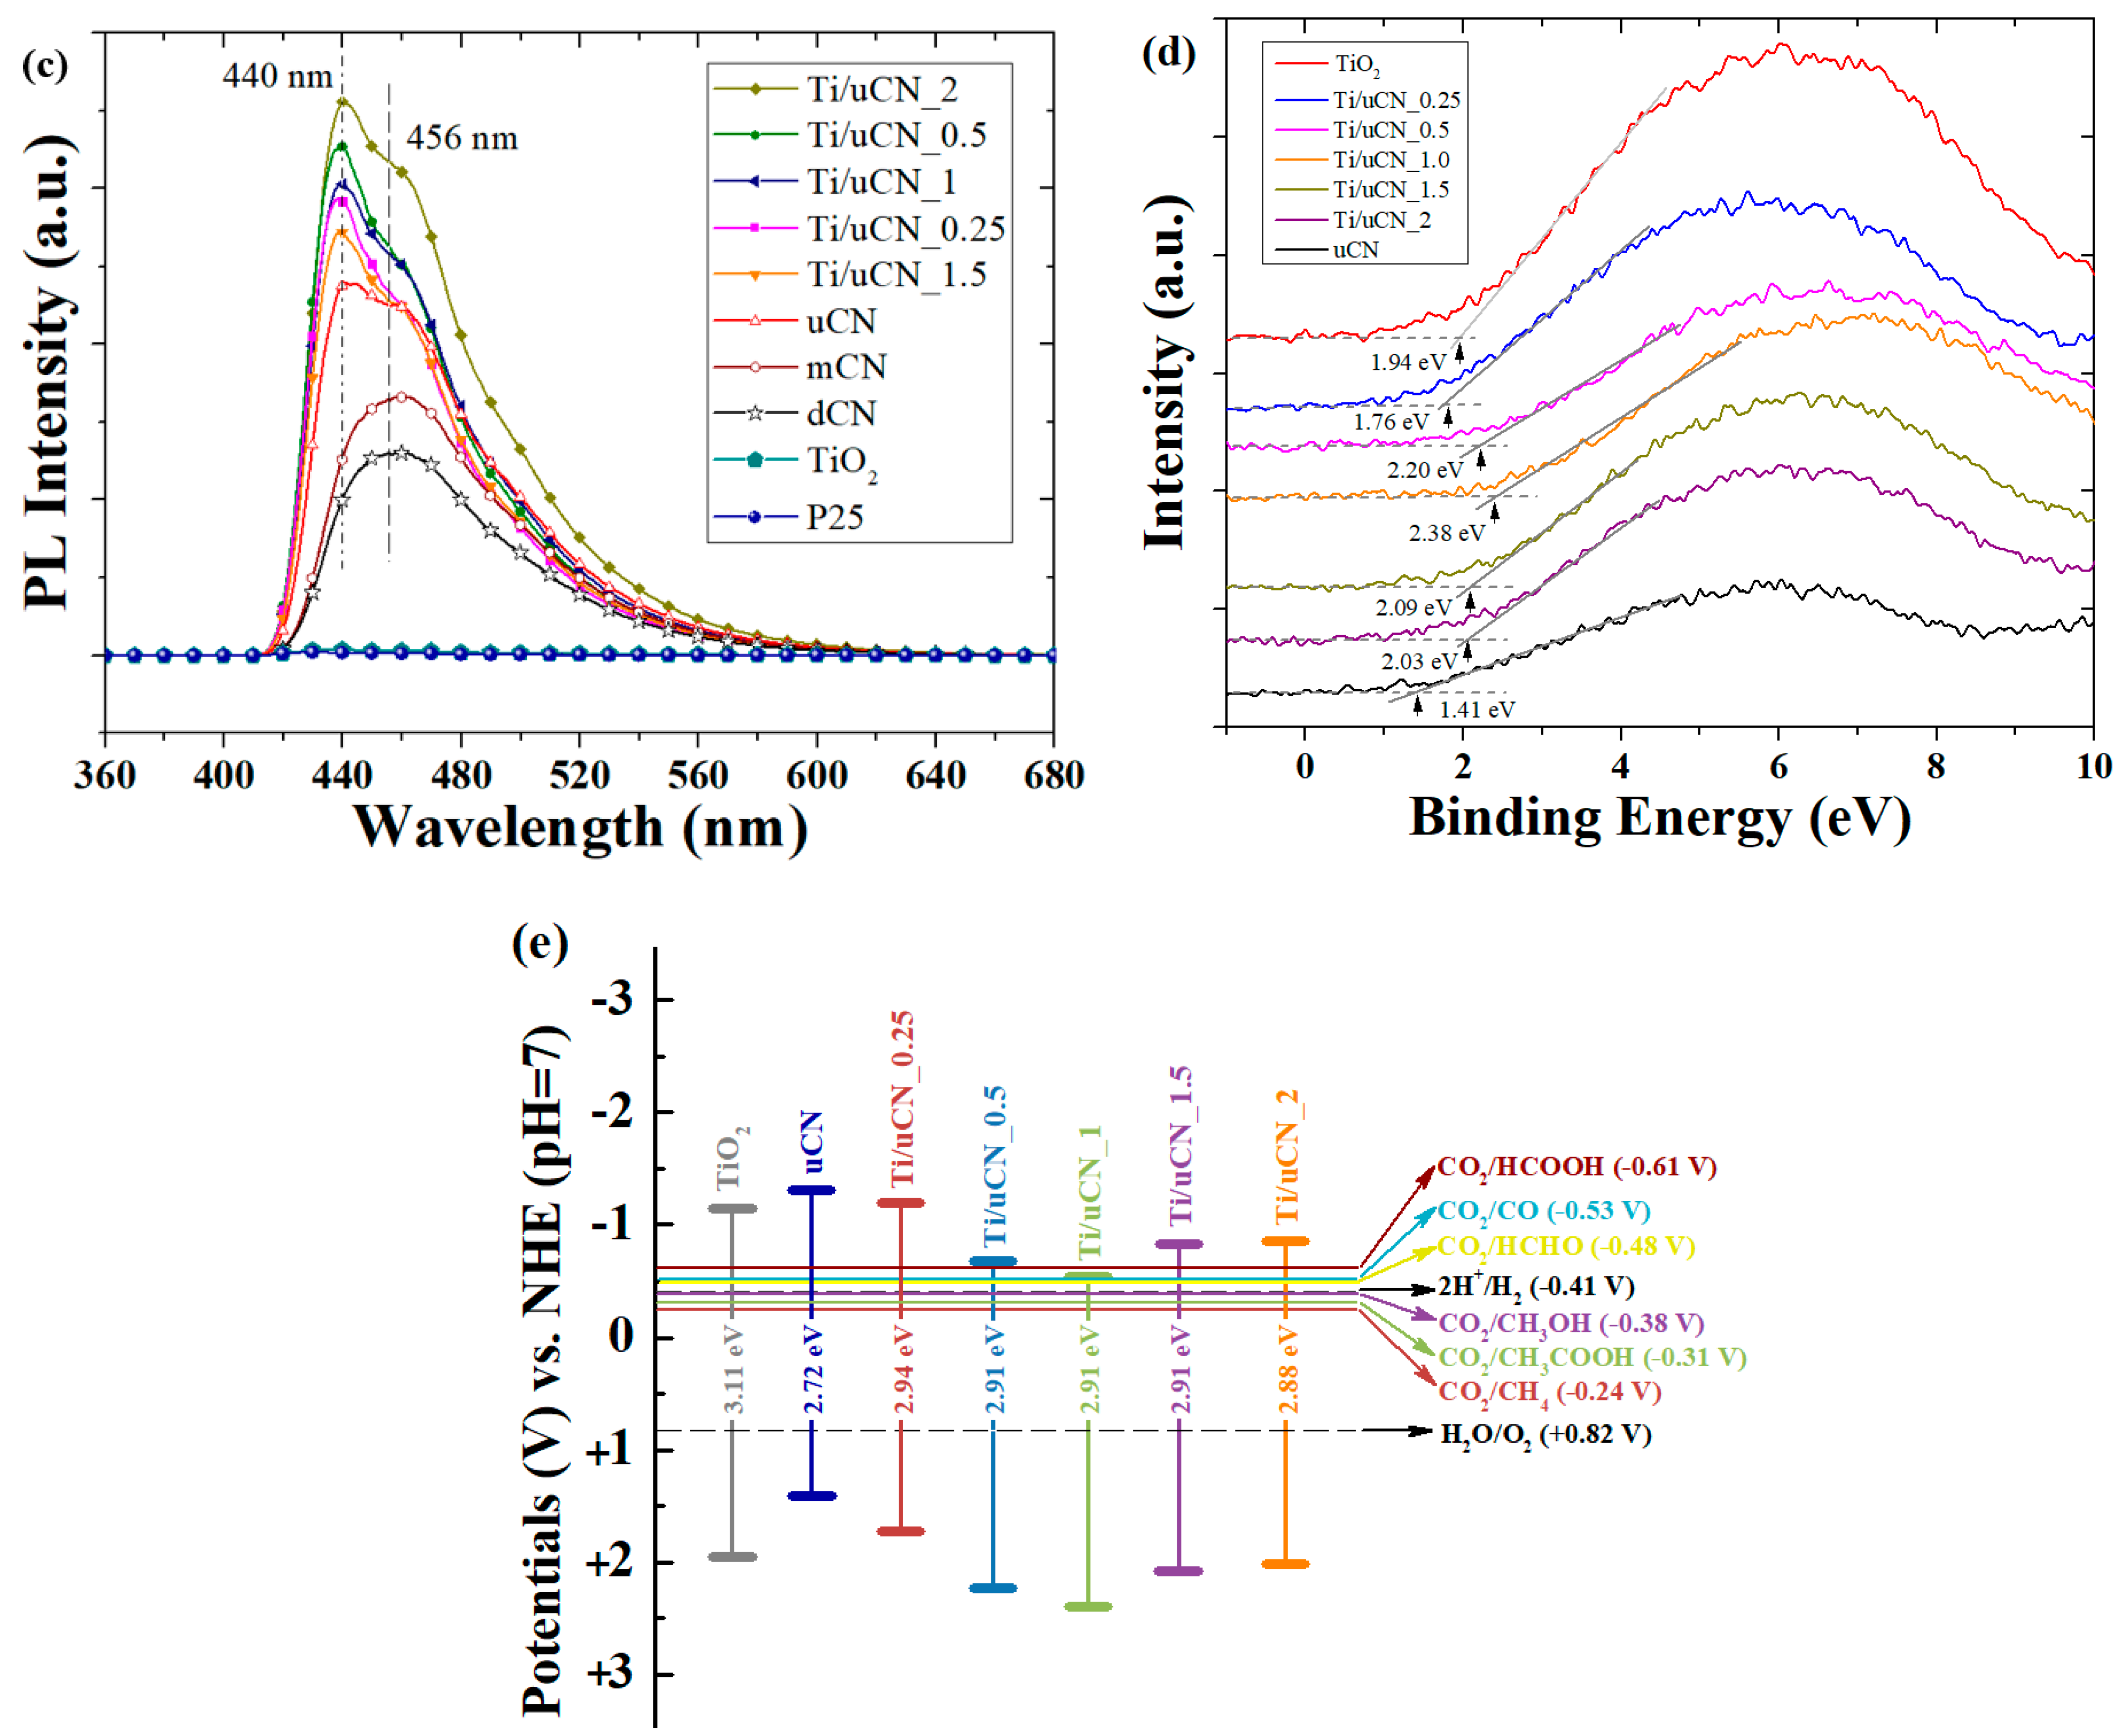
Figure 5.
Time courses of (a) CO and (b) MeOH yields from each sample under LED illumination.

Figure 6.
Converted CO2 amounts and quantum efficiency (QE) of each sample.

Figure 7.
XPS spectra and deconvoluted curves in (a) C1s and (b) N1s region of gCN samples.

Figure 8.
XPS spectra of uCN and Ti/uCN_x samples in: (a) C1s; (b) N1s; (c) Ti2p; and (d) O1s regions.
Figure 8.
XPS spectra of uCN and Ti/uCN_x samples in: (a) C1s; (b) N1s; (c) Ti2p; and (d) O1s regions.

Figure 9.
Relationship between initial (2 h) yield of products and surface ratio of carbon-contained functional groups of Ti/uCN_x samples.
Figure 9.
Relationship between initial (2 h) yield of products and surface ratio of carbon-contained functional groups of Ti/uCN_x samples.

Figure 10.
CO and MeOH yield from Ti/uCN_1.5 under three reaction cycles.

Figure 11.
Deconvoluted XPS spectra in: (a,b) N1s; (c,d) C1s; and (e,f) O1s regions from Ti/uCN_1.5 (a,c,e) before and (b,d,f) after photoreduction.
Figure 11.
Deconvoluted XPS spectra in: (a,b) N1s; (c,d) C1s; and (e,f) O1s regions from Ti/uCN_1.5 (a,c,e) before and (b,d,f) after photoreduction.


Table 1.
Characteristics of Ti/uCN_x, TiO2 and uCN samples.
| Sample Code | Char Yield (%) | Mass Ratio (uCN/TiO2) | BET Surface Area (m2/g) | Band Gap c (eV) | |
|---|---|---|---|---|---|
| Ideal a | Actual b | ||||
| TiO2 | 88.88 | - | - | 193 | 3.11 |
| Ti/uCN_0.25 | 71.65 | 0.25 | 0.28 | 170 | 2.94 |
| Ti/uCN_0.5 | 57.73 | 0.50 | 0.61 | - | 2.91 |
| Ti/uCN_1 | 47.73 | 1.00 | 0.99 | - | 2.91 |
| Ti/uCN_1.5 | 41.08 | 1.50 | 1.36 | 156 | 2.91 |
| Ti/uCN_2 | 35.10 | 2.00 | 1.82 | 44 | 2.88 |
| uCN | 5.34 | - | - | 88 | 2.72 |
| dCN | - | - | - | 14 | 2.78 |
| mCN | - | - | - | 14 | 2.75 |
a Mass ratio of added gCN to resultant TiO2 from added TBOT (4.27 mL). b Calculated from TGA char yield. c Estimated from Tauc Plot. The band gap of commercial TiO2, P25, is 3.24 eV.
Table 2.
Surface composition of carbon-contained functional groups based on XPS C1s fitting results.
Table 2.
Surface composition of carbon-contained functional groups based on XPS C1s fitting results.
| Sample Code | C1s Composition (%) | |||
|---|---|---|---|---|
| C–C/C=C (285.1 eV) a | C–N/C–O (286.4 eV) a | C–(N)3 (288.4 eV) a | NH2 in Aromatic Rings (293.9 eV) a | |
| Ti/uCN_0.25 | 44.2 | 8.1 | 45.3 | 2.4 |
| Ti/uCN_0.5 | 25.0 | 5.1 | 62.3 | 7.6 |
| Ti/uCN_1 | 31.9 | 4.9 | 58.2 | 5.0 |
| Ti/uCN_1.5 | 31.6 | 4.5 | 61.7 | 2.2 |
| Ti/uCN_1.5 b | 25.9 | 3.4 | 67.8 | 2.6 |
| Ti/uCN_2 | 27.7 | 9.4 | 60.1 | 2.8 |
| uCN | 25.4 | 9.5 | 62.2 | 2.9 |
| dCN | 20.5 | 8.0 | 68.0 | 3.5 |
| mCN | 11.7 | 15.9 | 68.0 | 4.4 |
a Approximate peak center position. b After photoreaction (Cycle 2).
Table 3.
Surface composition of nitrogen-contained and oxygen-contained functional groups based on XPS N1s or O1s fitting results.
Table 3.
Surface composition of nitrogen-contained and oxygen-contained functional groups based on XPS N1s or O1s fitting results.
| Sample Code | N1s Composition (%) | O1s Composition (%) | ||||
|---|---|---|---|---|---|---|
| C–N=C/N–(C)3 (399.1 eV) a | –NH2/=NH (401.0 eV) a | π Excitation (404.7 eV) a | Ti–O (530.2 eV) a | –OH (531.9 eV) a | Ti–O–C (533.3 eV) a | |
| Ti/uCN_0.25 | 54.2 | 41.7 | 4.0 | 81.7 | 14.5 | 3.8 |
| Ti/uCN_0.5 | 64.9 | 30.5 | 4.6 | 77.6 | 16.7 | 5.7 |
| Ti/uCN_1 | 63.8 | 31.8 | 4.4 | 81.5 | 15.4 | 3.1 |
| Ti/uCN_1.5 | 62.7 | 32.8 | 4.5 | 80.0 | 15.3 | 4.8 |
| Ti/uCN_1.5 b | 56.3 | 40.2 | 3.5 | 74.1 | 17.9 | 8.0 |
| Ti/uCN_2 | 69.7 | 25.0 | 5.4 | 78.4 | 15.8 | 5.8 |
| uCN | 68.1 | 26.6 | 5.2 | - | - | - |
| dCN | 65.2 | 26.7 | 8.1 | - | - | - |
| mCN | 76.4 | 14.0 | 9.5 | - | - | - |
a Approximate position of deconvoluted peak. b After photoreaction (Cycle 2).
© 2019 by the authors. Licensee MDPI, Basel, Switzerland. This article is an open access article distributed under the terms and conditions of the Creative Commons Attribution (CC BY) license (http://creativecommons.org/licenses/by/4.0/).
Share and Cite
MDPI and ACS Style
Tseng, I.-H.; Sung, Y.-M.; Chang, P.-Y.; Chen, C.-Y. Anatase TiO2-Decorated Graphitic Carbon Nitride for Photocatalytic Conversion of Carbon Dioxide. Polymers 2019, 11, 146. https://doi.org/10.3390/polym11010146
AMA Style
Tseng I-H, Sung Y-M, Chang P-Y, Chen C-Y. Anatase TiO2-Decorated Graphitic Carbon Nitride for Photocatalytic Conversion of Carbon Dioxide. Polymers. 2019; 11(1):146. https://doi.org/10.3390/polym11010146
Chicago/Turabian StyleTseng, I-Hsiang, Yu-Min Sung, Po-Ya Chang, and Chin-Yi Chen. 2019. "Anatase TiO2-Decorated Graphitic Carbon Nitride for Photocatalytic Conversion of Carbon Dioxide" Polymers 11, no. 1: 146. https://doi.org/10.3390/polym11010146
Note that from the first issue of 2016, this journal uses article numbers instead of page numbers. See further details here.