Evaluating the Effects of Nanosilica on Mechanical and Tribological Properties of Polyvinyl Alcohol/Polyacrylamide Polymer Composites for Artificial Cartilage from an Atomic Level

Abstract
:
1. Introduction
2. Modeling and Method
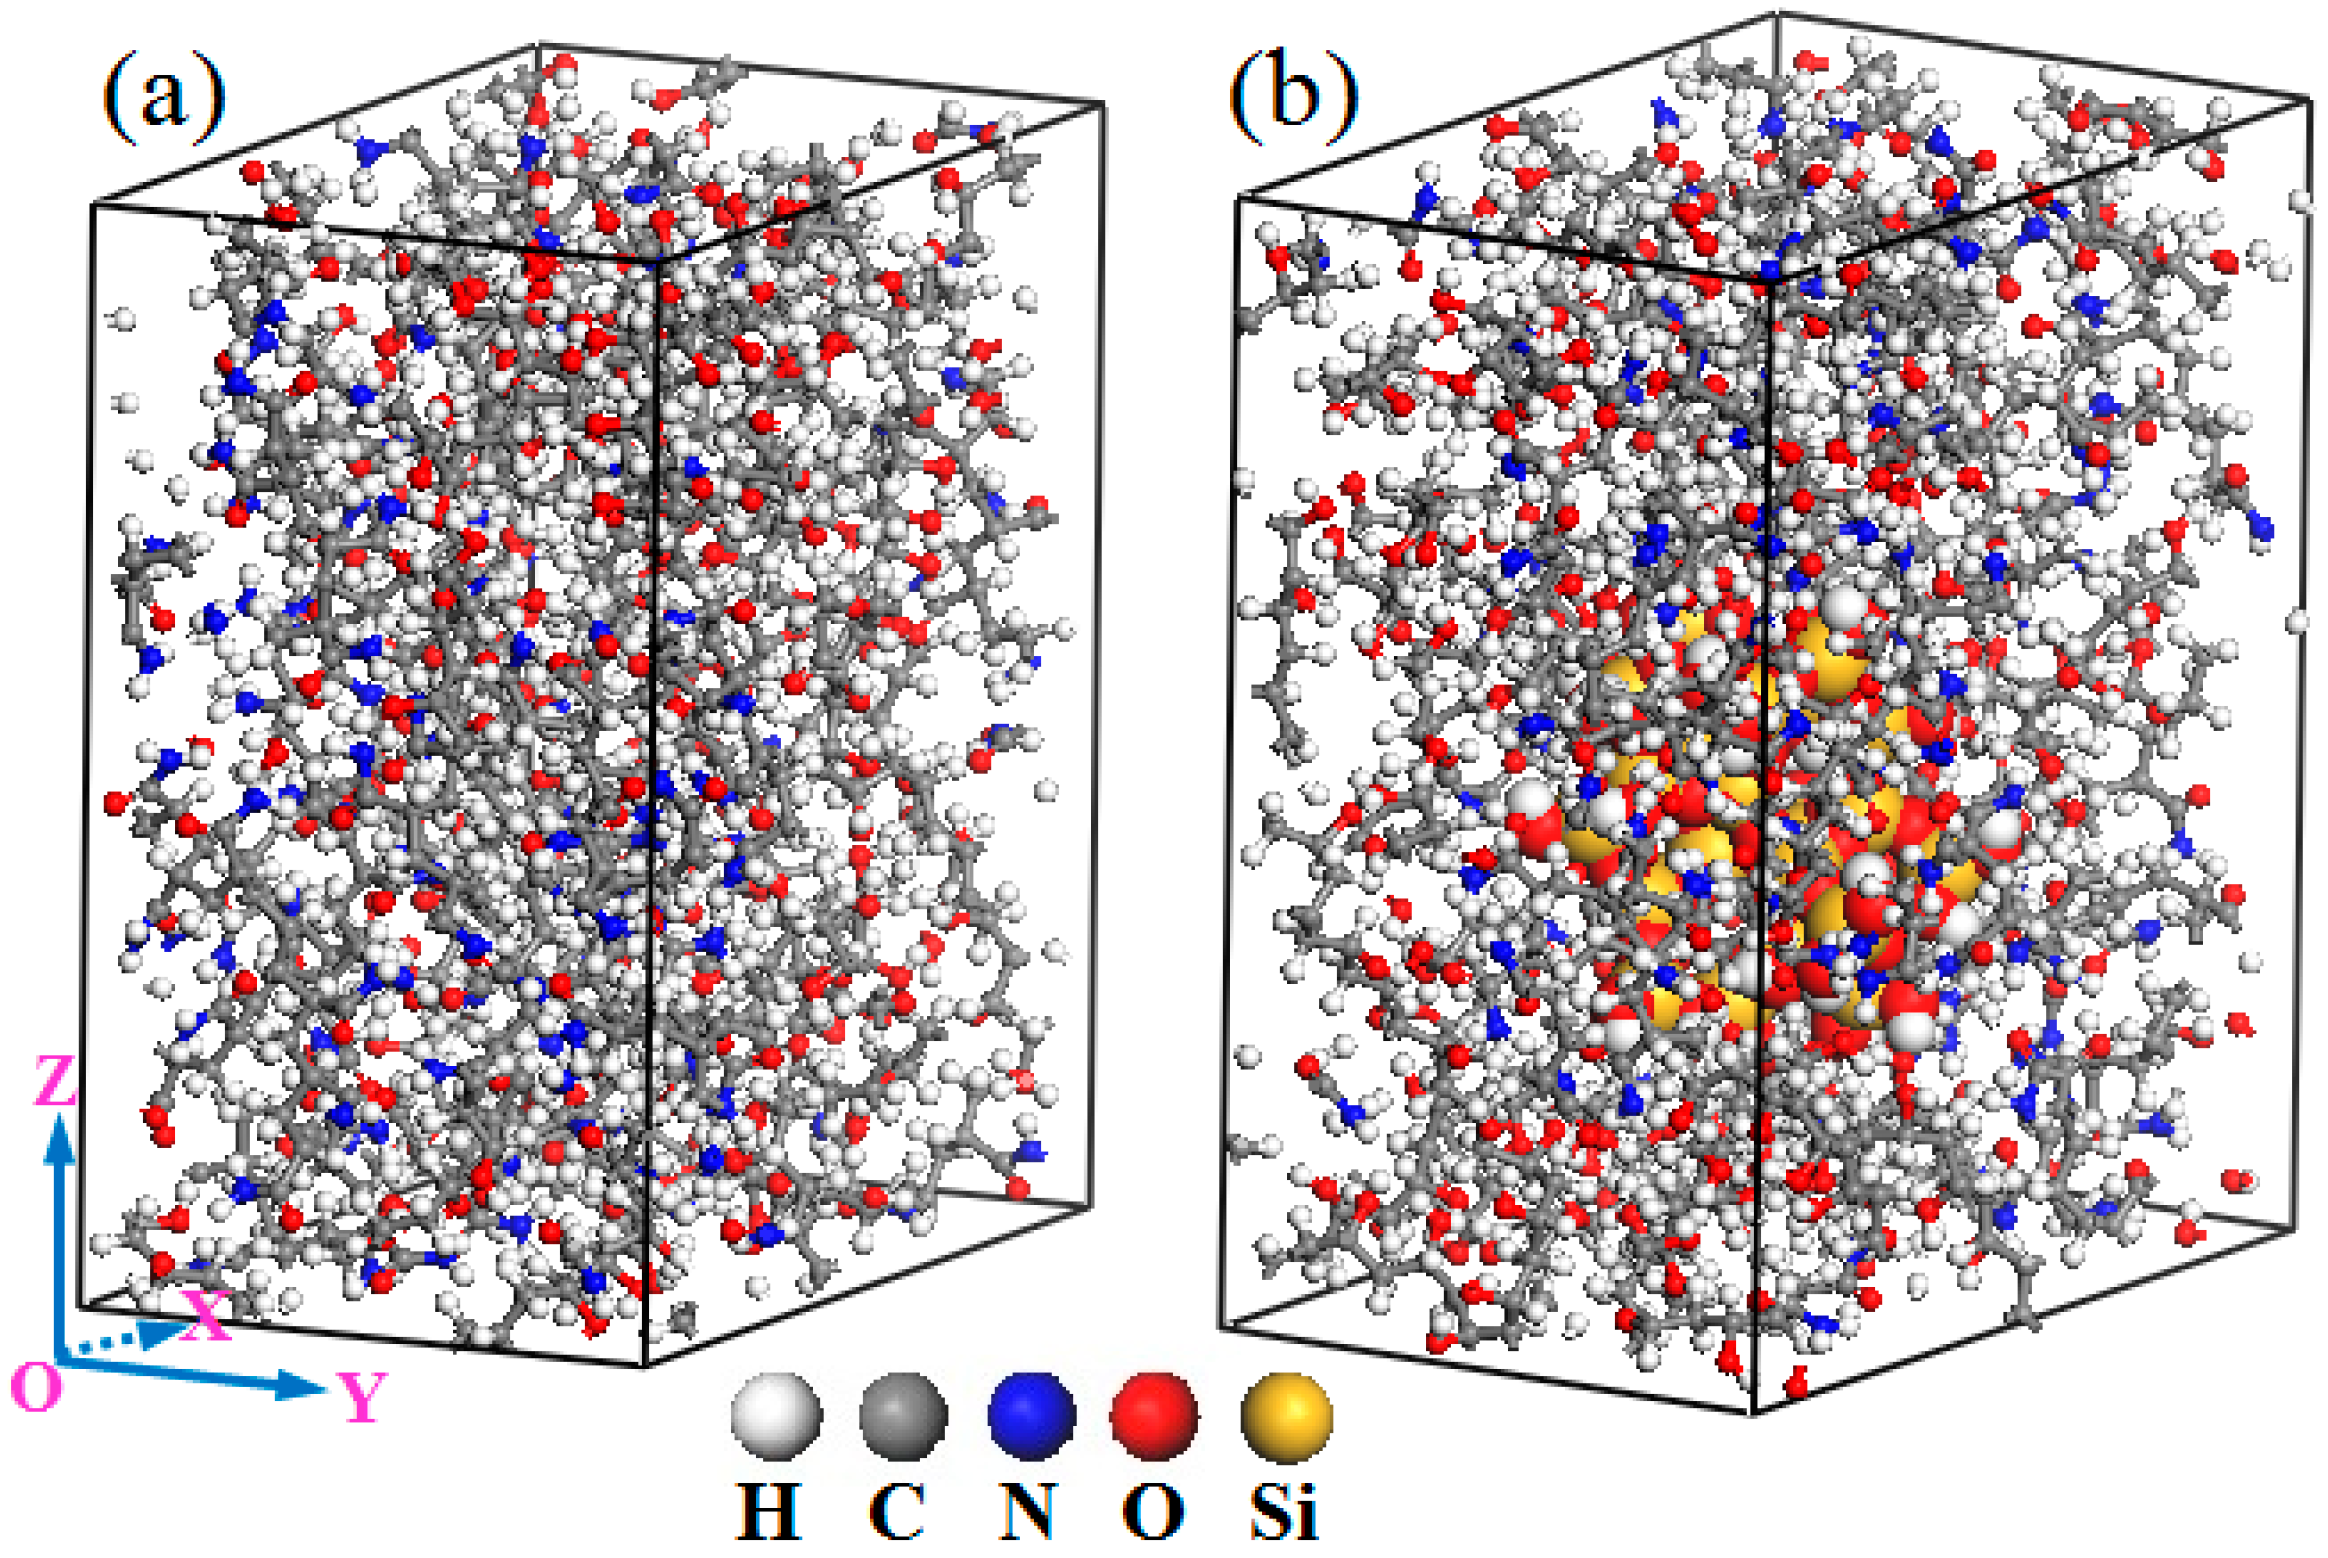
2.1. Amorphous Cell
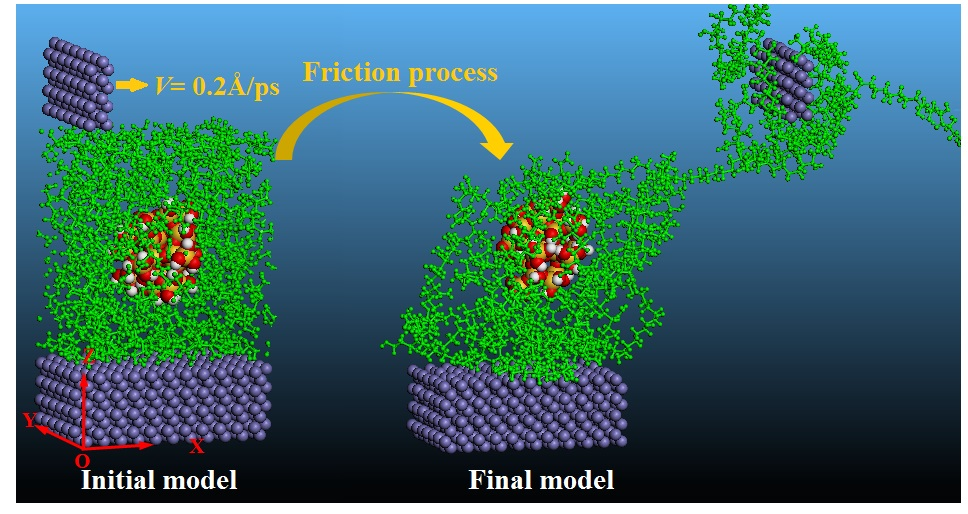
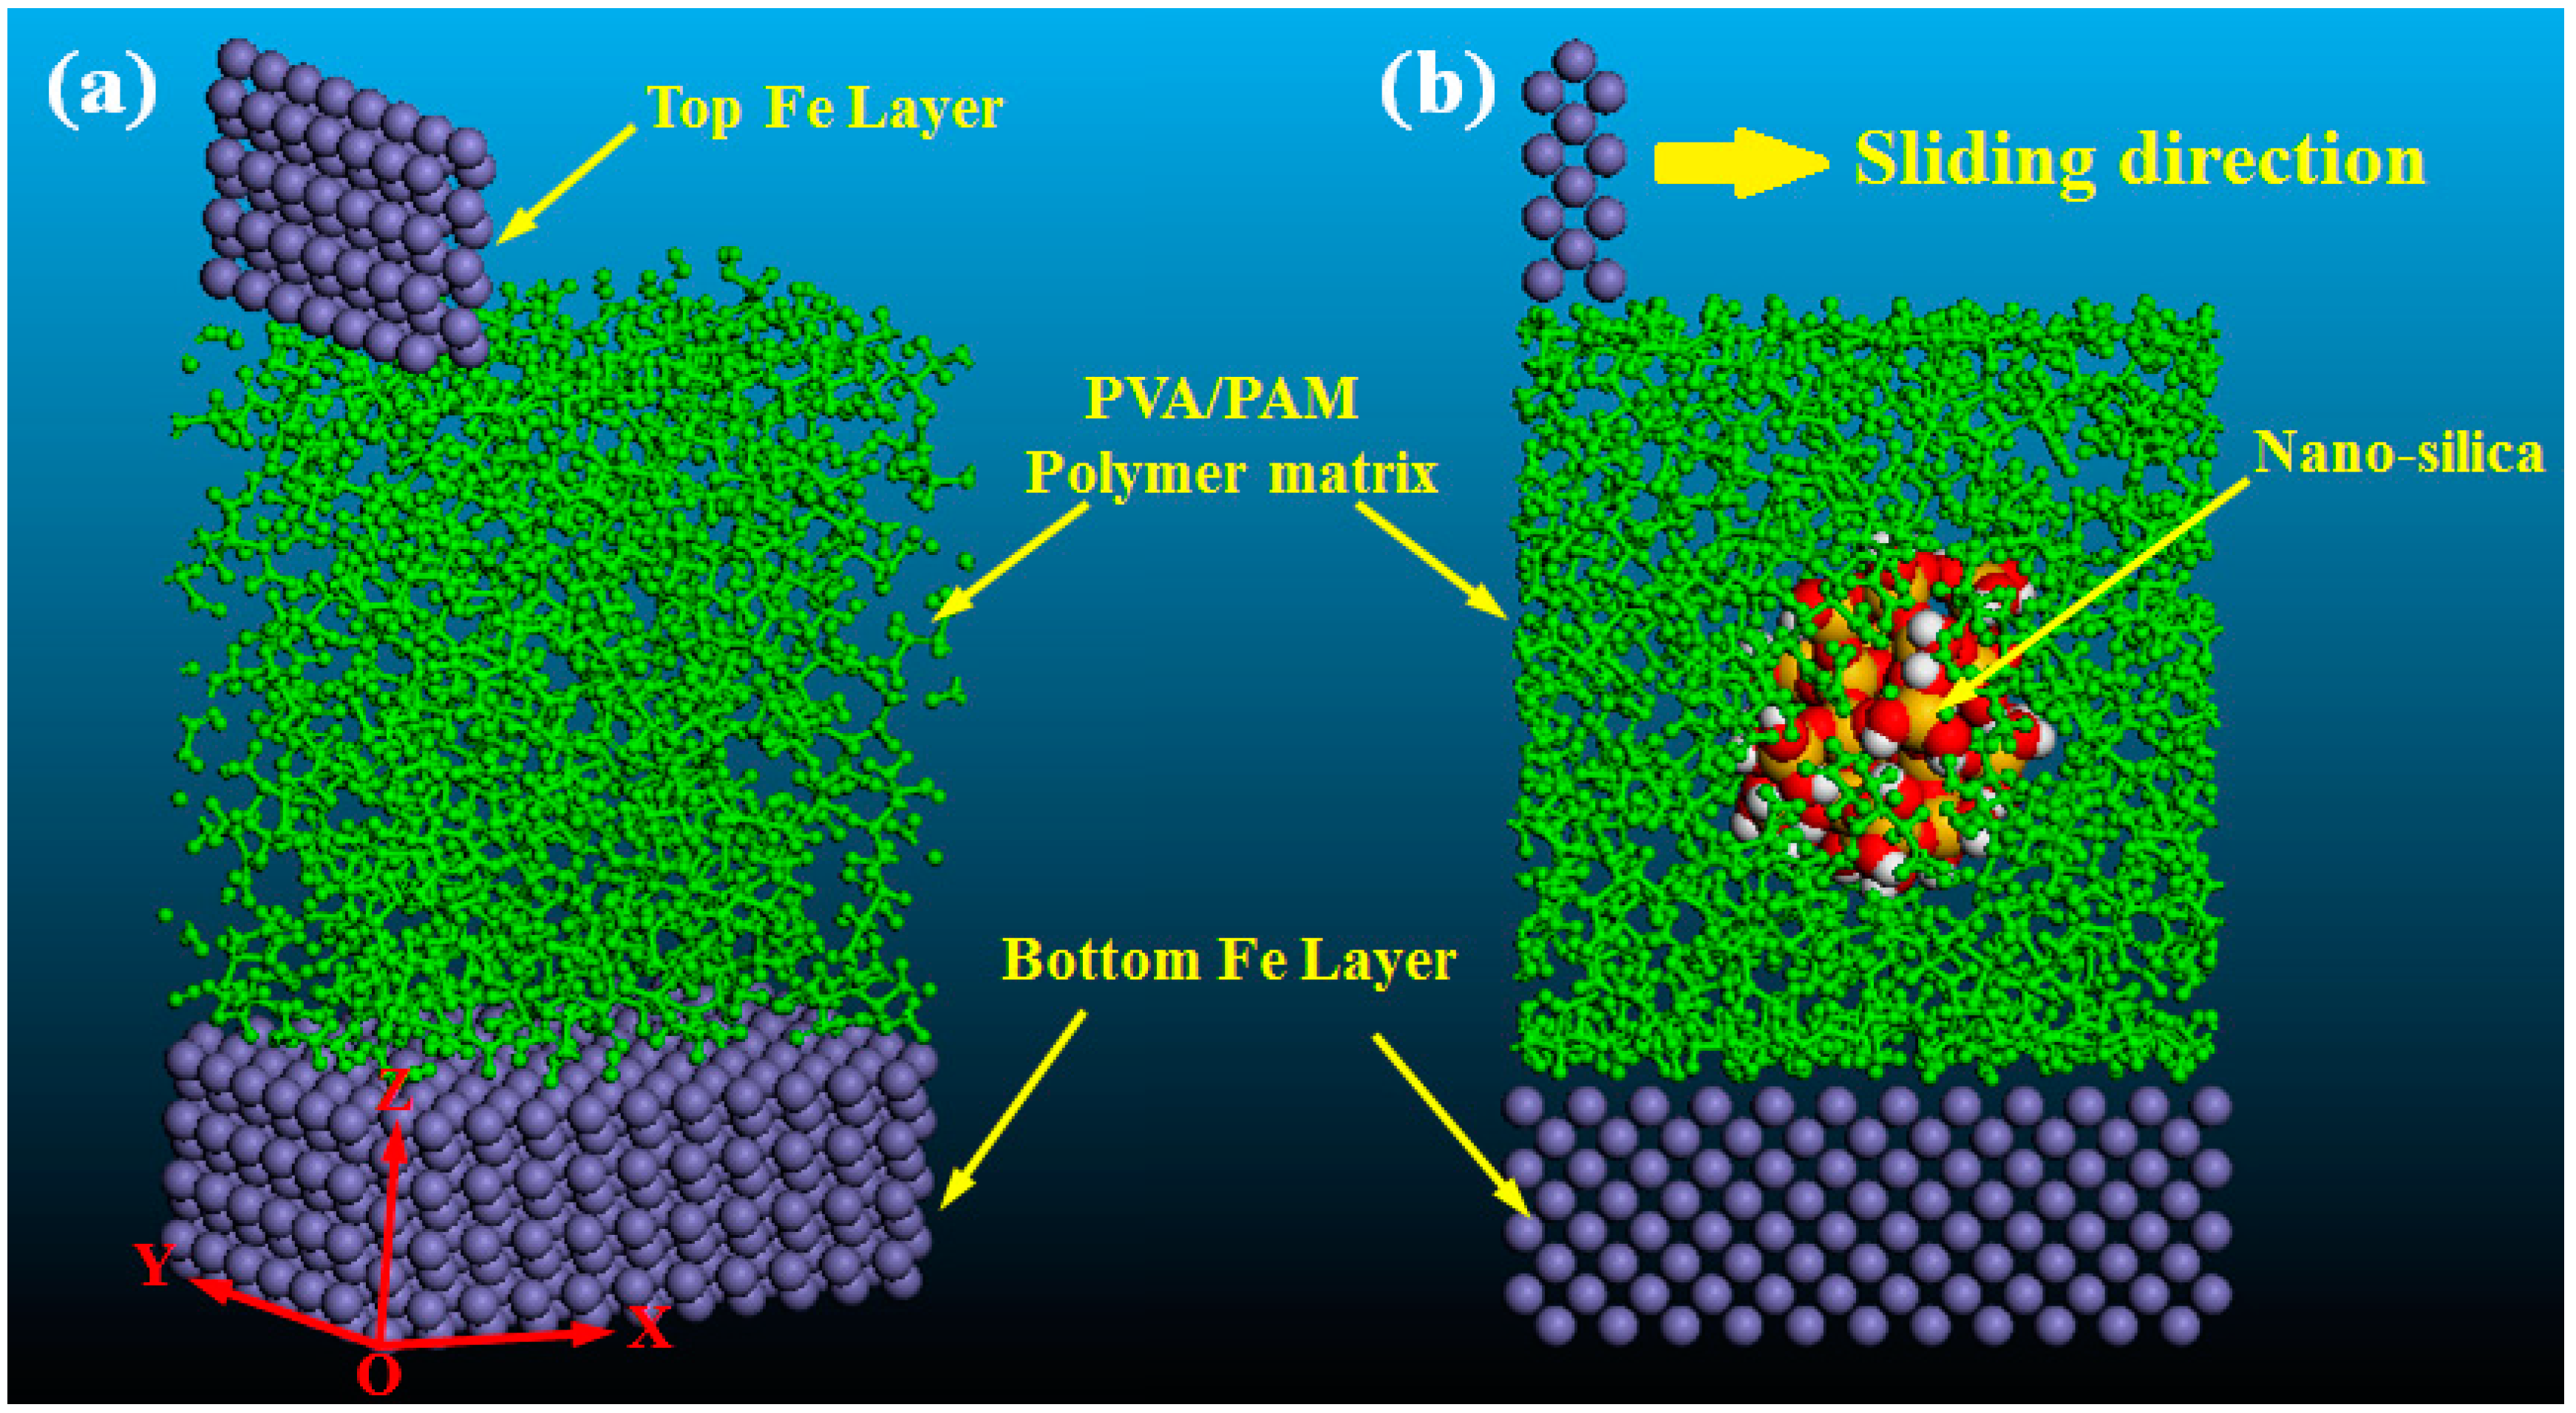
2.2. Friction Model
2.3. Simulation Process
3. Results and Discussion
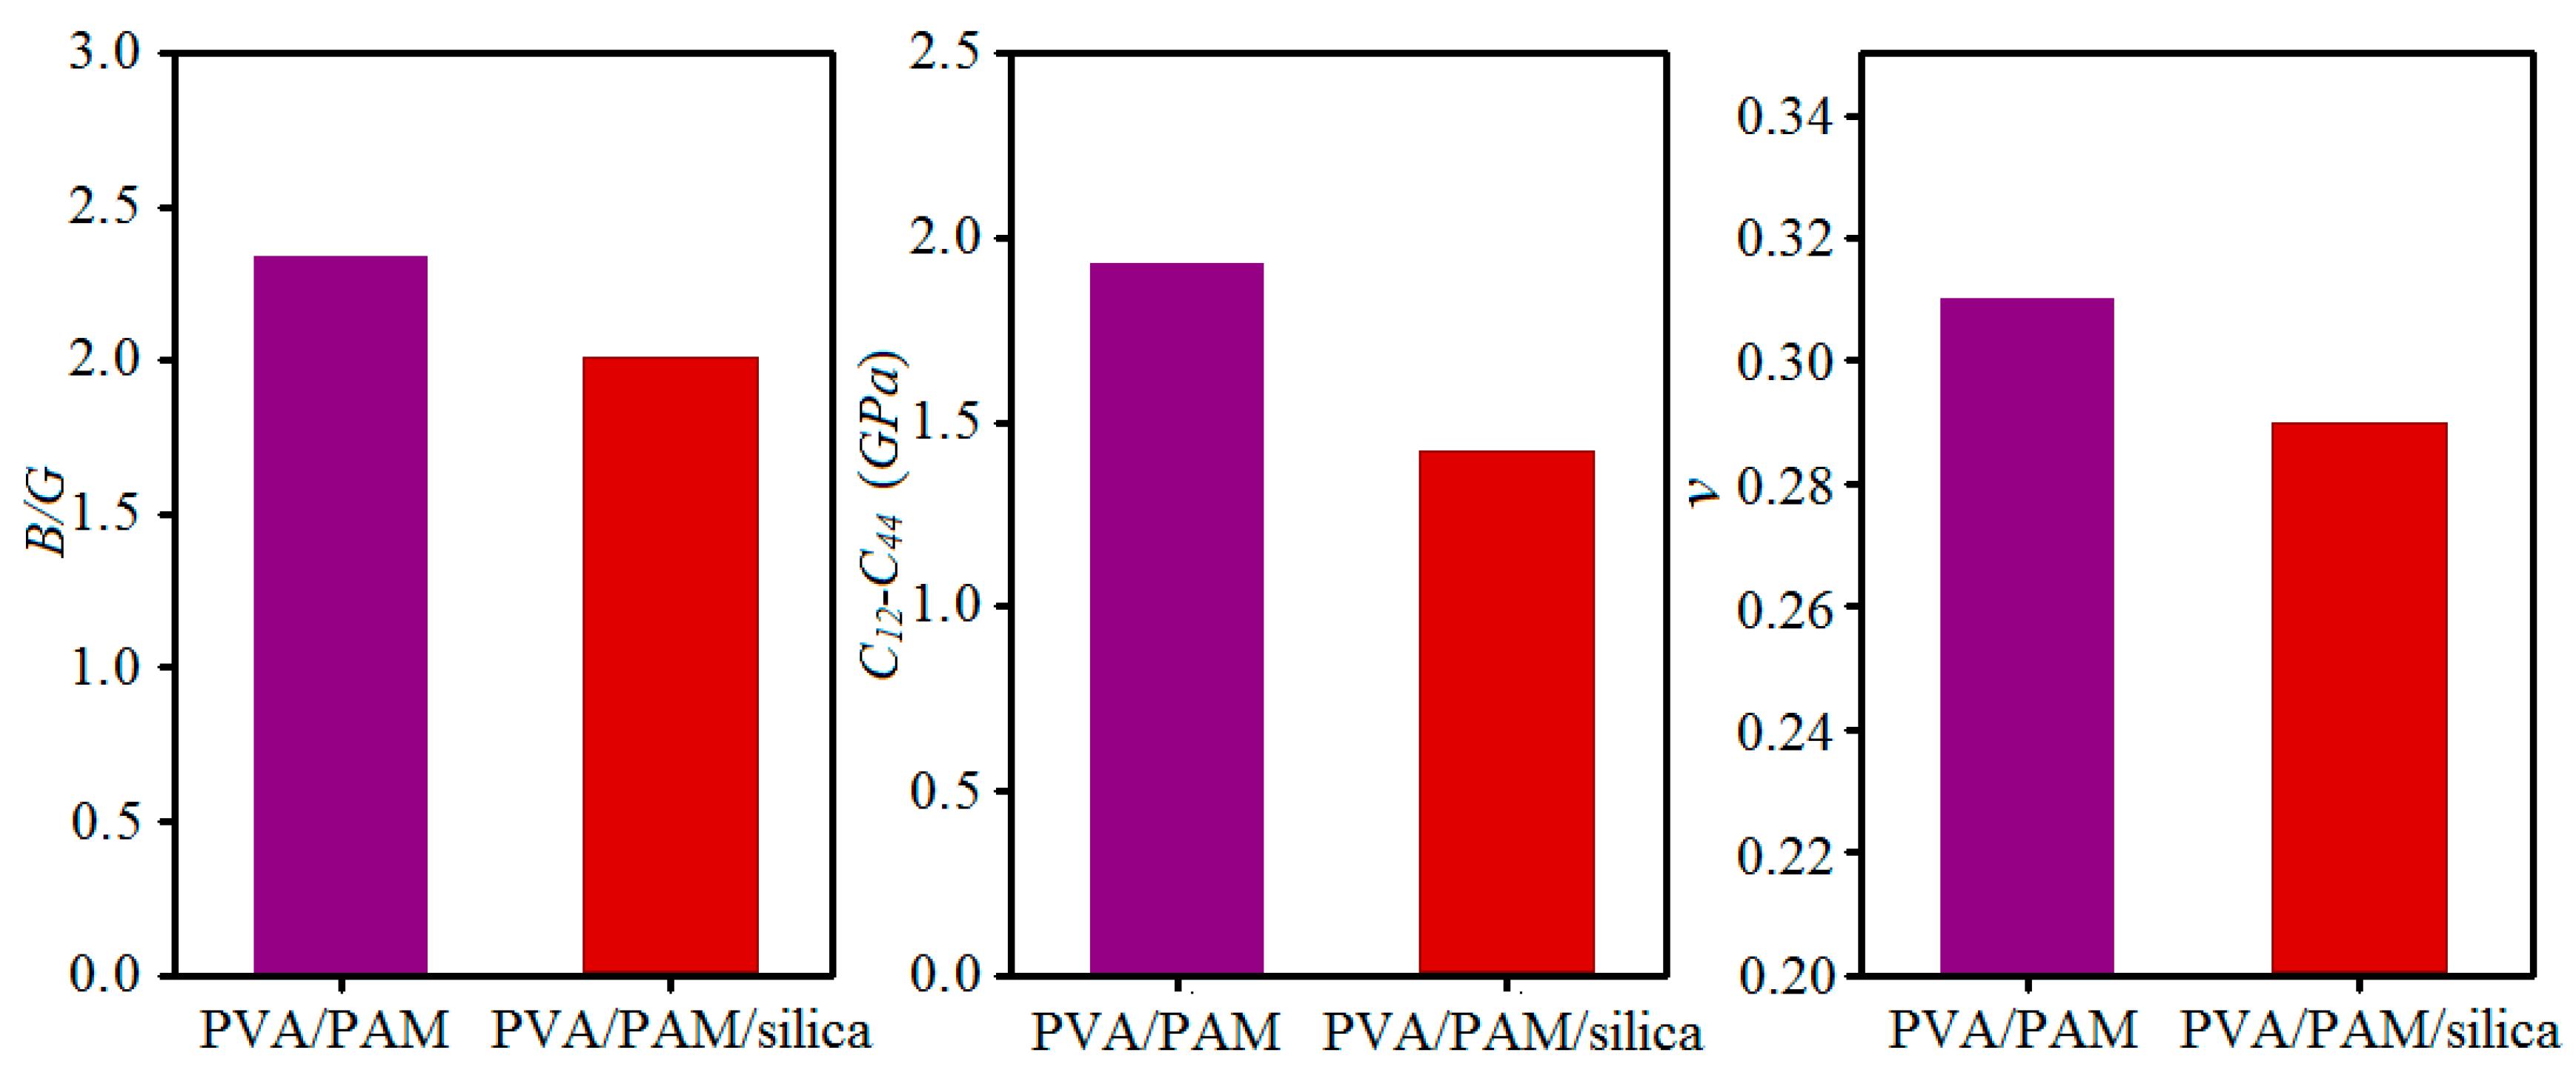
3.1. Mechanical Properties
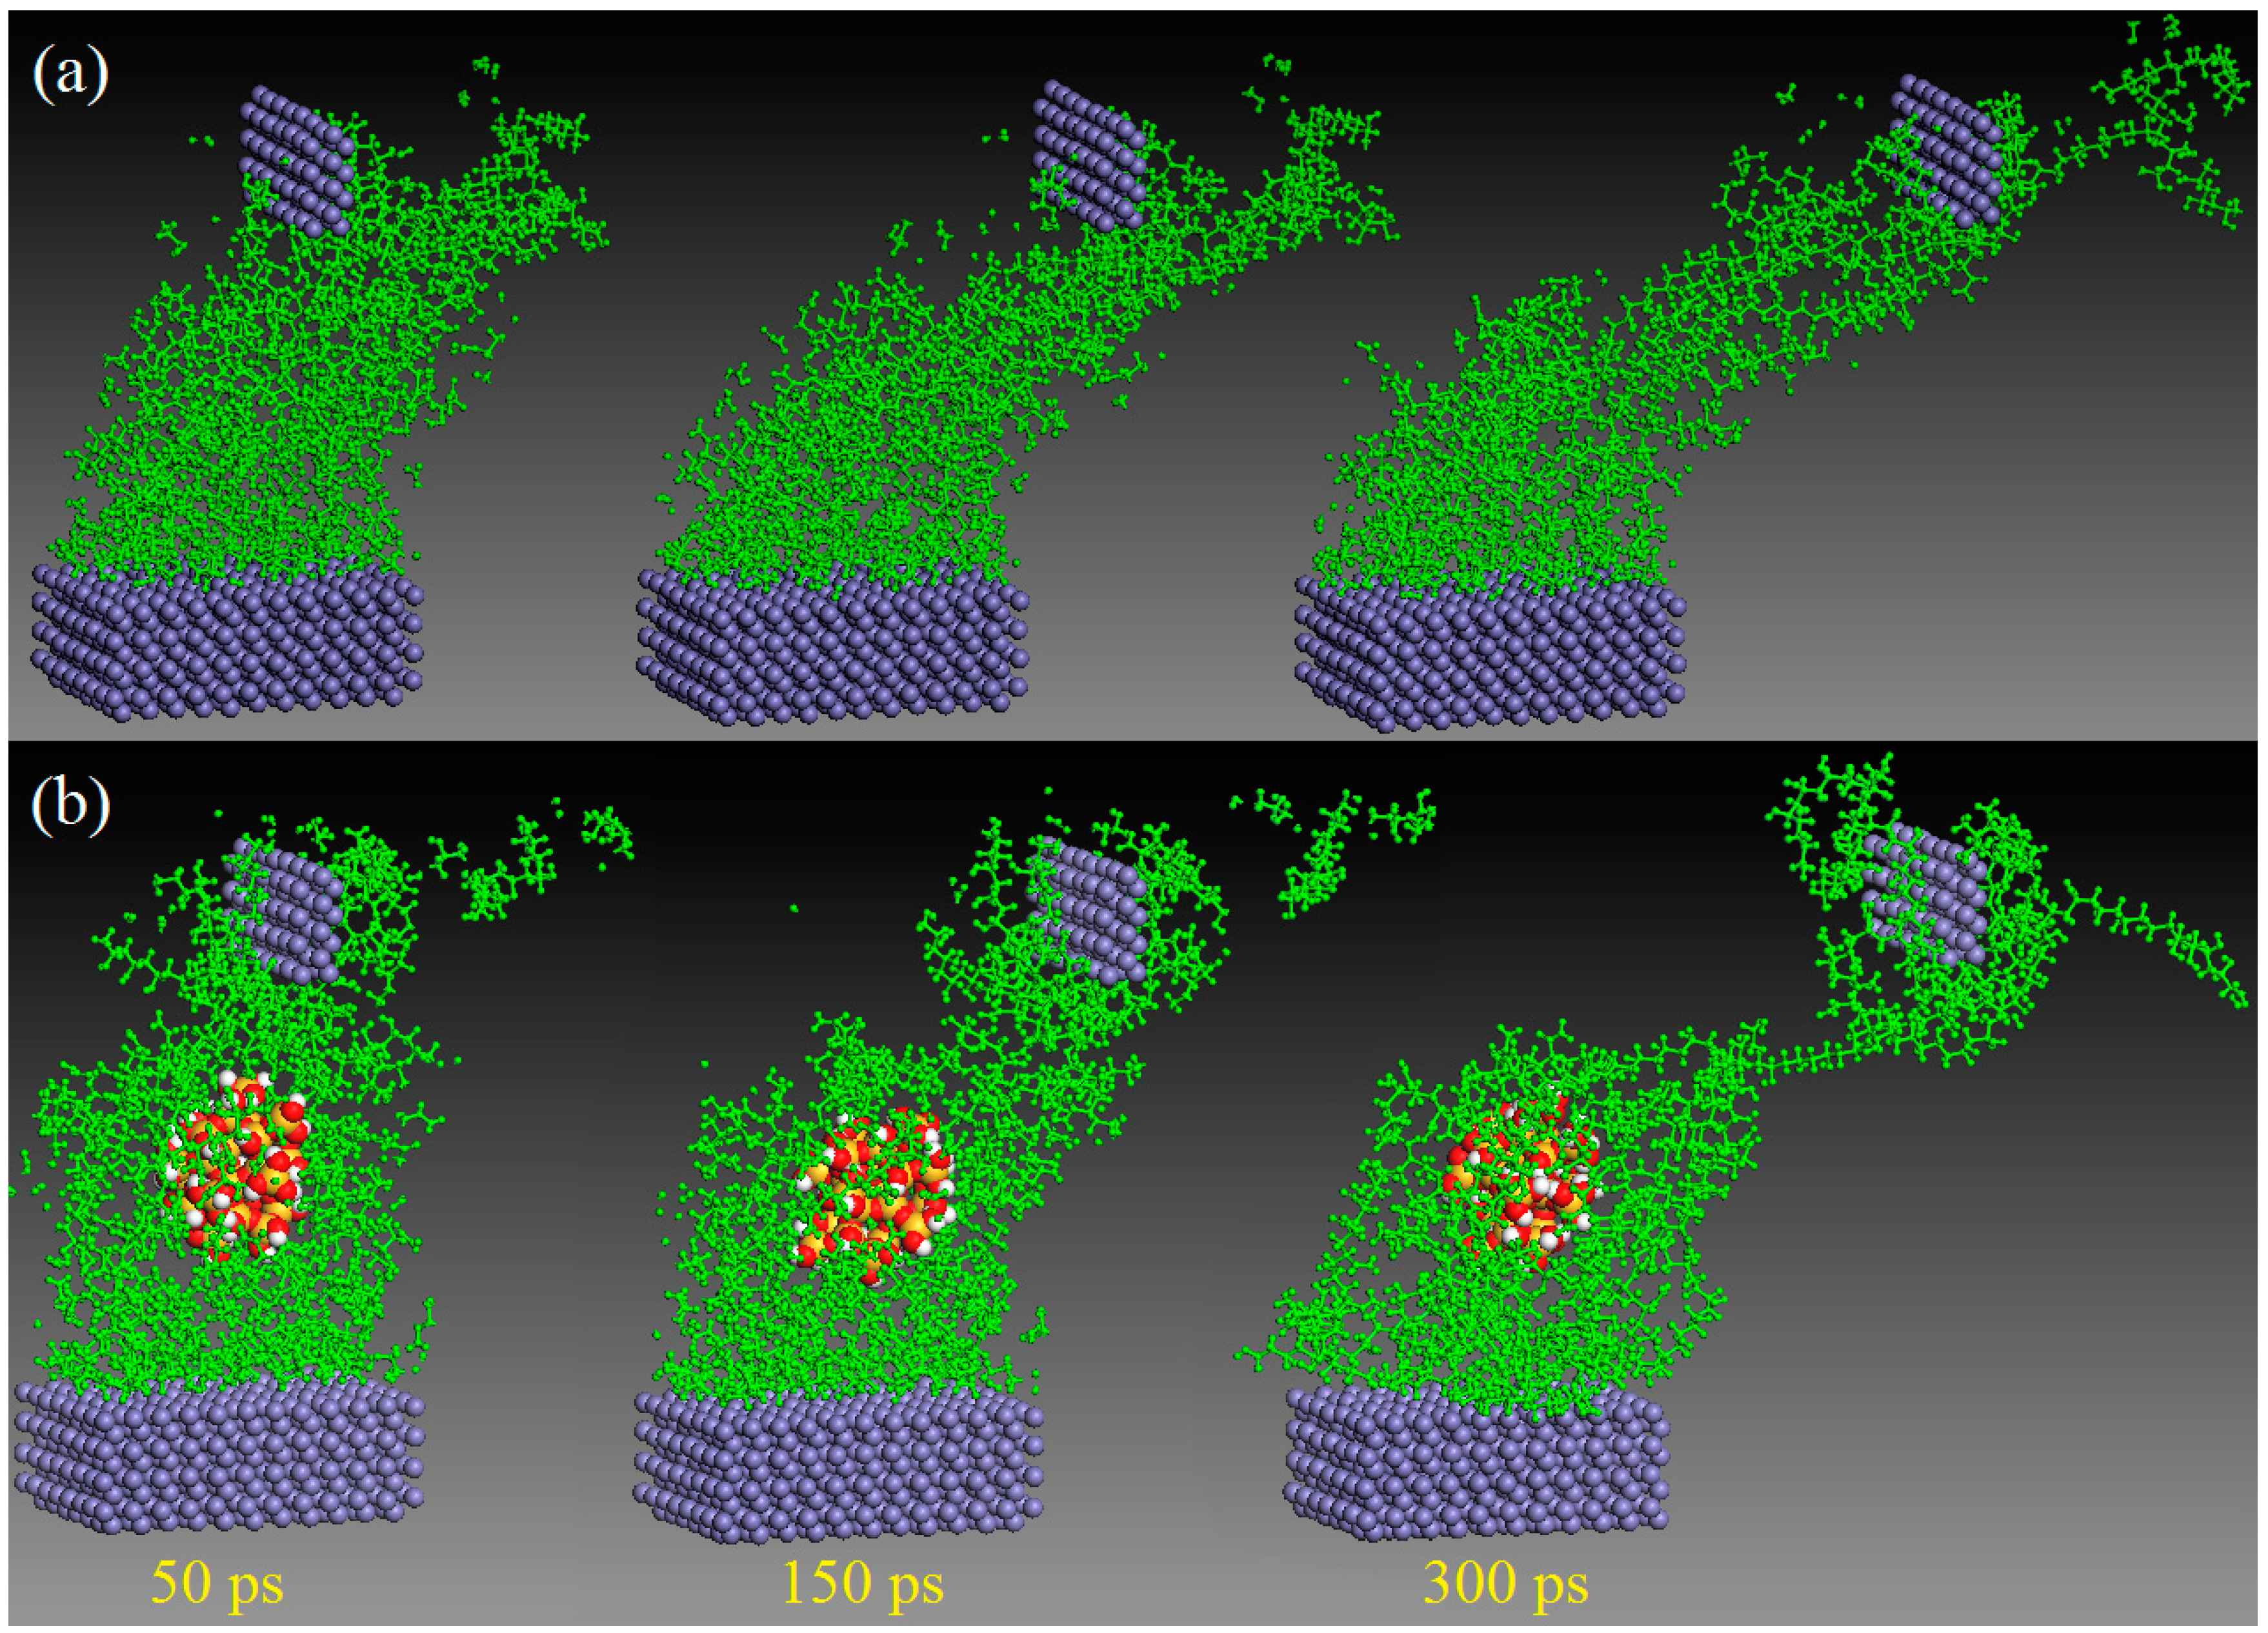
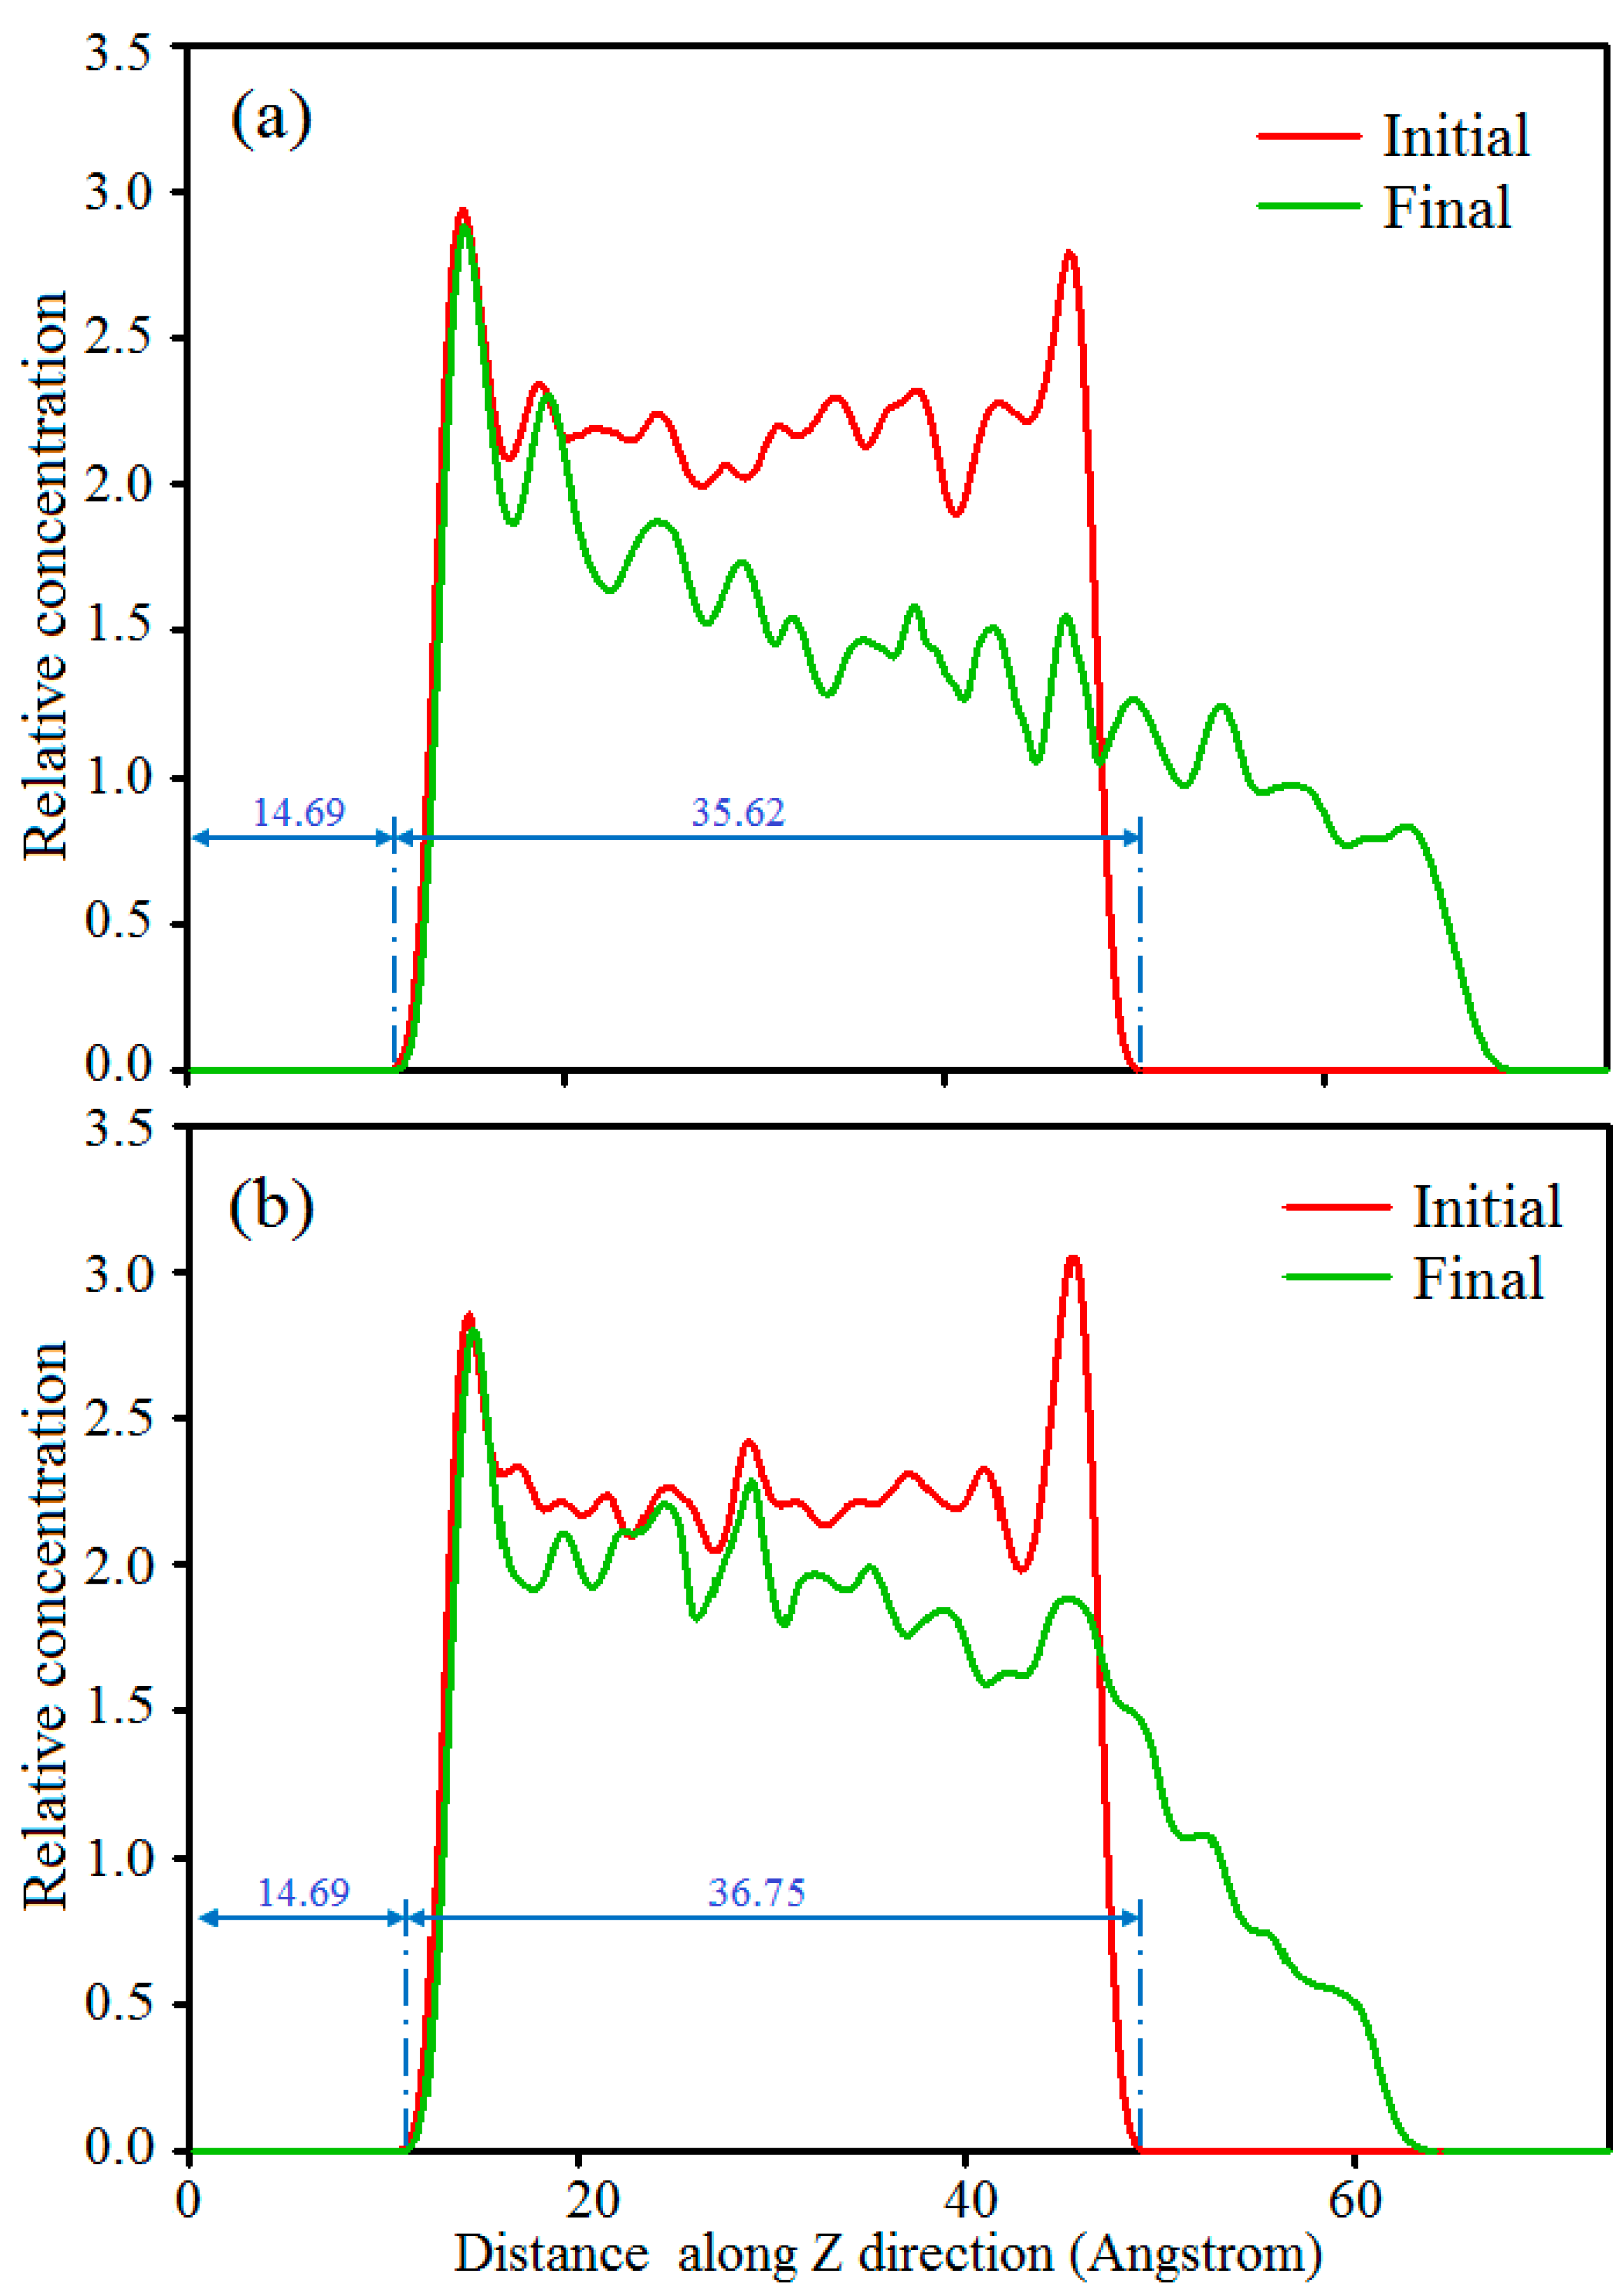
3.2. Tribological Properties
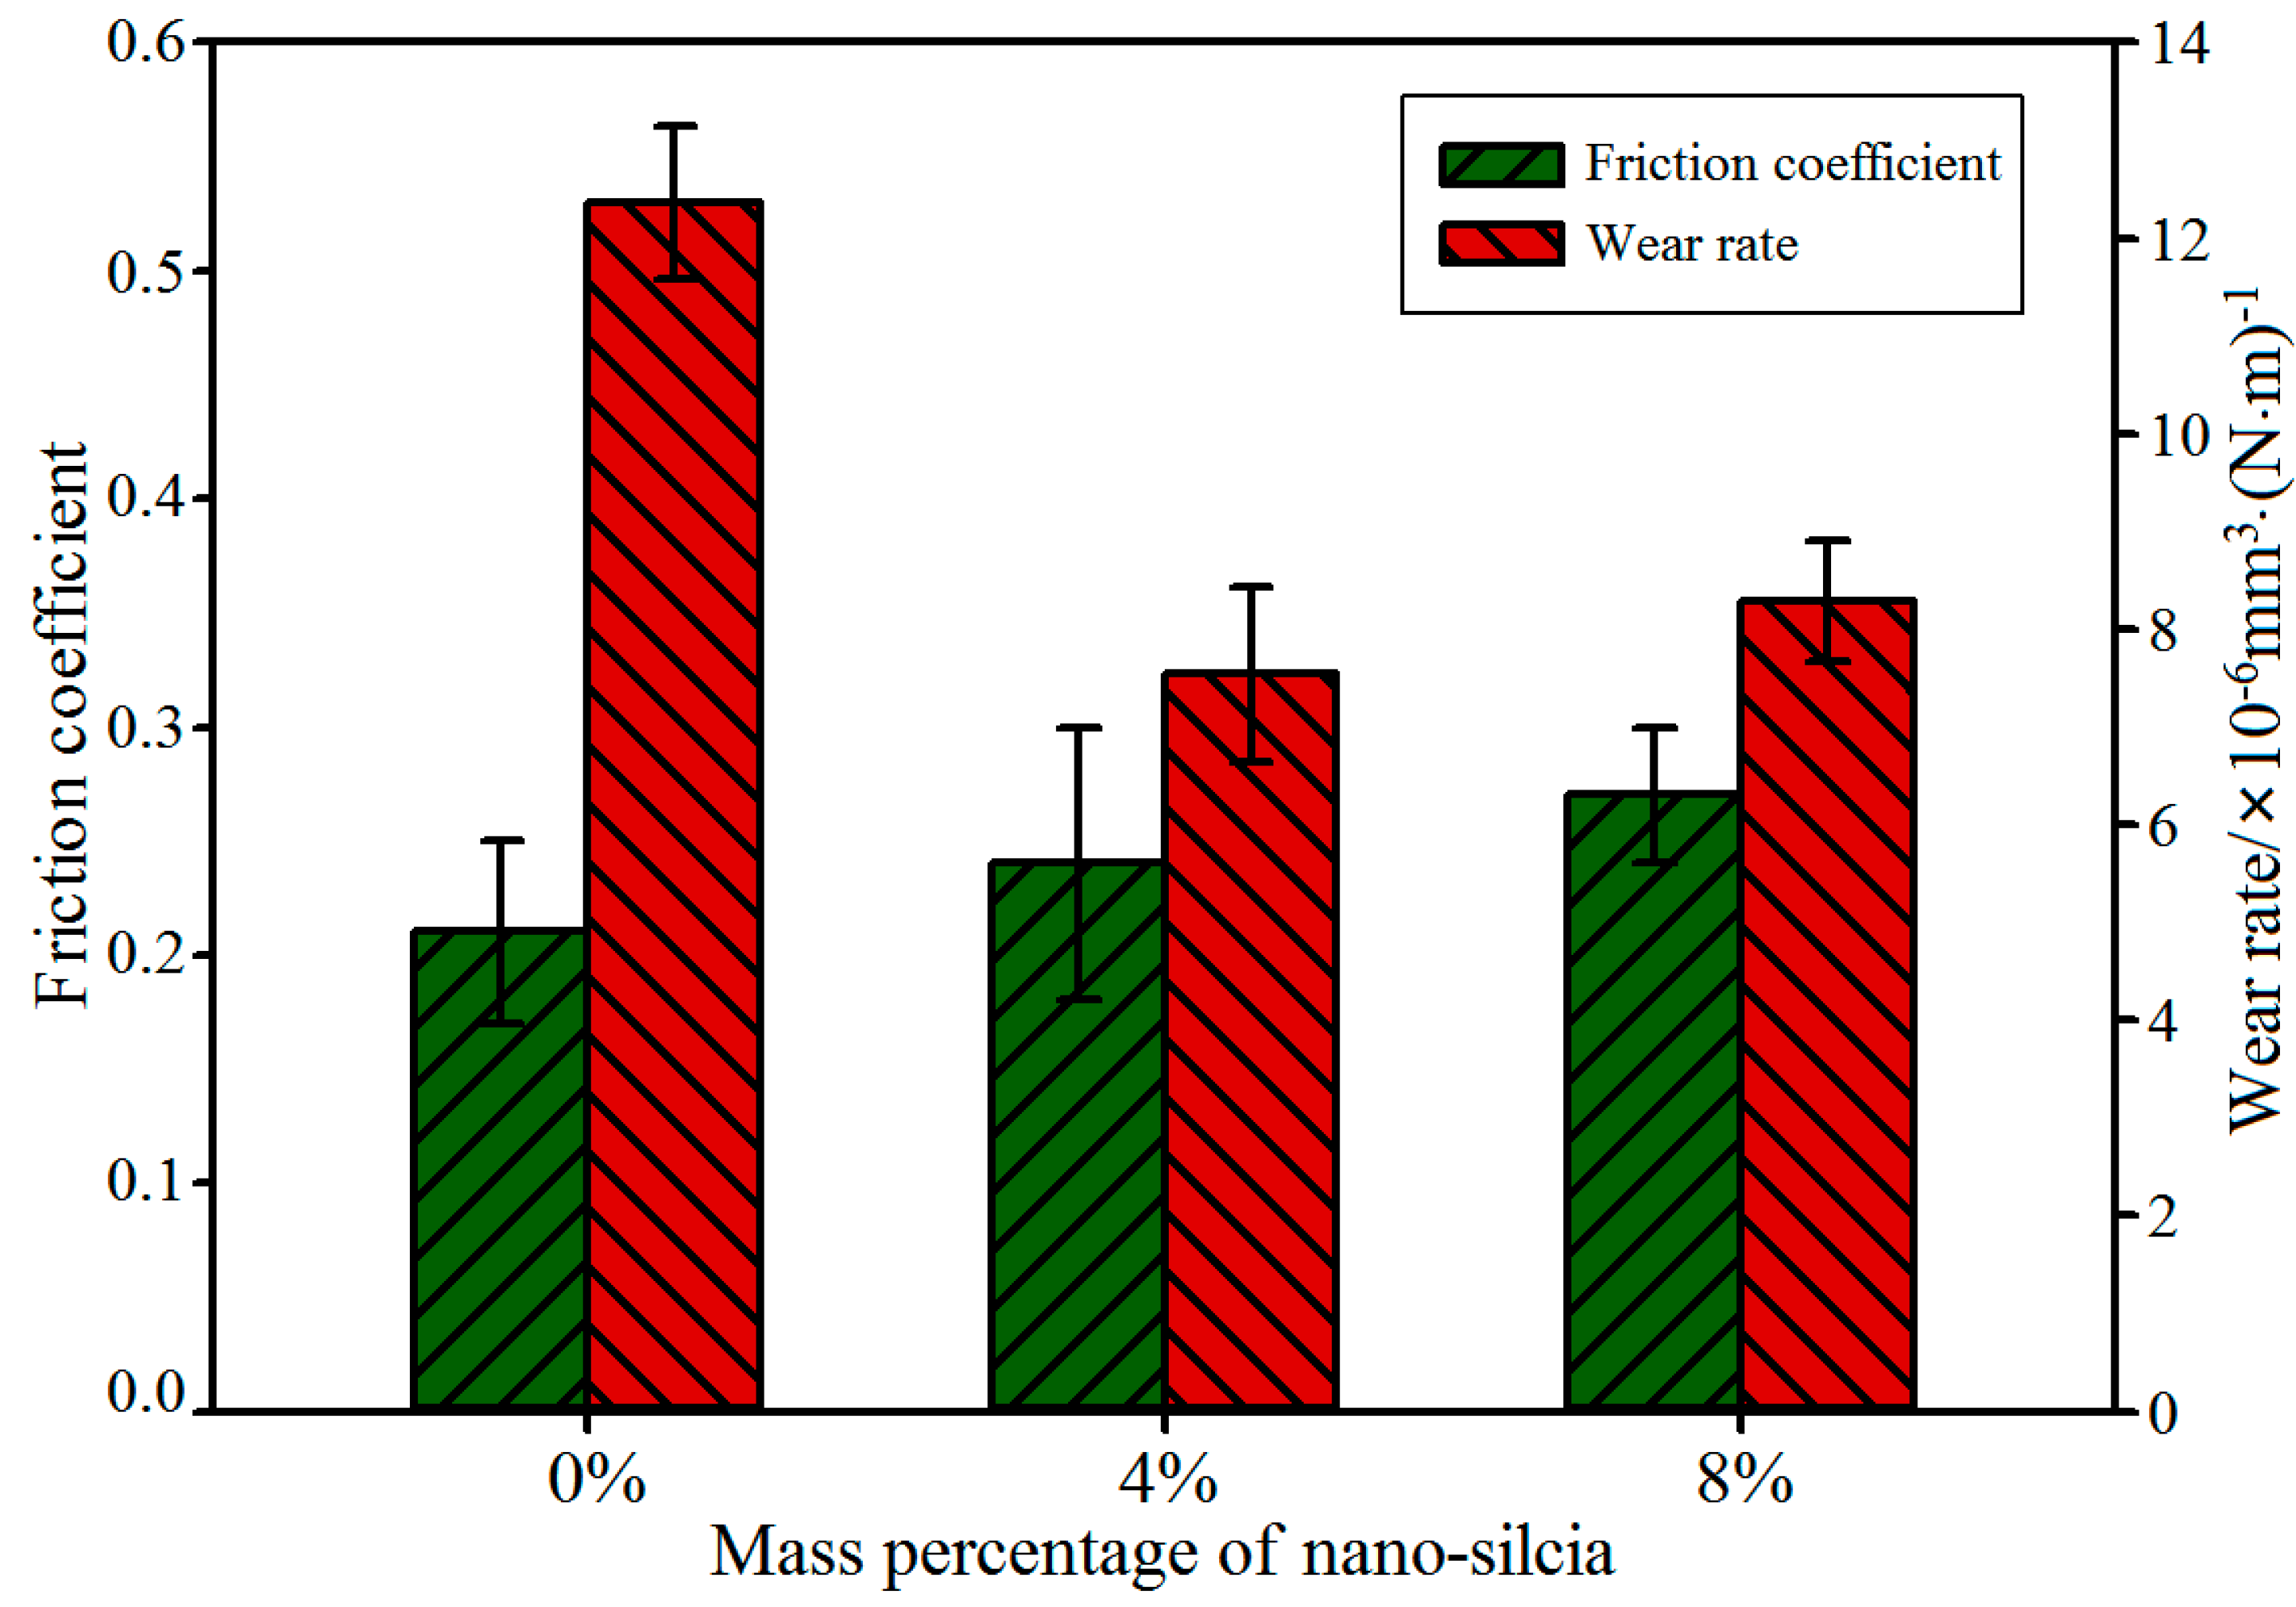
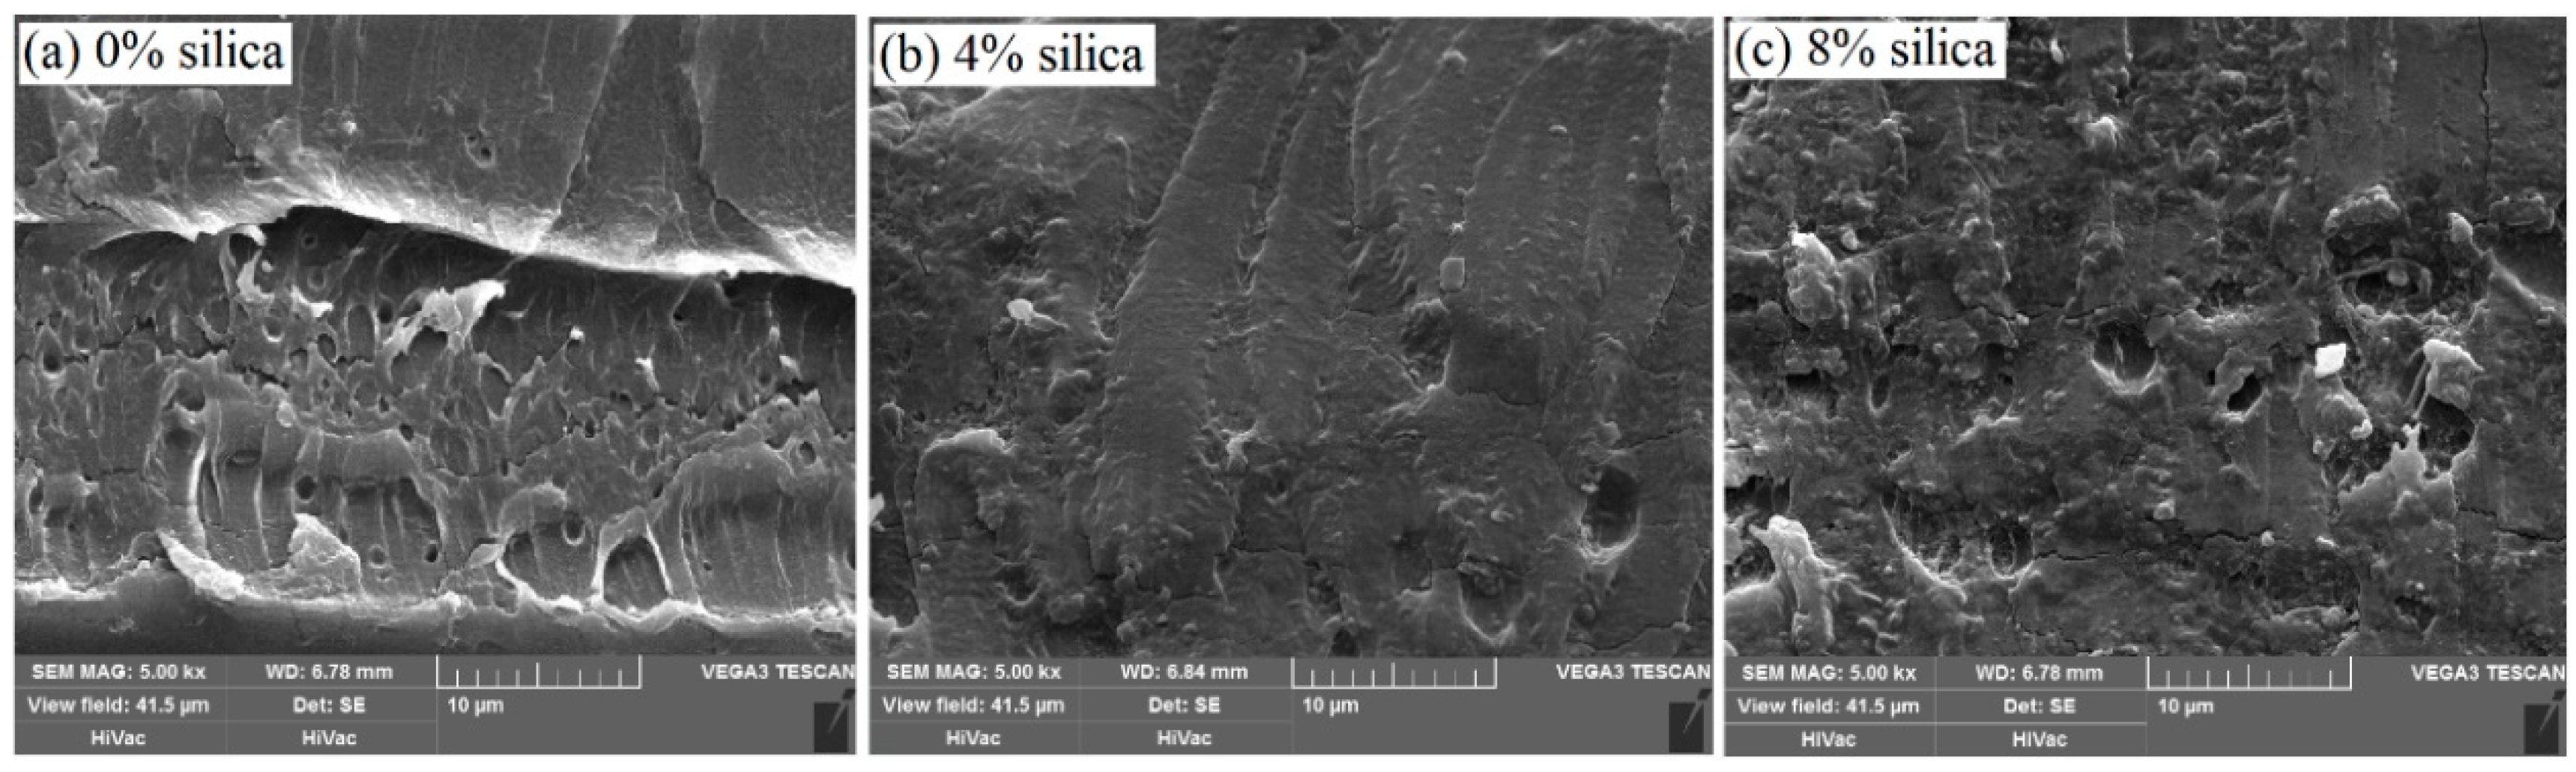
3.3. Preparation of Blend Membranes and their Abrasion Tests
3.4. Reinforce Mechanism
4. Conclusions
Author Contributions
Funding
Acknowledgments
Conflicts of Interest
References
- Hu, Z.; Zhang, Q.; Jia, Z.; Yang, Y.; Ma, J.; Qi, X. Tribological properties of polymer-based composites with nanoscaled fillers. Fillers Reinf. Adv. Nanocompos. 2015, 493–521. [Google Scholar]
- Ma, J.; Qi, X.; Zhao, Y. Polyimide/mesoporous silica nanocomposites: Characterization of mechanical and thermal properties and tribochemistry in dry sliding condition. Mater. Des. 2016, 108, 538–550. [Google Scholar] [CrossRef]
- Ismail, H.; Zaaba, N.F. The mechanical properties, water resistance and degradation behaviour of silica-filled sago starch/PVA plastic films. J. Elastom. Plast. 2012, 46, 96–109. [Google Scholar] [CrossRef]
- Malaki, M.; Hashemzadeh, Y.; Karevan, M. Effect of nano-silica on the mechanical properties of acrylic polyurethane coatings. Prog. Org. Coat. 2016, 101, 477–485. [Google Scholar] [CrossRef]
- Fallah, S.; Nematzadeh, M. Mechanical properties and durability of high-strength concrete containing macro-polymeric and polypropylene fibers with nano-silica and silica fume. Constr. Build. Mater. 2017, 132, 170–187. [Google Scholar] [CrossRef]
- Dil, E.J.; Virgilio, N.; Favis, B.D. The effect of the interfacial assembly of nano-silica in poly(lactic acid)/poly(butylene adipate-co-terephthalate) blends on morphology, rheology and mechanical properties. Eur. Polym. J. 2016, 85, 635–646. [Google Scholar]
- Xu, Z.; Li, Z.; Li, J.; Fu, Y. The effect of CF and nano-SiO2 modification on the flexural and tribological properties of POM composites. J. Thermoplast. Compos. Mater. 2014, 27, 287–296. [Google Scholar]
- Pattnaik, S.; Nethala, S.; Tripathi, A.; Saravanan, S.; Moorthi, A.; Selvamurugan, N. Chitosan scaffolds containing silicon dioxide and zirconia nano particles for bone tissue engineering. Int. J. Biol. Macromol. 2011, 49, 1167–1172. [Google Scholar] [CrossRef]
- Lin, L.Y.; Kim, D.E. Tribological properties of polymer/silica composite coatings for microsystems applications. Tribol. Int. 2011, 44, 1926–1931. [Google Scholar] [CrossRef]
- Li, Y.; Wang, S.; Arash, B.; Wang, Q. A study on tribology of nitrile-butadiene rubber composites by incorporation of carbon nanotubes: Molecular dynamics simulations. Corbon 2016, 110, 145–150. [Google Scholar] [CrossRef]
- Hu, C.; Bai, M.; Lv, J.; Kou, Z.; Li, X. Molecular dynamics simulation on the tribology properties of two hard nanoparticles (diamond and silicon dioxide) confined by two iron blocks. Tribol. Int. 2015, 90, 297–305. [Google Scholar] [CrossRef]
- Jang, C.; Lacy, T.E.; Gwaltney, S.R.; Toghiani, H.; Pittman, C.U., Jr. Interfacial shear strength of cured vinyl ester resin-graphite nanoplatelet from molecular dynamics simulations. Polymer 2013, 54, 3282–3289. [Google Scholar] [CrossRef]
- Li, Y.; Wang, S.; Wang, Q. Enhancement of tribological properties of polymer composites reinforced by functionalized graphene. Compos. Part B 2017, 120, 83–91. [Google Scholar] [CrossRef]
- Ta, T.D.; Tieu, A.K.; Zhu, H.; Kosasih, B.; Zhu, Q.; Phan, H.T. The structural, tribological, and rheological dependency of thin hexadecane film confined between iron and iron oxide surfaces under sliding conditions. Tribol. Int. 2017, 113, 26–35. [Google Scholar] [CrossRef]
- Jing, N.; Xue, Q.; Ling, C.; Shan, M.; Zhang, T.; Zhou, X.; Jiao, Z. Effect of defects on Young’s modulus of graphene sheets: A molecular dynamics simulation. RSC Adv. 2012, 2, 9124–9129. [Google Scholar] [CrossRef]
- Wei, Q.; Zhang, Y.; Wang, Y.; Yang, M. A molecular dynamic simulation method to elucidate the interaction mechanism of nano-SiO2 in polymer blends. J. Mater. Sci. 2017, 52, 12889–12901. [Google Scholar] [CrossRef]
- Wei, Q.; Wang, Y.; Che, Y.; Yang, M.; Li, X.; Zhang, Y. Molecular mechanisms in compatibility and mechanical properties of polyacrylamide/polyvinyl alcohol blends. J. Mech. Behav. Biomed. Mater. 2017, 65, 565–573. [Google Scholar] [CrossRef]
- Wei, Q.; Wang, Y.; Chai, W.; Zhang, Y.; Chen, X. Molecular Dynamics Simulation and Experimental Study of the Bonding Properties of Polymer Binders in 3D Powder Printed Hydroxyapatite Bioceramic Bone Scaffolds. Ceram. Int. 2017, 43, 13702–13709. [Google Scholar] [CrossRef]
- Materials Studio Version 5.5; Accelrys Inc.: San Diego, CA, USA, 2010.
- Sun, H. COMPASS: An ab initio force-field optimized for condensed-phase applications overview with details on alkane and benzene compounds. J. Phys. Chem. B 1998, 102, 7338–7364. [Google Scholar] [CrossRef]
- Wescott, J.T.; Qi, Y.; Subramanian, L.; Capehart, T.W. Mesoscale simulation of morphology in hydrated perfluorosulfonic acid membranes. J. Chem. Phys. 2006, 124, 134702–134716. [Google Scholar] [CrossRef]
- Liu, F.; Hu, N.; Ning, H.; Liu, Y.; Li, Y.; Wu, L. Molecular dynamics simulation on interfacial mechanical properties of polymer nanocomposites with wrinkled graphene. Comput. Mater. Sci. 2015, 108, 160–167. [Google Scholar] [CrossRef]
- Xiao, J.J.; Wang, W.R.; Chen, J.; Ji, G.F.; Zhu, W.; Xiao, H.M. Study on structure, sensitivity and mechanical properties of HMX and HMX-based PBXs with molecular dynamics simulation. Comput. Theor. Chem. 2012, 999, 21–27. [Google Scholar] [CrossRef]
- He, E.; Wang, S.; Li, Y.; Wang, Q. Enhanced tribological properties of polymer composites by incorporation of nano-SiO2 particles: A molecular dynamics simulation study. Comput. Mater. Sci. 2017, 134, 93–99. [Google Scholar] [CrossRef]
- Andersen, H.C. Molecular dynamics simulations at constant pressure and/or temperature. J. Chem. Phys. 1980, 72, 2374–2383. [Google Scholar] [CrossRef]
- Ewald, P.P. Evaluation of optical and electrostatic lattice potentials. Ann. Phys. Leipzig 1921, 64, 253–287. [Google Scholar] [CrossRef]
- Tosi, M.P. Cohesion of ionic solids in the Born model. Solid State Phys. 1964, 16, 1–120. [Google Scholar]
- Ashcroft, N.W.; Mermin, N.D. Solid State Physics; Saunders College: Philadelphia, PA, USA, 1976. [Google Scholar]
- Hill, R. First-principles elastic constants for the hcp transition metals Fe, Co, and Re at high pressure. Proc. Phys. Soc. 1952, 65, 350. [Google Scholar]
- Pugh, S.F. Relations between the elastic moduli and the plastic properties of polycrystalline pure metals. Phil. Mag. Ser. 1954, 45, 823. [Google Scholar] [CrossRef]
- Pang, M.; Zhan, Y.; Wang, H. Ab initio investigation into the structural, electronic and elastic properties of AlCu2TM (TM=Ti, Zr and Hf) ternary compounds. Curr. Appl. Phys. 2012, 12, 957–962. [Google Scholar] [CrossRef]
- Frantsevich, I.N.; Voronov, F.F.; Frantsevich, S.A.B. (Eds.) Elastic Constants and Elastic Moduli of Metals and Insulators; Naukova Dumka: Kiev, Ukraine, 1983. [Google Scholar]
- Weiner, J.H. Statistical Mechanics of Elasticity; Dover Publications: New York, NY, USA, 2002. [Google Scholar]
- Feng, W.; Cui, S.; Hu, H.; Feng, P.; Zheng, Z.; Guo, Y.; Gong, Z. First-principles study on electronic structure and elastic properties of hexagonal Zr2Sc. Phys. B 2010, 405, 4294–4298. [Google Scholar] [CrossRef]
- Sikora, P.; Łukowski, P.; Cendrowski, K.; Horszczaruk, E.; Mijowska, E. The effect of nanosilica on the mechanical properties of polymer-cement composites (PCC). Procedia Eng. 2015, 108, 139–145. [Google Scholar] [CrossRef]
- Xiang, Y.; Liu, Y.; Mi, B.; Leng, Y. Molecular Dynamics Simulations of Polyamide Membrane, Calcium Alginate Gel, and Their Interactions in Aqueous Solution. Langmuir 2014, 30, 9098–9106. [Google Scholar] [CrossRef] [PubMed]
- Zhang, X.; Wen, H.; Wu, Y. Computational Thermomechanical Properties of Silica-Epoxy Nanocomposites by Molecular Dynamic Simulation. Polymers 2017, 9, 430. [Google Scholar] [CrossRef]
- Yang, J.; Gong, X.; Wang, G. Compatibility and mechanical properties of BAMO-AMMO/DIANP composites: A molecular dynamics simulation. Comput. Mater. Sci. 2015, 102, 1–6. [Google Scholar] [CrossRef]
- Chrissafis, K.; Paraskevopoulos, K.M.; Papageorgiou, G.Z.; Bikiaris, D.N. Thermal and dynamic mechanical behavior of bionanocomposites: Fumed silica nanoparticles dispersed in poly(vinyl pyrrolidone), chitosan, and poly(vinyl alcohol). J. Appl. Polym. Sci. 2008, 110, 1739–1749. [Google Scholar] [CrossRef]
- He, M.; Chen, W.; Dong, X. Polymer Physics; Fu Dan University Press: Shanghai, China, 1990; pp. 322–343. [Google Scholar]


| System | C11 | C12 | C44 | BV | GV | BR | GR | BH | GH | E | v |
|---|---|---|---|---|---|---|---|---|---|---|---|
| PVA/PAM | 10.48 | 4.86 | 2.93 | 6.73 | 2.88 | 6.73 | 2.88 | 6.73 | 2.88 | 7.56 | 0.31 |
| PVA/PAM/silica | 15.82 | 5.38 | 3.96 | 8.86 | 4.46 | 8.86 | 4.36 | 8.86 | 4.41 | 11.35 | 0.29 |
| System | Ntotal | Nremain | Nremove | Abrasion Rate |
|---|---|---|---|---|
| PVA/PAM | 2656 | 1602 | 1054 | 39.7% |
| PVA/PAM/silica | 2800 | 2102 | 698 | 24.9% |
© 2019 by the authors. Licensee MDPI, Basel, Switzerland. This article is an open access article distributed under the terms and conditions of the Creative Commons Attribution (CC BY) license (http://creativecommons.org/licenses/by/4.0/).
Share and Cite
Wei, Q.; Wang, Y.; Rao, Y.; Jiang, A.; Zhang, K.; Lu, T.; Chen, X. Evaluating the Effects of Nanosilica on Mechanical and Tribological Properties of Polyvinyl Alcohol/Polyacrylamide Polymer Composites for Artificial Cartilage from an Atomic Level. Polymers 2019, 11, 76. https://doi.org/10.3390/polym11010076
Wei Q, Wang Y, Rao Y, Jiang A, Zhang K, Lu T, Chen X. Evaluating the Effects of Nanosilica on Mechanical and Tribological Properties of Polyvinyl Alcohol/Polyacrylamide Polymer Composites for Artificial Cartilage from an Atomic Level. Polymers. 2019; 11(1):76. https://doi.org/10.3390/polym11010076
Chicago/Turabian StyleWei, Qinghua, Yanen Wang, Yiwen Rao, Anguo Jiang, Kun Zhang, Tingli Lu, and Xiongbiao Chen. 2019. "Evaluating the Effects of Nanosilica on Mechanical and Tribological Properties of Polyvinyl Alcohol/Polyacrylamide Polymer Composites for Artificial Cartilage from an Atomic Level" Polymers 11, no. 1: 76. https://doi.org/10.3390/polym11010076