
Transport of Organic Contaminants in Composite Vertical Cut-Off Wall with Defective HDPE Geomembrane

1
School of Infrastructure Engineering, Nanchang University, Nanchang 330031, China
2
Key Laboratory of Ministry of Education for Geomechanics and Embankment Engineering, Hohai University, Nanjing 210024, China
*
Author to whom correspondence should be addressed.
Polymers 2023, 15(14), 3031; https://doi.org/10.3390/polym15143031
Submission received: 7 June 2023
/
Revised: 6 July 2023
/
Accepted: 11 July 2023
/
Published: 13 July 2023
(This article belongs to the Special Issue Polymer Composites in Municipal Solid Waste Landfills)
Abstract
:Soil-bentonite vertical cut-off wall is an emergency technique used for contaminant control in geo-environmental engineering, high-density polyethylene (HDPE) geomembrane (GM) with an extremely low-permeability coefficient is expected to enhance the contaminant barrier effect of the vertical cut-off wall. To evaluate the barrier performance of the composite barrier composed of GM and soil-bentonite mixture towards organic contaminant, while also quantitively revealing the impact of GM defects and placement, a one-dimensional transport model for organic contaminants in composite barrier is solved under semi-infinite boundary conditions. The proposed transport model is validated by numerical simulations using COMSOL Multiphysics 5.4, and the effects of GM defect rate, placement within the composite isolation wall, and contact level with soil-bentonite on contaminant transport behavior are further studied. The results show that as the average frequency of GM defects increases from 2.5 to 50 holes per hectare, the breakthrough time of organic contaminants through composite barrier decreases by almost 70%. Poor contact level between GM and soil-bentonite mixture may reduce the breakthrough time of the composite cut-off wall by 65%. Although the selection of GM placement has limited impact on the transient flux of contaminants, it does affect the total flux of contaminants over a certain period of time. The effects of permeability coefficient, effective diffusion coefficient, distribution coefficient, and hydraulic head of the composite cut-off wall can be considered by the proposed analytical solution, which would provide guidance and reference for the design and service performance evaluation of the composite cut-off wall.
1. Introduction
The employment of a liner barrier constitutes a crucial engineering intervention aimed at curtailing the spread of organic contaminants to the surrounding ecosystem, particularly in regions including but not limited to landfill sites, mining smelter ponds, and industrial parks [1]. Overall, there are two types of liner barrier systems: horizontal impermeable liners widely used in landfills, e.g., composite liners consisting of high-density polyethylene geomembrane (GM), geosynthetic clay liner (GCL), clay, and low-permeability vertical impermeable barriers, e.g., grouting curtains or composite barriers fabricated of soil, bentonite, and cement [2]. Vertical impermeable cut-off wall is an emergency measure that can effectively slow down the horizontal transport of contaminants, and the permeability coefficient, diffusion coefficient, and adsorption characteristics of contaminants in liner materials will affect the transport process [3]. High-density polyethylene (HDPE) GM has an extremely low-permeability coefficient, and its application in vertical impermeable barriers is expected to further enhance the contaminant barrier effect of the liner [4].
The investigation of contaminant transport and the barrier effects of liners is a topic of great importance to engineers and researchers. The diffusion coefficient of organic contaminants in liner materials plays a critical role in determining breakthrough time, and the utilization of low-permeability GM + GCL composite liner can be challenging due to its inherent difficulty in taking full advantage of its low-permeability coefficient [5]. Wu et al. (2016), Pu et al. (2017), and Xie et al. (2013, 2015) [6,7,8,9] derived the concentration variation law of organic contaminants in three-layer composite liners (i.e., GM + GCL + Soil Liner) and the corresponding solutions were obtained based on assumptions such as zero flux and semi-infinite boundaries. According to these theoretical solutions or numerical calculations, sensitivity analysis of various parameters for controlling contaminant transport can be carried out successfully [10]. These research studies on vertical transport behavior of contaminates in horizontal impermeable liners can provide references for calculating contaminant transport in the vertical impermeable cut-off wall [11]. Neville et al. (2006) [12] established a steady-state transport model of contaminants in vertical impermeable cut-off wall and compared it with numerical simulation results. Li et al. (2017) [13] provided a one-dimensional transient analytical solution for contaminant transport in a single-layer vertical impermeable cut-off wall and provided a design chart for nondimensionalized effluent contaminant flux by analyzing the study. Acar et al. (1990), Peng et al. (2020), and Xie et al. (2020) developed transient diffusion analytical models. Studies have shown that the selection of boundary conditions has a significant impact on transport calculations, and reasonable selection of boundary conditions is a prerequisite for transport calculations [14,15,16].
The defect of GM cannot be ignored, and the impact of leakage on contaminant transport should be clarified. Lee et al. (2000) [17] found through experiments that the permeability coefficient of GM in composite liner can reach when the contact between the GM and the surrounding medium is imperfect. Barroso et al. (2006) [18] studied the contact problem of vertical impermeable cut-off wall and surrounding media in three-scale tests and found that convection in impermeable barriers with GM cannot be ignored in contaminant transport. Philip et al. (2001) [19] found that under low hydraulic heads as well as convection is one of the main factors causing contaminant transport through vertical impermeable cut-off wall. Zhang et al. (2010) [20] considered convection, diffusion, and adsorption effects and studied the influence of the thickness, permeability coefficient, and design depth of vertical impermeable curtains on contaminant transport. They found that convection is the dominant factor for contaminant transport and dispersion under high hydraulic heads. From existing research, it can be inferred that the combined use of thin GM and soil-bentonite vertical impermeable cut-off wall can enhance the contaminant barrier effect of the liner.
In this study, considering convection, diffusion, and adsorption effects, a one-dimensional transport model of organic contaminants in a composite vertical impermeable cut-off wall with defective GM and soil-bentonite barrier was established. The mathematical physical equation method was used to obtain the analytical solution of the model, and then the calculation results of the analytical solution were compared with the calculation results of the numerical simulation method to verify the accuracy of the model. Then, further analysis was conducted on the influence of parameters such as GM defects, location, and adsorption capacity on contaminant transport in the vertical impermeable cut-off wall.
2. Calculation Model
2.1. Geometric Model
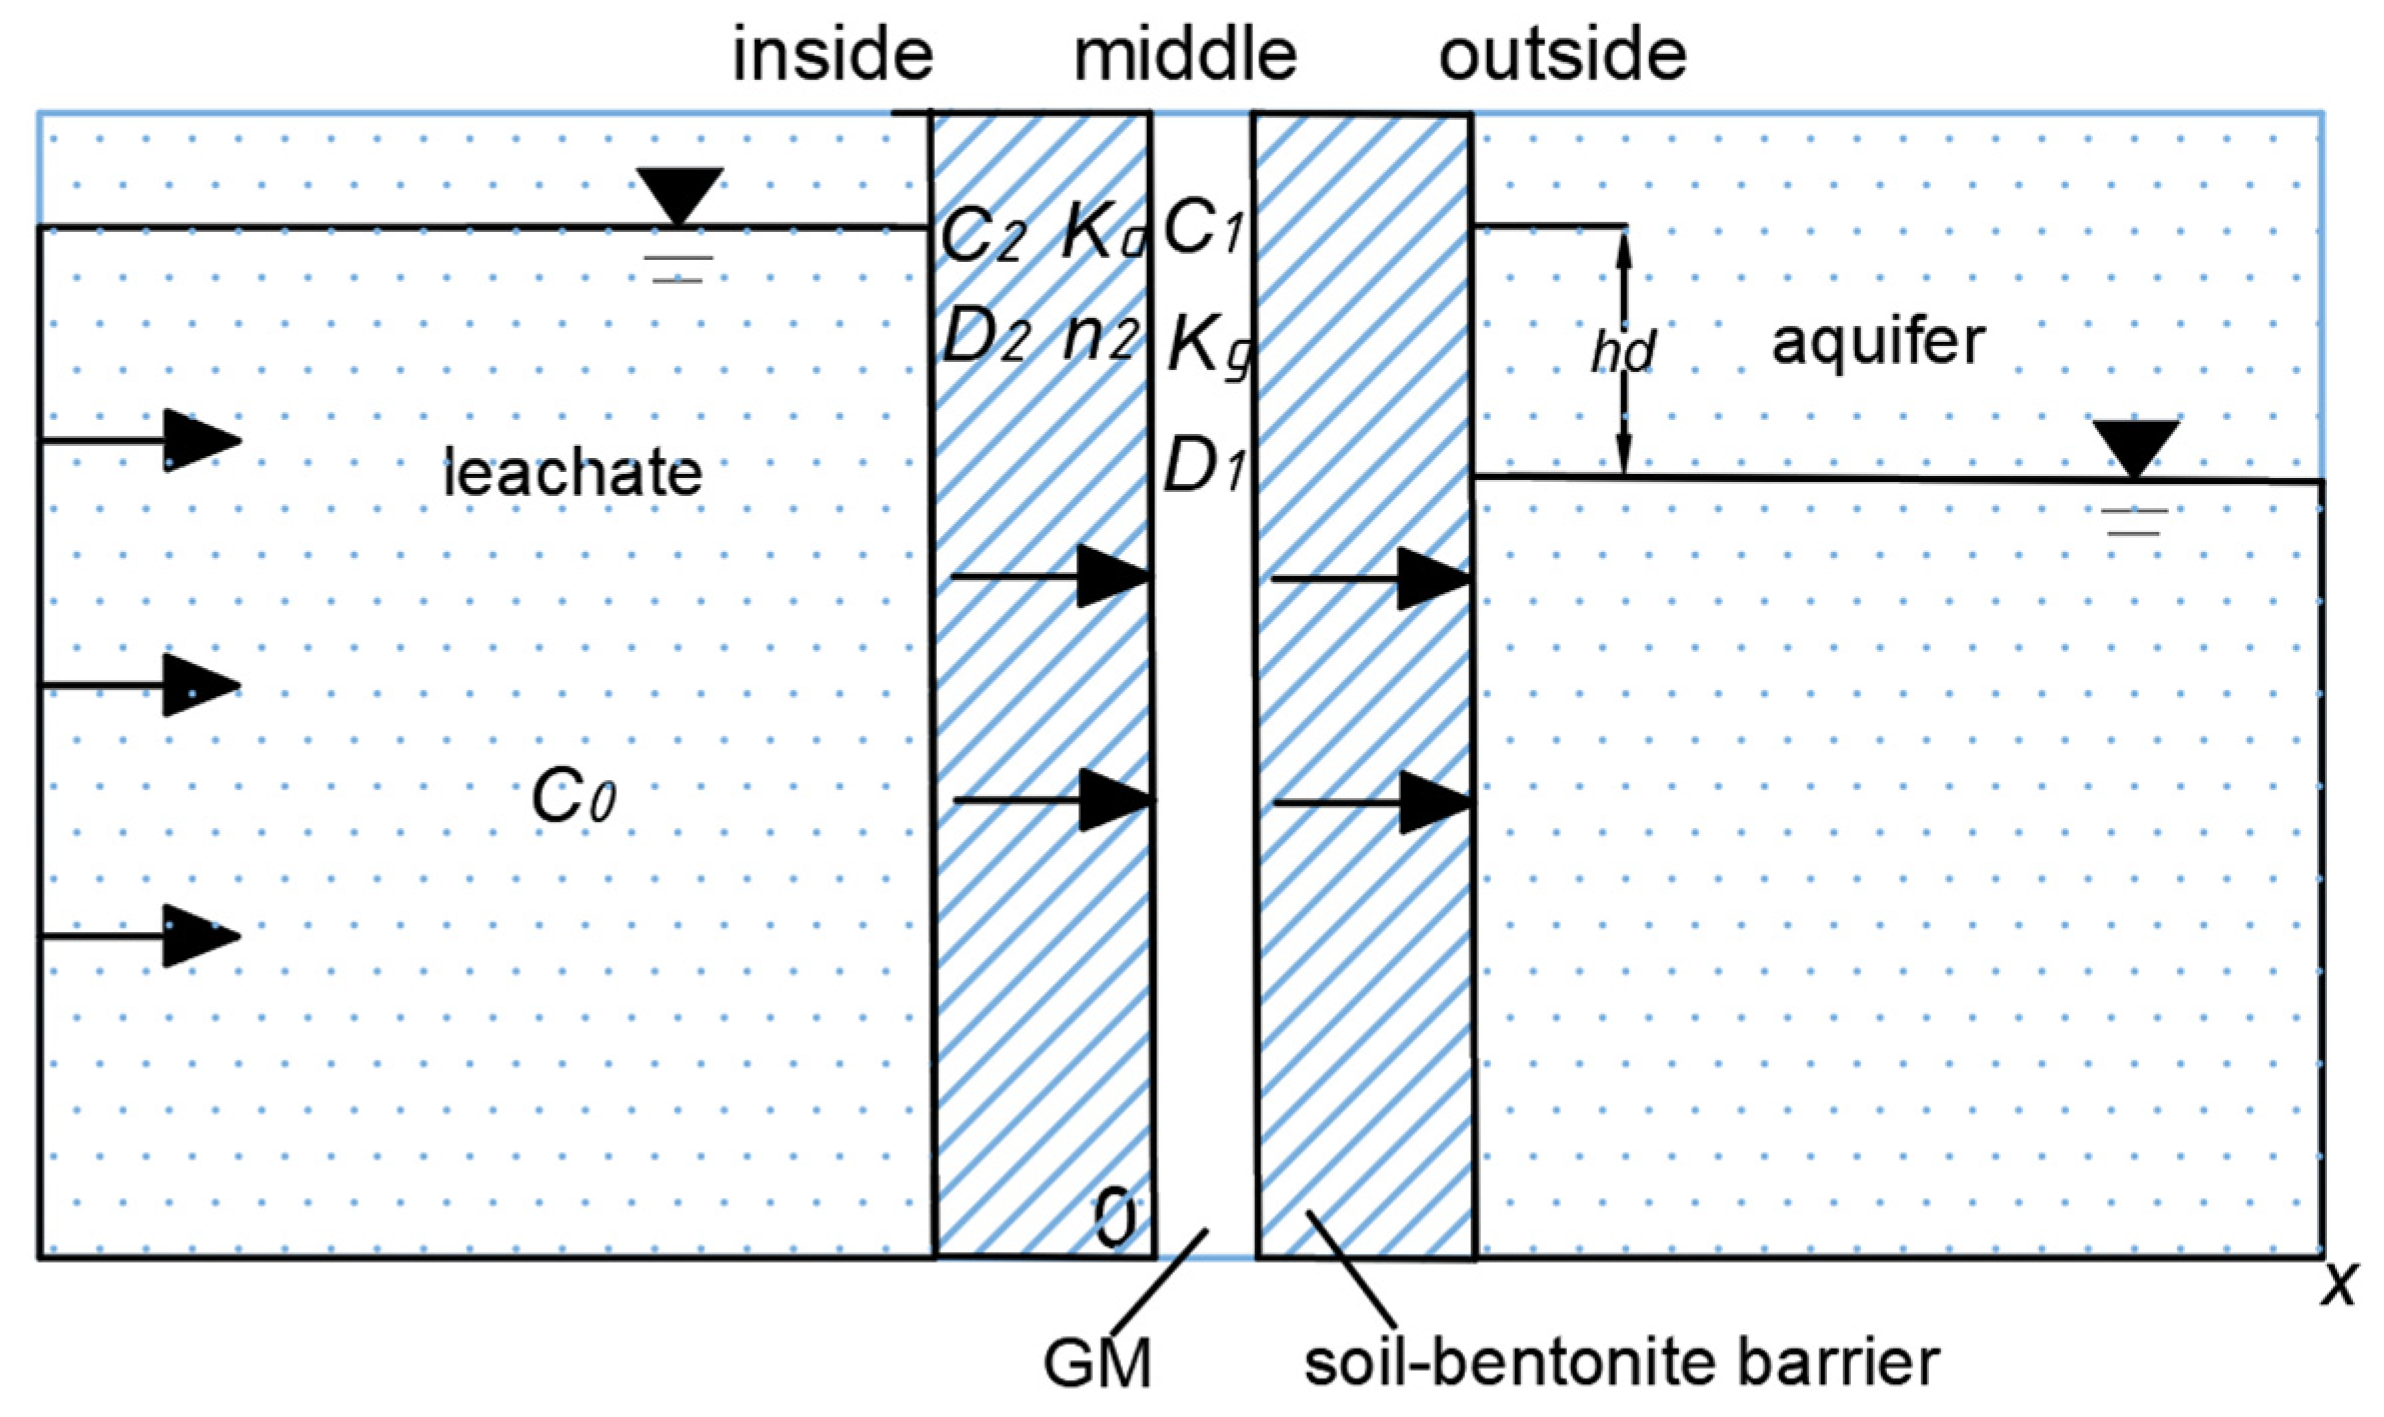
The schematical diagram of the organic contaminant transport in composite vertical cut-off wall with defective GM is shown in Figure 1. As shown in Figure 1, the vertical composite impermeable cut-off wall comprises a soil-bentonite barrier and a geomembrane. In consideration of the convective, diffusive, and adsorptive effects of contaminants by the impermeable barrier, both convection and diffusion phenomena transpire in the two layers, and adsorption of the contaminant occurs in the soil-bentonite barrier.
2.2. Basic Assumptions
To obtain an analytical solution for the one-dimensional migration of organic contaminants in the vertical contaminant barrier, the model adopts the following assumptions based on previous theoretical foundations and related experimental studies: (1) the contaminant in the filtration liquid is a single organic contaminant and undergoes one-dimensional migration in the horizontal direction; (2) the vertical impermeable cut-off wall remains undeformed with a constant pore volume, and the geomembrane contains holes; (3) the contaminant migration considers convection, diffusion, and adsorption effects, and contaminant concentration in the leachate is assumed to be constant at C0; (4) molecular diffusion follows Fick’s second law, and the contaminant adsorption is an isothermal linear process that has reached equilibrium; (5) the barrier and aquifer are homogeneous and isotropic, and under the head of the filtration liquid, the seepage reaches a steady state.
2.3. Governing Equations and Auxiliary Conditions
Considering the convection and diffusion effects of contaminants, the flux of contaminants along the direction can be expressed as:
where f is the contaminant flux, n is the total porosity of soil, v is the seepage velocity, C is the contaminant concentration, and D is the molecular diffusion coefficient.
In the geomembrane, contaminants mainly undergo convection and diffusion. Considering its relatively thin thickness, here it is assumed to be in a steady-state transport. The steady-state transport governing equation for the GM is:
where C1 is the contaminant concentration at any position x within the geomembrane, D1 is the effective diffusion coefficient of the GM, and v1 is the average linear velocity of the contaminant in the geomembrane.
The soil-bentonite barrier has a low permeability, which can prevent the penetration of contaminants and adsorb contaminants within a limited thickness. According to previous assumptions and the law of conservation of mass, the transient one-dimensional transport governing equation of contaminants in the soil-bentonite barrier can be expressed as follows.
where Rd is the retardation factor of the soil-bentonite barrier [21], C2 is the contaminant concentration at any position x in the soil-bentonite barrier at any time , D2 is the effective diffusion coefficient of the soil-bentonite barrier, and v2 is the average linear velocity of the contaminant in the soil-bentonite barrier.
where ρd is the dry density of the soil-bentonite barrier; n2 is the porosity of the soil-bentonite barrier; and Kd is the distribution coefficient of soil-bentonite barrier.
Assuming that the background concentration of contaminants in the vertical cut-off wall is zero and the redistribution process of contaminants at the interface between the infiltration liquid and the GM is instantaneous, the boundary at the interface between leachate and GM can be expressed as follows:
The continuity conditions between the GM and the soil-bentonite barrier are:
where Kg is the concentration distribution coefficient between the GM and the adjacent medium, and K’g is equal to Kd [22].
When considering convection in contaminant transport, boundary conditions have little effect on the transport results [23]. Here, we assume that the outer boundary of the soil-bentonite barrier is a semi-infinite boundary:
3. Model Solving and Verification
3.1. Analytical Solution
The general solution of the governing Equation (2) is:
where k1 and k2 are undetermined parameters, here we set r1= v1/D1 and r2= v2/D2. By substituting the Equation (5) and the Equation (7) into Equation (10):
Substituting Equations (10)–(12) into the Equation (8):
For the governing Equation (3), we use Laplace transform method to solve it:
where U(x, p) is the Laplace transform of C2(x, t) with respect to t and p is the transform parameter.
Taking Laplace transform on both sides of the governing Equation (3):
whose general solution is:
where k3 and k4 are constants, and expressions of λ1 and λ2 are as follows:
Laplace transform of the Equations (9) and (13):
By substituting Equations (20) and (21) into Equation (17):
Substituting the obtained parameters into Equation (17):
Applying the inverse Laplace transform principle and related properties to Equation (24), we can obtain:
Substituting Equation (25) into Equation (1) yields the expression of contaminant flux:
where all the undetermined coefficients and parameters have been determined. This is the process of solving the one-dimensional transport governing equation of organic contaminants.
3.2. Comparison with Numerical Method
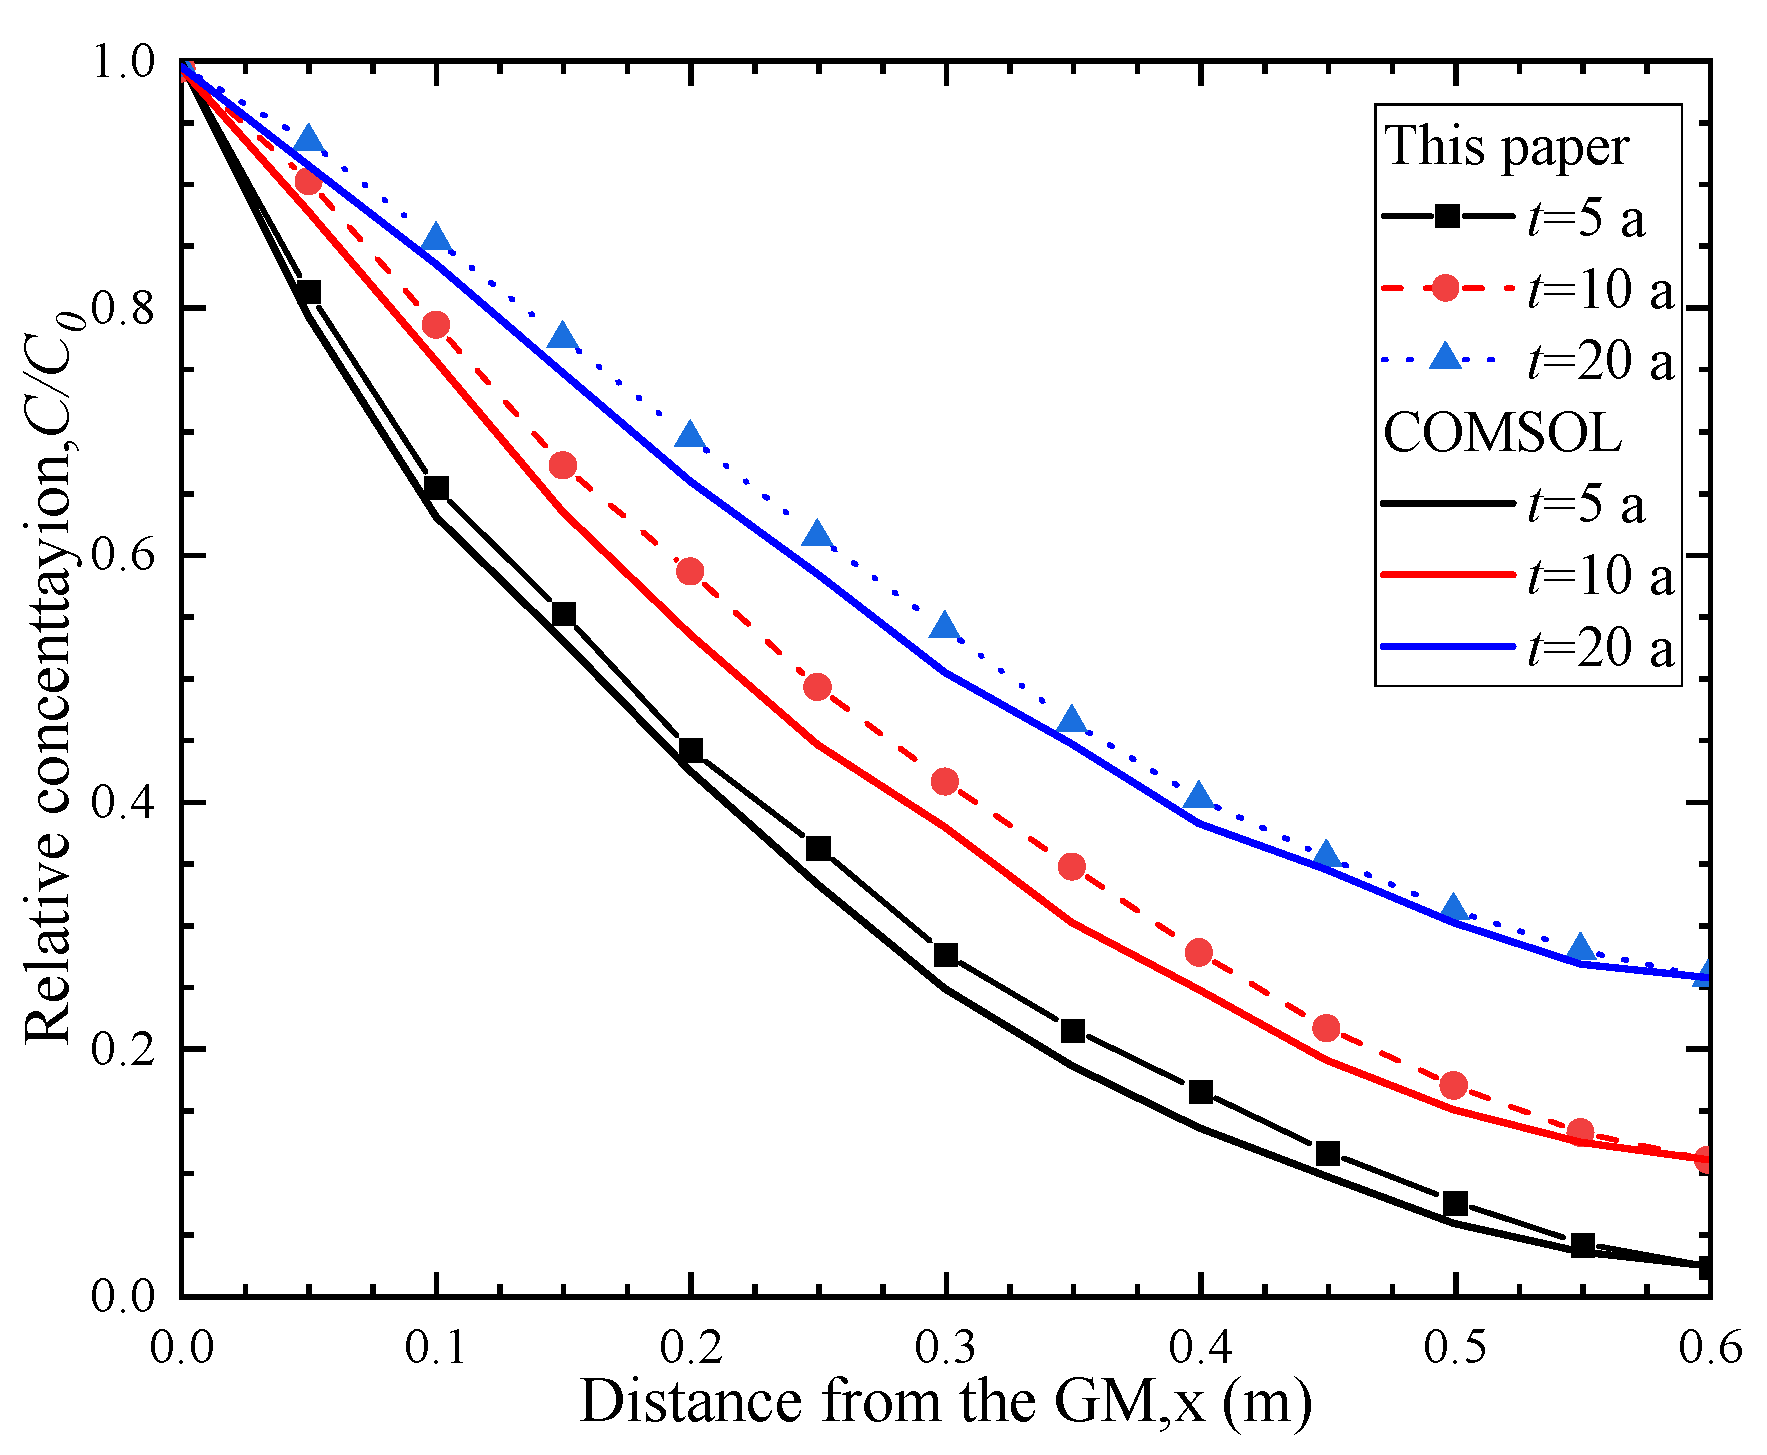
The application of numerical methods in engineering is quite common. In order to further verify the accuracy of the analytical model, this paper uses the numerical simulation software COMSOL for simulation research, and the related calculation parameters are listed in Table 1. The obtained calculation results are compared and verified with the analytical solution in this paper.
Figure 2 shows the comparison between the analytical model in this paper and the numerical results. It can be seen from the Figure 2 that when t = 5 a, 10 a and 20 a, the calculation results of the analytical model in this paper are in good agreement with the concentration distribution curve obtained by the numerical simulation software. This further validates the correctness of the analytical model proposed in this paper.
4. Analysis of Parameter
Based on the one-dimensional transport model established in this article, the impacts of convection, diffusion, and adsorption on the transport of organic contaminants in the composite cut-off wall were systematically studied. The effects of model parameters on the transport of organic contaminants in this vertical cut-off wall were comprehensively analyzed. Benzene, which has a strong migration ability, was selected as the single organic contaminant in landfill leachate [24]. Assuming that the hydraulic head difference hd on both sides of the vertical barrier is 0.3m and the initial concentration of benzene C0 is 1.63 mg/L, the breakthrough criterion was set to be 0.1, which means that the barrier was considered to be breached when the ratio of the outside concentration of the vertical cut-off wall to the initial concentration reached 0.1.
Considering the situation where GM has holes, the simplified formula for calculating the volume leakage rate of the vertical barrier is provided by the following equation [25].
where hd is the hydraulic head difference, Lw is the connected fold lengths, l is the thickness of adjacent media, k is the permeability coefficient of adjacent media, bw is the half-width of the folds, θ is the transmissivity between GM and adjacent media. The expressions for excellent contact, good contact, and poor contact conditions are provided by Equations (28) to (30), respectively [26].
Assuming that the hole frequency ma on the GM is expressed per hectare, the Darcy flux through the barrier is provided by the following equation [27].
where A is the cross-sectional area of the area under investigation.
According to the law of mass conservation, the relationship between the seepage velocity in the GM and the soil-bentonite barrier is provided by the following equation:
In this study, the fold length Lw = 500 m. The thickness l and permeability coefficient k of the soil-bentonite barrier were used. The half-width of the folds is bw = 0.1 m, and the transmissivity is θ = 3.2 × 10⁻⁹ m2 [28]. Other parameters were referenced from the literature [29,30], and the corresponding calculation parameters are shown in Table 1.
4.1. Influence of Holes
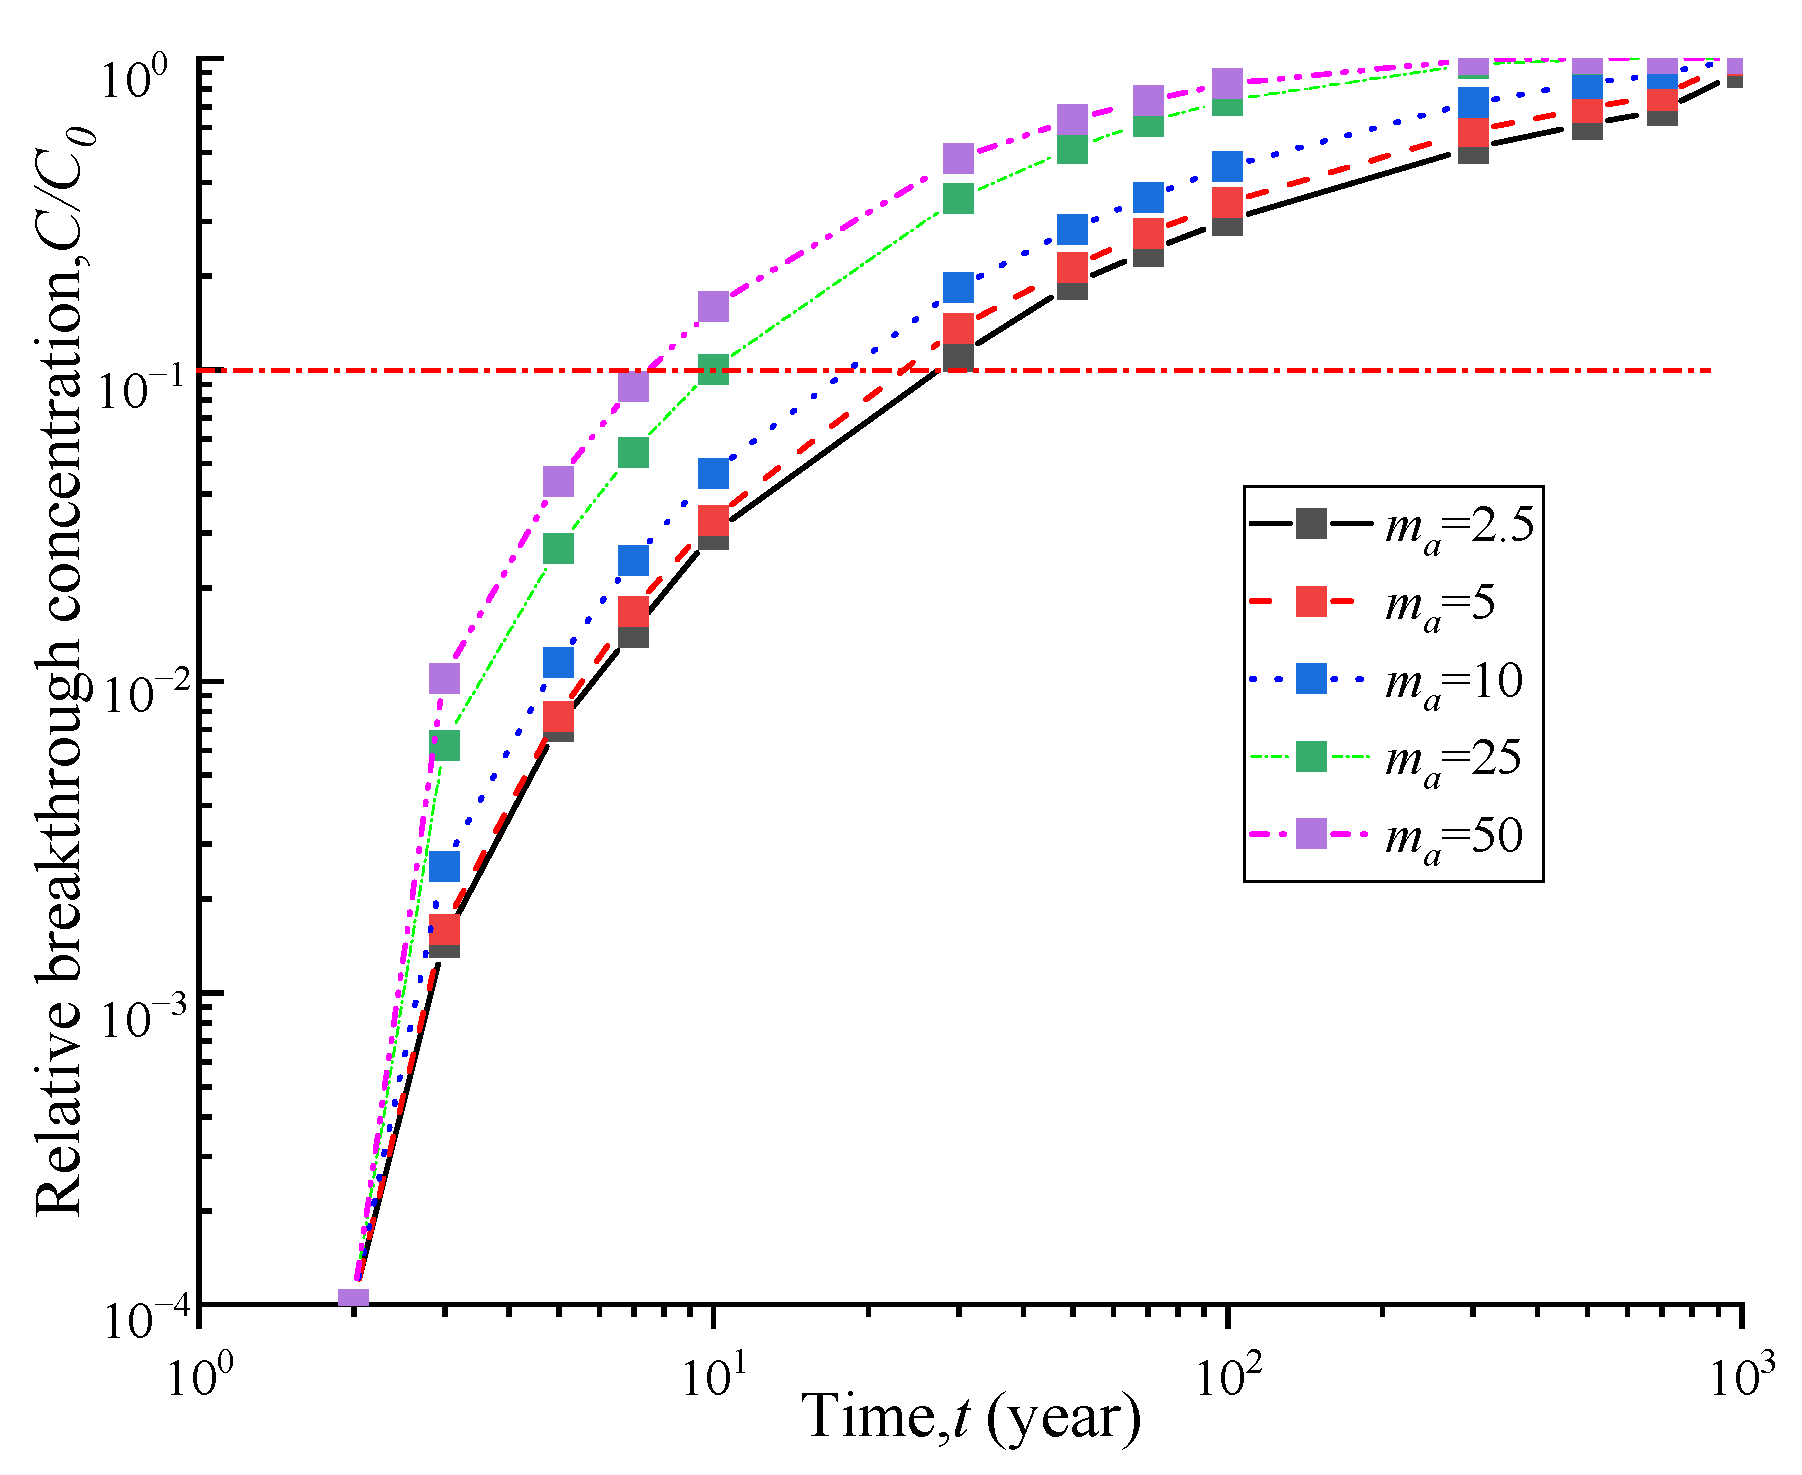
The phenomenon of geosynthetic liner with holes is quite common and can be caused by various factors. The shape and size of the holes are also diverse. The hole frequencies on GM were 4 and 22 holes/ha respectively under good and poor construction quality with an average hole area of approximately 1 cm2 [31]. Figure 3 and Figure 4 demonstrate the breakthrough curve and contaminant flux curve of vertical cut-off wall under different hole frequencies. The breakthrough time of the vertical cut-off wall was obtained by considering hole numbers of 2.5, 5, 10, 25, and 50 holes per hectare of GM, which were 26.9 a, 22.5 a, 17.2 a, 10.1 a, and 7.9 a, respectively. Increasing the hole frequency from 2.5 to 5, 10, 25, and 50 resulted in a reduction in breakthrough time by 16%, 36%, 62%, and 70%, respectively. Figure 4 shows that as the hole frequency increases, the contaminant flux also significantly increases. Figure 5 shows the breakthrough time curves under different hole frequencies and three hydraulic head conditions. It can be observed that the breakthrough time of the composite barrier decreases as the hole frequency and hydraulic head increase. These results indicate the critical significance of controlling the number of holes on GM for the contaminant prevention performance of vertical cut-off wall.
4.2. Influence of Interface Transmissivity
The interface hydraulic conductivity between the GM and adjacent media can affect the amount of leakage, and its magnitude is determined by the contact conditions. Figure 6 shows the breakthrough curves of a GM with a soil-bentonite barrier under three different contact conditions. The breakthrough times of the vertical barrier were 5.8 a, 10.1 a, and 16.6 a for the three different contact conditions. Compared with the excellent contact condition, the breakthrough times decreased by 39% and 65% for the good and poor contact conditions, respectively. Therefore, controlling the contact conditions reasonably during construction is essential to improve the anti-leakage performance of contaminant prevention barriers.
4.3. Influence of GM Location
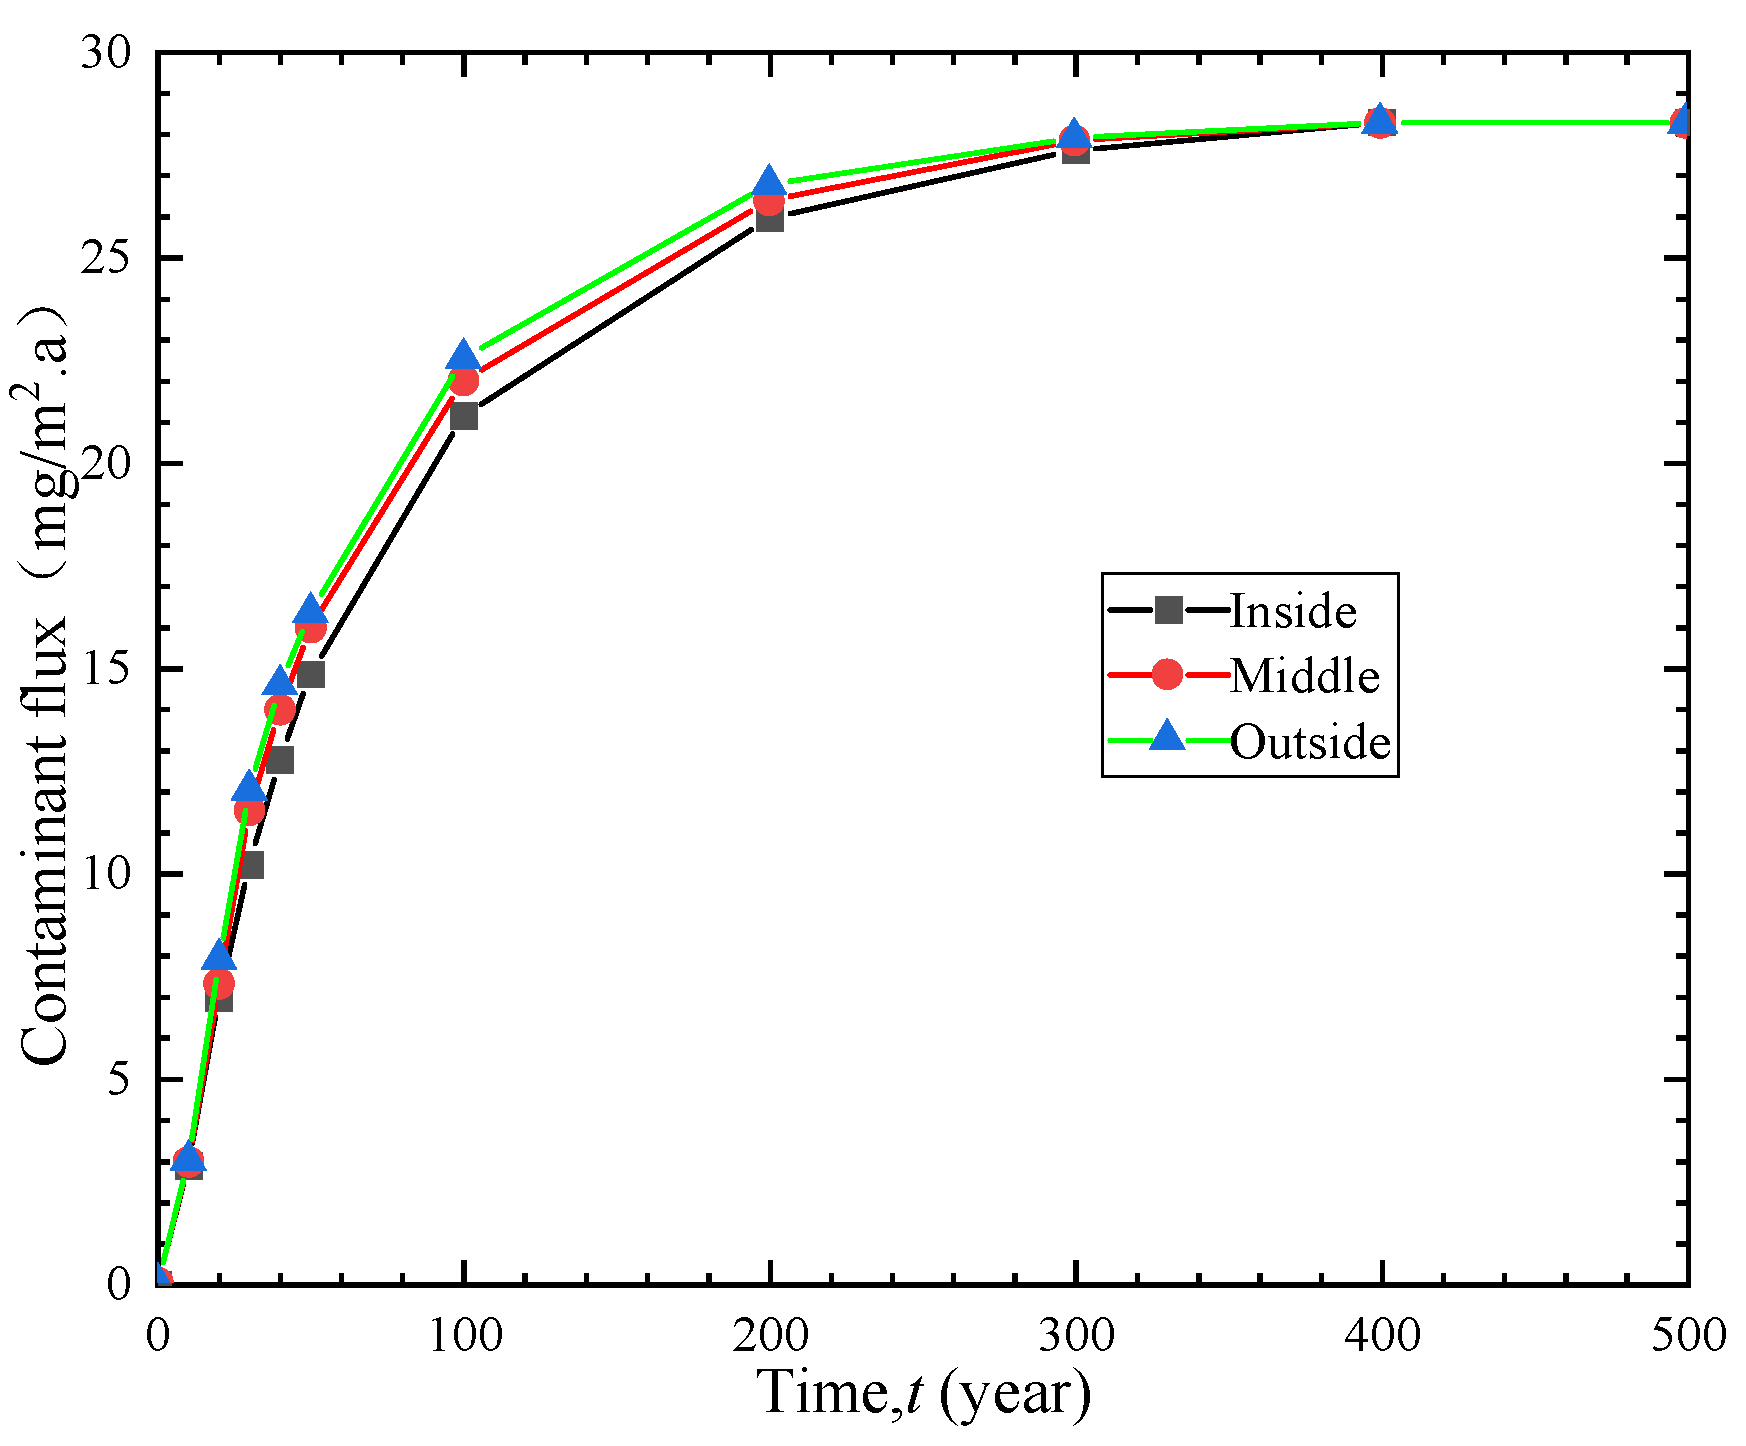
In order to investigate the influence of GM location on the anti-seepage performance of vertical cut-off wall, the organic contaminant benzene was selected as the target contaminant, and the GM was studied and analyzed under three different placement conditions. Figure 7 shows the temporal variations in contaminant flux under the inside placement condition (GM near the inlet boundary of the contaminant), middle placement condition, and outside placement condition (GM near the outlet boundary of the contaminant). The contaminant flux curves under the three conditions are quite similar and eventually tend to be equal, but the total contaminant flux for each condition varies within a certain time period. Under the internal placement condition, the total contaminant flux is minimized, while it is maximized under the external placement condition. Therefore, selecting internal placement is more reasonable under these conditions. Since choosing the GM location during construction does not increase the construction difficulty or engineering cost, making a reasonable choice of the GM location during construction is of great significance for improving the anti-seepage performance of vertical cut-off wall.
4.4. Influence of Soil-Bentonite Barrier Thickness
Figure 8 illustrates the effect of the thickness of the soil-bentonite barrier on the breakthrough time of the entire vertical cut-off wall. For vertical cut-off wall thicknesses of 0.4 m, 0.5 m, 0.6 m, 0.7 m, and 0.8 m, the corresponding breakthrough times are 3.8 a, 6.1 a, 10.1 a, 12.9 a, and 15.5 a, respectively. As the barrier thickness increases from 0.4 m to 0.5 m, 0.6 m, 0.7 m, and 0.8 m, the breakthrough time increases by 60%, 165%, 239%, and 307%, respectively. Moreover, Figure 9 shows that as the barrier thickness increases, the effluent contaminant flux at the outlet boundary decreases. This indicates that a thicker barrier has a stronger blocking effect, leading to better contaminant prevention performance. However, the engineering cost also increases accordingly. Therefore, during construction, considerations must be made regarding both economic costs and anti-seepage performance to achieve the optimal solution.
4.5. Influence of Leachate Heads
To investigate the effect of percolation fluid head on the one-dimensional transport of contaminants, Figure 10 and Figure 11 depict the breakthrough curve and effluent flux curves of contaminants under different leachate heads. As shown in Figure 10, when the percolation leachate head is 0 m, 0.1 m, 0.3 m, and 1 m, the corresponding breakthrough times are 35.1 a, 22.0 a, 10.1 a, and 5.7 a, respectively. When the percolation leachate head increases from 0 m to 0.1 m, 0.3 m, and 1 m, the breakthrough time decreases by 37%, 71%, and 83%, respectively. Figure 11 shows that as the percolation leachate head increases, the effluent contaminant flux at the outlet boundary significantly increases. These findings indicate that an increase in percolation leachate head accelerates the one-dimensional transport of organic contaminants, resulting in a significant increase in the outlet boundary flux. Therefore, controlling percolation fluid effectively can extend the service life of barriers in practical engineering applications.
5. Conclusions
Based on the semi-infinite boundary condition assumption, one-dimensional transport model of organic contaminants in composite vertical cut-off wall with defective high-density polyethylene geomembrane is established and solved numerically. The influences of GM pore ratio, GM placement position, and the contact level between GM and soil-bentonite cut-off wall on the migration law of pollutants are analyzed by the relative pollutant concentration, breakthrough time and contaminant flux. The following conclusions were mainly drawn:
(1) Compared with the defect-free geomembrane, the service life of composite barriers with the defective geomembrane is significantly reduced. When the hole frequency increases from 5 to 25 and 50, the service life decreases by 55% and 65%, respectively.
(2) The results show that the quality of the liner–soil contact significantly affects the flux of contaminants in the vertical cut-off wall. Specifically, compared with excellent contact conditions, the breakthrough time is respectively shortened by 39% and 65% under good and poor contact conditions, respectively. This influence on the transport behavior of contaminants cannot be ignored, and it is recommended that the construction process carefully control the contact conditions to ensure good performance.
(3) The choice of the geomembrane position has limited impact on the transient flux of contaminants, but it does affect the total flux of pollutants over a certain period of time. For example, when benzene is the target contaminant, the total contaminant flux is the smallest when the GM is inserted inside the soil, and it is the largest when the liner is outside the soil.
(4) Increasing the thickness of the cut-off wall can effectively extend its service life and improve its anti-contaminant effect. When the barrier thickness is increased from 0.4 m to 0.6 m and 0.8 m, the breakthrough time increases by 165% and 307%, respectively.
(5) An increase in the hydraulic head of the leachate can accelerate the one-dimensional transport process of organic contaminants and significantly increase the outflow boundary flux. When the hydraulic head of the leachate is increased from 0 m to 0.1 m, 0.3 m, and 1 m, the breakthrough time is shortened by 37%, 71%, and 83%, respectively. Therefore, it is necessary to control the hydraulic head difference of the leachate in actual engineering to ensure the service life of the composite barrier.
Author Contributions
Conceptualization, methodology, writing—review and editing H.L.; investigation, software, and writing—original draft preparation W.H.; investigation, validation, and writing—original draft preparation L.W.; investigation, Z.L. All authors have read and agreed to the published version of the manuscript.
Funding
This research was funded by the National Natural Science Foundation of China, grant number 42062018, 41702324.
Institutional Review Board Statement
Not applicable.
Data Availability Statement
Not applicable.
Conflicts of Interest
The authors declare no conflict of interest.
References
- Qiu, J.; He, Y.; Song, D.; Tong, J. Analytical solution for solute transport in a triple liner under non-isothermal conditions. Geosynth. Int. 2022, 1–18. [Google Scholar] [CrossRef]
- Zheng, Z.; Zhu, Y.; Wang, Q.; Xie, H.; Chen, Y. A semi-analytical model for analyzing the transport of organic pollutants through the geomembrane composite cut-off wall and aquifer system. Rock Soil Mech. 2022, 43, 453–465. [Google Scholar]
- Eun, J.; Tinjum, J.M.; Benson, C.H.; Edil, T.B. Comparison of volatile organic compound transport in composite liners with HDPE and ethylene-vinyl alcohol co-extruded geomembranes. J. Geotech. Geoenviron. Eng. 2017, 143, 04017010. [Google Scholar] [CrossRef]
- Thomas, R.W.; Koerner, R.M. Advances in HDPE barrier walls. Geotext. Geomembr. 1996, 14, 393–408. [Google Scholar] [CrossRef]
- Hendry, M.J.; Barbour, S.L.; Boldt-Leppin, B.E.J.; Reifferscheid, L.J.; Wassenaar, L.I. A comparision of laboratory and field based determinations of molecular diffusion coefficients in a low permeability geologic medium. Environ. Sci. Technol. 2009, 43, 6730–6736. [Google Scholar] [CrossRef]
- Pu, H.F.; Qiu, J.W.; Zhang, R.J.; Zheng, J.J. Analytical solutions for organic contaminant diffusion in triple-layer composite liner system considering the effect of degradation. Acta Geotech. 2020, 15, 907–921. [Google Scholar] [CrossRef]
- Wu, X.; Shi, J.; He, J. Analytical solutions for diffusion of organic contaminant through GCL triple-layer composite liner considering degradation in liner. Environ. Earth Ences 2016, 75, 1371. [Google Scholar] [CrossRef]
- Xie, H.; Lou, Z.; Chen, Y.; Jin, A.; Zhan, T.L.; Tang, X. An analytical solution to organic contaminant diffusion through composite liners considering the effect of degradation. Geotext. Geomembr. 2013, 36, 10–18. [Google Scholar] [CrossRef]
- Xie, H.; Thomas, H.R.; Chen, Y.; Sedighi, M.; Zhan, T.L.; Tang, X. Diffusion of organic contaminants in triple-layer composite liners: An analytical modeling approach. Acta Geotech. 2015, 10, 255–262. [Google Scholar] [CrossRef]
- Peng, M.Q.; Feng, S.J.; Chen, H.X.; Chen, Z.L. An analytical solution for organic pollutant diffusion in a triple-layer composite liner considering the coupling influence of thermal diffusion. Comput. Geotech. 2021, 137, 104283. [Google Scholar] [CrossRef]
- Cao, B.Y.; Souza, L.; Wang, F.; Xu, J.; Litina, C.; Al-Tabbaa, A. The first microcapsule-based self-healing cement-bentonite cut-off wall materials. Geotechnique 2023, 73, 105–114. [Google Scholar] [CrossRef]
- Neville, C.J.; Andrews, C.B. Containment criterion for contaminant isolation by cutoff walls. Ground Water 2006, 44, 682–686. [Google Scholar] [CrossRef]
- Li, Y.C.; Chen, G.N.; Chen, Y.M.; Cleall, P.J. Design charts for contaminant transport through slurry trench cutoff walls. J. Environ. Eng. 2017, 143, 06017005. [Google Scholar] [CrossRef]
- Acar, Y.B.; Haider, L. Transport of low-concentration contaminants in saturated earthen barriers. J. Geotech. Eng.-Asce 1990, 116, 1031–1052. [Google Scholar] [CrossRef]
- Peng, C.H.; Feng, S.J.; Zheng, Q.T.; Ding, X.H.; Chen, Z.L.; Chen, H.X. A two-dimensional analytical solution for organic contaminant diffusion through a composite geomembrane cut-off wall and an aquifer. Comput. Geotech. 2020, 119, 103361. [Google Scholar] [CrossRef]
- Xie, H.J.; Wang, S.Y.; Chen, Y.; Jiang, J.Q.; Qiu, Z.H. An analytical model for contaminant transport in cut-off wall and aquifer system. Environ. Geotech. 2020, 7, 457–466. [Google Scholar] [CrossRef]
- Lee, T.; Benson, C.H. Flow past bench-scale vertical ground-water cutoff walls. J. Geotech. Geoenviron. Eng. 2000, 126, 511–520. [Google Scholar] [CrossRef]
- Barroso, M.; Touze-Foltz, N.; von Maubeuge, K.; Pierson, P. Laboratory investigation of flow rate through composite liners consisting of a geomembrane, a GCL and a soil liner. Geotext. Geomembr. 2006, 24, 139–155. [Google Scholar] [CrossRef]
- Philip, L.K. An investigation into contaminant transport processes through single-phase cement-bentonite slurry walls. Eng. Geol. 2001, 60, 209–221. [Google Scholar] [CrossRef]
- Zhang, W.J.; Qiu, Q.W. Analysis on contaminant migration through vertical barrier walls in a landfill in China. Environ. Earth Sci. 2010, 61, 847–852. [Google Scholar] [CrossRef]
- Shackelford, C.D.; Moore, S.M. Fickian diffusion of radionuclides for engineered containment barriers: Diffusion coefficients, porosities, and complicating issues. Eng. Geol. 2013, 152, 133–147. [Google Scholar] [CrossRef]
- Gillham, R.W.; Robin, M.J.L.; Dytynyshyn, D.J.; Johnston, H.M. Diffusion of nonreactive and reactive solutes through fine-grained barrier materials. Can. Geotech. J. 1984, 21, 541–550. [Google Scholar] [CrossRef]
- Zhan, L.T.; Zeng, X.; Li, Y.C.; Chen, Y.M. Analytical solution for one-dimensional diffusion of organic pollutants in a geomembrane-bentonite composite barrier and parametric analyses. J. Environ. Eng. 2014, 140, 57–68. [Google Scholar] [CrossRef]
- Wu, X.; Shi, J.; He, J. An analysis of organic contaminant diffusion through clay liner under the condition of transient temperature. Hydrogeol. Eng. Geol. 2014, 41, 120–124. [Google Scholar]
- Rowe, R.K. Short- and long-term leakage through composite liners. The 7th arthur casagrande lecture. Can. Geotech. J. 2012, 49, 141–169. [Google Scholar] [CrossRef] [Green Version]
- Rowe, R.K.; Chappel, M.J.; Brachman, R.W.I.; Take, W.A. Field study of wrinkles in a geomembrane at a composite liner test site. Can. Geotech. J. 2012, 49, 1196–1211. [Google Scholar] [CrossRef]
- Rowe, R.K.; Brachman, R.W.I. Assessment of equivalence of composite liners. Geosynth. Int. 2004, 11, 273–286. [Google Scholar] [CrossRef]
- Xie, H.J.; Zhang, C.H.; Feng, S.J.; Wang, Q.; Yan, H.X. Analytical model for degradable organic contaminant transport through a GMB/GCL/AL system. J. Environ. Eng. 2018, 144, 14. [Google Scholar] [CrossRef]
- Chappel, M.J.; Rowe, R.K.; Brachman, R.W.I.; Take, W.A. A comparison of geomembrane wrinkles for nine field cases. Geosynth. Int. 2012, 19, 453–469. [Google Scholar] [CrossRef]
- Visudmedanukul, P.; Kamon, M.; Katsumi, T. Chloride transport through cement-bentonite barriers. J. Geotech. Geoenviron. Eng. 2007, 133, 175–185. [Google Scholar] [CrossRef]
- Forget, B.; Rollin, A.L.; Jacquelin, T. Lessons learned from 10 years ofleak detection surveys on geomembranes. In Proceedings of the 10th International Waste Management and Landfill Symposium, Cagliari, Italy, 3–7 October 2005. [Google Scholar]
Figure 1.
Contaminant transport model diagram.

Figure 2.
Comparison of the proposed analytical model in this paper and the numerical method.

Figure 3.
Breakthrough curves of different hole frequencies.

Figure 4.
Contaminant flux curves of different hole frequencies.

Figure 5.
Breakthrough time curves of different hole frequencies.

Figure 6.
Breakthrough curves of different contacts.

Figure 7.
Effect of GM location on contaminant flux.

Figure 8.
Breakthrough curves of different cut-off wall thicknesses.

Figure 9.
Contaminant flux curves of different cut-off wall thicknesses.

Figure 10.
Breakthrough curves under different leachate heads.

Figure 11.
Contaminant flux curves under different leachate heads.


Table 1.
Calculation parameters.
| Parameter | GM | Soil-Bentonite Barrier |
|---|---|---|
| Thickness, L (m) | 0.0015 | 0.6 |
| Porosity, n | / | 0.5 |
| Effective diffusion coefficient, D (m2/s) | 3.5 × 10⁻¹³ | 9.23 × 10⁻¹⁰ |
| Partition coefficient, Kg | 30 | / |
| Distribution coefficient, Kd (mL/g) | / | 1 |
| Hydraulic conductivity, k (m/s) | 1 × 10⁻¹² | 1 × 10⁻¹⁰ |
| retardation factor Rd | / | 2.4 |
Disclaimer/Publisher’s Note: The statements, opinions and data contained in all publications are solely those of the individual author(s) and contributor(s) and not of MDPI and/or the editor(s). MDPI and/or the editor(s) disclaim responsibility for any injury to people or property resulting from any ideas, methods, instructions or products referred to in the content. |
© 2023 by the authors. Licensee MDPI, Basel, Switzerland. This article is an open access article distributed under the terms and conditions of the Creative Commons Attribution (CC BY) license (https://creativecommons.org/licenses/by/4.0/).
Share and Cite
MDPI and ACS Style
Lin, H.; Huang, W.; Wang, L.; Liu, Z. Transport of Organic Contaminants in Composite Vertical Cut-Off Wall with Defective HDPE Geomembrane. Polymers 2023, 15, 3031. https://doi.org/10.3390/polym15143031
AMA Style
Lin H, Huang W, Wang L, Liu Z. Transport of Organic Contaminants in Composite Vertical Cut-Off Wall with Defective HDPE Geomembrane. Polymers. 2023; 15(14):3031. https://doi.org/10.3390/polym15143031
Chicago/Turabian StyleLin, Hai, Wenzhou Huang, Liangni Wang, and Zhanlei Liu. 2023. "Transport of Organic Contaminants in Composite Vertical Cut-Off Wall with Defective HDPE Geomembrane" Polymers 15, no. 14: 3031. https://doi.org/10.3390/polym15143031
Note that from the first issue of 2016, this journal uses article numbers instead of page numbers. See further details here.