

In Vitro Lipid Overload Affects Cellular Proliferation, Apoptosis, and Senescence in a Time-Dependent Manner in HepG2 Hepatocytes and LX-2 Hepatic Stellate Cells
 , ,
, ,
Abstract
:
1. Introduction
2. Materials and Methods
2.1. Cell Culture
2.2. Lipid Contents
2.3. Cellular Growth and Viability
2.4. Cell Death
2.5. Cellular Senescence
2.6. Statistics
3. Results
3.1. Steatosis in HepG2 Cells
3.2. Proliferation and Viability
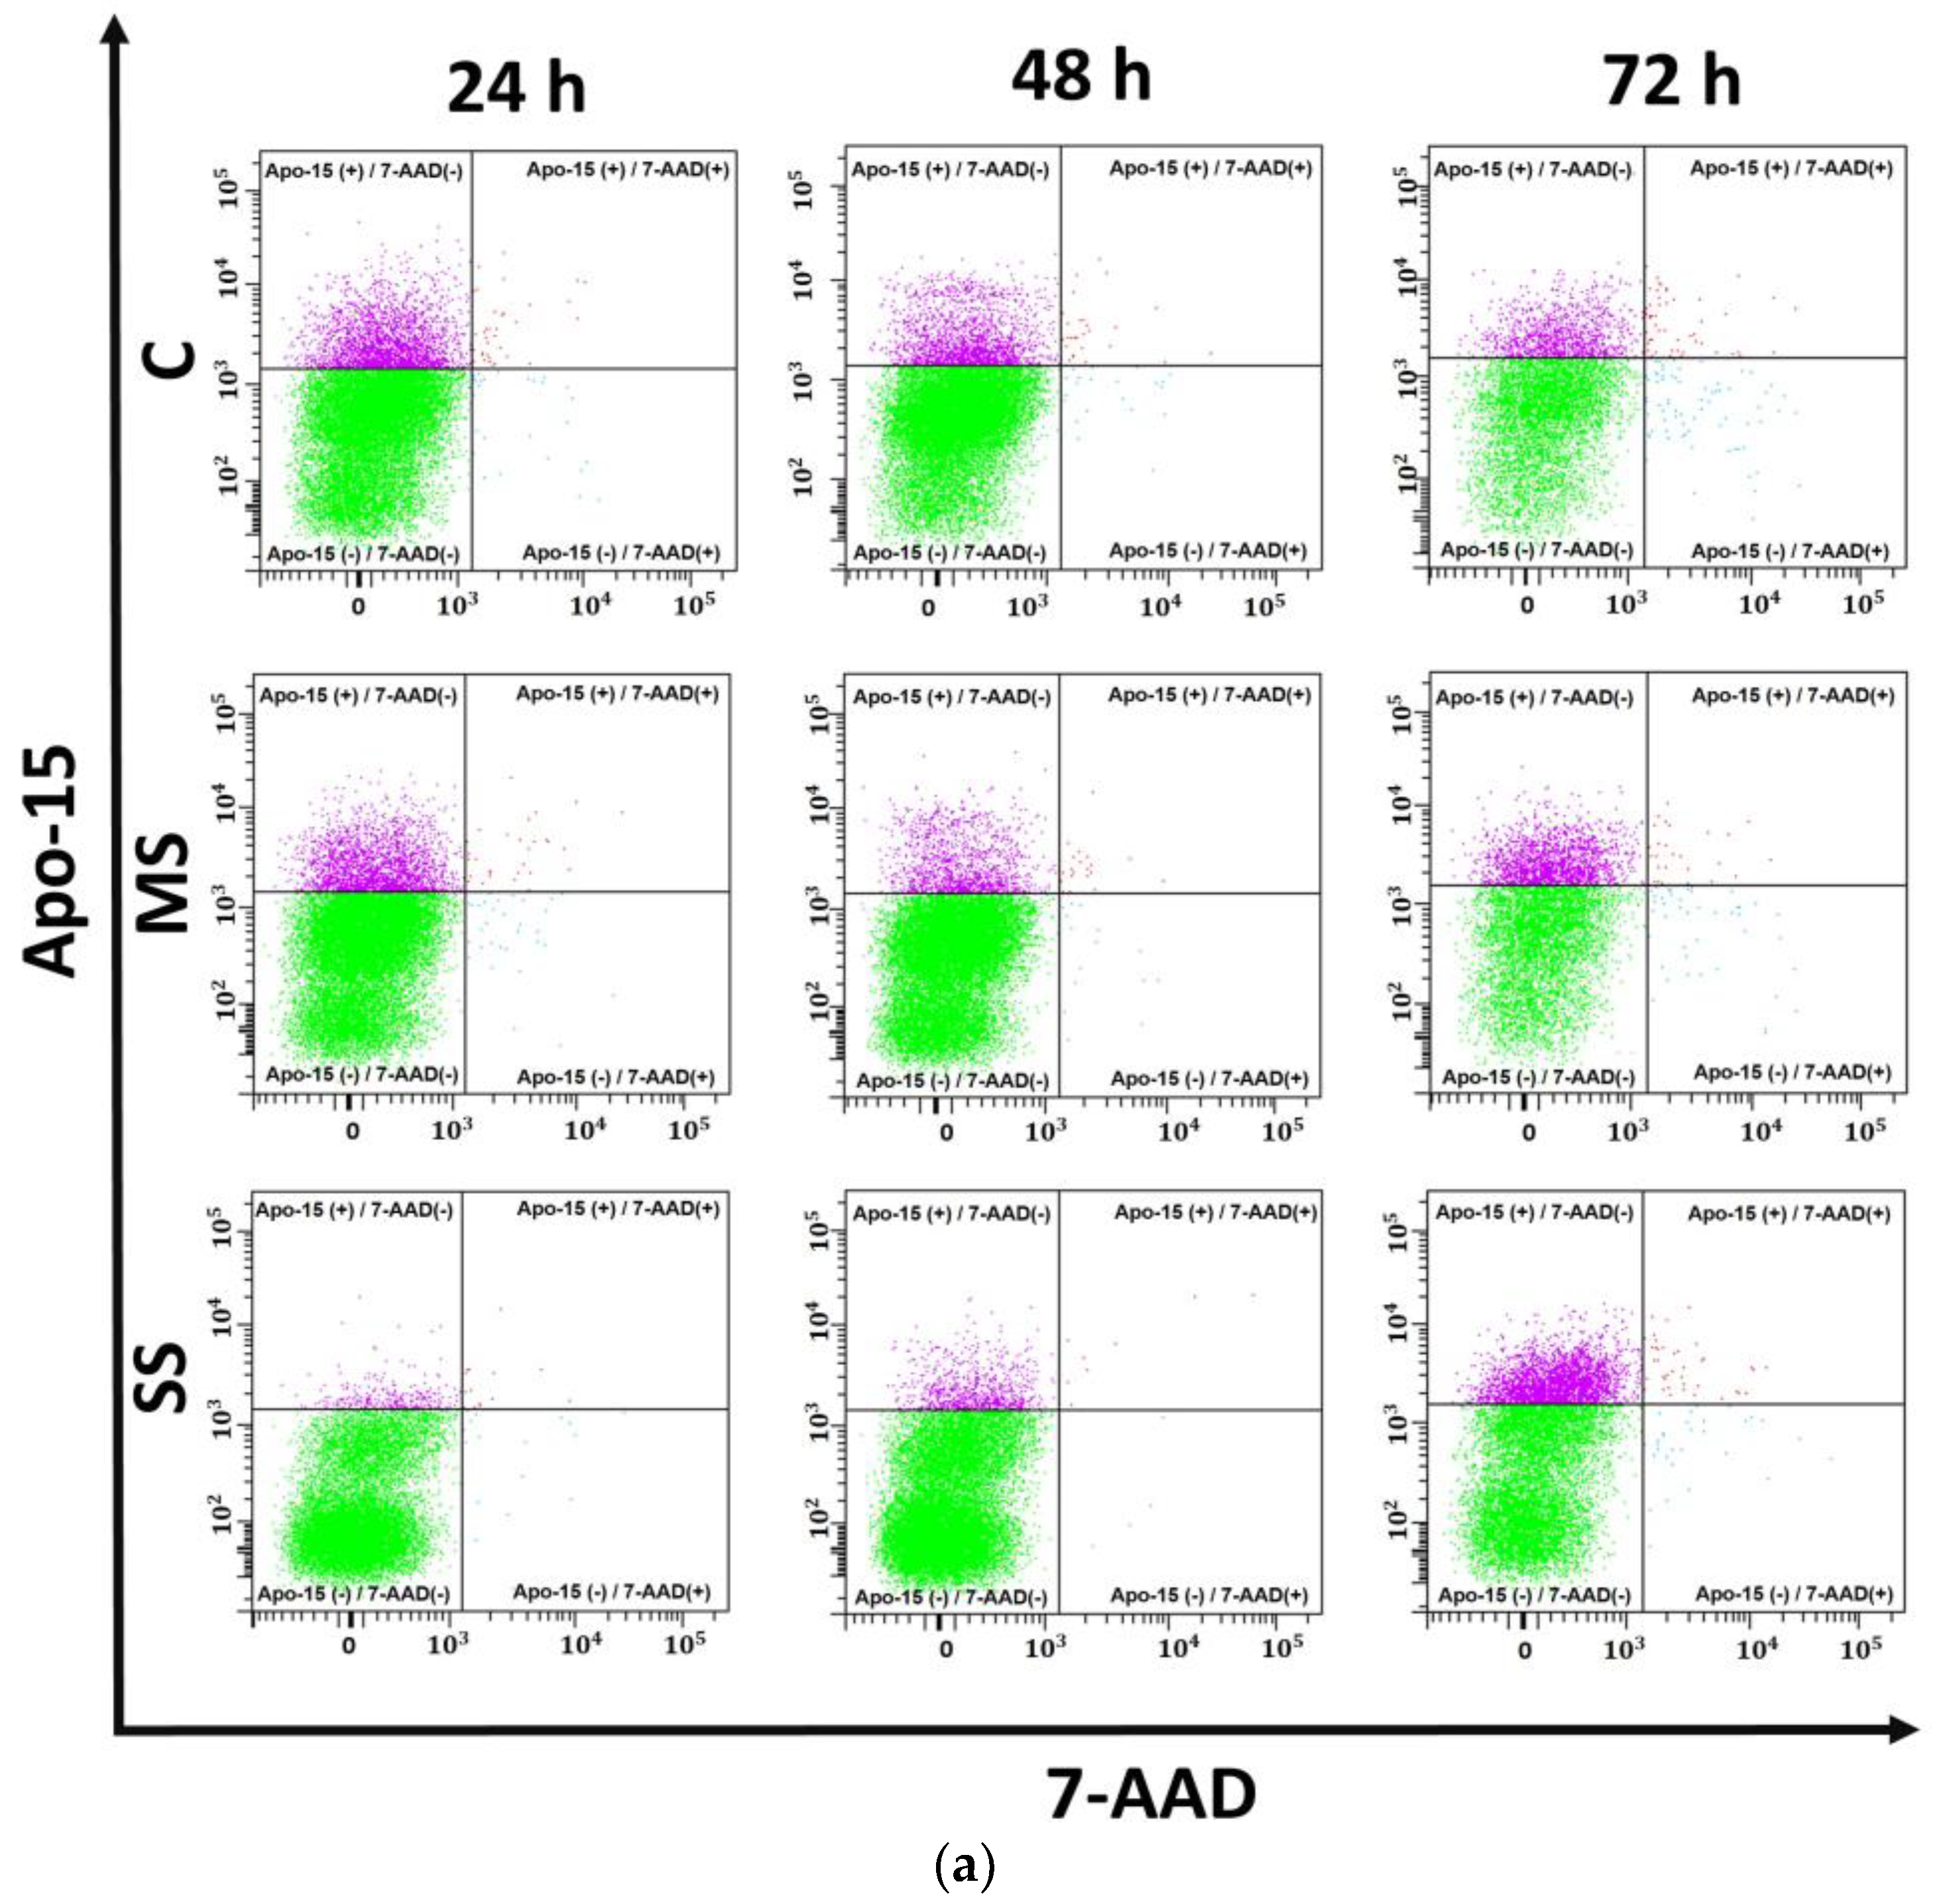
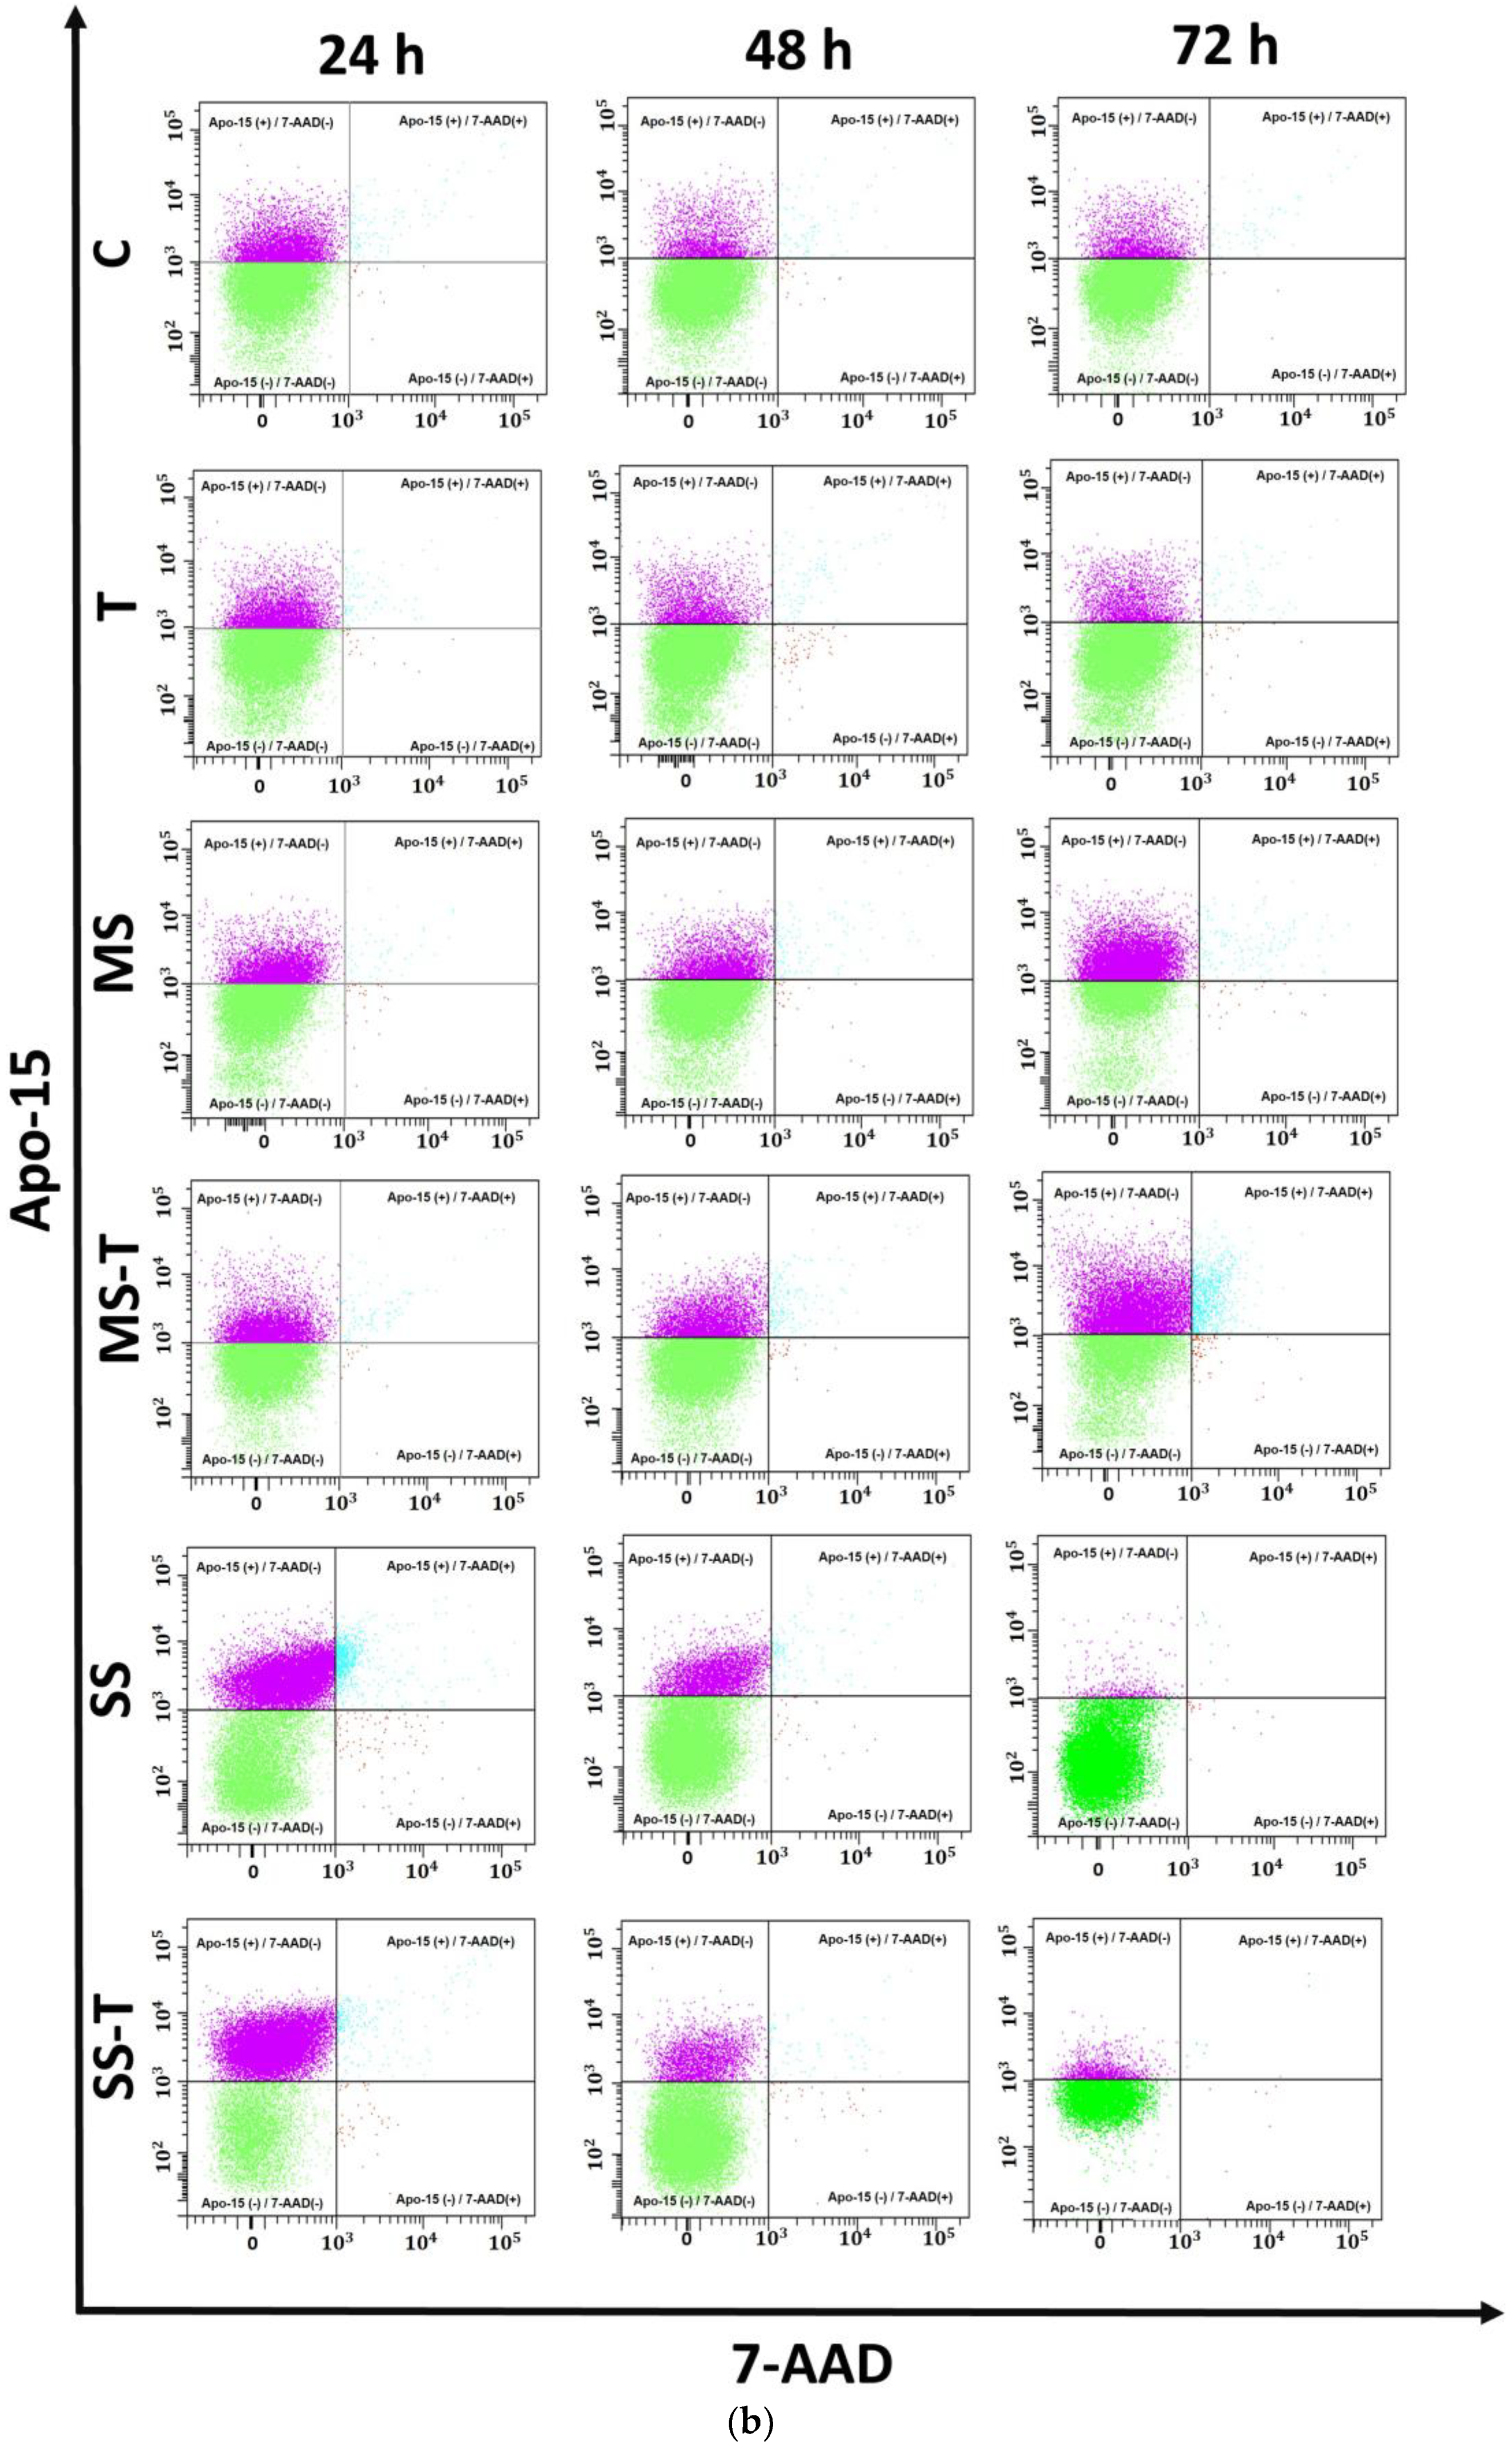
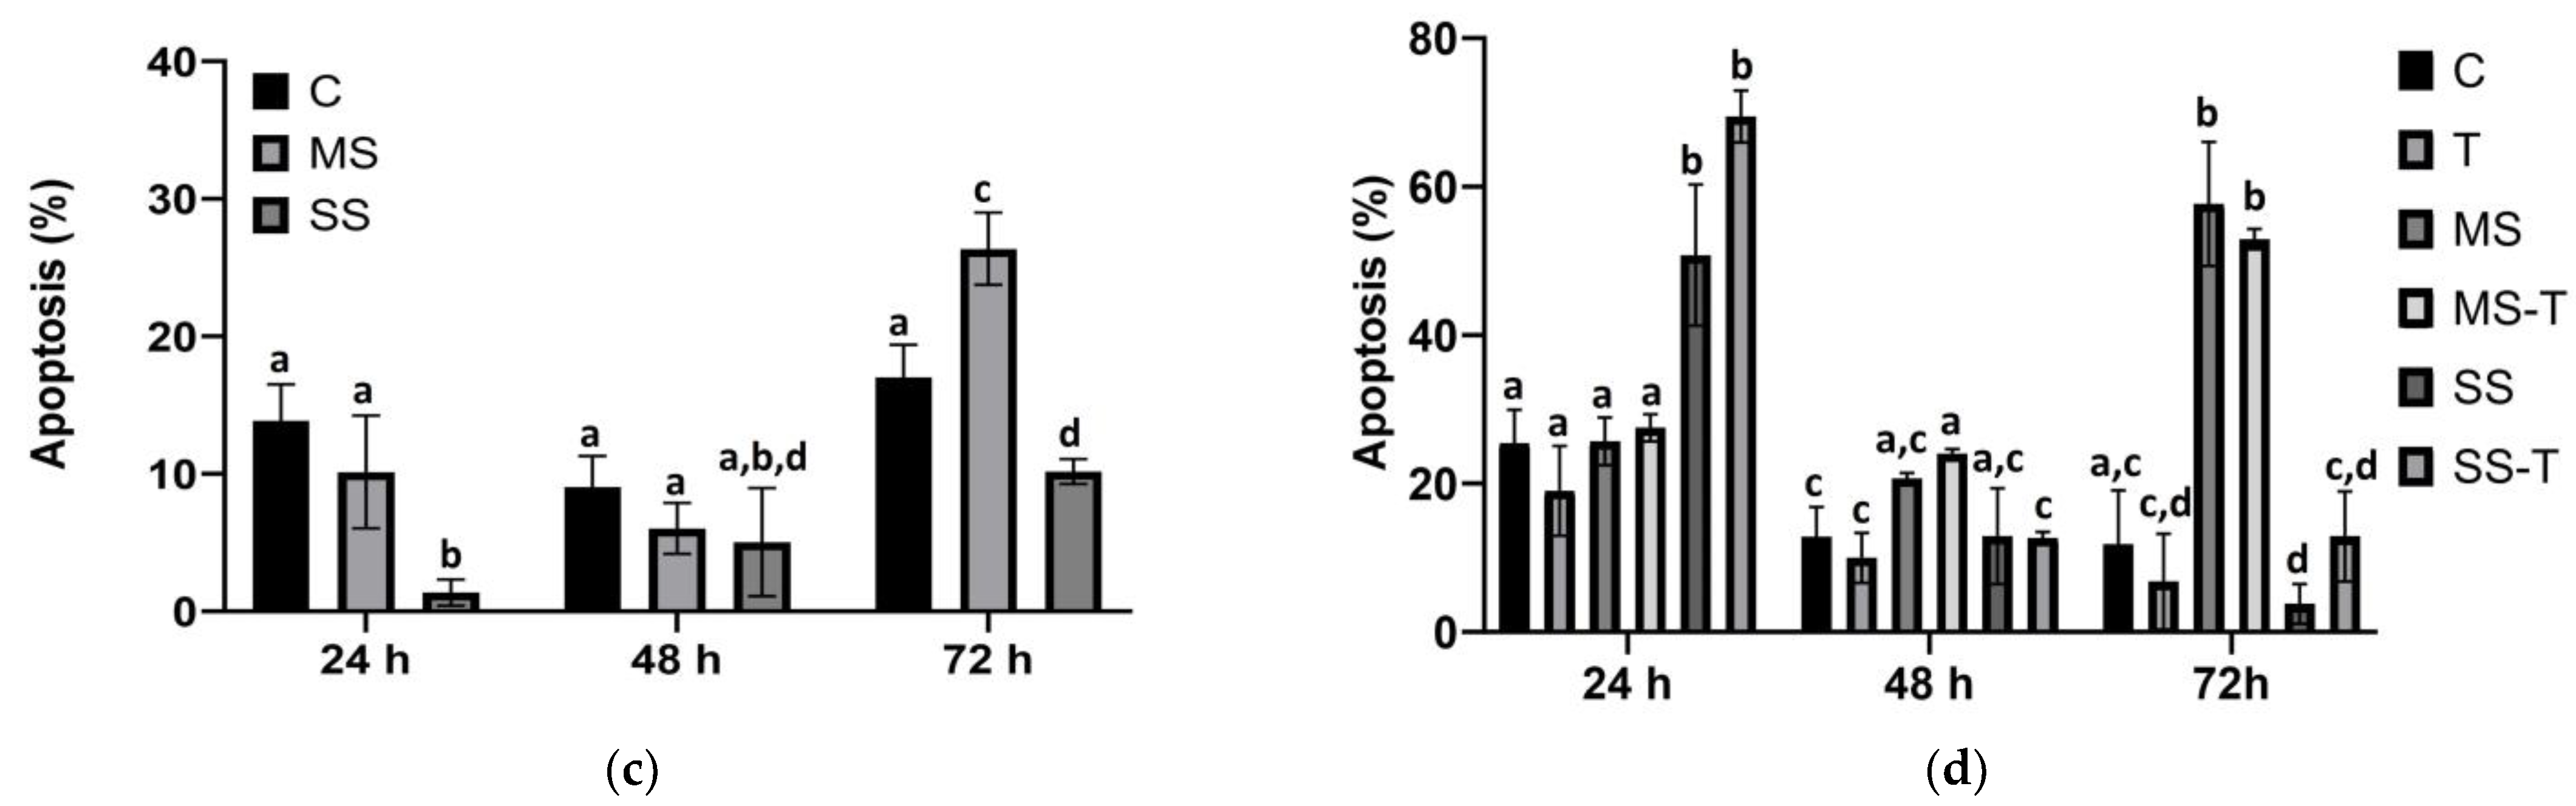
3.3. Apoptosis
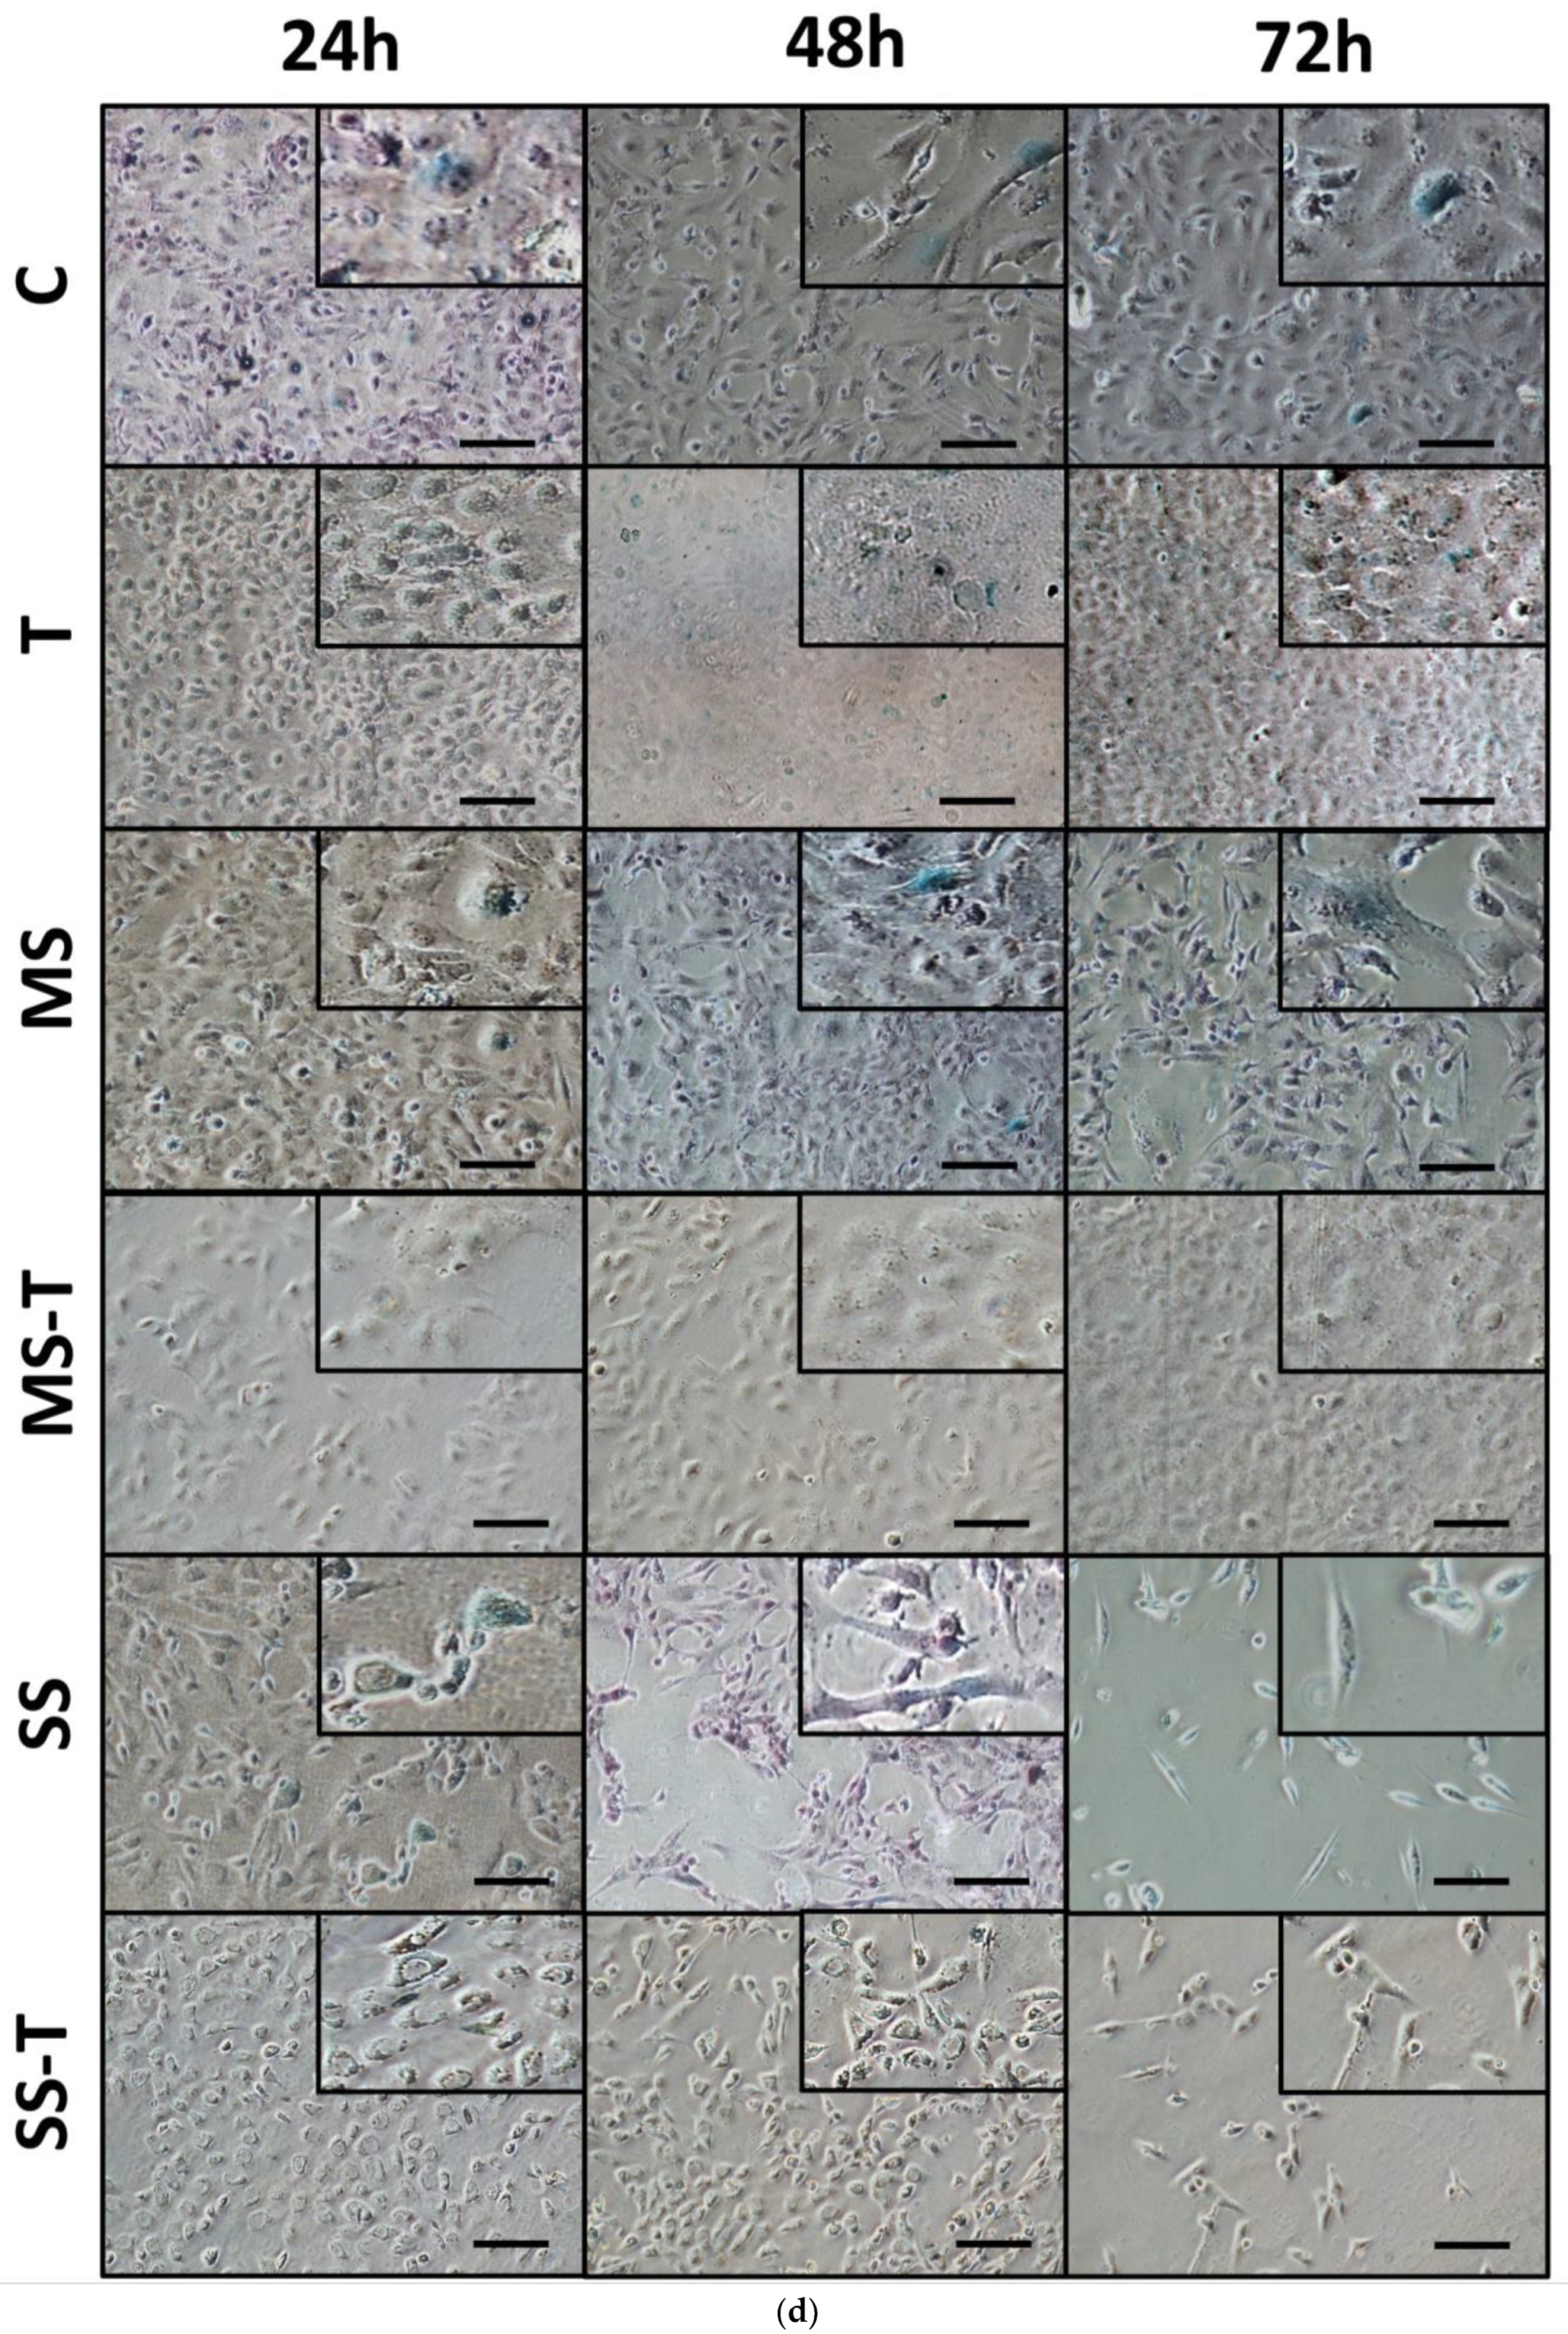
3.4. Senescence
4. Discussion
5. Conclusions
Supplementary Materials
Author Contributions
Funding
Institutional Review Board Statement
Informed Consent Statement
Data Availability Statement
Acknowledgments
Conflicts of Interest
References
- Younossi, Z.; Tacke, F.; Arrese, M.; Chander Sharma, B.; Mostafa, I.; Bugianesi, E.; Wai-Sun Wong, V.; Yilmaz, Y.; George, J.; Fan, J.; et al. Global Perspectives on Nonalcoholic Fatty Liver Disease and Nonalcoholic Steatohepatitis. Hepatology 2019, 69, 2672–2682. [Google Scholar] [CrossRef]
- Cotter, T.G.; Rinella, M. Nonalcoholic Fatty Liver Disease 2020: The State of the Disease. Gastroenterology 2020, 158, 1851–1864. [Google Scholar] [CrossRef] [PubMed]
- Rinella, M.E.; Lazarus, J.V.; Ratziu, V.; Francque, S.M.; Sanyal, A.J.; Kanwal, F.; Romero, D.; Abdelmalek, M.F.; Anstee, Q.M.; Arab, J.P.; et al. A multi-society Delphi consensus statement on new fatty liver disease nomenclature. Hepatology 2023, 78, 1966–1986. [Google Scholar] [CrossRef] [PubMed]
- Rinella, M.E.; Neuschwander-Tetri, B.A.; Siddiqui, M.S.; Abdelmalek, M.F.; Caldwell, S.; Barb, D.; Kleiner, D.E.; Loomba, R. AASLD Practice Guidance on the clinical assessment and management of nonalcoholic fatty liver disease. Hepatology 2023, 77, 1797–1835. [Google Scholar] [CrossRef]
- Calzadilla Bertot, L.; Adams, L.A. The Natural Course of Non-Alcoholic Fatty Liver Disease. Int. J. Mol. Sci. 2016, 17, 774. [Google Scholar] [CrossRef]
- Davis, T.M.E. Diabetes and metabolic dysfunction-associated fatty liver disease. Metabolism 2021, 123, 154868. [Google Scholar] [CrossRef] [PubMed]
- Bessone, F.; Razori, M.V.; Roma, M.G. Molecular pathways of nonalcoholic fatty liver disease development and progression. Cell Mol. Life Sci. 2019, 76, 99–128. [Google Scholar] [CrossRef]
- Friedman, S.L.; Neuschwander-Tetri, B.A.; Rinella, M.; Sanyal, A.J. Mechanisms of NAFLD development and therapeutic strategies. Nat. Med. 2018, 24, 908–922. [Google Scholar] [CrossRef]
- Fujii, H.; Kawada, N.; Japan Study Group Of Nafld, J.-N. The Role of Insulin Resistance and Diabetes in Nonalcoholic Fatty Liver Disease. Int. J. Mol. Sci. 2020, 21, 3863. [Google Scholar] [CrossRef]
- Loomba, R.; Friedman, S.L.; Shulman, G.I. Mechanisms and disease consequences of nonalcoholic fatty liver disease. Cell 2021, 184, 2537–2564. [Google Scholar] [CrossRef]
- Kamm, D.R.; McCommis, K.S. Hepatic stellate cells in physiology and pathology. J. Physiol. 2022, 600, 1825–1837. [Google Scholar] [CrossRef] [PubMed]
- de Oliveira da Silva, B.; Ramos, L.F.; Moraes, K.C.M. Molecular interplays in hepatic stellate cells: Apoptosis, senescence, and phenotype reversion as cellular connections that modulate liver fibrosis. Cell Biol. Int. 2017, 41, 946–959. [Google Scholar] [CrossRef] [PubMed]
- Aravinthan, A.; Scarpini, C.; Tachtatzis, P.; Verma, S.; Penrhyn-Lowe, S.; Harvey, R.; Davies, S.E.; Allison, M.; Coleman, N.; Alexander, G. Hepatocyte senescence predicts progression in non-alcohol-related fatty liver disease. J. Hepatol. 2013, 58, 549–556. [Google Scholar] [CrossRef] [PubMed]
- Engelmann, C.; Tacke, F. The Potential Role of Cellular Senescence in Non-Alcoholic Fatty Liver Disease. Int. J. Mol. Sci. 2022, 23, 652. [Google Scholar] [CrossRef]
- Campos-Espinosa, A.; Guzman, C. A Model of Experimental Steatosis In Vitro: Hepatocyte Cell Culture in Lipid Overload-Conditioned Medium. J. Vis. Exp. 2021, 171, 62543. [Google Scholar] [CrossRef]
- Chan, W.K.; Chuah, K.H.; Rajaram, R.B.; Lim, L.L.; Ratnasingam, J.; Vethakkan, S.R. Metabolic Dysfunction-Associated Steatotic Liver Disease (MASLD): A State-of-the-Art Review. J. Obe.s Metab. Syndr. 2023, 32, 197–213. [Google Scholar] [CrossRef]
- Younossi, Z.M.; Golabi, P.; Paik, J.M.; Henry, A.; Van Dongen, C.; Henry, L. The global epidemiology of nonalcoholic fatty liver disease (NAFLD) and nonalcoholic steatohepatitis (NASH): A systematic review. Hepatology 2023, 77, 1335–1347. [Google Scholar] [CrossRef]
- Chen, X.; Li, L.; Liu, X.; Luo, R.; Liao, G.; Li, L.; Liu, J.; Cheng, J.; Lu, Y.; Chen, Y. Oleic acid protects saturated fatty acid mediated lipotoxicity in hepatocytes and rat of non-alcoholic steatohepatitis. Life Sci. 2018, 203, 291–304. [Google Scholar] [CrossRef]
- Moravcova, A.; Cervinkova, Z.; Kucera, O.; Mezera, V.; Rychtrmoc, D.; Lotkova, H. The effect of oleic and palmitic acid on induction of steatosis and cytotoxicity on rat hepatocytes in primary culture. Physiol. Res. 2015, 64, S627–S636. [Google Scholar] [CrossRef]
- Zeng, X.; Zhu, M.; Liu, X.; Chen, X.; Yuan, Y.; Li, L.; Liu, J.; Lu, Y.; Cheng, J.; Chen, Y. Oleic acid ameliorates palmitic acid induced hepatocellular lipotoxicity by inhibition of ER stress and pyroptosis. Nutr. Metab. 2020, 17, 11. [Google Scholar] [CrossRef]
- Kanda, T.; Matsuoka, S.; Yamazaki, M.; Shibata, T.; Nirei, K.; Takahashi, H.; Kaneko, T.; Fujisawa, M.; Higuchi, T.; Nakamura, H.; et al. Apoptosis and non-alcoholic fatty liver diseases. World J. Gastroenterol. 2018, 24, 2661–2672. [Google Scholar] [CrossRef]
- Ricchi, M.; Odoardi, M.R.; Carulli, L.; Anzivino, C.; Ballestri, S.; Pinetti, A.; Fantoni, L.I.; Marra, F.; Bertolotti, M.; Banni, S.; et al. Differential effect of oleic and palmitic acid on lipid accumulation and apoptosis in cultured hepatocytes. J. Gastroenterol. Hepatol. 2009, 24, 830–840. [Google Scholar] [CrossRef]
- Bertheloot, D.; Latz, E.; Franklin, B.S. Necroptosis, pyroptosis and apoptosis: An intricate game of cell death. Cell Mol. Immunol. 2021, 18, 1106–1121. [Google Scholar] [CrossRef]
- Afonso, M.B.; Rodrigues, P.M.; Carvalho, T.; Caridade, M.; Borralho, P.; Cortez-Pinto, H.; Castro, R.E.; Rodrigues, C.M. Necroptosis is a key pathogenic event in human and experimental murine models of non-alcoholic steatohepatitis. Clin. Sci. 2015, 129, 721–739. [Google Scholar] [CrossRef]
- Wree, A.; Eguchi, A.; McGeough, M.D.; Pena, C.A.; Johnson, C.D.; Canbay, A.; Hoffman, H.M.; Feldstein, A.E. NLRP3 inflammasome activation results in hepatocyte pyroptosis, liver inflammation, and fibrosis in mice. Hepatology 2014, 59, 898–910. [Google Scholar] [CrossRef] [PubMed]
- Gaul, S.; Leszczynska, A.; Alegre, F.; Kaufmann, B.; Johnson, C.D.; Adams, L.A.; Wree, A.; Damm, G.; Seehofer, D.; Calvente, C.J.; et al. Hepatocyte pyroptosis and release of inflammasome particles induce stellate cell activation and liver fibrosis. J. Hepatol. 2021, 74, 156–167. [Google Scholar] [CrossRef]
- Ruan, S.; Han, C.; Sheng, Y.; Wang, J.; Zhou, X.; Guan, Q.; Li, W.; Zhang, C.; Yang, Y. Antcin A alleviates pyroptosis and inflammatory response in Kupffercells of non-alcoholic fatty liver disease by targeting NLRP3. Int. Immunopharmacol. 2021, 100, 108126. [Google Scholar] [CrossRef] [PubMed]
- Roger, L.; Tomas, F.; Gire, V. Mechanisms and Regulation of Cellular Senescence. Int. J. Mol. Sci. 2021, 22, 13173. [Google Scholar] [CrossRef] [PubMed]
- Jophlin, L.L.; Koutalos, Y.; Chen, C.; Shah, V.; Rockey, D.C. Hepatic stellate cells retain retinoid-laden lipid droplets after cellular transdifferentiation into activated myofibroblasts. Am. J. Physiol. Gastrointest. Liver Physiol. 2018, 315, G713–G721. [Google Scholar] [CrossRef]
- Bates, J.; Vijayakumar, A.; Ghoshal, S.; Marchand, B.; Yi, S.; Kornyeyev, D.; Zagorska, A.; Hollenback, D.; Walker, K.; Liu, K.; et al. Acetyl-CoA carboxylase inhibition disrupts metabolic reprogramming during hepatic stellate cell activation. J. Hepatol. 2020, 73, 896–905. [Google Scholar] [CrossRef] [PubMed]
- Fondevila, M.F.; Fernandez, U.; Heras, V.; Parracho, T.; Gonzalez-Rellan, M.J.; Novoa, E.; Porteiro, B.; Alonso, C.; Mayo, R.; da Silva Lima, N.; et al. Inhibition of carnitine palmitoyltransferase 1A in hepatic stellate cells protects against fibrosis. J. Hepatol. 2022, 77, 15–28. [Google Scholar] [CrossRef] [PubMed]
- Gou, Y.; Wang, L.; Zhao, J.; Xu, X.; Xu, H.; Xie, F.; Wang, Y.; Feng, Y.; Zhang, J.; Zhang, Y. PNPLA3-I148M Variant Promotes the Progression of Liver Fibrosis by Inducing Mitochondrial Dysfunction. Int. J. Mol. Sci. 2023, 24, 9681. [Google Scholar] [CrossRef] [PubMed]
- Araya, J.; Rodrigo, R.; Videla, L.A.; Thielemann, L.; Orellana, M.; Pettinelli, P.; Poniachik, J. Increase in long-chain polyunsaturated fatty acid n − 6/n − 3 ratio in relation to hepatic steatosis in patients with non-alcoholic fatty liver disease. Clin. Sci. 2004, 106, 635–643. [Google Scholar] [CrossRef] [PubMed]
- Ogawa, Y.; Imajo, K.; Honda, Y.; Kessoku, T.; Tomeno, W.; Kato, S.; Fujita, K.; Yoneda, M.; Saito, S.; Saigusa, Y.; et al. Palmitate-induced lipotoxicity is crucial for the pathogenesis of nonalcoholic fatty liver disease in cooperation with gut-derived endotoxin. Sci. Rep. 2018, 8, 11365. [Google Scholar] [CrossRef]
- Liu, J.; Han, L.; Zhu, L.; Yu, Y. Free fatty acids, not triglycerides, are associated with non-alcoholic liver injury progression in high fat diet induced obese rats. Lipids Health Dis. 2016, 15, 27. [Google Scholar] [CrossRef]
- Guo, W.; Zhong, W.; Hao, L.; Dong, H.; Sun, X.; Yue, R.; Li, T.; Zhou, Z. Fatty Acids Inhibit LAMP2-Mediated Autophagy Flux via Activating ER Stress Pathway in Alcohol-Related Liver Disease. Cell Mol. Gastroenterol. Hepatol. 2021, 12, 1599–1615. [Google Scholar] [CrossRef]


Disclaimer/Publisher’s Note: The statements, opinions and data contained in all publications are solely those of the individual author(s) and contributor(s) and not of MDPI and/or the editor(s). MDPI and/or the editor(s) disclaim responsibility for any injury to people or property resulting from any ideas, methods, instructions or products referred to in the content. |
© 2024 by the authors. Licensee MDPI, Basel, Switzerland. This article is an open access article distributed under the terms and conditions of the Creative Commons Attribution (CC BY) license (https://creativecommons.org/licenses/by/4.0/).
Share and Cite
Campos-Espinosa, A.; Guzmán, C.; Medina-Ávila, K.Z.; Gutierrez-Reyes, G. In Vitro Lipid Overload Affects Cellular Proliferation, Apoptosis, and Senescence in a Time-Dependent Manner in HepG2 Hepatocytes and LX-2 Hepatic Stellate Cells. Cells 2024, 13, 282. https://doi.org/10.3390/cells13030282
Campos-Espinosa A, Guzmán C, Medina-Ávila KZ, Gutierrez-Reyes G. In Vitro Lipid Overload Affects Cellular Proliferation, Apoptosis, and Senescence in a Time-Dependent Manner in HepG2 Hepatocytes and LX-2 Hepatic Stellate Cells. Cells. 2024; 13(3):282. https://doi.org/10.3390/cells13030282
Chicago/Turabian StyleCampos-Espinosa, Adriana, Carolina Guzmán, Karla Zaira Medina-Ávila, and Gabriela Gutierrez-Reyes. 2024. "In Vitro Lipid Overload Affects Cellular Proliferation, Apoptosis, and Senescence in a Time-Dependent Manner in HepG2 Hepatocytes and LX-2 Hepatic Stellate Cells" Cells 13, no. 3: 282. https://doi.org/10.3390/cells13030282