Fold-Change-Specific Enrichment Analysis (FSEA): Quantification of Transcriptional Response Magnitude for Functional Gene Groups

 , ,
, ,  ,
,  ,
,
Abstract
1. Introduction
2. Materials and Methods
2.1. Datasets for FSEA Testing and Application
2.1.1. Real Datasets for FSEA Application
2.1.2. Simulated Datasets for FSEA Testing
- Six groups of DEGs of different sizes (5, 10, 20, 30, 40, and 50 genes) with the fold-change mean equals to 1 (μ = 1) and with the strong correlation within each group (correlation coefficient (ρ) > 0.7). These gene sets simulate pseudo-GO terms;
- One group of DEGs (μ = 1) of 100 genes without any correlation (ρ ~ 0);
- One group of non-DEGs (μ = 0) of 700 genes without any correlation (ρ ~ 0).
2.2. FSEA Method Formal Description
- ;
- , in case of ;
- , in case of ,
2.3. FSEA Implementation
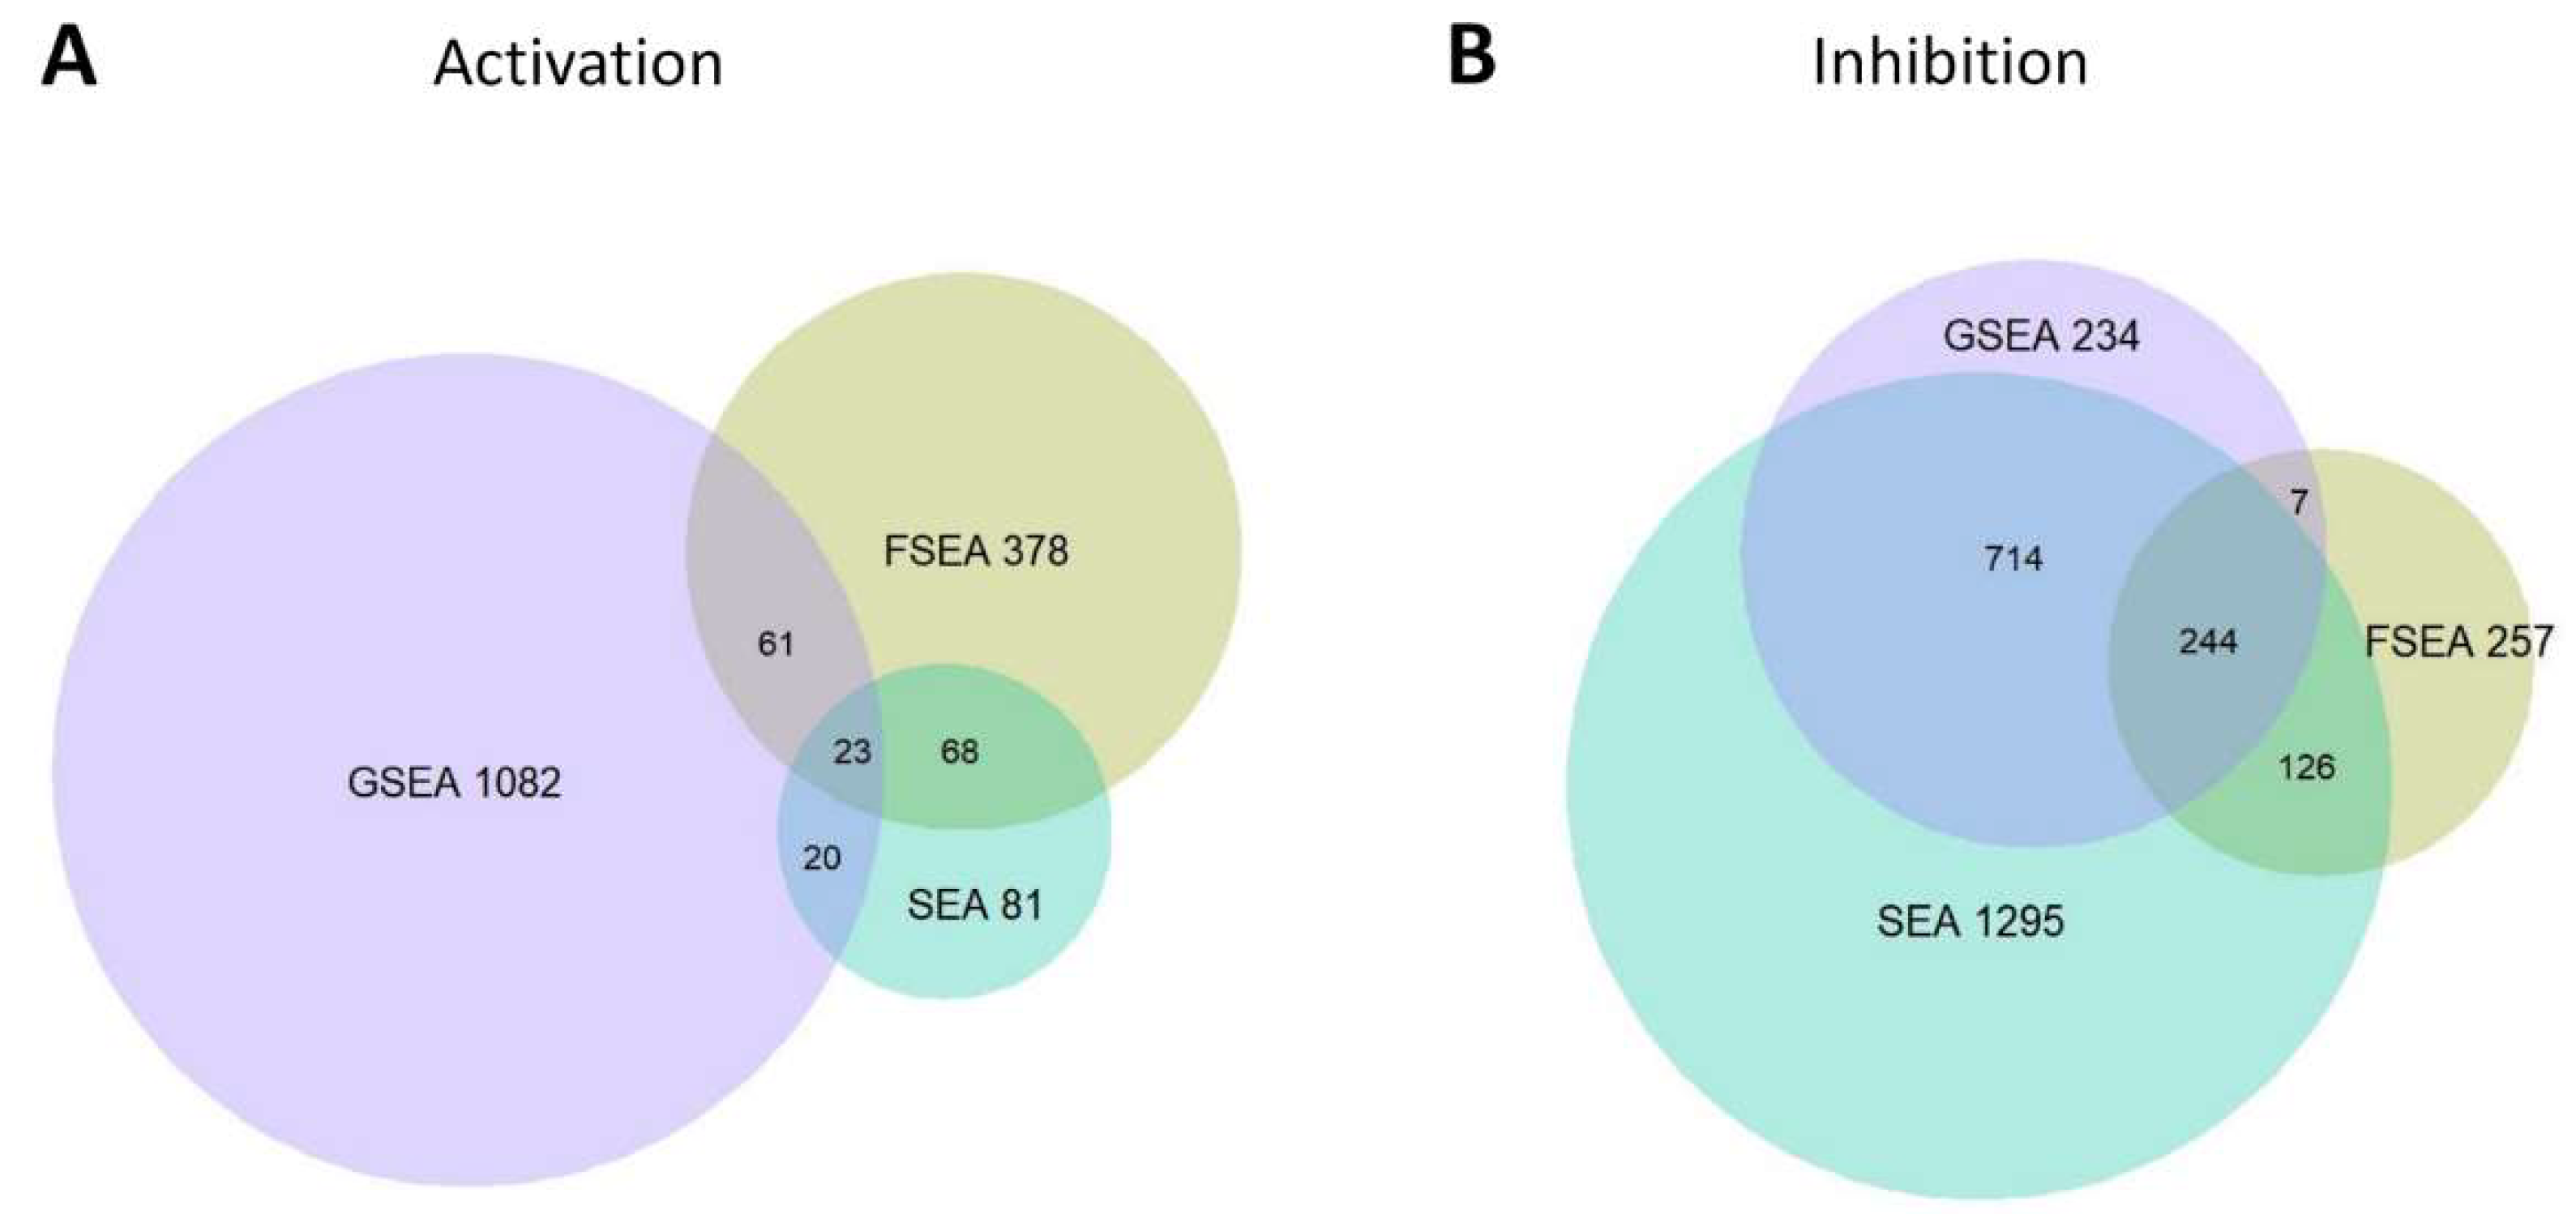
2.4. Comparison of FSEA with GSEA and SEA
3. Results
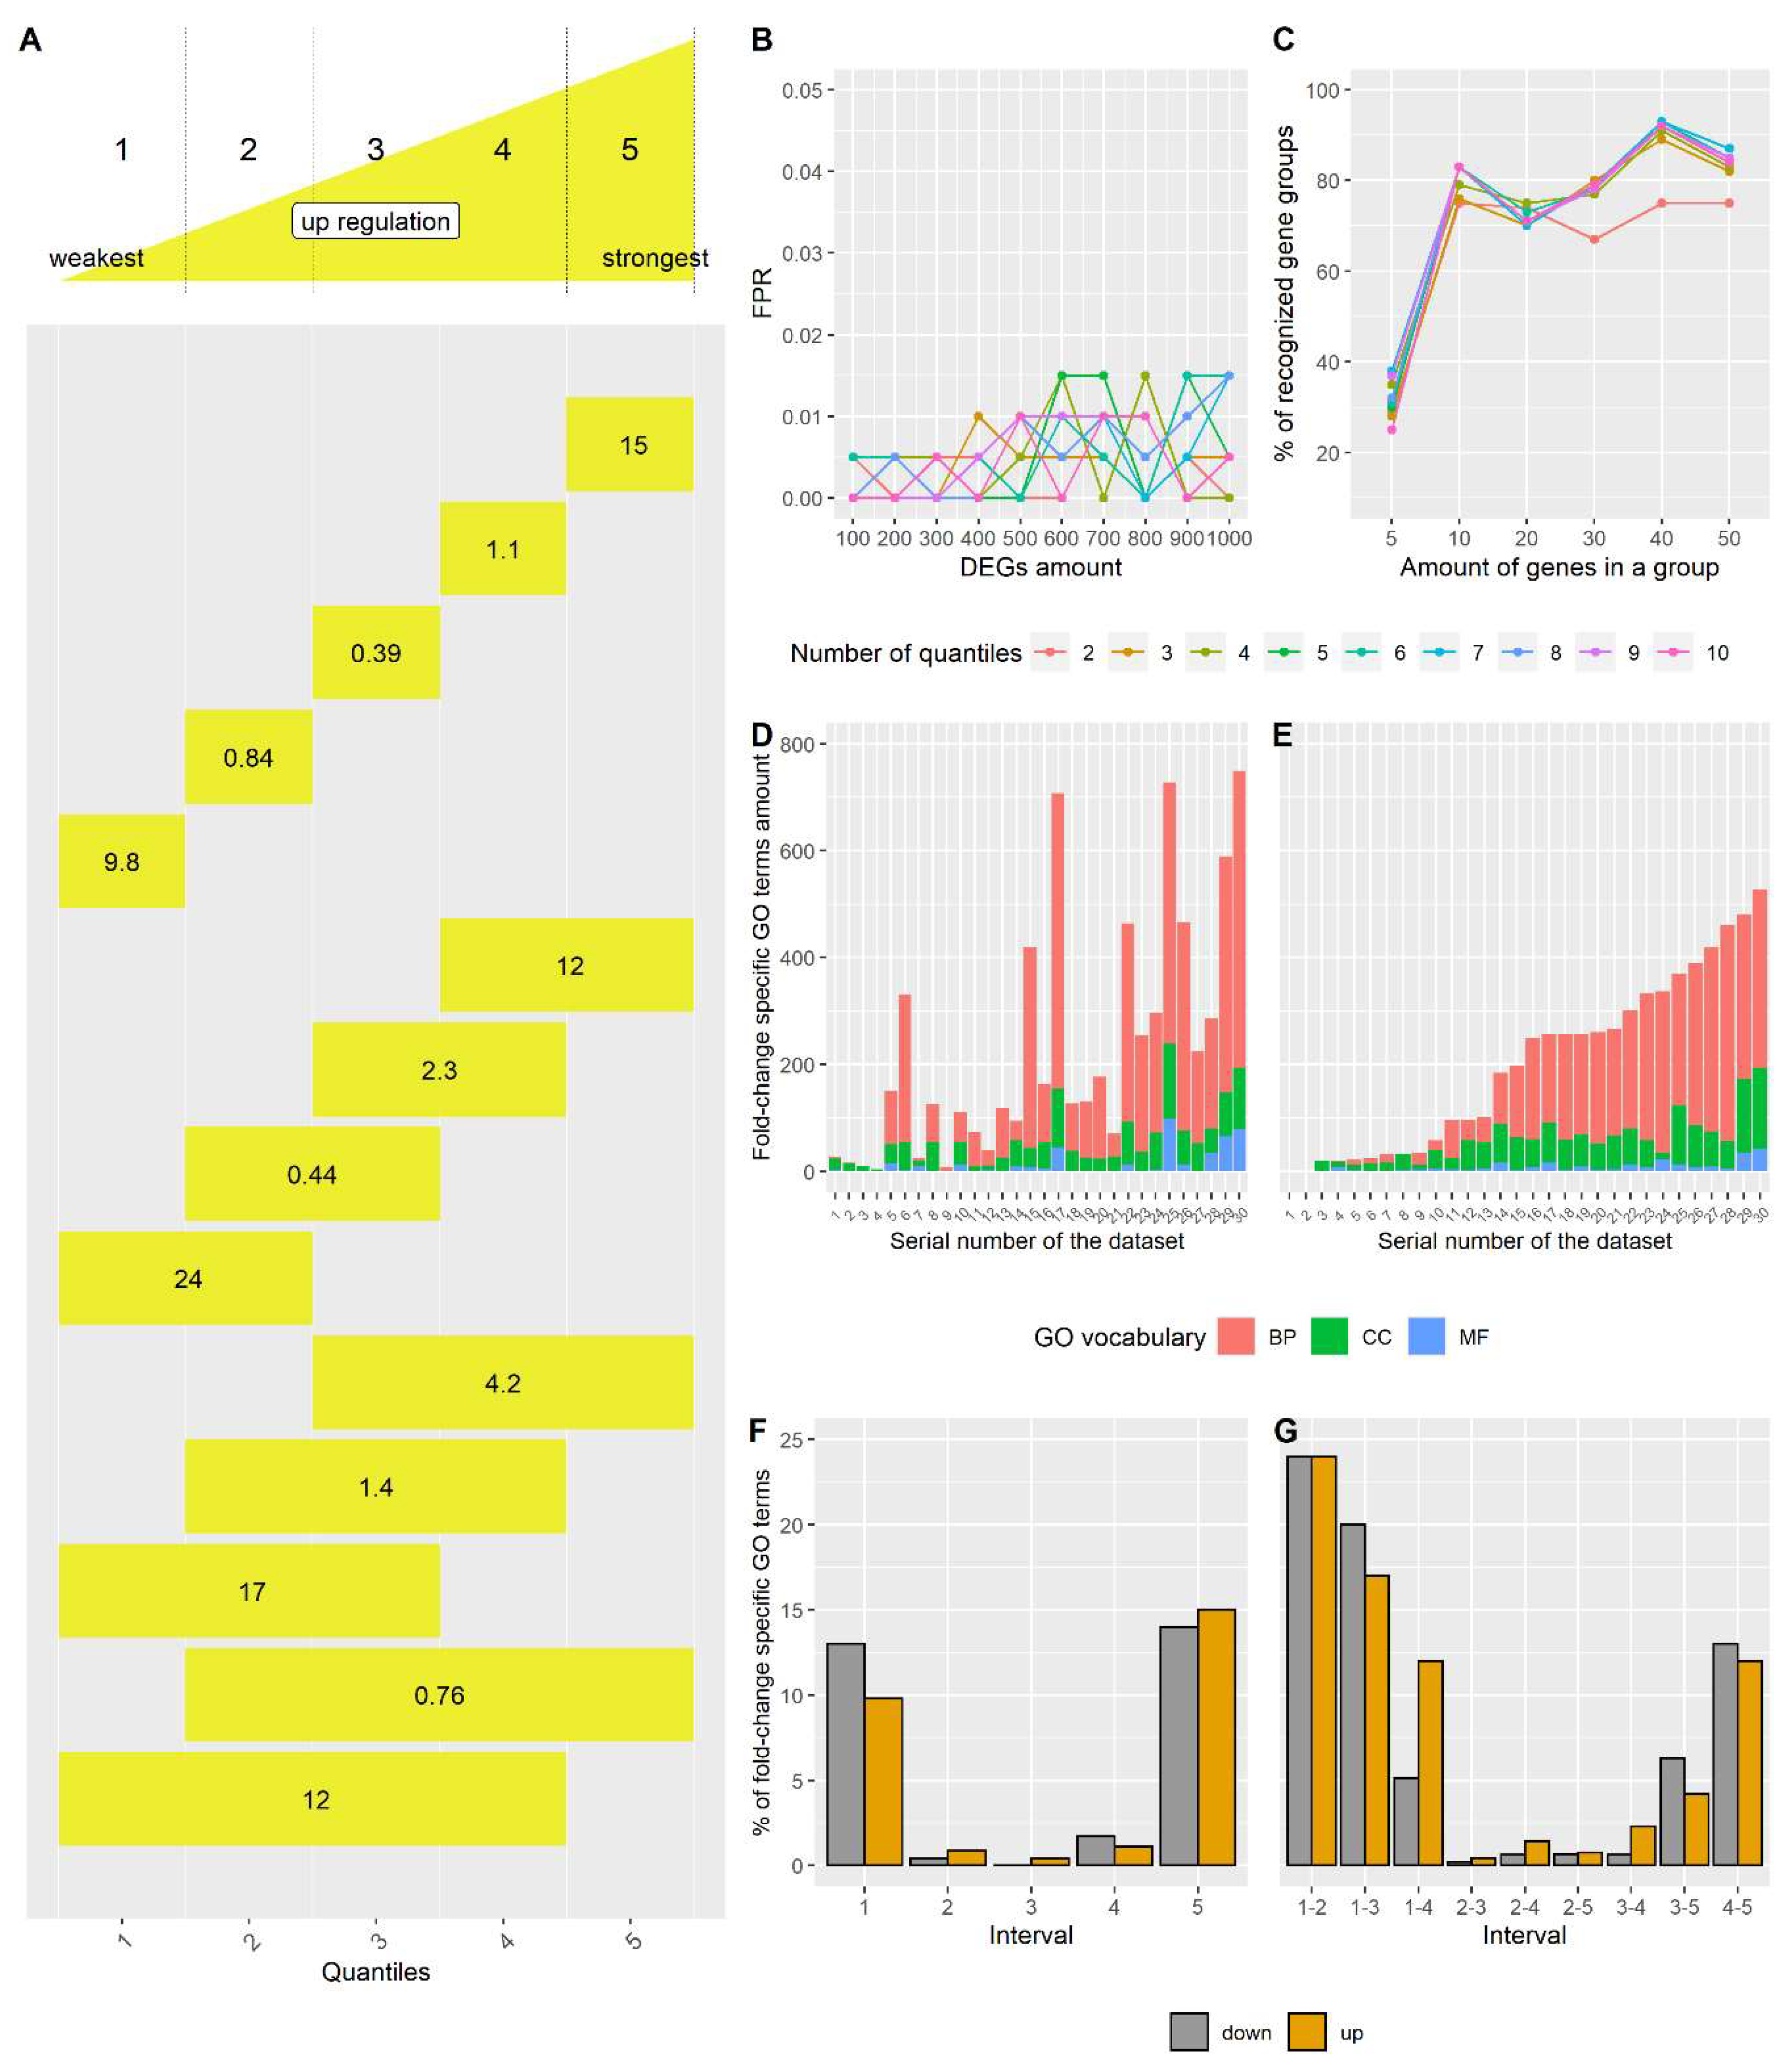
3.1. FSEA Description
3.2. FSEA Validation
3.3. FSEA Performance on a Cancer-Related Dataset
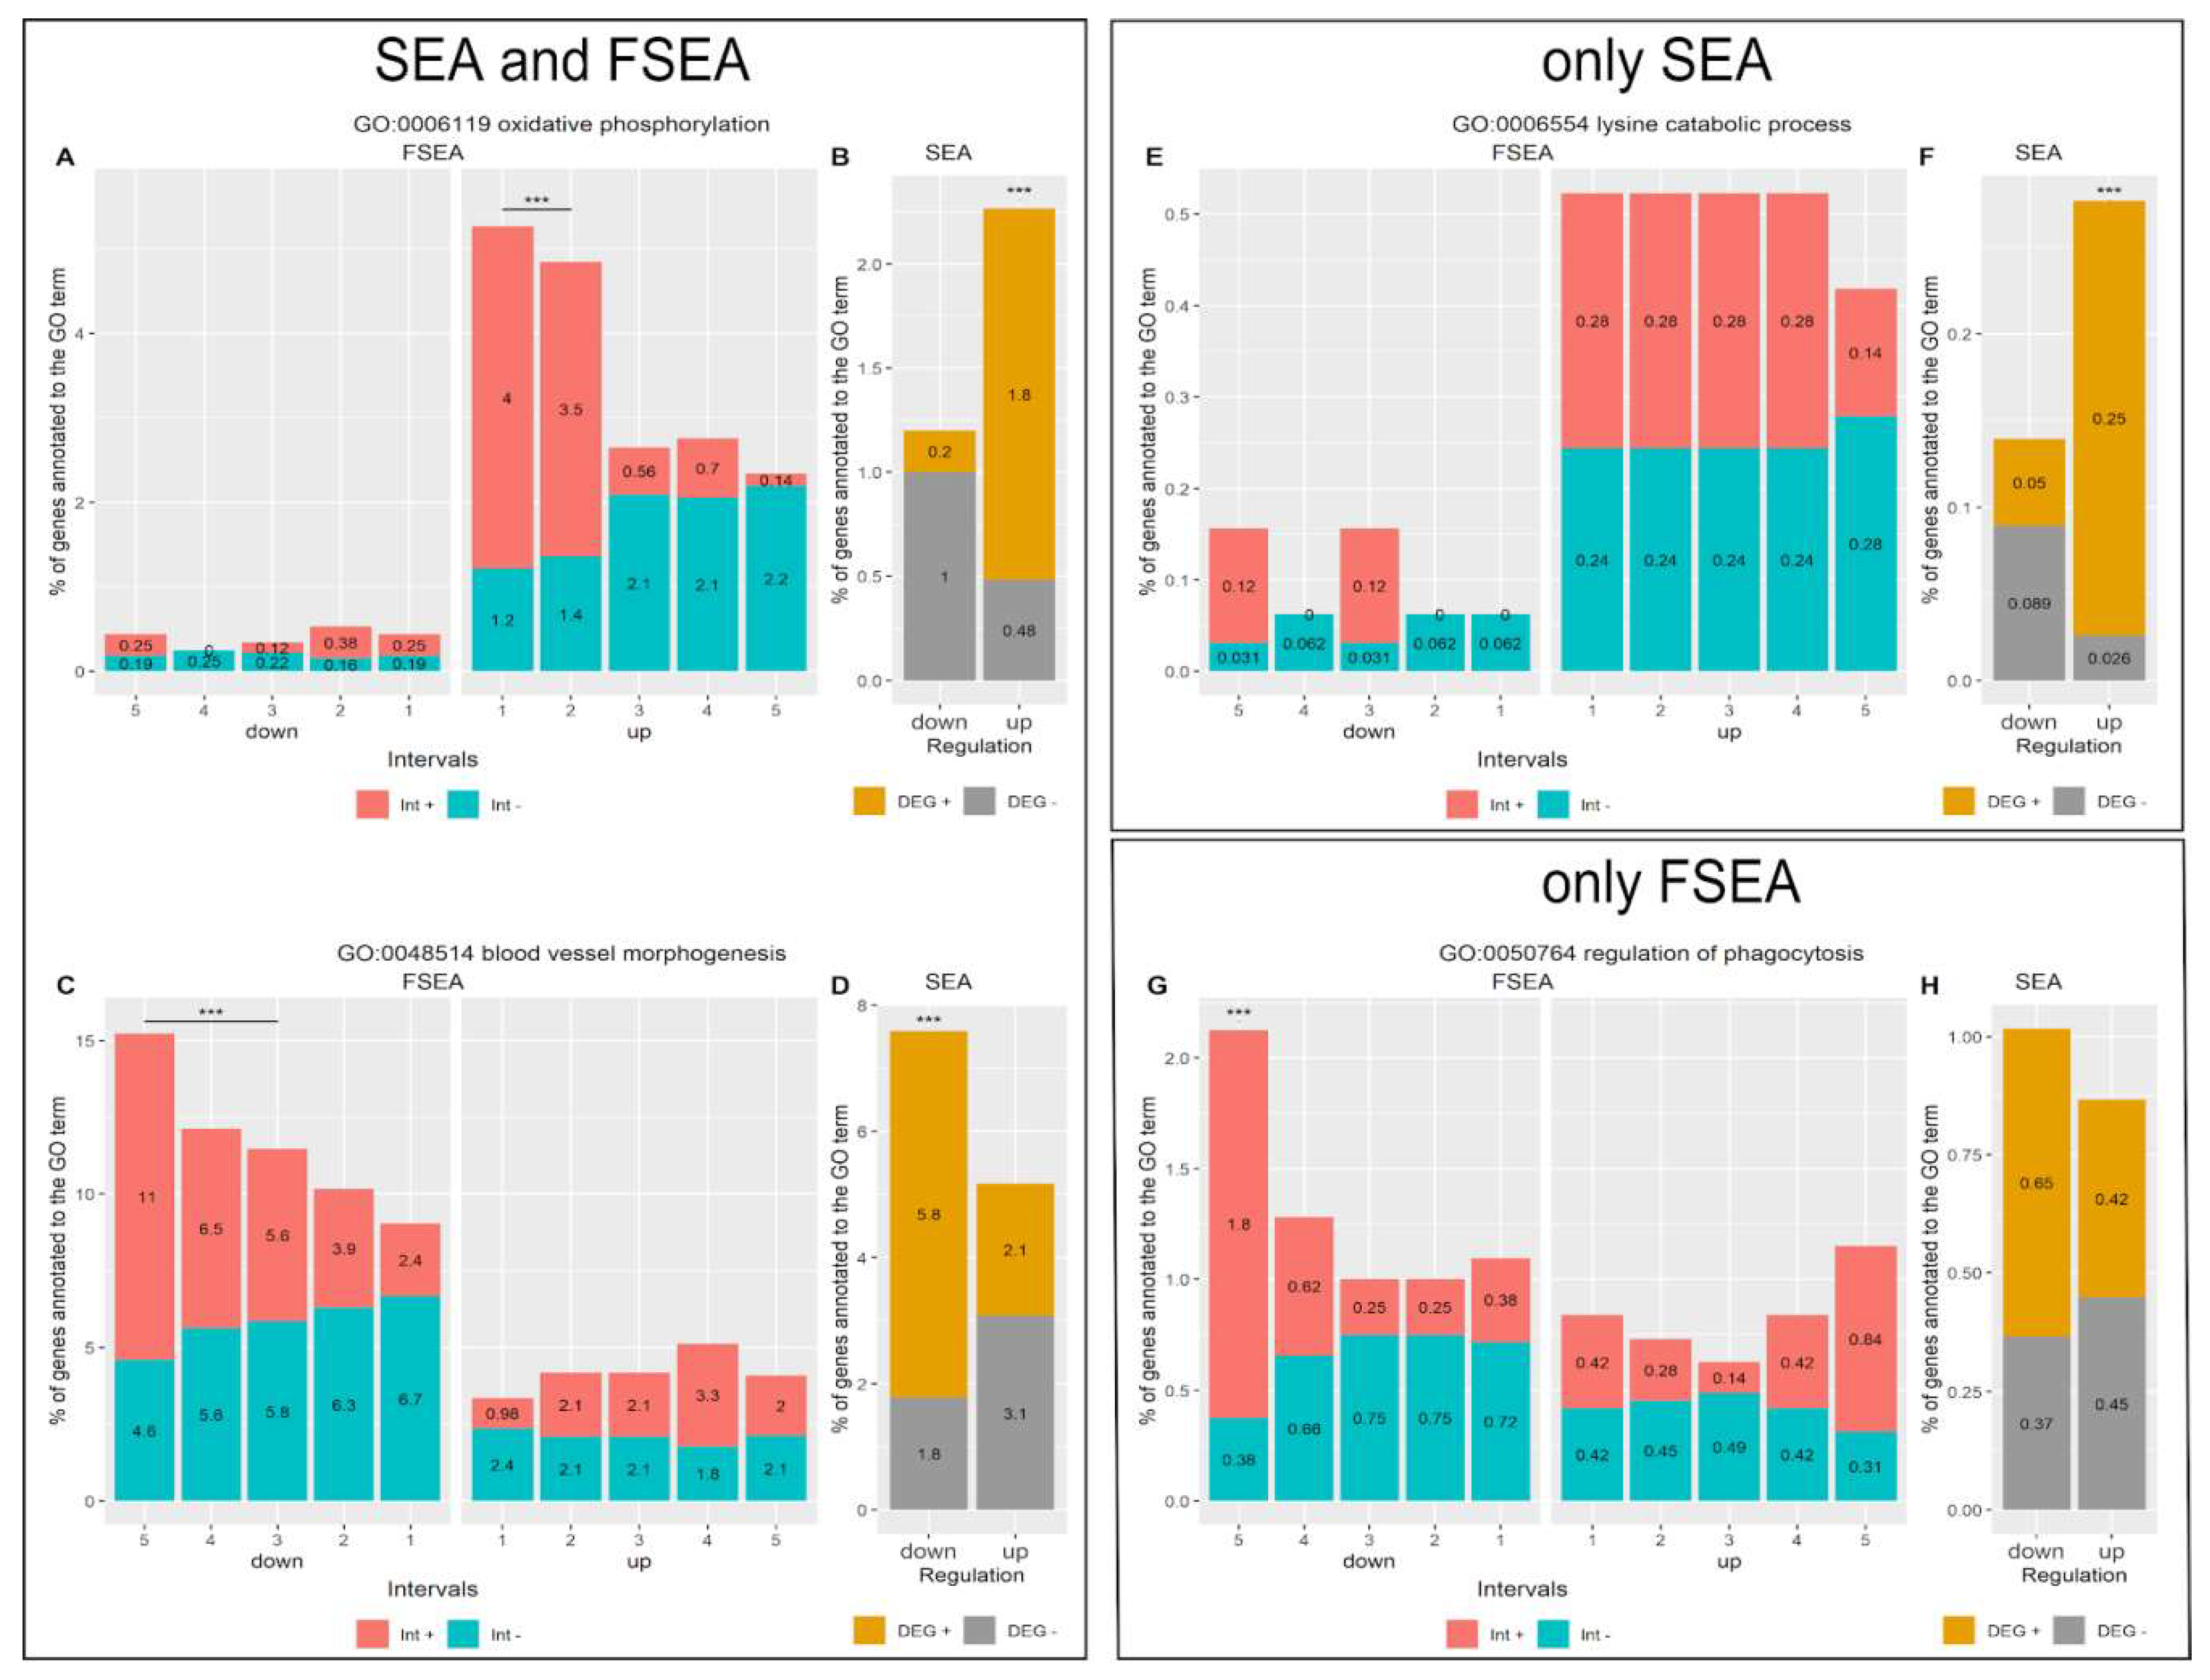
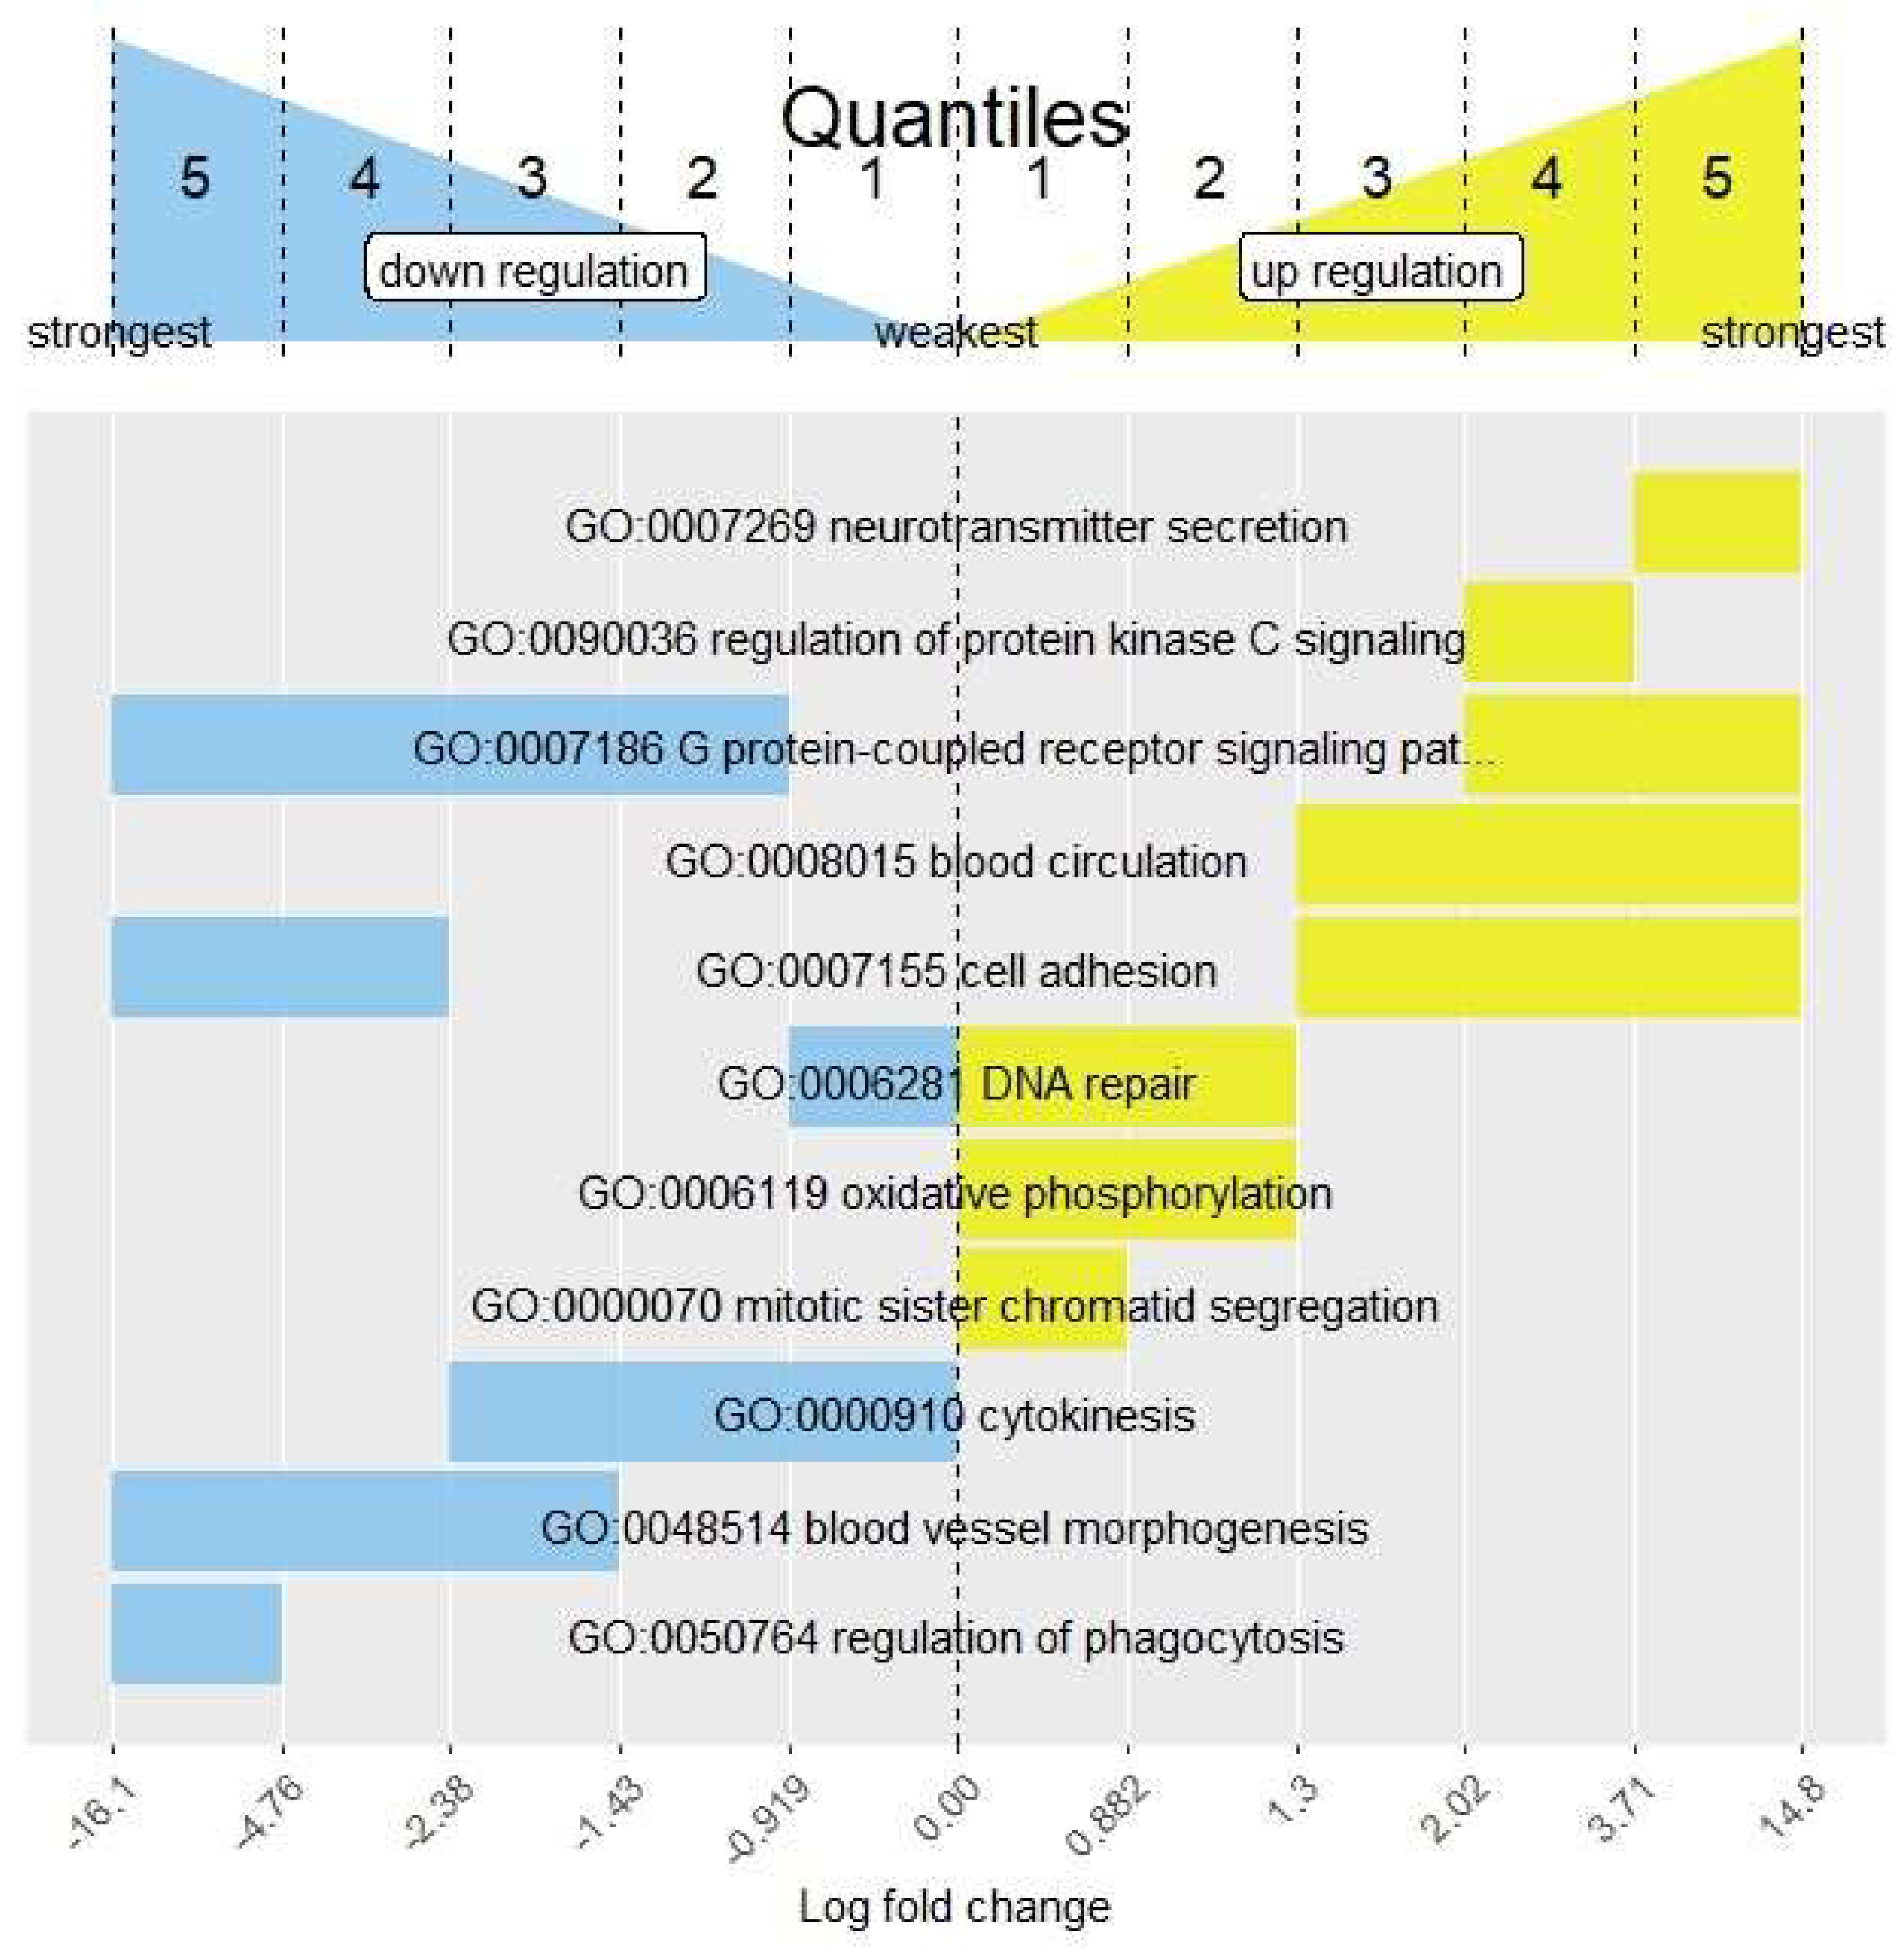
3.3.1. FSEA and SEA: FSEA gives an Additional Dimension to SEA Results
3.3.2. Functional Groups Detected by SEA but Not FSEA: Non-Coordinated Response
3.3.3. Only FSEA: A Quantized Response Invisible for Classical Enrichment Analysis Methods
4. Discussion
5. Conclusions
Supplementary Materials
Author Contributions
Funding
Conflicts of Interest
References
- Ashburner, M.; Ball, C.A.; Blake, J.A.; Botstein, D.; Butler, H.; Cherry, J.M.; Davis, A.P.; Dolinski, K.; Dwight, S.S.; Eppig, J.T.; et al. Gene Ontology: Tool for the Unification of Biology. Nat. Genet. 2000, 25, 25–29. [Google Scholar] [CrossRef] [PubMed]
- Huang, D.W.; Sherman, B.T.; Lempicki, R.A. Bioinformatics Enrichment Tools: Paths toward the Comprehensive Functional Analysis of Large Gene Lists. Nucleic Acids Res. 2009, 37, 1–13. [Google Scholar] [CrossRef] [PubMed]
- Subramanian, A.; Tamayo, P.; Mootha, V.K.; Mukherjee, S.; Ebert, B.L.; Gillette, M.A.; Paulovich, A.; Pomeroy, S.L.; Golub, T.R.; Lander, E.S.; et al. Gene Set Enrichment Analysis: A Knowledge-Based Approach for Interpreting Genome-Wide Expression Profiles. Proc. Natl. Acad. Sci. USA 2005, 102, 15545–15550. [Google Scholar] [CrossRef] [PubMed]
- Shi Jing, L.; Fathiah Muzaffar Shah, F.; Saberi Mohamad, M.; Moorthy, K.; Deris, S.; Zakaria, Z.; Napis, S. A Review on Bioinformatics Enrichment Analysis Tools Towards Functional Analysis of High Throughput Gene Set Data. Curr. Proteomics 2015, 12, 14–27. [Google Scholar] [CrossRef]
- Omelyanchuk, N.A.; Wiebe, D.S.; Novikova, D.D.; Levitsky, V.G.; Klimova, N.; Gorelova, V.; Weinholdt, C.; Vasiliev, G.V.; Zemlyanskaya, E.V.; Kolchanov, N.A.; et al. Auxin Regulates Functional Gene Groups in a Fold-Change-Specific Manner in Arabidopsis Thaliana Roots. Sci. Rep. 2017, 7, 2489. [Google Scholar] [CrossRef] [PubMed]
- Sharma, E.; Jain, M.; Khurana, J.P. Differential Quantitative Regulation of Specific Gene Groups and Pathways under Drought Stress in Rice. Genomics 2019, 111, 1699–1712. [Google Scholar] [CrossRef]
- Laurent, G.S.; Shtokalo, D.; Tackett, M.R.; Yang, Z.; Vyatkin, Y.; Milos, P.M.; Seilheimer, B.; McCaffrey, T.A.; Kapranov, P. On the Importance of Small Changes in RNA Expression. Methods 2013, 63, 18–24. [Google Scholar] [CrossRef]
- Clough, E.; Barrett, T. The Gene Expression Omnibus Database. In Statistical Genomics; Mathé, E., Davis, S., Eds.; Springer: New York, NY, USA, 2016; Volume 1418, pp. 93–110. [Google Scholar] [CrossRef]
- Dobin, A.; Davis, C.A.; Schlesinger, F.; Drenkow, J.; Zaleski, C.; Jha, S.; Batut, P.; Chaisson, M.; Gingeras, T.R. STAR: Ultrafast Universal RNA-Seq Aligner. Bioinformatics 2013, 29, 15–21. [Google Scholar] [CrossRef]
- Liao, Y.; Smyth, G.K.; Shi, W. The R Package Rsubread Is Easier, Faster, Cheaper and Better for Alignment and Quantification of RNA Sequencing Reads. Nucleic Acids Res. 2019, 47, e47. [Google Scholar] [CrossRef]
- Robinson, M.D.; McCarthy, D.J.; Smyth, G.K. EdgeR: A Bioconductor Package for Differential Expression Analysis of Digital Gene Expression Data. Bioinformatics 2010, 26, 139–140. [Google Scholar] [CrossRef]
- Repana, D.; Nulsen, J.; Dressler, L.; Bortolomeazzi, M.; Venkata, S.K.; Tourna, A.; Yakovleva, A.; Palmieri, T.; Ciccarelli, F.D. The Network of Cancer Genes (NCG): A Comprehensive Catalogue of Known and Candidate Cancer Genes from Cancer Sequencing Screens. Genome Biol. 2019, 20, 1. [Google Scholar] [CrossRef] [PubMed]
- Wiebe, D. FoldGO: Package for Fold-Specific GO Terms Recognition; R Package Version 1.4.0; Bioconductor, 2019. [Google Scholar] [CrossRef]
- Korotkevich, G.; Sukhov, V.; Sergushichev, A. Fast Gene Set Enrichment Analysis. bioRxiv 2016. [Google Scholar] [CrossRef]
- Alexa, A.; Rahnenfuhrer, J. TopGO: Enrichment Analysis for Gene Ontology; R Package Version 2.38.1; Bioconductor, 2019. [Google Scholar] [CrossRef]
- Carlson, M. Org.Hs.Eg.Db: Genome Wide Annotation for Human; R Package Version 3.8.2; Bioconductor, 2019. [Google Scholar] [CrossRef]
- Cottard, F.; Madi-Berthélémy, P.O.; Erdmann, E.; Schaff-Wendling, F.; Keime, C.; Ye, T.; Kurtz, J.-E.; Céraline, J. Dual Effects of Constitutively Active Androgen Receptor and Full-Length Androgen Receptor for N-Cadherin Regulation in Prostate Cancer. Oncotarget 2017, 8. [Google Scholar] [CrossRef]
- Giannoni, E.; Taddei, M.L.; Morandi, A.; Comito, G.; Calvani, M.; Bianchini, F.; Richichi, B.; Raugei, G.; Wong, N.; Tang, D.; et al. Targeting Stromal-Induced Pyruvate Kinase M2 Nuclear Translocation Impairs Oxphos and Prostate Cancer Metastatic Spread. Oncotarget 2015, 6. [Google Scholar] [CrossRef]
- Yeh, C.-H.; Bellon, M.; Nicot, C. FBXW7: A Critical Tumor Suppressor of Human Cancers. Mol. Cancer 2018, 17, 115. [Google Scholar] [CrossRef]
- Liu, Z.; Ding, Y.; Ye, N.; Wild, C.; Chen, H.; Zhou, J. Direct Activation of Bax Protein for Cancer Therapy: Direct Activation of Bax for Cancer Therapy. Med. Res. Rev. 2016, 36, 313–341. [Google Scholar] [CrossRef]
- Guo, B.; Cao, S.; Tóth, K.; Azrak, R.G.; Rustum, Y.M. Overexpression of Bax Enhances Antitumor Activity of Chemotherapeutic Agents in Human Head and Neck Squamous Cell Carcinoma. Clin. Cancer Res. Off. J. Am. Assoc. Cancer Res. 2000, 6, 718–724. [Google Scholar]
- Forster, J.; Harriss-Phillips, W.; Douglass, M.; Bezak, E. A Review of the Development of Tumor Vasculature and Its Effects on the Tumor Microenvironment. Hypoxia 2017, 5, 21–32. [Google Scholar] [CrossRef]
- Ren, S.; Shao, Y.; Zhao, X.; Hong, C.S.; Wang, F.; Lu, X.; Li, J.; Ye, G.; Yan, M.; Zhuang, Z.; et al. Integration of Metabolomics and Transcriptomics Reveals Major Metabolic Pathways and Potential Biomarker Involved in Prostate Cancer. Mol. Cell. Proteom. 2016, 15, 154–163. [Google Scholar] [CrossRef]
- Thapa, M.; Dallmann, G. Role of Coenzymes in Cancer Metabolism. Semin. Cell & Dev. Biol. 2020, 98, 44–53. [Google Scholar] [CrossRef]
- Schcolnik-Cabrera, A.; Oldak, B.; Juárez, M.; Cruz-Rivera, M.; Flisser, A.; Mendlovic, F. Calreticulin in Phagocytosis and Cancer: Opposite Roles in Immune Response Outcomes. Apoptosis 2019, 24, 245–255. [Google Scholar] [CrossRef]
- Kissick, H.T.; On, S.T.; Dunn, L.K.; Sanda, M.G.; Asara, J.M.; Pellegrini, K.L.; Noel, J.K.; Arredouani, M.S. The Transcription Factor ERG Increases Expression of Neurotransmitter Receptors on Prostate Cancer Cells. BMC Cancer 2015, 15, 604. [Google Scholar] [CrossRef]
- Sorlie, T.; Perou, C.M.; Tibshirani, R.; Aas, T.; Geisler, S.; Johnsen, H.; Hastie, T.; Eisen, M.B.; van de Rijn, M.; Jeffrey, S.S.; et al. Gene Expression Patterns of Breast Carcinomas Distinguish Tumor Subclasses with Clinical Implications. Proc. Natl. Acad. Sci. USA 2001, 98, 10869–10874. [Google Scholar] [CrossRef]
- Sørlie, T. The Impact of Gene Expression Patterns in Breast Cancer. Clin. Chem. 2016, 62, 1150–1151. [Google Scholar] [CrossRef][Green Version]
- Pallai, R.; Bhaskar, A.; Barnett-Bernodat, N.; Gallo-Ebert, C.; Nickels, J.T.; Rice, L.M. Cancerous Inhibitor of Protein Phosphatase 2A Promotes Premature Chromosome Segregation and Aneuploidy in Prostate Cancer Cells through Association with Shugoshin. Tumor Biol. 2015, 36, 6067–6074. [Google Scholar] [CrossRef]
- Cornford, P.; Evans, J.; Dodson, A.; Parsons, K.; Woolfenden, A.; Neoptolemos, J.; Foster, C.S. Protein Kinase C Isoenzyme Patterns Characteristically Modulated in Early Prostate Cancer. Am. J. Pathol. 1999, 154, 137–144. [Google Scholar] [CrossRef]
- Tanaka, Y.; Gavrielides, M.V.; Mitsuuchi, Y.; Fujii, T.; Kazanietz, M.G. Protein Kinase C Promotes Apoptosis in LNCaP Prostate Cancer Cells through Activation of P38 MAPK and Inhibition of the Akt Survival Pathway. J. Biol. Chem. 2003, 278, 33753–33762. [Google Scholar] [CrossRef]
- Kanehisa, M.; Furumichi, M.; Tanabe, M.; Sato, Y.; Morishima, K. KEGG: New Perspectives on Genomes, Pathways, Diseases and Drugs. Nucleic Acids Res. 2017, 45, D353–D361. [Google Scholar] [CrossRef]
- Oughtred, R.; Stark, C.; Breitkreutz, B.-J.; Rust, J.; Boucher, L.; Chang, C.; Kolas, N.; O’Donnell, L.; Leung, G.; McAdam, R.; et al. The BioGRID Interaction Database: 2019 Update. Nucleic Acids Res. 2019, 47, D529–D541. [Google Scholar] [CrossRef]
- Mitchell, A.L.; Attwood, T.K.; Babbitt, P.C.; Blum, M.; Bork, P.; Bridge, A.; Brown, S.D.; Chang, H.-Y.; El-Gebali, S.; Fraser, M.I.; et al. InterPro in 2019: Improving Coverage, Classification and Access to Protein Sequence Annotations. Nucleic Acids Res. 2019, 47, D351–D360. [Google Scholar] [CrossRef]


| Qr + | Qr − | Total | |
|---|---|---|---|
| GOi + | A | B | A + B |
| GOi− | C | D | C + D |
| Total | A + C | B + D | N |
© 2020 by the authors. Licensee MDPI, Basel, Switzerland. This article is an open access article distributed under the terms and conditions of the Creative Commons Attribution (CC BY) license (http://creativecommons.org/licenses/by/4.0/).
Share and Cite
Wiebe, D.S.; Omelyanchuk, N.A.; Mukhin, A.M.; Grosse, I.; Lashin, S.A.; Zemlyanskaya, E.V.; Mironova, V.V. Fold-Change-Specific Enrichment Analysis (FSEA): Quantification of Transcriptional Response Magnitude for Functional Gene Groups. Genes 2020, 11, 434. https://doi.org/10.3390/genes11040434
Wiebe DS, Omelyanchuk NA, Mukhin AM, Grosse I, Lashin SA, Zemlyanskaya EV, Mironova VV. Fold-Change-Specific Enrichment Analysis (FSEA): Quantification of Transcriptional Response Magnitude for Functional Gene Groups. Genes. 2020; 11(4):434. https://doi.org/10.3390/genes11040434
Chicago/Turabian StyleWiebe, Daniil S., Nadezhda A. Omelyanchuk, Aleksei M. Mukhin, Ivo Grosse, Sergey A. Lashin, Elena V. Zemlyanskaya, and Victoria V. Mironova. 2020. "Fold-Change-Specific Enrichment Analysis (FSEA): Quantification of Transcriptional Response Magnitude for Functional Gene Groups" Genes 11, no. 4: 434. https://doi.org/10.3390/genes11040434
APA StyleWiebe, D. S., Omelyanchuk, N. A., Mukhin, A. M., Grosse, I., Lashin, S. A., Zemlyanskaya, E. V., & Mironova, V. V. (2020). Fold-Change-Specific Enrichment Analysis (FSEA): Quantification of Transcriptional Response Magnitude for Functional Gene Groups. Genes, 11(4), 434. https://doi.org/10.3390/genes11040434