Study of Quantitative Trait Loci (QTLs) Associated with Allelopathic Trait in Rice

 , , , ,
Abstract
:1. Introduction
2. Materials and Methods
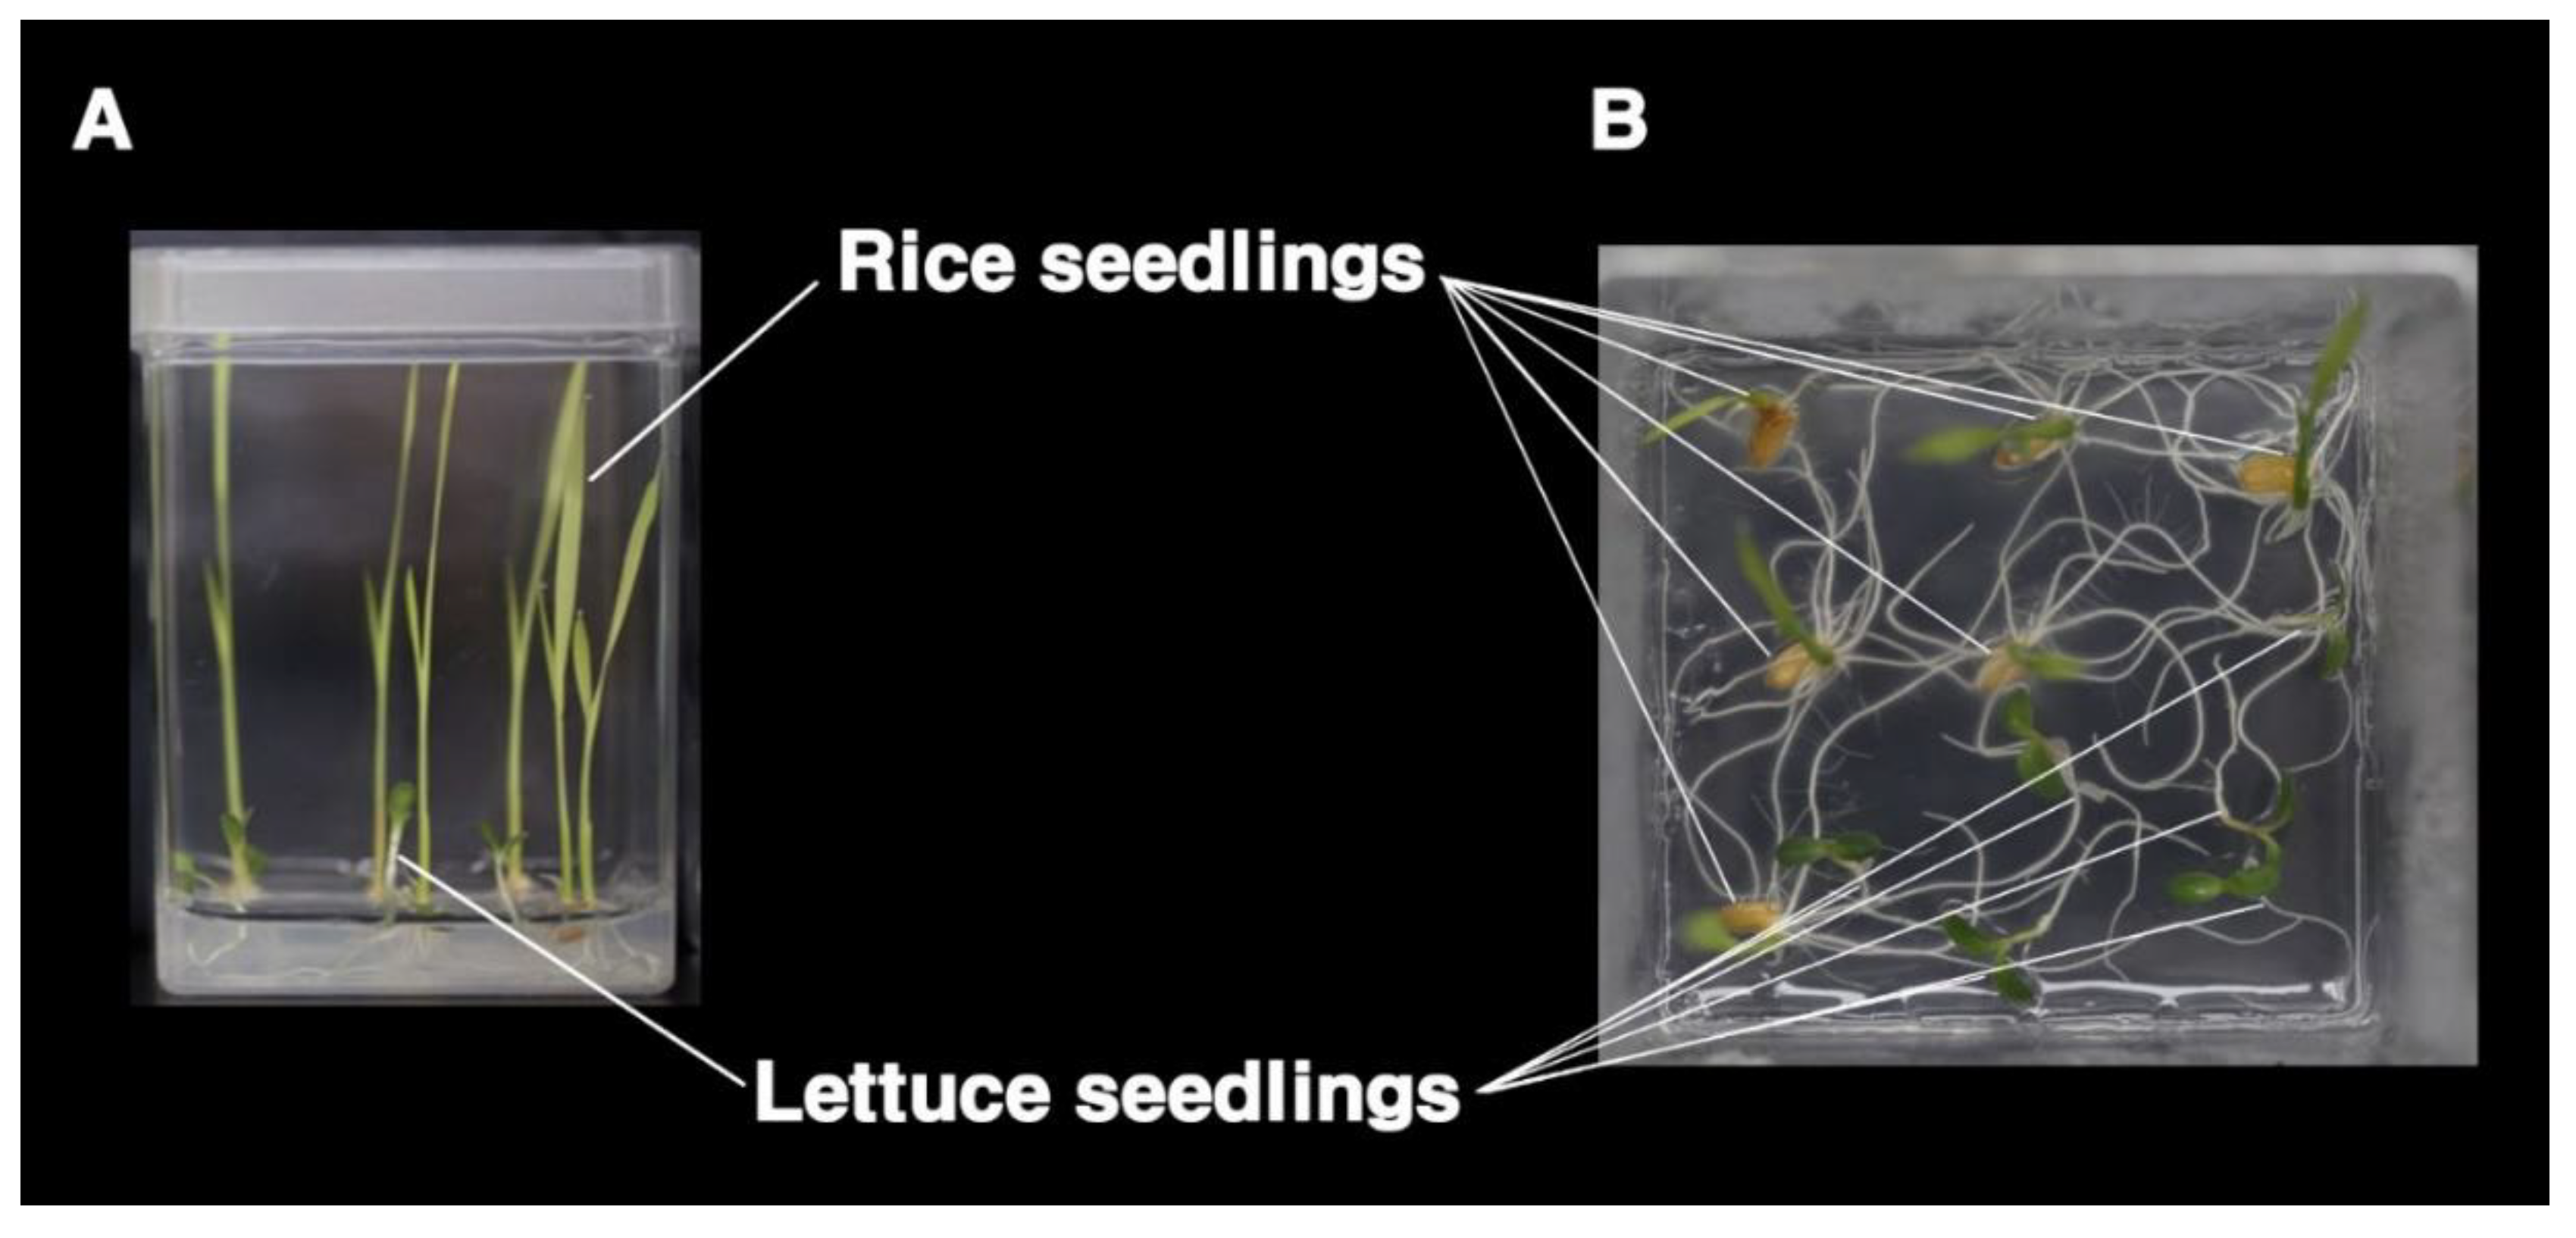
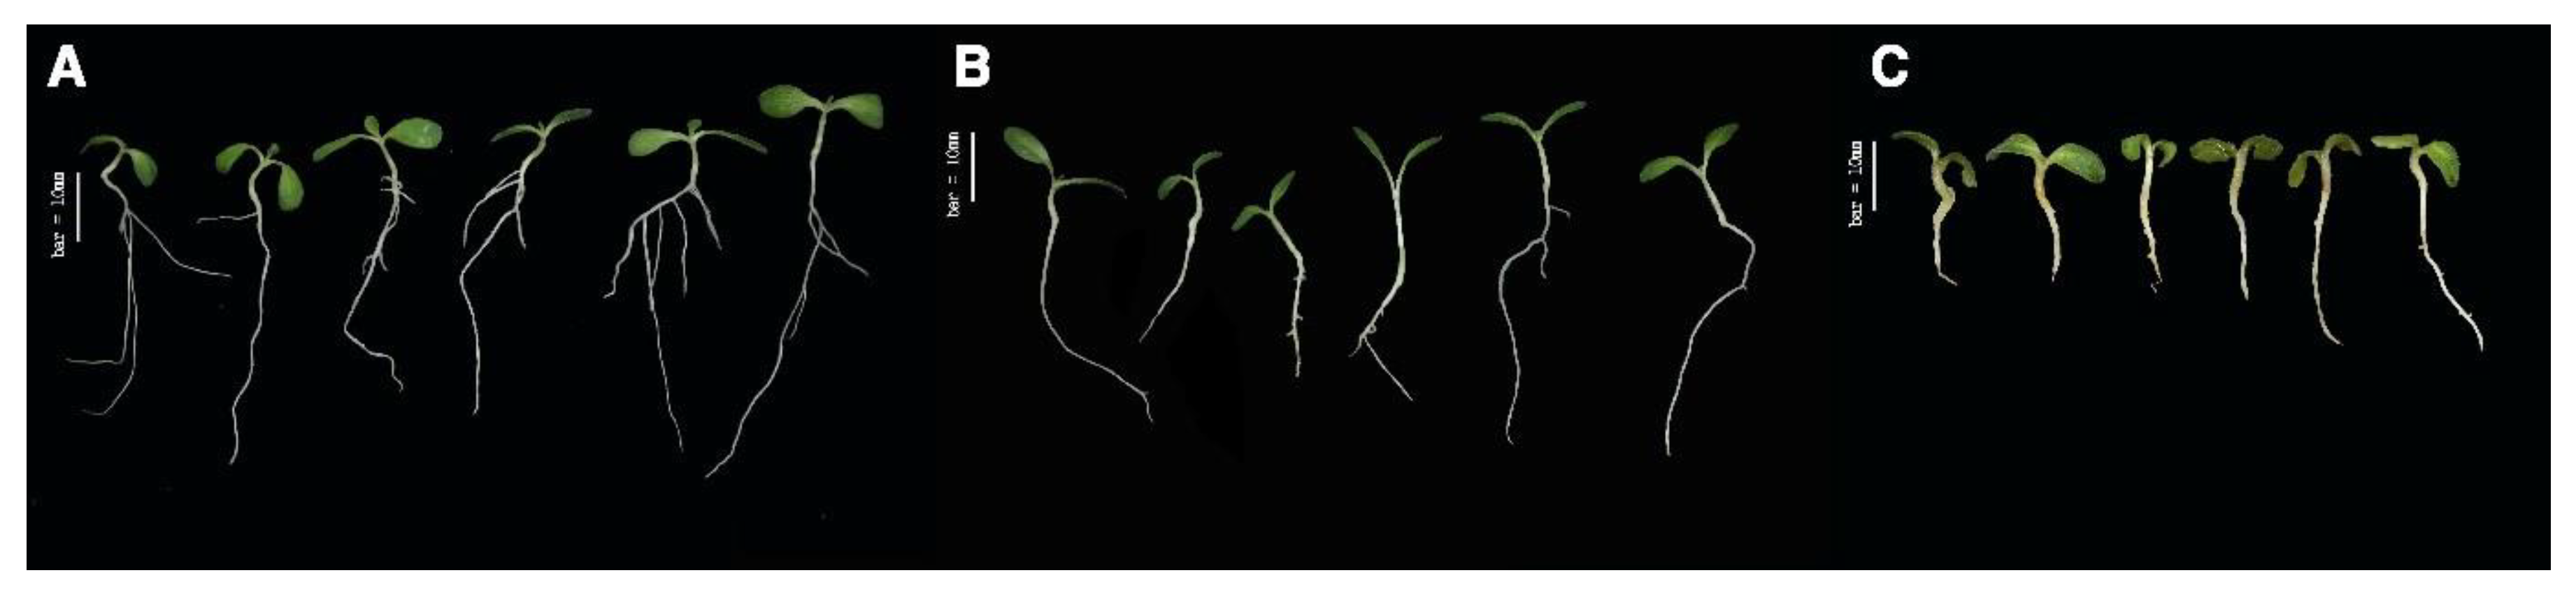
2.1. Allelopathic Assay
2.2. Rice DNA Extraction and High-Throughput SNP Genotyping
2.3. QTL Analysis
3. Results
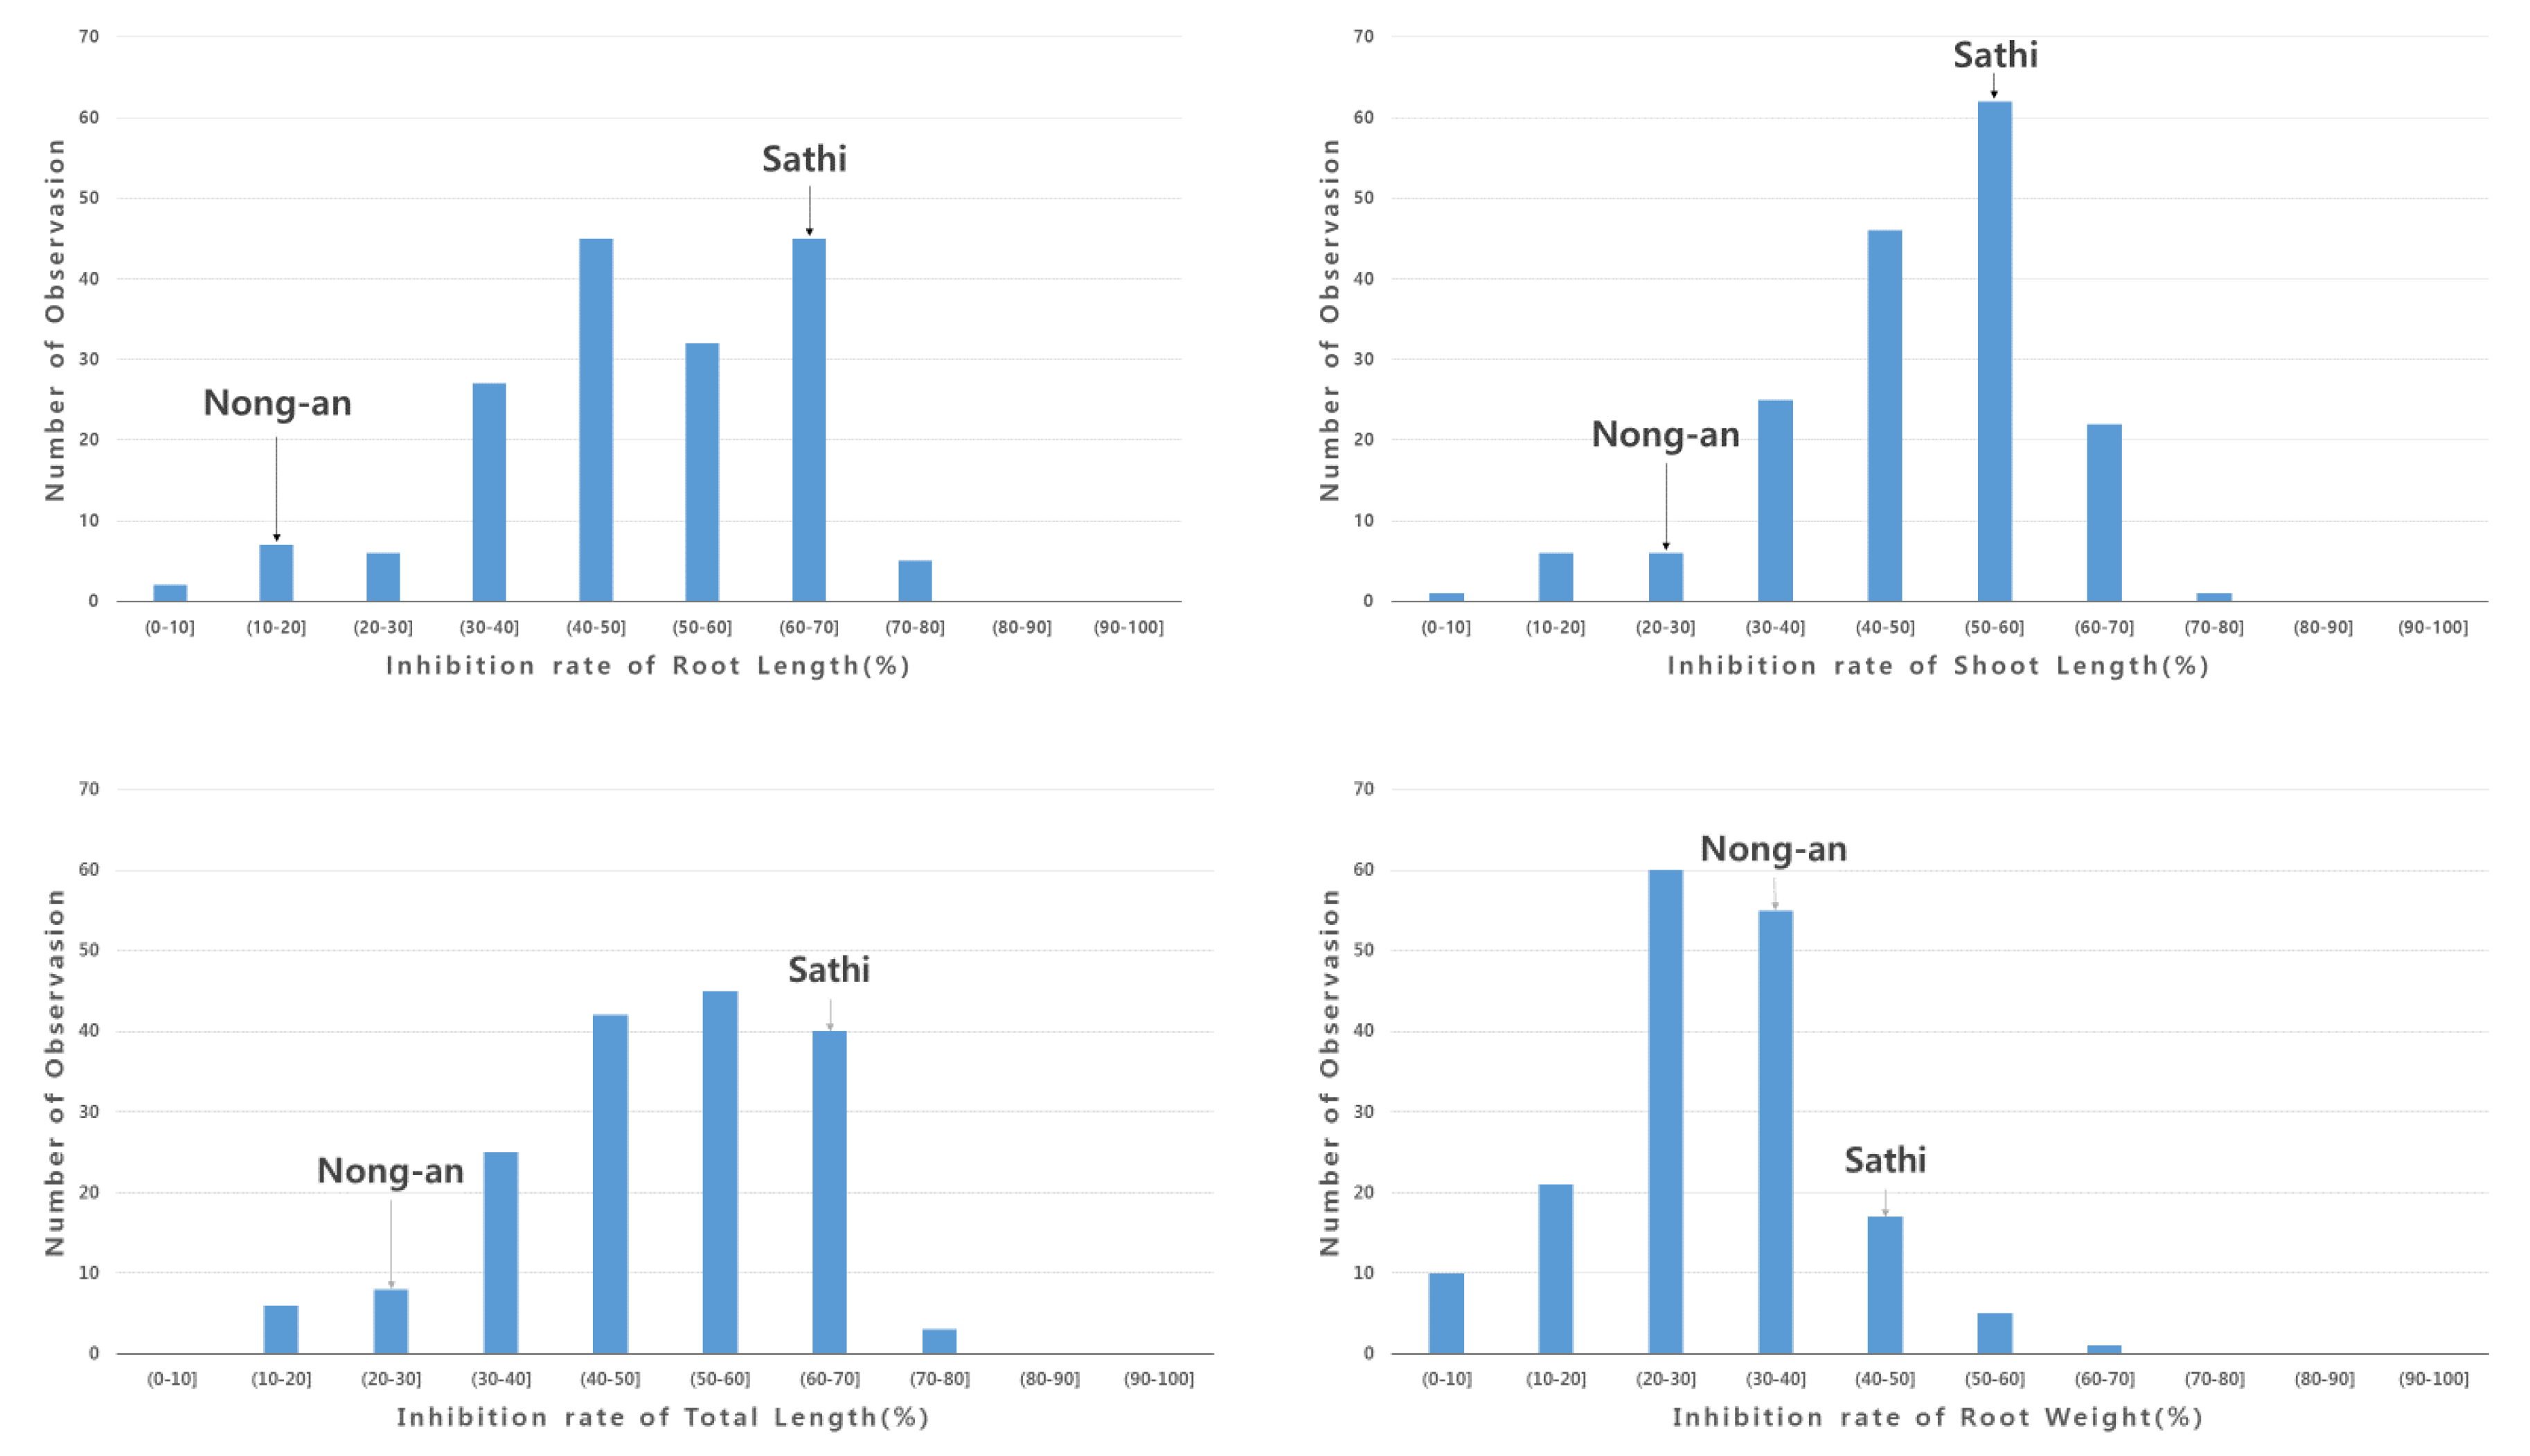
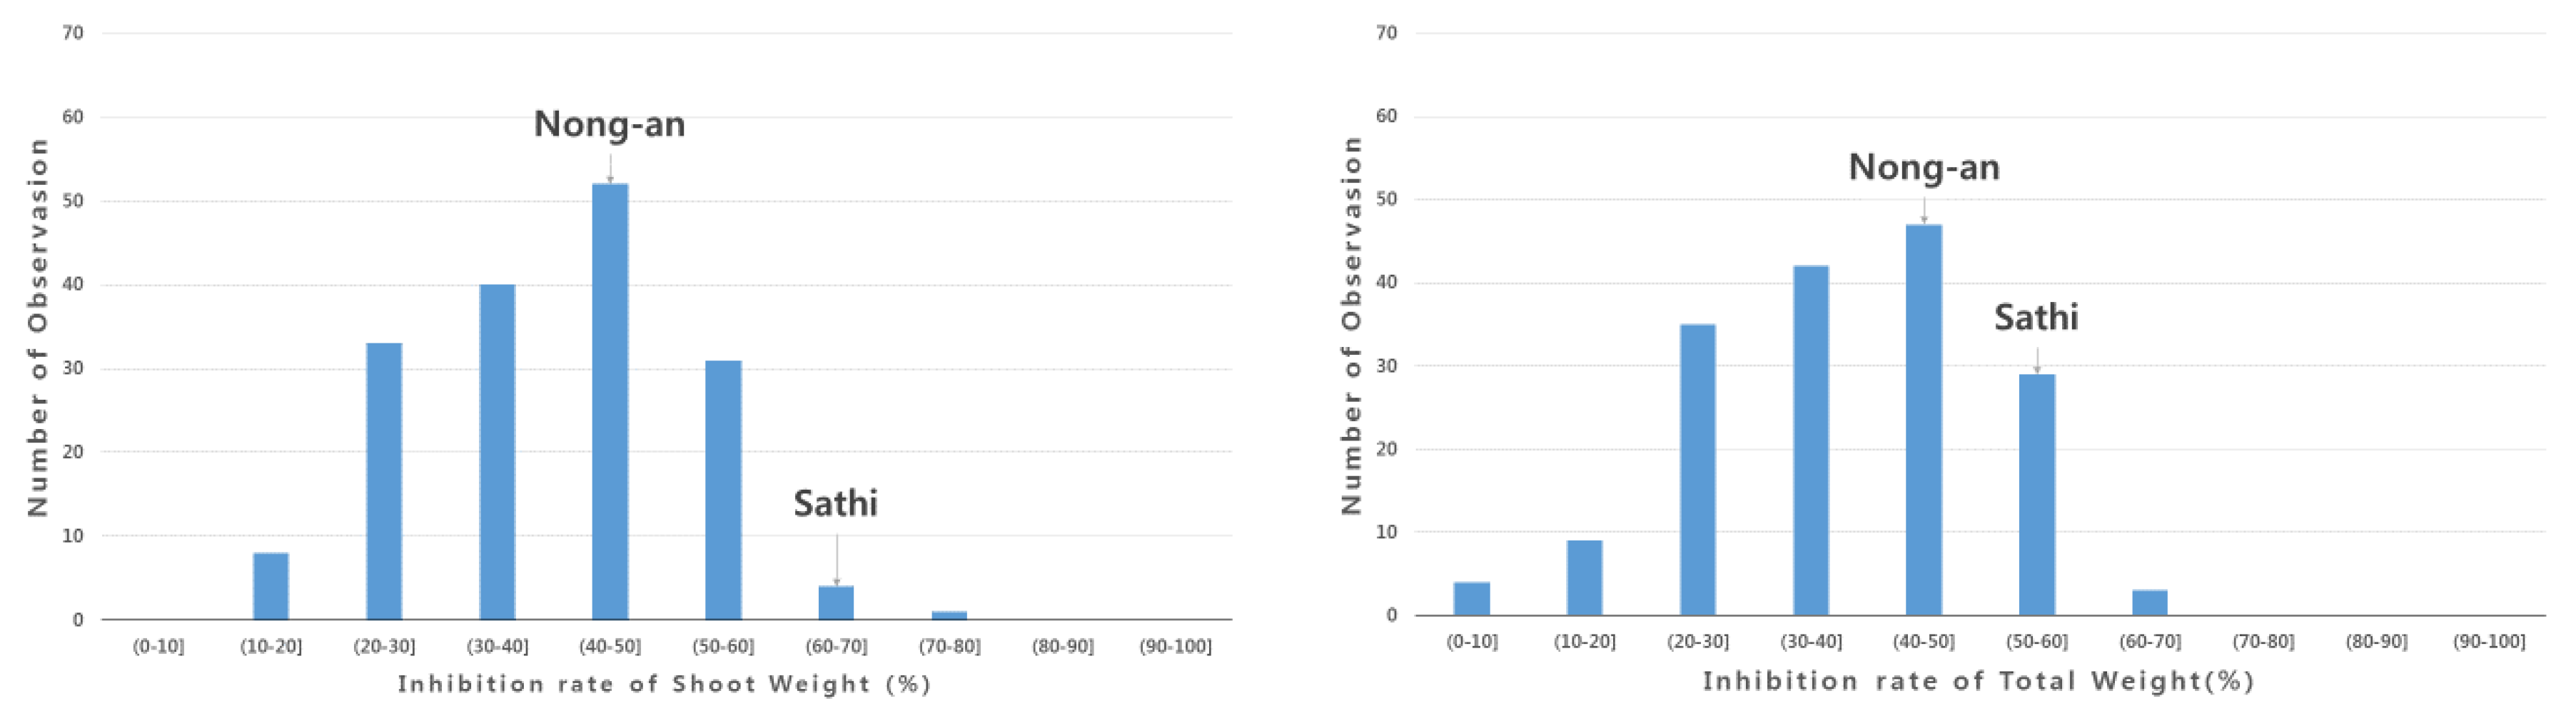
3.1. Screening of Allelopathy in Rice
3.2. High-Throughput SNP Genotyping and QTL Analysis
4. Discussion
Supplementary Materials
Author Contributions
Funding
Acknowledgments
Conflicts of Interest
Availability of Data and Materials
References
- Mamun, A. Weeds and their control: A review of weed research in Bangladesh. Agricultural and Rural Development in Bangladesh. Japan Intl. Co-operation Agency, Dhaka, Bangladesh. JSARD 1990, 19, 45–72. [Google Scholar]
- Asaduzzaman, M.; Islam, M.M.; Sultana, S. Allelopathy and allelochemicals in rice weed management. Bangladesh Res. Publ. 2010, 4, 1–14. [Google Scholar]
- Khanh, T. Role of allelochemicals for weed management in rice. Allelopathy J. 2007, 19, 85–95. [Google Scholar]
- Khanh, T.; Xuan, T.; Chung, I. Rice allelopathy and the possibility for weed management. Ann. Appl. Boil. 2007, 151, 325–339. [Google Scholar] [CrossRef]
- Rimando, A.M.; Olofsdotter, M.; Dayan, F.E.; Duke, S.O. Searching for Rice Allelochemicals. Agron. J. 2001, 93, 16–20. [Google Scholar] [CrossRef]
- Li, Z.-H.; Wang, Q.; Ruan, X.; Pan, C.-D.; De-An, J. Phenolics and Plant Allelopathy. Molecules 2010, 15, 8933–8952. [Google Scholar] [CrossRef] [PubMed] [Green Version]
- Wu, H.; Pratley, J.; Lemerle, D.; Haig, T.; An, M. Screening methods for the evaluation of crop allelopathic potential. Bot. Rev. 2001, 67, 403–415. [Google Scholar] [CrossRef]
- Shilling, D.G.; Yoshikawa, F. A Rapid Seedling Bioassay for the Study of Allelopathy. In Chemistry Student Success: A Field-Tested, Evidence-Based Guide; American Chemical Society (ACS): Washington, DC, USA, 1987; Volume 330, pp. 334–342. [Google Scholar]
- Putnam, A.R.; DeFrank, J.; Barnes, J.P. Exploitation of allelopathy for weed control in annual and perennial cropping systems. J. Chem. Ecol. 1983, 9, 1001–1010. [Google Scholar] [CrossRef] [PubMed]
- Jensen, L.B.; Courtois, B.; Olofsdotter, M. Quantitative Trait Loci Analysis of Allelopathy in Rice. Crop Sci. 2008, 48, 1459–1469. [Google Scholar] [CrossRef]
- Ebana, K.; Yan, W.; Dilday, R.H.; Namai, H.; Okuno, K. Analysis of QTL Associated with the Allelopathic Effect of Rice Using Water-soluble Extracts. Breed. Sci. 2001, 51, 47–51. [Google Scholar] [CrossRef] [Green Version]
- Wu, H.; Pratley, J.; Lemerle, D.; Haig, T. Laboratory screening for allelopathic potential of wheat (Triticum aestivum) accessions against annual ryegrass (Lolium rigidum). Aust. J. Agric. Res. 2000, 51, 259. [Google Scholar] [CrossRef]
- Junaedi, A.; Jung, W.S.; Chung, I.M.; Kim, K.H. Differentially expressed genes of potentially allelopathic rice in response against barnyardgrass. J. Crop Sci. Biotech. 2007, 10, 231–236. [Google Scholar]
- Junaedi, A.; Chozin, M.A.; Lontoh, A.P.; Salam, M.D.A.; Lee, S.B.; Kim, K.H.; Kim, E.H.; Chung, I.M. Promising allelopathic rice lines derived from the recombinant inbred lines of Nongan/sathi cross. Allelopathy J. 2012, 30, 177–188. [Google Scholar]
- Murray, M.; Thompson, W.F. Rapid isolation of high molecular weight plant DNA. Nucleic Acids Res. 1980, 8, 4321–4326. [Google Scholar] [CrossRef] [PubMed] [Green Version]
- Kim, K.-W.; Nam, J.; Chu, S.-H.; Phitaktansakul, R.; Yoo, J.-M.; Kang, J.-S.; Min, M.-H.; Cheng, L.; Cao, Y.; Aung, K.M.; et al. Development of KNU Axiom Oryza 580K Genotyping Array. In Proceedings of the KSBS & SABRAO International Conference on Plant Breeding for Sustainable Development, Gwangju, Korea, 2–5 July 2019; PCS02-58. p. 158. [Google Scholar]
- Thermo Fisher Scientific. BRLMM-p: A Genotype Calling Method for the SNP 5.0 Array; Thermo Fisher Scientific: Waltham, MA, USA, 2007. [Google Scholar]
- 3,000 rice genomes project. The 3000 rice genomes project. Gigascience 2014, 3, 7. [Google Scholar] [CrossRef] [Green Version]
- Meng, L.; Li, H.; Zhang, L.; Wang, J. QTL IciMapping: Integrated software for genetic linkage map construction and quantitative trait locus mapping in biparental populations. Crop J. 2015, 3, 269–283. [Google Scholar] [CrossRef] [Green Version]
- Cheng, F.; Hayat, S. Research Progress on the use of Plant Allelopathy in Agriculture and the Physiological and Ecological Mechanisms of Allelopathy. Front. Plant Sci. 2015, 6, 347. [Google Scholar] [CrossRef] [PubMed]


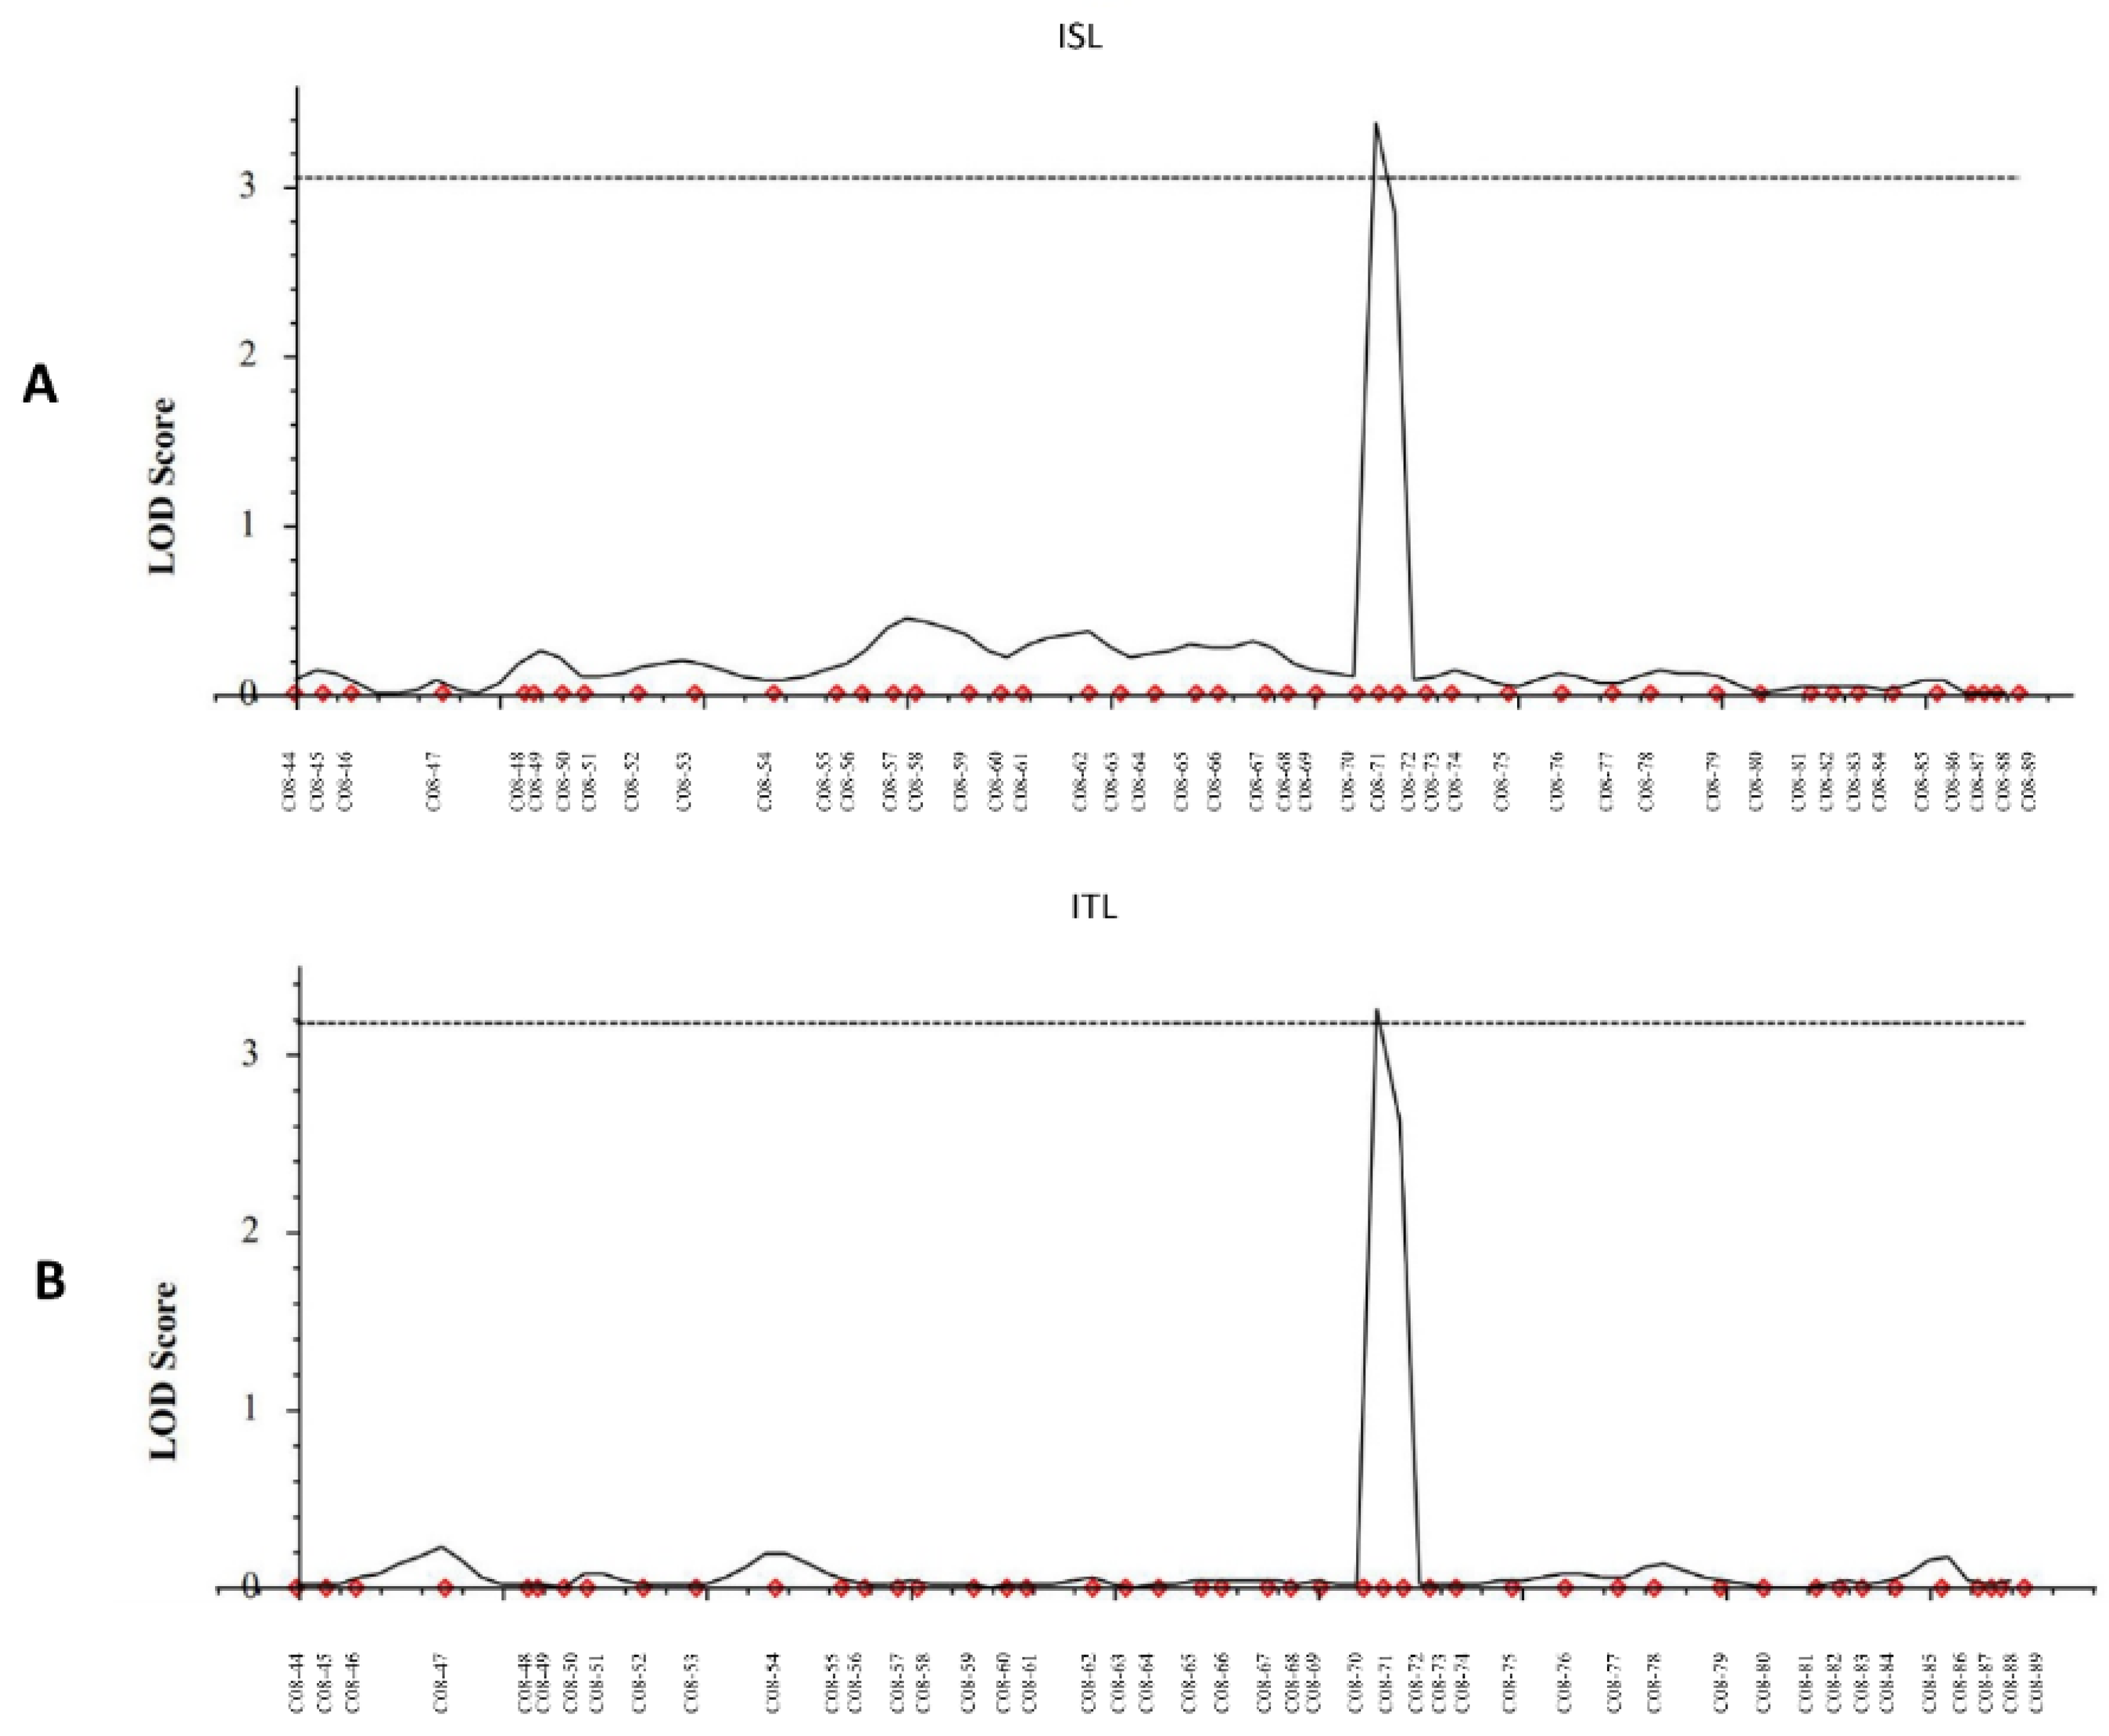
| QTL | Trait | Chromosome | Position (cM) | Left Marker | Right Marker | LOD | PVE (%) | Add | Left CI | Right CI |
|---|---|---|---|---|---|---|---|---|---|---|
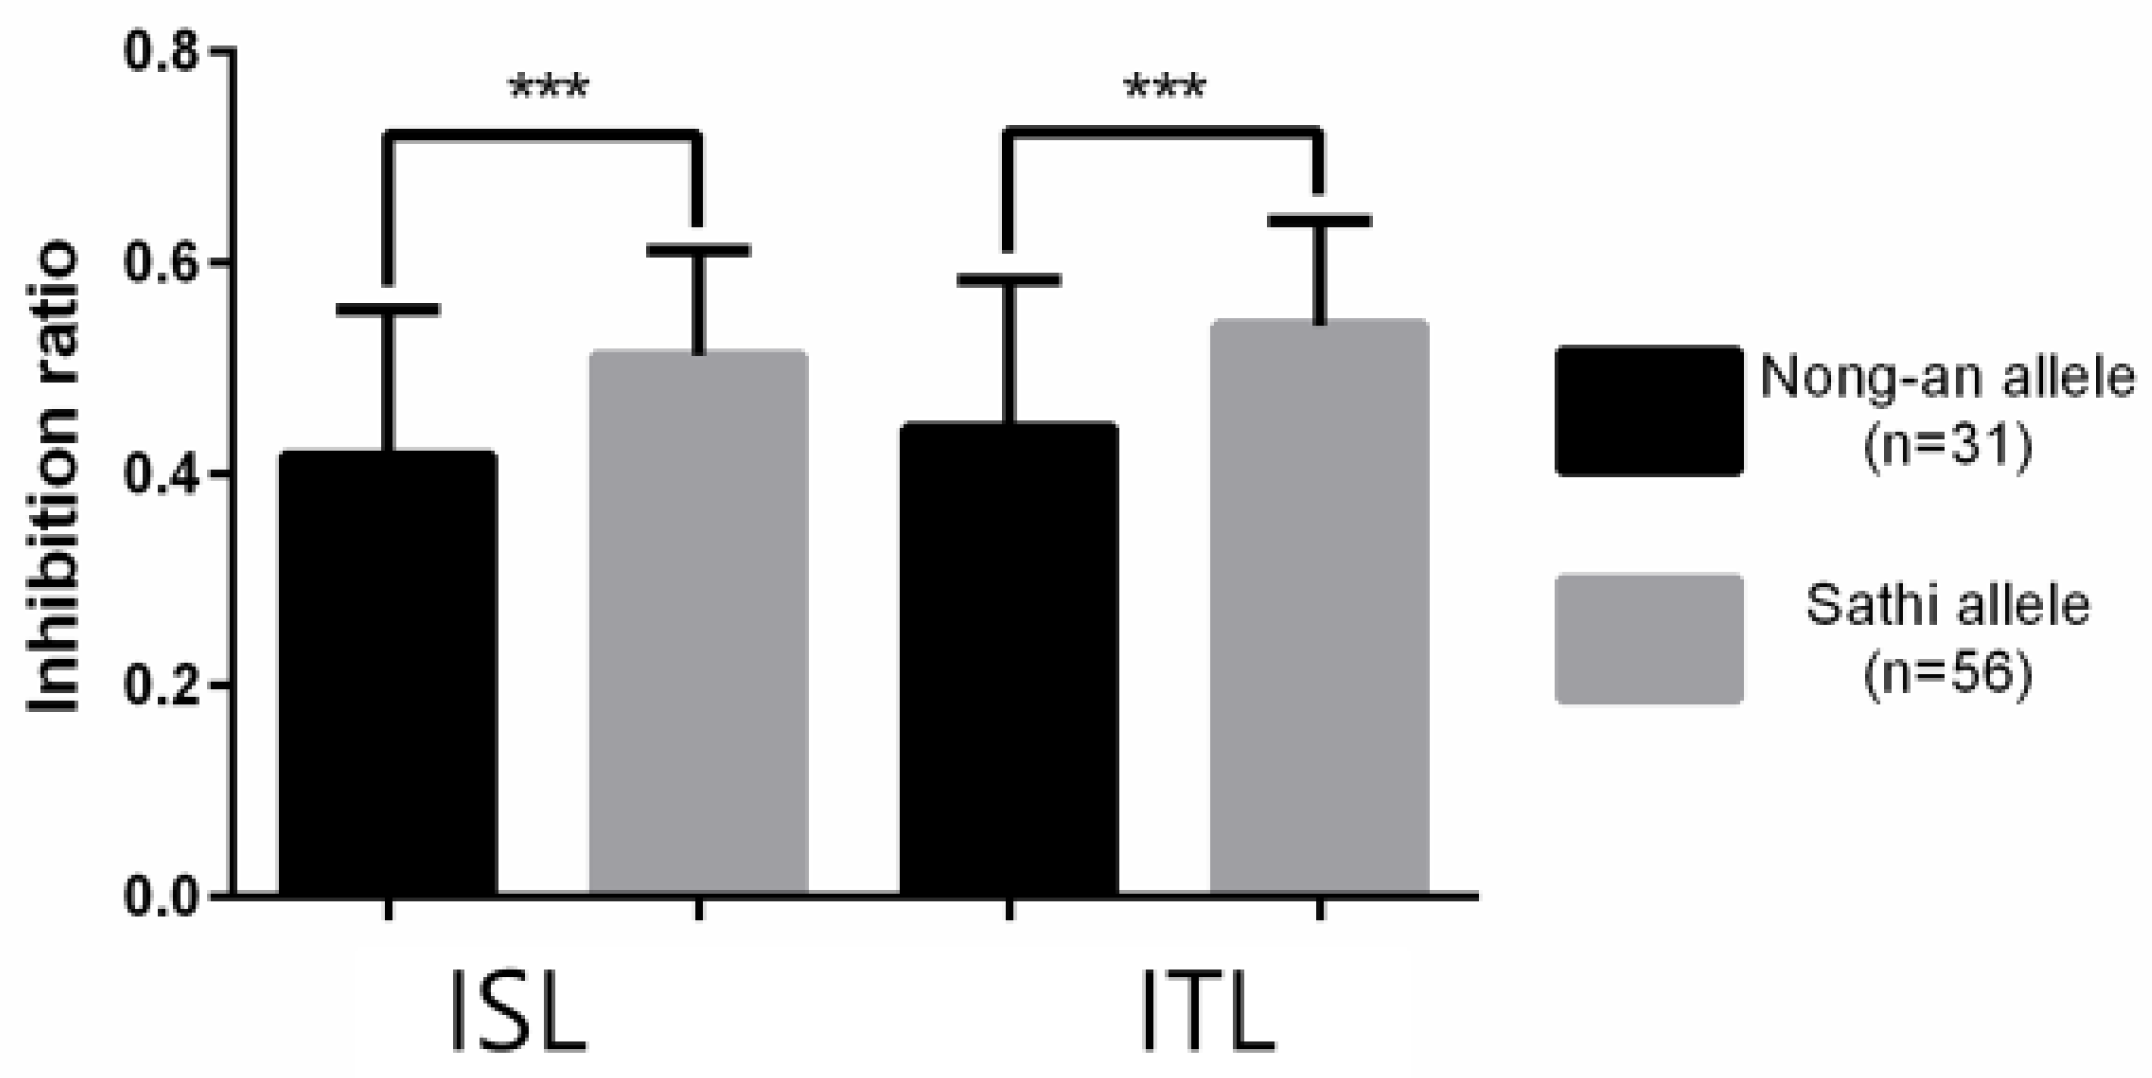
| qISL-8 | ISL | 8 | 177 | C08-70 | C08-71 | 3.3848 | 20.8345 | −5.29 | 176.3 | 177.3 |
| qITL-8 | ITL | 8 | 177 | C08-70 | C08-71 | 3.2409 | 14.9362 | −5.02 | 176.3 | 177.3 |
| Trait | Chr. | Left Marker | Right Marker | Chr. | Left Marker | Right Marker | LOD | PVE (%) | Add1 | Add2 | Add by Add |
|---|---|---|---|---|---|---|---|---|---|---|---|
| ISW | 1 | C01-74 | C01-75 | 8 | C08-42 | C08-43 | 5.3819 | 23.9703 | −2.39 | −3.99 | −7.06 |
| ITW | 1 | C01-74 | C01-75 | 8 | C08-42 | C08-43 | 5.2872 | 23.2899 | −2.98 | −4.48 | −7.31 |
© 2020 by the authors. Licensee MDPI, Basel, Switzerland. This article is an open access article distributed under the terms and conditions of the Creative Commons Attribution (CC BY) license (http://creativecommons.org/licenses/by/4.0/).
Share and Cite
Chung, I.-M.; Ham, T.-H.; Cho, G.-W.; Kwon, S.-W.; Lee, Y.; Seo, J.; An, Y.-J.; Kim, S.-Y.; Kim, S.-H.; Lee, J. Study of Quantitative Trait Loci (QTLs) Associated with Allelopathic Trait in Rice. Genes 2020, 11, 470. https://doi.org/10.3390/genes11050470
Chung I-M, Ham T-H, Cho G-W, Kwon S-W, Lee Y, Seo J, An Y-J, Kim S-Y, Kim S-H, Lee J. Study of Quantitative Trait Loci (QTLs) Associated with Allelopathic Trait in Rice. Genes. 2020; 11(5):470. https://doi.org/10.3390/genes11050470
Chicago/Turabian StyleChung, Ill-Min, Tae-Ho Ham, Gi-Won Cho, Soon-Wook Kwon, Yoonjung Lee, Jeonghwan Seo, Yeon-Ju An, So-Yeon Kim, Seung-Hyun Kim, and Joohyun Lee. 2020. "Study of Quantitative Trait Loci (QTLs) Associated with Allelopathic Trait in Rice" Genes 11, no. 5: 470. https://doi.org/10.3390/genes11050470