Investigation and Prediction of Heavy-Duty Diesel Passenger Bus Emissions in Hainan Using a COPERT Model
by
 , , and
Feng Li
1 ,
,
Jihui Zhuang
1,*,
Xiaoming Cheng
1,
Mengliang Li
2,
Jiaxing Wang
1 and
Zhenzheng Yan
1 1
Mechanical and Electrical Engineering College, Hainan University, Hainan 570228, China
2
China Automotive Technology&Research Center Co. Ltd., Tianjin 300300, China
*
Author to whom correspondence should be addressed.
Atmosphere 2019, 10(3), 106; https://doi.org/10.3390/atmos10030106
Submission received: 30 January 2019
/
Revised: 14 February 2019
/
Accepted: 22 February 2019
/
Published: 27 February 2019
(This article belongs to the Special Issue Traffic-Related Emissions)
Abstract
:To investigate the emission status and predict the future trends of heavy-duty diesel passenger buses in Hainan Province, the technical level distribution, activity characteristics, and operating conditions of heavy-duty diesel passenger buses were statistically analyzed. The emissions of CO, CO2, NOX, and PM of the province’s heavy-duty diesel passenger buses in 2017 were calculated by the COPERT model. The Portable Emission Measurement System was applied to the calibration of emission factors calculated by the model to improve the accuracy of emission predictions. The prediction of emission trends sets three different scenarios: baseline scenarios (BAS), emission reduction standard scenario (ERS), and emission reduction standard and replacement by electric vehicle scenario (ERS and REV). The gray model was used to predict the number of heavy-duty diesel passenger buses in the three scenarios and combined with the calibrated emission factors to predict the emission trends under different scenarios. Results show that the ERS will reduce CO, CO2, NOX, and PM emissions by approximately 23%, 12%, 23%, and 46% respectively, in 2025 compared with BAS. ERS and REV will reduce CO, CO2, NOX, and PM emissions by approximately 38%, 33%, 38%, and 50% for the three emissions, compared with the BAS.
1. Introduction
Motor vehicle emissions are the main source of air pollution in many parts of the world [1]. In recent years, with the rapid development of China’s economy and the implementation of the priority strategy for public transport, energy consumption has continued to increase, and the number of heavy-duty diesel passenger buses has increased dramatically. In 2007, the number of heavy-duty passenger buses in the country was 938,200. In 2013, it exceeded 1.3 million and by 2016, it exceeded 1.45 million [2]. The problem of exhaust pollution is also becoming increasingly apparent, and air pollution in large and medium-sized cities is increasing [3]. How to effectively control the pollutant discharge of heavy-duty diesel passenger buses under actual road conditions has become the key question in controlling the emission of pollutants from mobile sources and improving air quality. The establishment of a heavy diesel passenger vehicle emission inventory can provide a data basis for medium and long-term motor vehicle pollutant control [4]. Using the vehicle emission model is one of the important means of obtaining vehicle emission factors. Common models include the MOVES, IVE, EMFAC, MOBILE, CMEM, and COPERT models [5,6,7,8,9,10,11,12,13]. The COPERT model, a macro-scale vehicle emission model developed by the European Environment Agency, is the most widely used vehicle emission model in Europe. The calculation principle of the COPERT model is based on the basic emission factor, and the column correction coefficient is used to calculate the vehicle emission factor under actual conditions. To reflect the vehicle emission levels of different countries and regions, the COPERT model can calculate the correction factor on the basis of the local information input by the user and obtain a localized emission inventory. Alam et al. used the COPERT model to assess the effect of Irish emission reduction policies on greenhouse gas emissions [7]. The study compared different energy alternatives with the goal of reducing CO2 emissions, but only predicting a single emission gas is not enough to provide a reference for comprehensive decision making. Smit et al. estimated the emission factors of Australian vehicles through the COPERT model [8]. The study verified the model estimates by a tunnel emissions study, but the portable emission measurement system, which is more tally with the actual, is more beneficial to the verification of the estimation results. Quaassdorff et al. used the COPERT model to validate Madrid’s emission predictions [9]. The study used the traffic simulation model to obtain the vehicle's activity data, but the data obtained by the engine data logger is more in tally with the real working conditions, which is beneficial to further improve the accuracy of the model estimation. The data of the COPERT model mainly come from the bench test data accumulated by EU countries. The classification, emission standards, and test conditions of motor vehicles in China are similar to those in the EU. The latest COPERT model used advanced technologies of vehicle emission testing to update key parameters and the actual road emission factor of heavy vehicles; the calculation results are closer to the actual emissions of Chinese motor vehicles, which is favored by Chinese researchers [14].
Therefore, the COPERT model is also applicable to the establishment of the emission inventory of heavy diesel passenger buses in Hainan Province.
Road vehicle emission test is one vehicle exhaust emission test method that it is receiving increasing attention. With global positioning system (GPS) and portable emission measurement system (PEMS) installed on the vehicle under test, PEMS can test and record the driving conditions and exhaust pollutant emissions of the vehicle in real time [15,16,17,18,19,20,21]. The vehicle emission test has high accuracy, which can directly reflect the emissions of the vehicle and the effect of the vehicle’s instantaneous operating conditions on emissions. Therefore, vehicle emission testing has been widely used by researchers in countries such as the United States and Europe, and it has achieved satisfactory results. Ntziachristos used the results of PEMS test and COPERT model to study the NOX emission characteristics of diesel vehicles [6]. Cheng et al. used the PEMS test to study the emissions of gaseous pollutants and ultrafine particles from gasoline- and diesel-fueled vehicles [22]. In this paper, the PEMS test is used to compare the calculation results of the COPERT model, and the emission inventory calculated by the model is calibrated to improve the accuracy of the calculation results.
The gray model is a method of using a small amount of incomplete information to establish a gray differential prediction model and making a fuzzy description of the law of development. It is a method for predicting systems with uncertain factors. It constructs a gray prediction model by using a series of numerical values of the characteristics of the response prediction object observed by the isochronous time to predict the feature quantity at a certain moment in the future, or the time to reach a certain feature quantity. The gray model has a wide range of applications and is used for predicting systems with uncertainties. The gray model finds the law of system changes by identifying the degree of difference between the development factors of system factors. In this manner, a data sequence with strong regularity is generated, and a corresponding differential equation model is established to predict the future development trend of things [23,24]. To achieve the prediction of emissions under future scenarios, this study uses gray prediction models to predict the number of heavy-duty diesel passenger buses in various scenarios. Combined with the adjusted emission factors, statistical mileage, and other parameters, the total amount of emissions in the future scenario can be predicted.
2. Methodology
2.1. Data Collection and Acquisition
The research data in this study came from a project called “Research on Product Testing Conditions of China’s New Energy Vehicles and Development—Haikou City, Urban Data Collection” by the People’s Republic of China Ministry of Industry and Information Technology. A road test remote information system was adopted in this paper to collect the real-time operation data of public transport vehicles in Haikou City. The system mainly comprises a vehicle data recorder and a vehicle remote management service platform. The vehicle engine data logger collects, records, and transmits the road driving cycle, driving behavior, and vehicle operation data of the actual vehicle operation process, as shown in Figure 1. The device is connected to the vehicle CAN network through the OBD port and obtains real-time travel information in accordance with the SAE J1939 standard protocol. The vehicle engine data logger transmits the data to the remote vehicle management service platform through a wireless communication module. The data collected by the vehicle engine data logger are engine speed, vehicle speed, shift lever position, accelerator pedal depth, instantaneous fuel consumption rate, air–fuel ratio, air conditioning switch status, motor speed, intake air flow, engine torque, GPS time, and location. The remote vehicle management service platform mainly acts as the data transit center and vehicle driving record database. Figure S1 presents a flow chart of the road test remote information system and data analysis.
To obtain the circulation data for the model calculation, the driving data of 27 heavy-duty diesel passenger buses from 00:00 on November 1, 2017, to 00:00 on December 1, 2017, were taken. Vehicle driving data cover working days and non-working days, including peak hours and off-peak hours. The driving sections cover highways, primary roads, and secondary roads. After removing some invalid data, 6 million valid driving data were obtained. After classification by the MATLAB program, 5375 valid trips were finally collected.
2.2. Establishing Hainan Heavy Duty Diesel Passenger Bus Emissions Inventory by Using COPERT Model
Funded by the European Environmental Agency, the COPERT model was developed to calculate the amount of pollutant emissions per vehicle or fleet for a year. The estimation procedure of the model is shown in Figure 2. The version number of the COPERT model used in this study is V5.0.1145.
The base year for calculation is 2017, and the environmental information data are from the China Meteorological Administration [25], as shown in Table S1. Fuel specification data and lubricant specifications data are taken as the default values of the system. Statistical fuel consumption data, stock configuration data, and stock and activity data are sourced from the National Bureau of Statistics, Ministry of Industry and Information Technology of the People’s Republic of China, and Ministry of Transport of the People’s Republic of China. In this study, fuel specifications only selected the diesel category. The model estimates the carbon, hydrogen, and other heavy metal atoms based on the type and amount of fuel used. These values will directly affect the calculation results of emissions. The annual consumption of heavy diesel vehicles in the province is 16,096 TJ [26]. The fleet consists mainly of Urban Bus Standard and Coaches Standard, as shown in Table 1. Among them, the number of Urban Bus Standard is obtained by Haikou Bus Company [27] and Sanya Bus Company official websites [28], and the number of Coaches Standard is obtained by the official website of the National Bureau of Statistics [29]. The data used by Mean Activity and Lifetime Cumulative Activity are from statistics on public traffic vehicles in the Chinese market [30]. Due to the need to build an international tourist island in Hainan Province, a more stringent emission policy was implemented [31]. Old public traffic vehicles (such as Euro Ⅲ vehicles) were subjected to early scrapping or oil-to-gas conversion, and the fuel consumed was natural gas, so it is outside the scope of this study.
The circulation data are collected by road test remote information system, as shown in Table 2. The vehicle travel road distribution data in the table is calculated by the road test remote information system based on the GPS position. The speed data is calculated by the road test remote information system based on GPS position and vehicle speed information.
2.3. Calibration of Emission Factors Based on PEMS Test
To reduce the error of emission prediction in different scenarios, the calculation results of the COPERT model must be corrected. The PEMS test can reflect the emission of real road conditions. Owing to its high precision, it has become an important test method widely used by researchers worldwide. This study uses the vehicle road emission test data of the same type of vehicle to compare with the calculation results of the COPERT model to correct the error caused by the model calculation.
Test Equipment SEMTECH-DS is an on-board test system for testing road vehicle gas emissions, as shown in Figure S2. The installation position of the portable emission measurement system is shown in Figure S3. The test procedure is as follows: First, an exhaust gas flow meter (EFM) measures the flow rate and temperature of the exhaust gas discharged from the exhaust pipe. Then, SEMTECH-DS measures the gaseous pollutant concentration of the exhaust gas in the EFM sampling tube, and the GPS and temperature hygrometer installed on the experimental vehicle record its driving speed, geographical location, and air environment information. Finally, all test data are transferred to the laptop’s SENSOR TECH-PC software for data acquisition and processing. Among them, CO and CO2 are measured by non-dispersive infrared; NO and NO2 are measured by non-dispersive ultra violet spectroscopy; and the vehicle exhaust gas emission rate is obtained after system treatment.
2.4. Prediction Emission Trends
This study considers 2025 as a comparative research year and sets three scenarios to study the emission reduction potential of heavy-duty diesel passenger cars in Hainan Province.
The amount of each type of vehicle is predicted by gray model. The raw data are the number of vehicles in 2006–2017, and the predicted value is the number of vehicles in the future. The raw data are as follows:
, A GM(1,1) model is created with a series:
among them, is the gray derivative, is the development coefficient, is the whitening background value, and b is the gray action amount.
For the gray differential equation of GM(1,1), if the time k = 1,2,3,...,n is regarded as the continuous variable t, then the previous is regarded as a function of time t, and the gray derivative becomes a continuous derivative . The whitened background value corresponds to the derivative . The regression analysis is used to obtain the estimated values of a and b, so the corresponding whitening model is:
the solution to the equation is as follows:
the predicted value is obtained as follows:
thus, the corresponding predicted value is obtained:
2.5. Baseline Scenario (BAS)
BAS assumes that Hainan’s heavy-duty diesel passenger buses continue to grow at current rates, regardless of the various policy measures implemented by the government after 2018. The BAS is compared with the emissions of other scenarios to study the emission reduction potential of other policies.
The emission calculation model is as shown in Equation (6):
where represents the total amount of emissions, j represents the vehicle category, j = 1 represents the bus, j = 2 represents the coach, represents the number of heavy-duty passenger buses of the j-type vehicle for that year, and represents the emission factor of the j-type vehicle.
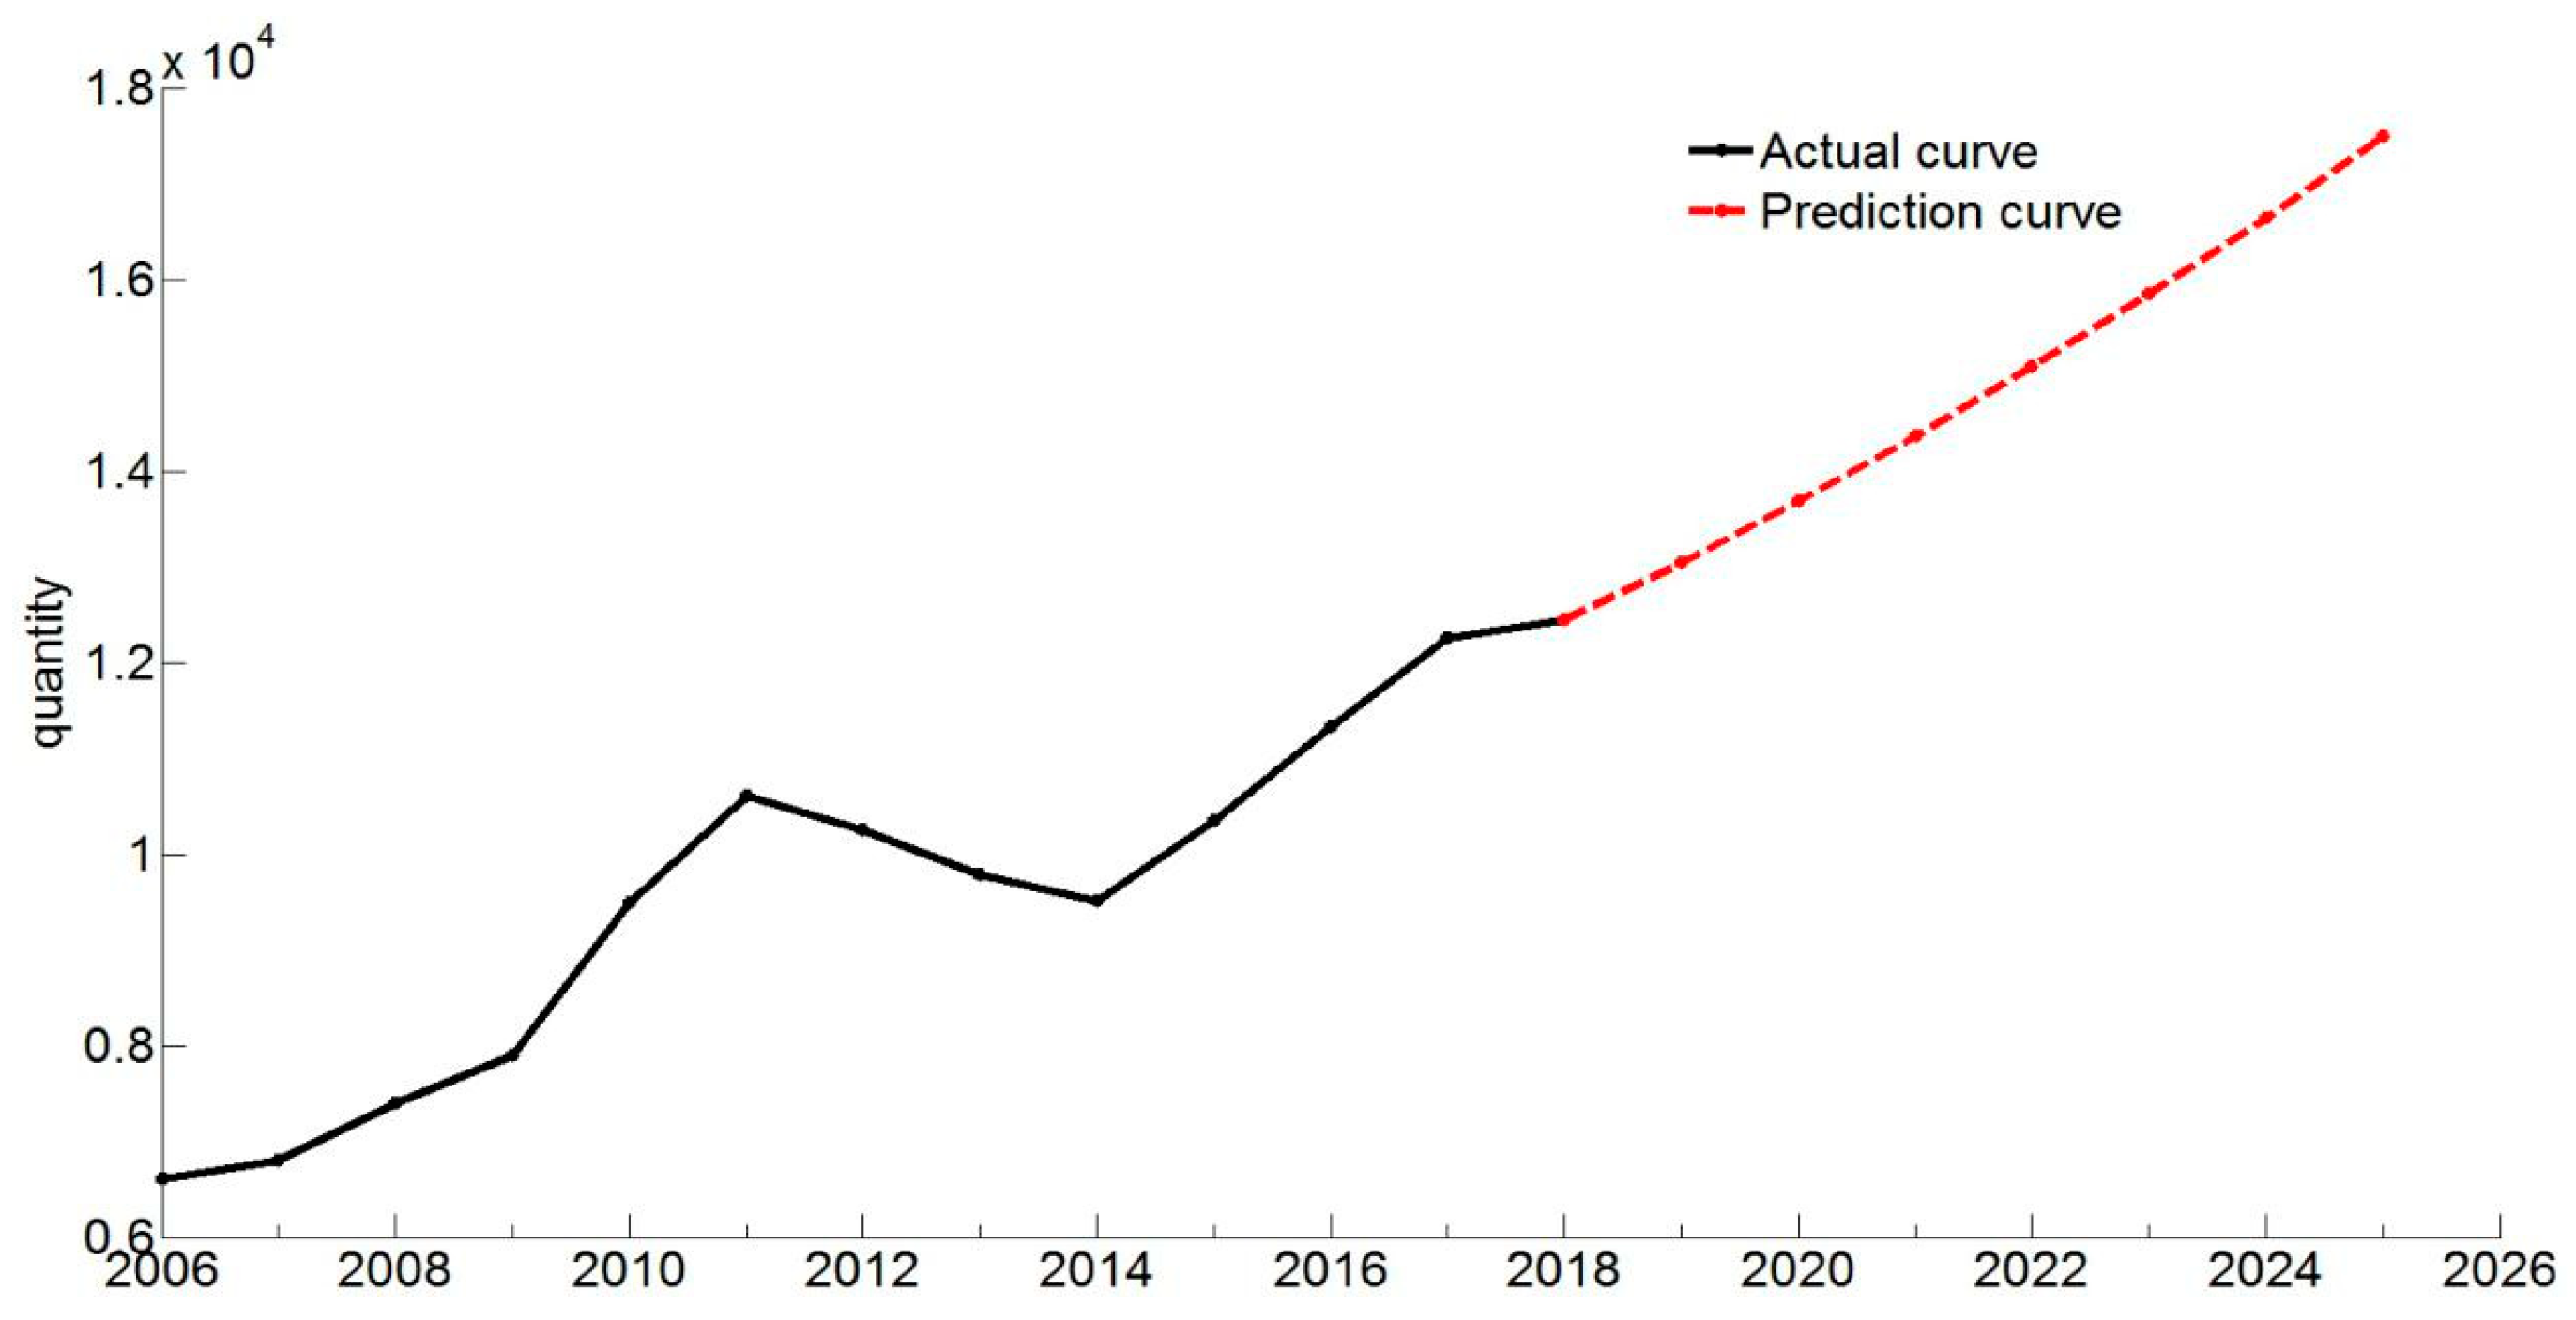
The actual quantity in 2006–2017 and the predicted quantity in 2018–2025 of heavy diesel bus in Hainan Province are shown in Table 5. Hainan Province bus growth trend predicted by the gray prediction model is shown in Figure 3. The gray prediction model predicts that the total number of heavy-duty diesel passenger buses in the province will be 17,900 in 2025.
2.6. Emission Reduction Standard (ERS) Scenario
China has established vehicle emission standards at different stages with reference to the European standard system. The current National IV emission standards are equivalent to Euro IV emission standards. Since January 1, 2017, the National V (equivalent to Euro V) emission standards have been fully implemented. The National V standard requires a reduction of 23%, 10%, 28%, and 82% for CO, CO2, NOX, and PM emissions, respectively. Assume that in 2020, the emission standard will be raised from National V to National VI (equivalent to Euro VI). The National VI standard is 50%, 30%, 42%, and 67% lower than the National V standard for CO, CO2, NOX, and PM emissions, respectively.
Under ERS, the forecast quantity of heavy-duty diesel passenger buses in Hainan Province from 2018 to 2025 is shown in Table 6. The principle of allocation for urban bus is as follows: After 2017, the new urban bus in Hainan Province are all electric buses or natural gas buses. By 2025, the number of vehicles accorded with the National V emission standards will no longer increase, and these vehicles will not reach the end of life, so the number of such vehicles will remain unchanged. The number of vehicles accorded with the National IV emission standards is predicted by the gray model. The principle for the allocation of coaches is as follows: The total quantity, the number of National IV emission standard vehicles, and the number of National V emission standard vehicles are predicted by the gray model. The National VI emission standards will not be implemented in 2018–2020, so there are no vehicles that accord with the National VI emission standards during this period. The number of National VI coaches in 2021–2025 is subtracted from the total number and the number of the remaining two types of vehicles.
2.7. ERS and Replacement by Electric Vehicle Scenario (REV)
In December 2015, the United Nations Climate Change Conference in Paris, France unanimously adopted the Paris Agreement. The participating governments pledged to phase out fossil fuels and switch to clean energy to avoid global warming. Converting traditional fuel vehicles into new energy vehicles can reduce emissions from automobile transportation. Referring to the “Implementation Opinions of the Hainan Provincial People’s Government on Promoting the Application of New Energy Vehicles to Promote the Construction of Ecological Provinces” report issued by the Hainan Provincial Government, updating traditional fuel urban buses to electric buses is planned at a rate of 10% per year, and at least 50% of the newly added coaches are electric buses [32]. Forecast quantity of various types of vehicles in this scenario is shown in Table 7.
3. Result and Discussion
3.1. Calculation and Calibration Results of Emission Inventory for Heavy Diesel Passenger Buses in Hainan Province
On the basis of the calculation results of the COPERT model, the total CO, CO2, NOx, and PM emissions of heavy-duty diesel passenger buses in Hainan Province are 2207, 1,299,605, 9004, and 254 t/yr, respectively. The CO, CO2, and NOx emission factors of coaches are compared with the PEMS test results, as shown in Figure 4:
Compared with the PEMS test, the calculation errors of the COPERT model for CO, CO2, and NOx emissions of coaches in Haikou City are −37.62%, 28.92%, and 7.08%, respectively. The COPERT model underestimates CO emissions and overestimates CO2 emissions, indicating that the model’s fuel combustion efficiency estimates are more optimistic than the actual situation. The total amount of calibrated emissions can be calculated from Equation (7):
where is the total amount of emissions after calibration by PEMS, is the emission factor obtained by PEMS test, is the total amount of emissions calculated by COPERT model, and is the emission factor calculated by COPERT model.
On the basis of the PEMS test results, the total amount of CO, CO2, and NOX emissions after calibration are approximately 3560, 1,008,077, and 8409 t/yr, respectively.
3.2. CO Emissions under Different Emission Scenarios
In different scenarios, the CO emission trends of heavy-duty diesel passenger buses in Hainan Province are shown in Figure 5. The CO, CO2, and NOX emissions data for 2006–2016 are derived from the statistics of the Ministry of Industry and Information Technology of the People’s Republic of China.
In BAS, CO emissions will increase rapidly at a rate of 5% per year; in 2025, CO emissions will be approximately 5010 t, an increase of 41% compared with 2017.
Under ERS, CO emissions will be effectively controlled and will grow at a rate of 3% per year by 2020. With the stricter emission standards, the growth rate after 2020 will be controlled below 1%. In 2025, CO emissions will be approximately 3846 t, an increase of 8% compared with 2017, and a reduction of 23% compared with BAS.
Under ERS and REV, the growth trend of CO can be effectively controlled. With the implementation of the new generation emission standards in 2020, the total CO emissions will be reduced by more than 1% per year. In 2025, CO emissions will be approximately 3101 t, a reduction of 13% compared with 2017 and a reduction of 38% compared with BAS.
3.3. CO2 Emissions under Different Emission Scenarios
In different scenarios, the CO2 emission trends of heavy-duty diesel passenger buses in Hainan Province are shown in Figure 6. In 2006–2017, CO2 emissions continued to grow rapidly. The previous generations of emission standards did not explicitly limit CO2 emissions. Thus, after 2013, as the growth rate of passenger bus ownership slowed down, the growth rate of CO2 emissions slowed slightly.
Under BAS, the CO2 growth rate remained at 5% owing to no change in fleet composition and emission standards, which is the same as CO. The CO2 emissions in 2020 will be approximately 1,419,100 t, an increase of 41% over 2017.
Under ERS, the growth rate of CO2 will remain at 4% by 2020. With the stricter emission standards after 2020, the growth rate of CO2 will remain between 2% and 3%. The control effect of CO2 growth rate is not as apparent as CO, which is mainly due to the looser restrictions on CO2. The CO2 emissions in 2025 will be approximately 1,242,235 t, an increase of 23% compared with 2017 and a decrease of 12% compared with BAS.
Under ERS and REV, the rate of CO2 emissions growth will be effectively controlled and will decrease at a slow rate (less than 1%) after 2020. In 2025, CO2 emissions will be approximately 955,503 t, a reduction of 5% compared with 2017, which is 33% lower than BAS.
3.4. NOX Emissions under Different Emission Scenarios
In different scenarios, the NOX emission trends of heavy-duty diesel passenger buses in Hainan Province are shown in Figure 7. In 2006–2017, NOX emissions increased rapidly, peaked in 2012, and then slowly declined. The reason for this phenomenon is similar to that of CO, and will not be described again.
Under BAS, NOX emissions will continue to grow at a rate of 5%. In 2025, NOX emissions will be approximately 11,836 t, an increase of 41% over 2017.
Under ERS, the growth rate of NOX will be between 2% and 3% by 2020. With the stricter emission standards after 2020, the growth rate of NOX will drop to 1%. The NOX emission will be approximately 9105 t, an increase of 8% compared with 2017 and a reduction of 23% compared with the BAS.
Under ERS and REV, NOx emissions will be reduced at a slow rate (less than 1%) and will decrease at a rate of 1% to 2% after 2020. In 2025, NOX emissions will be approximately 7335 t, a reduction of 13% compared with 2017 and a reduction of 38% compared with BAS.
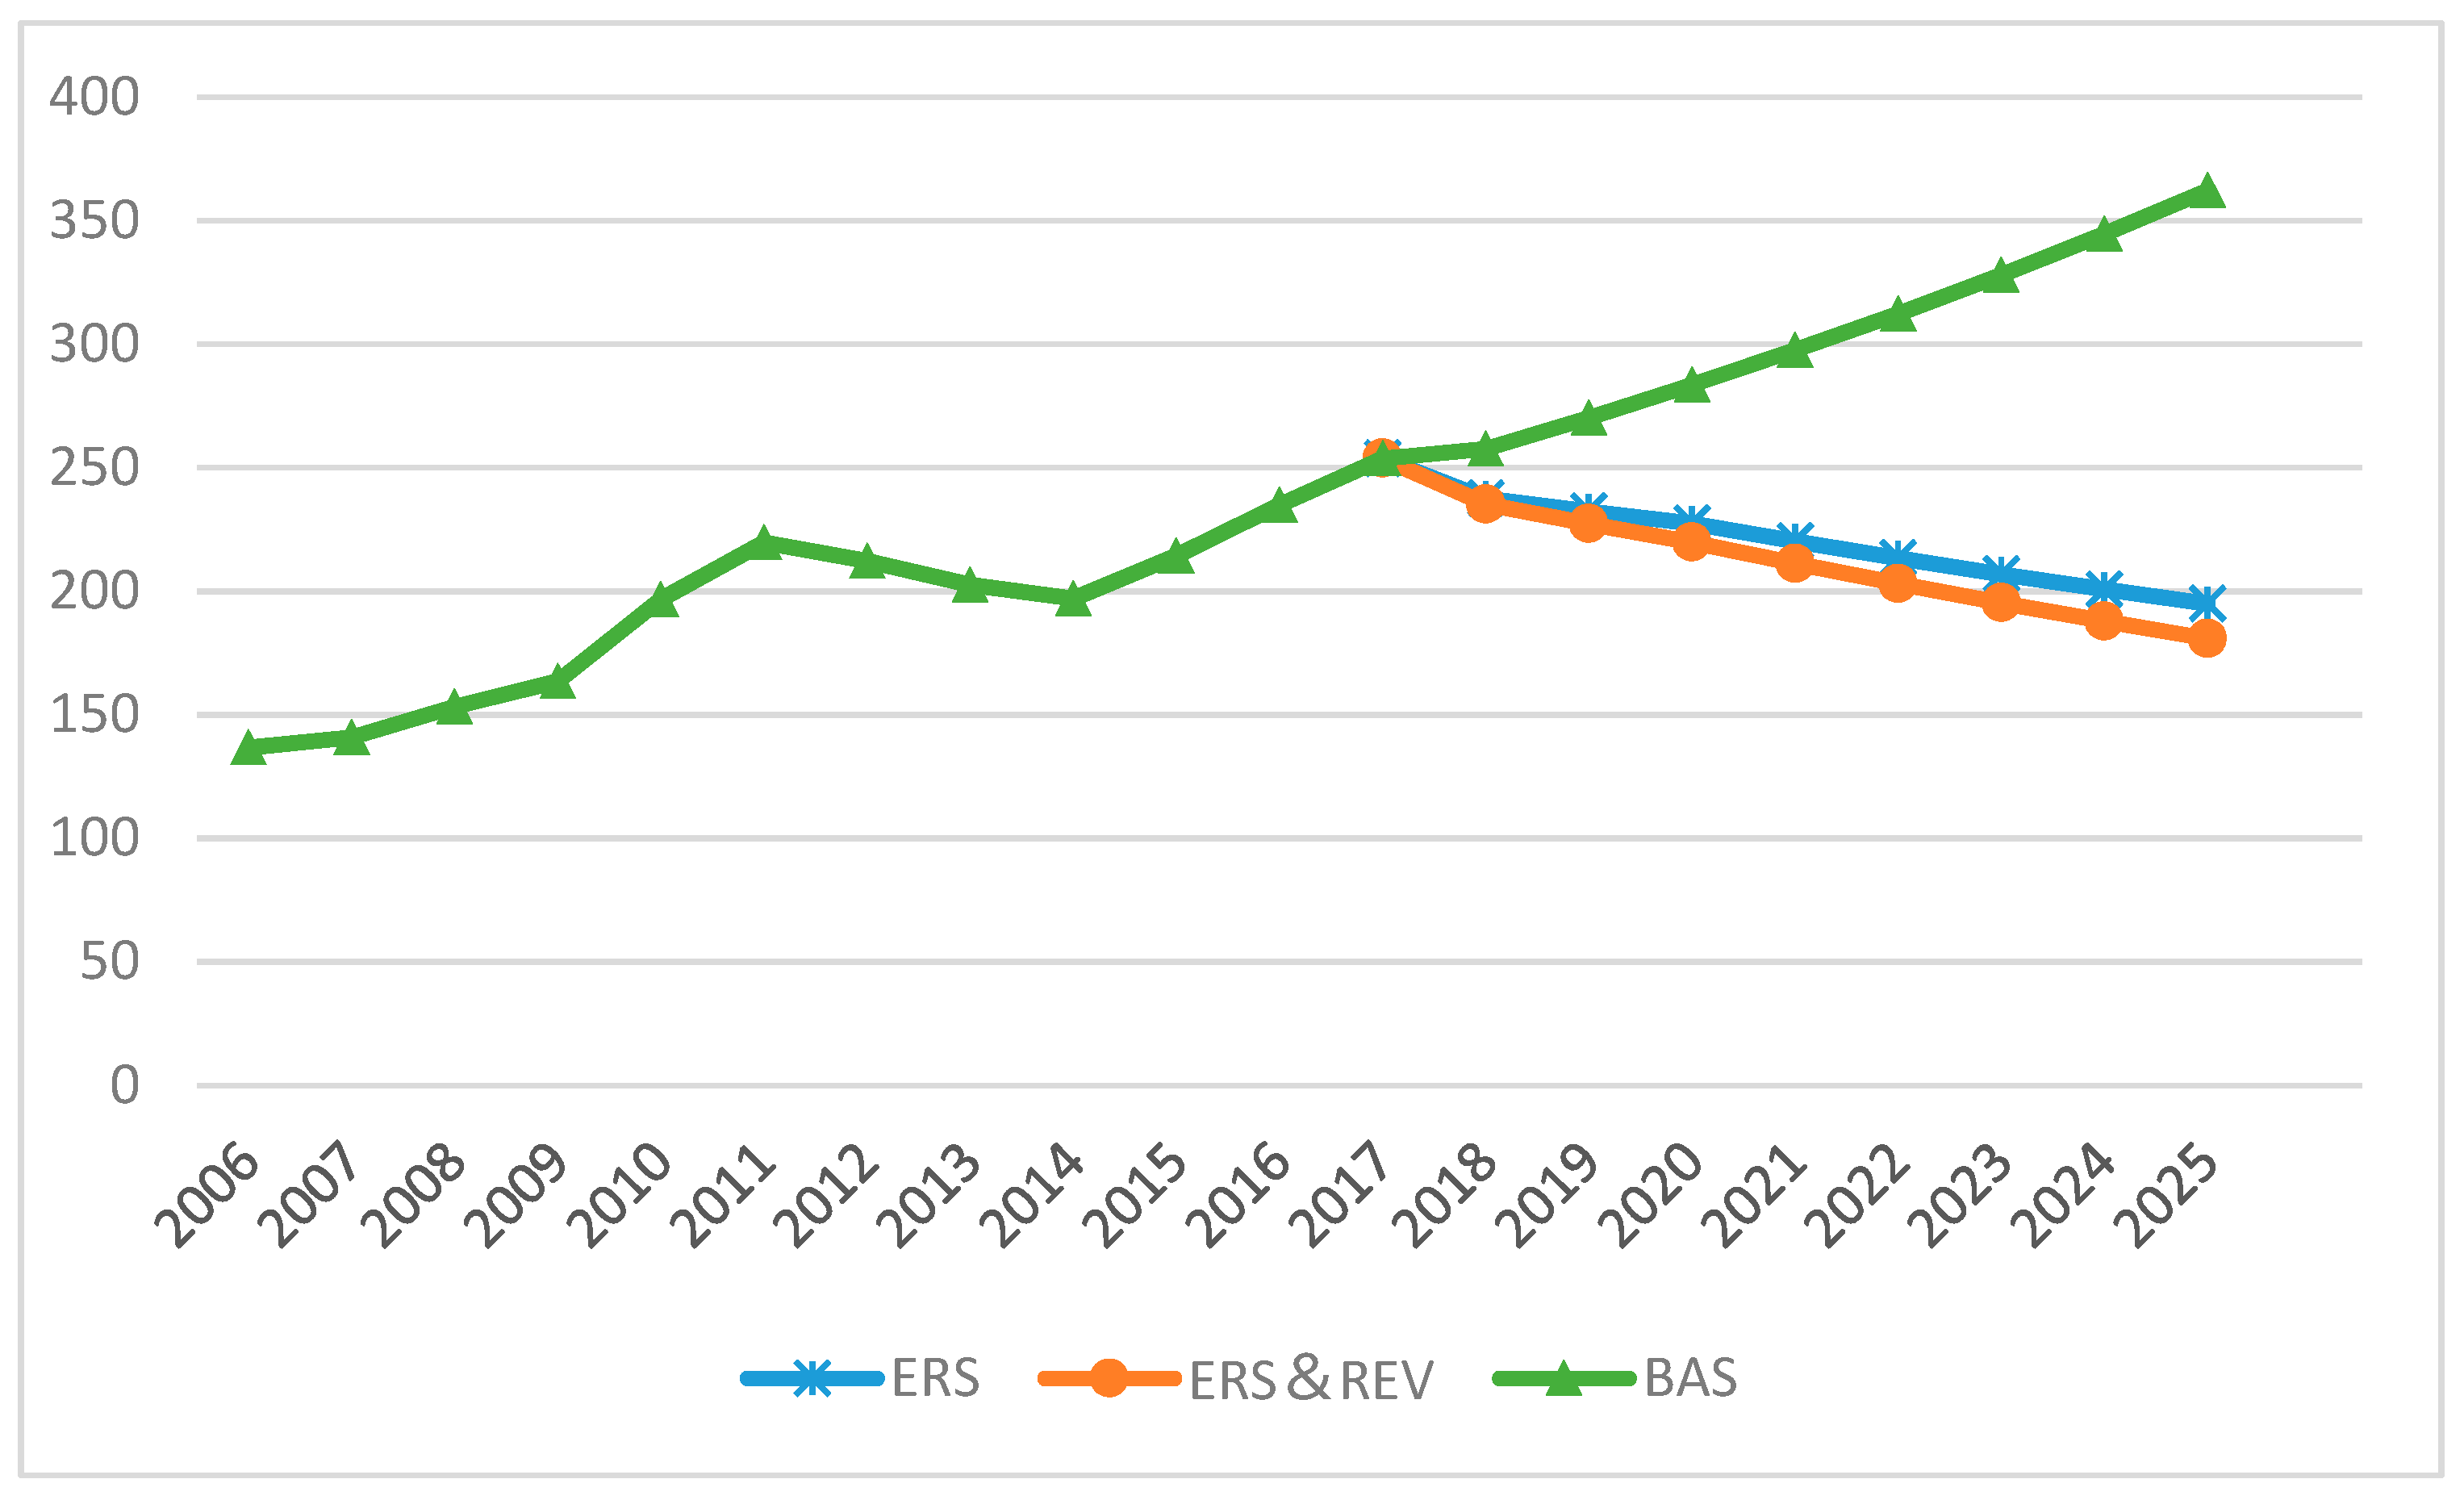
3.5. PM Emissions under Different Emission Scenarios
Because PM emissions are strong climate forcers and the cause of the health problems, this study provides additional estimates for PM emissions. According to the COPERT model, the total PM emissions of heavy-duty diesel passenger bus in Hainan Province is about 254 t/yr, and the emission factor of PM is 0.118 g/km.
In different scenarios, the PM emission trends of heavy-duty diesel passenger buses in Hainan Province are shown in Figure 8. In 2006–2017, PM emissions showed a rapid growth trend. There was a slight downward trend in emissions between 2011 and 2014, mainly due to the decline in vehicle ownership.
Under BAS, PM emissions continue to grow at a rate of 5%. PM emissions in 2025 are approximately 362 tons, an increase of 43% from 2017.
Under ERS, the growth rate of PM will be about −2% by 2020. As the emission standards continue to increase after 2020, the growth rate of PM will drop to about −3%. PM emissions in 2025 are approximately 195 tons, 23% less than in 2017, and 46% less than the baseline scenario.
Under ERS and REV, PM emissions are reduced at a faster rate (greater than 3%). In 2025, PM emissions are approximately 181 tons, 29% less than in 2017, and 50% less than the baseline scenario.
4. Conclusions
The heavy diesel passenger bus driving data were collected, and the COPERT model was used to establish the 2017 Hainan Heavy Duty Diesel Bus Emission Inventory, and the total emission prediction under the three scenarios of 2018–2025 was completed. This study has the following conclusions:
Compared with the circulation data obtained from empirical estimation and reference data, the road test remote information system collected the circulation data of the heavy-duty diesel passenger bus as the input parameter of the emission prediction model, which can effectively reduce the systematic error of the model calculation.
The PEMS test was used to correct the calculation results of the COPERT model, and the emission inventory of heavy diesel passenger buses in Hainan Province was obtained. Analysis of the total amount of various types of emissions provides an important basis for studying vehicle emissions, reducing exhaust pollution, and sustainable development.
The prediction of the heavy diesel passenger bus emission trends in Hainan Province shows that under BAS, CO, CO2, NOX, and PM emissions will continue to grow at a rate of 5%. Under ERS scenario, CO, NOX and PM emissions will be significantly reduced. The reduction effect on PM is particularly noticeable. The control effect of CO2 growth rate is not as obvious as the other three types of emissions. Only under ERS and REV scenario, CO2 emissions will be effectively reduced. Meanwhile, all types of emissions will be reduced at a fast rate. The stricter emission standards can effectively curb the growth trend of total emissions, but this effect will gradually weaken. ERS and REV is the most effective measure to reduce emissions, and more electric buses can fundamentally reduce road emissions. However, the environmental pollution caused by waste batteries and the power generation process require further research and demonstration.
Supplementary Materials
The following are available online at https://www.mdpi.com/2073-4433/10/3/106/s1, Table S1. Environmental information, Figure S1. Road test remote information system and data analysis process, Figure S2. Portable emission measurement system schematic, Figure S3. Portable emission measurement system installation and location, Figure S4. Test route.
Author Contributions
Methodology, J.Z. and F.L.; software, F.L.; validation, X.C., J.W. and Z.Y.; formal analysis, F.L.; investigation, F.L.; resources, X.C. and F.L.; writing—original draft preparation, F.L.; writing—review and editing, J.Z.; visualization, X.C.; supervision, J.Z.; project administration, M.L. and J.Z.
Funding
This work was supported by the Research and Development of the China New Energy Automotive Testing Cycle Project of the Natural Science Foundation of Hainan 20155206, Hainan Province (Production Project cxy20150013) and Haikou City (Key Project 2015023).
Conflicts of Interest
The authors declare no conflict of interest. The funders provided a road test remote information system to collect the real-time operation data.
References
- Wu, Y.; Zhang, S.; Hao, J.; Liu, H.; Wu, X.; Hu, J.; Walsh, M.P.; Wallington, T.J.; Zhang, K.M.; Stevanovic, S. On-road vehicle emissions and their control in China: A review and outlook. Sci. Total Environ. 2017, 574, 332–349. [Google Scholar] [CrossRef] [PubMed]
- National Data-National Bureau of Statistics of China. Available online: http://data.stats.gov.cn/easyquery.htm?cn=C01 (accessed on 1 December 2018).
- Lin, X.; Dai, W. Spatio-temporal variations and socio-economic driving forces of air quality in Chinese cities. Acta Geogr. Sin. 2016, 71, 1357–1371. [Google Scholar]
- Perugu, H.; Wei, H.; Yao, Z. Developing high-resolution urban scale heavy-duty truck emission inventory using the data-driven truck activity model output. Atmos. Environ. 2017, 155, 210–230. [Google Scholar] [CrossRef]
- Lang, J.; Ying, Z.; Cheng, S.; Zhang, Y. Unregulated pollutant emissions from on-road vehicles in China, 1999–2014. Sci. Total Environ. 2016, 573, 974–984. [Google Scholar] [CrossRef] [PubMed]
- Ntziachristos, L.; Papadimitriou, G.; Ligterink, N.; Hausberger, S. Implications of diesel emissions control failures to emission factors and road transport NOx evolution. Atmos. Environ. 2016, 141, 542–551. [Google Scholar] [CrossRef]
- Alam, M.S.; Hyde, B.; Duffy, P.; McNabola, A. Assessment of pathways to reduce CO2, emissions from passenger car fleets: Case study in Ireland. Appl. Energy 2017, 189, 283–300. [Google Scholar] [CrossRef]
- Smit, R.; Kingston, P.; Wainwright, D.H.; Tooker, R. A tunnel study to validate motor vehicle emission prediction software in Australia. Atmos. Environ. 2016, 151, 188–199. [Google Scholar] [CrossRef]
- Quaassdorff, C.; Borge, R.; Pérez, J.; Lumbreras, J.; de la Paz, D.; de Andrés, J.M. Microscale traffic simulation and emission estimation in a heavily trafficked roundabout in Madrid (Spain). Sci. Total Environ. 2016, 566, 416–427. [Google Scholar] [CrossRef] [PubMed]
- Sun, S.; Jiang, W.; Gao, W. Vehicle emission trends and spatial distribution in Shandong province, China, from 2000 to 2014. Atmos. Environ. 2016, 147, 190–199. [Google Scholar] [CrossRef]
- Kholod, N.; Evans, M.; Gusev, E.; Yu, S.; Malyshev, V.; Tretyakova, S.; Barinov, A. A methodology for calculating transport emissions in cities with limited traffic data: Case study of diesel particulates and black carbon emissions in Murmansk. Sci. Total Environ. 2016, 547, 305–313. [Google Scholar] [CrossRef] [PubMed] [Green Version]
- Zamora, M.L.; Pulczinski, J.C.; Johnson, N.; Garcia-Hernandez, R.; Rule, A.; Carrillo, G.; Zietsman, J.; Sandragorsian, B.; Vallamsundar, S.; Askariyeh, M.H.; et al. Maternal exposure to PM2.5 in south Texas, a pilot study. Sci. Total Environ. 2018, 628, 1497–1507. [Google Scholar] [CrossRef] [PubMed]
- Zhang, Y.; Ioannou, P.A. Environmental Impact of Combined Variable Speed Limit and Lane Change Control: A Comparison of MOVES and CMEM Model. IFAC PapersOnLine 2016, 49, 323–328. [Google Scholar] [CrossRef]
- Wang, H.; Fu, L.; Zhou, Y.; Du, X.; Ge, W. Trends in vehicular emissions in China’s mega cities from 1995 to 2005. Environ. Pollut. 2010, 158, 394–400. [Google Scholar] [CrossRef] [PubMed]
- Gallus, J.; Kirchner, U.; Vogt, R.; Börensen, C.; Benter, T. On-road particle number measurements using a portable emission measurement system (PEMS). Atmos. Environ. 2016, 124, 137–145. [Google Scholar] [CrossRef]
- Peng, Z.; Ge, Y.; Tan, J.; Fu, M.; Wang, X.; Chen, M.; Yin, H.; Ji, Z. Emissions from several in-use ships tested by portable emission measurement system. Ocean Eng. 2016, 116, 260–267. [Google Scholar] [CrossRef]
- Kwon, S.; Park, Y.; Park, J.; Kim, J.; Choi, K.-H.; Cha, J.-S. Characteristics of on-road NOx, emissions from Euro 6 light-duty diesel vehicles using a portable emissions measurement system. Sci. Total Environ. 2017, 576, 70–77. [Google Scholar] [CrossRef] [PubMed]
- Zheng, X.; Wu, Y.; Zhang, S.; Baldauf, R.W.; Zhang, K.M.; Hu, J.; Li, Z.; Fu, L.; Hao, J. Joint measurements of black carbon and particle mass for heavy-duty diesel vehicles using a portable emission measurement system. Atmos. Environ. 2016, 141, 435–442. [Google Scholar] [CrossRef]
- Cao, X.; Yao, Z.; Shen, X.; Ye, Y.; Jiang, X. On-road emission characteristics of VOCs from light-duty gasoline vehicles in Beijing, China. Atmos. Environ. 2016, 124, 146–155. [Google Scholar] [CrossRef]
- Qian, Y.; Li, T.; Hu, L. Improving urban bus emission and fuel consumption modeling by incorporating passenger load factor for real world driving. Appl. Energy 2016, 161, 101–111. [Google Scholar] [Green Version]
- O’Driscoll, R.; Apsimon, H.M.; Oxley, T.; Molden, N.; Stettler, M.E.J.; Thiyagarajah, A. A portable emissions measurement system (PEMS) study of NOx, and primary NO2, emissions from Euro 6 diesel passenger cars and comparison with COPERT emission factors. Atmos. Environ. 2016, 145, 81–91. [Google Scholar] [CrossRef]
- Cheng, H.; Lou, D.; Hu, Z.; Feng, Q.; Chen, Y.; Chen, C.; Tan, P.; Yao, D. A PEMS study of the emissions of gaseous pollutants and ultrafine particles from gasoline- and diesel-fueled vehicles. Atmos. Environ. 2013, 77, 703–710. [Google Scholar]
- Zeng, B.; Li, C. Forecasting the natural gas demand in China using a self-adapting intelligent grey model. Energy 2016, 112, 810–825. [Google Scholar] [CrossRef]
- Hsu, L.C. Using improved grey forecasting models to forecast the output of opto-electronics industry. Exp. Syst. Appl. 2011, 38, 13879–13885. [Google Scholar] [CrossRef]
- Chinese Weather. Available online: http://www.weather.com.cn/html/province/hainan.shtml (accessed on 1 December 2018).
- Ministry of Industry and Information Technology of the People’s Republic of China. Available online: http://www.miit.gov.cn/n1146312/n1146904/n1648362/n1648363/index.html (accessed on 1 December 2018).
- Haikou City Public Transportation Group Co., LTD. Available online: http://www.hkptg.com/ (accessed on 1 December 2018).
- Sanya Public Transportation Group. Available online: http://www.guangdabus.com/index.php (accessed on 1 December 2018).
- National Data-National Bureau of Statistics of China. Available online: http://data.stats.gov.cn/easyquery.htm?cn=E0103 (accessed on 1 December 2018).
- Ministry of Transport of the People’s Republic of China. Available online: http://www.mot.gov.cn/shuju/ (accessed on 1 December 2018).
- The People’s Government of Hainan Province. Available online: http://www.hainan.gov.cn/hn/zwgk/zfwj/bgtwj/201704/t20170427_2304668.html (accessed on 1 December 2018).
- Hainan Provincial Government Office. Available online: http://xxgk.hainan.gov.cn/hi/HI0101/201604/t20160421_1937041.htm (accessed on 1 December 2018).
Figure 1.
Vehicle engine data logger.

Figure 2.
COPERT model estimation procedure.

Figure 3.
Hainan Province bus growth trend prediction.

Figure 4.
Comparison of emission factors.

Figure 5.
CO emissions from heavy diesel passenger buses in Hainan Province under different scenarios (t/yr).
Figure 5.
CO emissions from heavy diesel passenger buses in Hainan Province under different scenarios (t/yr).

Figure 6.
CO2 emissions from heavy diesel passenger buses in Hainan Province under different scenarios (t/yr).
Figure 6.
CO2 emissions from heavy diesel passenger buses in Hainan Province under different scenarios (t/yr).

Figure 7.
NOX emissions from heavy diesel passenger buses in Hainan Province under different scenarios (t/yr).
Figure 7.
NOX emissions from heavy diesel passenger buses in Hainan Province under different scenarios (t/yr).

Figure 8.
PM emissions from heavy diesel passenger buses in Hainan Province under different scenarios (t/yr).
Figure 8.
PM emissions from heavy diesel passenger buses in Hainan Province under different scenarios (t/yr).


Table 1.
Stock and activity data.
| Category | Fuel | Segment | Euro Standard | Stock (n) | Mean Activity (km) | Lifetime Cumulative Activity (km) |
|---|---|---|---|---|---|---|
| Buses | Diesel | Urban Bus Standard | Euro IV | 625 | 90,000 | 720,000 |
| Buses | Diesel | Coaches Standard | Euro IV | 11,628 | 180,000 | 2,018,000 |
Table 2.
Circulation data.
| Vehicle | Share | Speed | |||||||
|---|---|---|---|---|---|---|---|---|---|
| Urban Off Peak (%) | Urban Peak (%) | Rural (%) | Highway (%) | Urban Off Peak (km/h) | Urban Peak (km/h) | Rural (km/h) | Highway (km/h) | Min-Max Speed (km/h) | |
| Urban Bus Standard | 56.73% | 19.97% | 23.3% | 0% | 20 | 10 | 40 | 0 | 11–86 |
| Coaches Standard | 37% | 23% | 20% | 20% | 20 | 10 | 40 | 70 | 12–105 |
Table 3.
Vehicle parameters.
| Parameter | Mileage (km) | Fuel Type | Curb Weight (kg) | Total Weight (kg) | Authorized Number of Passengers | Authorized Load Quality (kg) |
| 96,933 | diesel oil | 10,150 | 14,000 | 41 | 3850 | |
| Parameter | Loading quality (kg) | Rated power (kw) | Rated speed (r/min) | Cylinder number | Displacement (L) | Arrangement form |
| 1050 | 191 | 2300 | 6 | 7.255 | in-line |
Table 4.
Road test feature parameters.
| Parameters | Description |
|---|---|
| Test distance | 147.15 km |
| Test time | 11,074 s |
| Driving section ratio | Urban: 46.30% Suburb: 25.48% Highway: 28.22% |
| Average speed of each driving section | Urban: 22.88 km/h Suburb: 53.32 km/h Highway: 83.85 km/h Maximum speed: 93.64 km/h |
| Acceleration and deceleration ratio | Accelerate: 31.63% Slow down: 27.48% Uniform speed: 31.37% Parking: 9.51% Maximum acceleration: 2.503 m/s2 Maximum deceleration: −3.531 m/s2 |
| Number of stops (V = 0) and total time | Parking 26 times, Total 1028 s |
| Ambient temperature | Average temperature: 24.73 °C Maximum temperature: 26.0 °C Lowest temperature: 24.0 °C |
| Ambient humidity (relative humidity) | Average humidity: 86.64% Maximum humidity: 93.0% Minimum humidity: 79.0% |
Table 5.
Actual quantity in 2006–2017 and predicted quantity in 2018–2025 of heavy diesel buses in Hainan Province (104 vehicles).
Table 5.
Actual quantity in 2006–2017 and predicted quantity in 2018–2025 of heavy diesel buses in Hainan Province (104 vehicles).
| Year | 2006 | 2007 | 2008 | 2009 | 2010 | 2011 | 2012 | 2013 | 2014 | 2015 |
| Quantity | 0.660 | 0.680 | 0.740 | 0.790 | 0.950 | 1.061 | 1.025 | 0.978 | 0.951 | 1.035 |
| Year | 2016 | 2017 | 2018 | 2019 | 2020 | 2021 | 2022 | 2023 | 2024 | 2025 |
| Quantity | 1.134 | 1.225 | 1.244 | 1.305 | 1.369 | 1.437 | 1.508 | 1.584 | 1.664 | 1.749 |
Table 6.
Forecast quantity of heavy diesel passenger buses in Hainan Province from 2018 to 2025 under emission reduction standard scenario (ERS).
Table 6.
Forecast quantity of heavy diesel passenger buses in Hainan Province from 2018 to 2025 under emission reduction standard scenario (ERS).
| Category | 2018 | 2019 | 2020 | 2021 | 2022 | 2023 | 2024 | 2025 | |
|---|---|---|---|---|---|---|---|---|---|
| Urban Bus | Total | 836 | 811 | 787 | 765 | 742 | 721 | 700 | 679 |
| IV | 625 | 600 | 576 | 554 | 531 | 510 | 489 | 468 | |
| V | 211 | 211 | 211 | 211 | 211 | 211 | 211 | 211 | |
| Coaches | Total | 11,605 | 12,236 | 12,901 | 13,601 | 14,341 | 15,120 | 15,942 | 16,809 |
| IV | 10,689 | 10,262 | 9852 | 9457 | 9079 | 8716 | 8367 | 8033 | |
| V | 916 | 1974 | 3049 | 3049 | 3049 | 3049 | 3049 | 3049 | |
| VI | 0 | 0 | 0 | 1095 | 2213 | 3355 | 4526 | 5727 |
Table 7.
Forecast quantity of various types of vehicles under the ERS and Electric Vehicle Scenario (REV).
Table 7.
Forecast quantity of various types of vehicles under the ERS and Electric Vehicle Scenario (REV).
| Category | 2018 | 2019 | 2020 | 2021 | 2022 | 2023 | 2024 | 2025 | |
|---|---|---|---|---|---|---|---|---|---|
| Urban Bus | Total | 836 | 811 | 787 | 765 | 742 | 721 | 700 | 679 |
| IV | 563 | 479 | 398 | 319 | 242 | 168 | 96 | 26 | |
| V | 211 | 211 | 211 | 211 | 211 | 211 | 211 | 211 | |
| EV | 62 | 121 | 178 | 235 | 289 | 342 | 393 | 442 | |
| Coaches | Total | 11,605 | 12,236 | 12,901 | 13,601 | 14,341 | 15,120 | 15,942 | 16,809 |
| IV | 10,689 | 10,262 | 9852 | 9457 | 9079 | 8716 | 8367 | 8033 | |
| V | 458 | 987 | 1525 | 1525 | 1525 | 1525 | 1525 | 1525 | |
| VI | 0 | 0 | 0 | 548 | 1107 | 1678 | 2263 | 2864 | |
| EV | 458 | 987 | 1524 | 2071 | 2630 | 3201 | 3787 | 4387 |
Note: EV is electric vehicle.
© 2019 by the authors. Licensee MDPI, Basel, Switzerland. This article is an open access article distributed under the terms and conditions of the Creative Commons Attribution (CC BY) license (http://creativecommons.org/licenses/by/4.0/).
Share and Cite
MDPI and ACS Style
Li, F.; Zhuang, J.; Cheng, X.; Li, M.; Wang, J.; Yan, Z. Investigation and Prediction of Heavy-Duty Diesel Passenger Bus Emissions in Hainan Using a COPERT Model. Atmosphere 2019, 10, 106. https://doi.org/10.3390/atmos10030106
AMA Style
Li F, Zhuang J, Cheng X, Li M, Wang J, Yan Z. Investigation and Prediction of Heavy-Duty Diesel Passenger Bus Emissions in Hainan Using a COPERT Model. Atmosphere. 2019; 10(3):106. https://doi.org/10.3390/atmos10030106
Chicago/Turabian StyleLi, Feng, Jihui Zhuang, Xiaoming Cheng, Mengliang Li, Jiaxing Wang, and Zhenzheng Yan. 2019. "Investigation and Prediction of Heavy-Duty Diesel Passenger Bus Emissions in Hainan Using a COPERT Model" Atmosphere 10, no. 3: 106. https://doi.org/10.3390/atmos10030106
Note that from the first issue of 2016, this journal uses article numbers instead of page numbers. See further details here.