New Regression Method to Merge Different MODIS Aerosol Products Based on NDVI Datasets


School of Geoscience and Info-Physics, Central South University, Changsha 410083, China
*
Author to whom correspondence should be addressed.
Atmosphere 2019, 10(6), 303; https://doi.org/10.3390/atmos10060303
Submission received: 15 April 2019
/
Revised: 19 May 2019
/
Accepted: 20 May 2019
/
Published: 3 June 2019
(This article belongs to the Special Issue Remote Sensing of Aerosols)
Abstract
:The moderate resolution and imaging spectroradiometer (MODIS) level 2 operational aerosol products that are based on the dark target (DT) method over vegetated regions and the enhanced deep blue (DB) algorithms over bright pixels provide daily global aerosol optical depth (AOD). However, increasing the data coverage by merging the DT and DB merged AOD product has recently become the focus of research. Therefore, this study aims to improve the merged AOD performance by introducing a new regression method (DTBRG), depending on the normalized difference vegetation index values when DT and DB AOD are valid. The DTBRG AOD is validated on a global scale while using aerosol robot network AOD measurements. Merged AOD550s from the MODIS official method and Bilal’s customized methods are evaluated for the same period for comparison. The inter-comparison of merged AOD550s from different methods with an equal number of coincident observations demonstrates that the DTBRG method performs better than the MODIS official algorithm with increased expected error (83% versus 76%), R (0.92 versus 0.90), and decreased bias (−0.001 versus 0.012). Therefore, it can be operationally used for global merged aerosol retrievals.
1. Introduction
Aerosols are generally solid or liquid particles that are suspended in the atmosphere; they can be classified into anthropogenic and natural according to how they were generated, namely, dust, mist, smog, volcanic ash, haze, and air pollution particles [1,2,3]. Aerosols have significant effects on earth’s climate, human health, and global energy budget [4,5,6,7]. Moreover, they have a significant effect on the earth’s radiation budget, because they can affect the microphysical properties and the lifespan of clouds [8,9,10]. However, aerosols in the atmosphere have a relatively short lifespan of 1–2 weeks for source, transport, and sink; the characteristic limits our understanding of their spatiotemporal distribution and physical–chemical characteristics [11,12]. Active Lidar system is a useful tool to obtain aerosol properties [13,14], chlorophyll [15], leaf nitrogen concentration [16] and so on. But passive satellite observation has been increasingly used to obtain aerosol properties because it can monitor aerosol parameters at a larger spatial scale. Moderate resolution imaging spectroradiometer (MODIS), which is an important passive sensor aboard Aqua (launched 2002) and Terra (launched 1999) satellites, monitors the global climate characteristics (including aerosols) twice daily [17,18,19]. The MODIS aerosol products include dark target (DT) land (DT-land), DT-ocean, and deep blue (DB) products for the observations of aerosol optical depth (AOD) [17,20].
With the differences in pixel selection methods (the DT algorithm over vegetated surfaces versus the DB algorithm over bright surfaces), the DT and DB algorithms have different spatial coverages of AOD retrievals over land [20,21,22]. The MODIS Collection 6 (C6) level 2 atmospheric aerosol product contains DT and DB merged AOD observations that are based on the normalized difference vegetation index (NDVI) and retrieval quality assessment (QA) [17]. Moreover, Bilal and Nichol [23] asserted that the DTB AOD product must follow the dynamic NDVI values for the pixel selection criteria. Bilal, et al. [24] proposed three customized methods to improve the coverage and reduce the errors in the DTBC6 AOD product. A comprehensive comparison of the first customized method (namely, simplified merge scheme, SMS) and DTBC6/DTBC6.1 retrievals demonstrate that the performance of the DTBSMS retrievals is better than those of the DTBC6 and DTBC6.1 retrievals with 11–13% (31%) more coincident observations, 6–9% (14–22%) greater percentage of retrievals within the EE, and 30–100% (46–100%) smaller relative mean bias when compared with the DTBC6.1 (DTBC6) on a global scale [25]. Bilal, et al. [26] resampled the DB AOD at 10 to 3 km grid while using the nearest neighbor interpolation technique and generated a new DT and DB merged aerosol product on a 3 km grid by merging it with the interpolated DB AOD and DT retrievals at 3 km and with SMS. Much effort was exerted to improve the data coverage over land, and the performance of MODIS aerosol retrievals improved by merging DT and DB AODs. Therefore, the objective of this study is to find a novel method to produce a merged aerosol product with better performance.
Based on previous studies, this study introduces a new regression method to improve the accuracy and reduce the errors in the DTBC6 AOD product when DT and DB AOD are valid. The new regression merged method is validated while using the aerosol robot network (AERONET) aerosol measurements worldwide. Moreover, the inter-comparison of merged AOD550s from different methods with an equal number of coincident observations demonstrates the performance of the proposed DTBRG method.
2. Dataset and Regression Method
2.1. Dataset
The Aqua MODIS C6.1 level 2 operational aerosol product with 10 km spatial resolution and 5 min. temporal resolution (MYD04_L2) at a global scale from 1 January 2003 to 31 December 2017 was downloaded from the Atmosphere Archive & Distribution System (LAADS) Distributed Active Archive Center [27] to obtain the DT, DB, and DTB AOD retrievals for evaluation. The Aqua MODIS 16-day level 3 NDVI product (MYD13C1) was downloaded in order to calculate the average NDVI values for each site. The Terra and Aqua combined land cover data product (MCD12C1) at 0.05-degree spatial resolution globally in 2017 was downloaded to explore the impact of surface types on merging AOD. The International Geosphere–Biosphere Program classification scheme of annual MODIS land cover type product (MCD12C1) provides 17 land cover classes and it is reclassified into six main surface types, namely forest, grassland, cropland, urban, bare land, and water [28]. The AERONET [29] (cloud-screened and quality controlled) AOD data (version 3 level 2.0) for 422 sites from 2003 to 2017 were downloaded from website [30] to evaluate the MODIS DT and DB C6.1 merged aerosol algorithm and the proposed regression method. Figure 1 shows the 422 AERONET sites that are applied to evaluate the performance of MODIS official aerosol retrievals and the AOD merged by the regression method. Table 1 provides a detailed summary of the dataset.
AERONET lacks AODs at 550 nm, but they can be calculated by linear interpolation at a log scale of the two measurements of adjacent wavelengths [31]. Only DT and DB AOD retrievals at 550 nm that passed the recommended QA checks [17,22,32] are used (for DT, corresponding to retrievals flagged QA = 3; for DB, retrievals flagged QA = 2 or QA = 3). The DT and DB retrievals were obtained from the Scientific Data Set (SDS) “Corrected Optical Depth Land” and “Deep Blue Aerosol Optical Depth 550 Land Best Estimate”, respectively. For comparison, the DTBC61 AOD retrievals were obtained from the SDS “AOD 550 Dark Target Deep Blue Combined” and were filtered for flagged QA = 3 using the SDS “AOD 550 Dark Target Deep Blue Combined QA Flag”.
2.2. Matching Methodologies
The criteria for matching MODIS and AERONET retrievals are as follows. (1) AERONET and MODIS AODs are within a 30 min. time interval (16 days for NDVI). (2) MODIS AOD falls within a 30 km radius circle that is centered on an AERONET site. (3) At least 10 MODIS AODs within the match range are required. The mean value of the MODIS AODs is used for the match up if multiple MODIS AODs are obtained with the criteria.
2.3. Evaluation Methodologies
The following evaluation methods are used to demonstrate the performance of different merged methods. This study applies the following evaluation methods: (1) bias, which points to the mean difference between the two datasets (MODIS minus AERONET); (2) the root-mean-square error (RMSE) of the bias between two datasets; (3) correlation coefficient (R), which represents a statistical dependence relationship between the two datasets; (4) global climate observing system fraction (GCOSF), which refers to the fraction of the retrieved pixels that satisfy the global climate observing system requirement for AOD accuracy (smaller than the maximum of 0.03 or 10%) [33]; and, (5) the expected error (EE), which is calculated while using of the DT algorithm over land. The bias is equal to MODIS merged AOD minus AERONET aerosol measurements.
3. Merging Method
3.1. MODIS Merging Method
For the MODIS C6.1 level 2 aerosol products, the new C6.1 product provides DT and DB combined observations (DTBC61) that are based on the NDVI and retrieval QA, in addition to the separate DT and DB aerosol retrievals [17]. Following the selection criteria based on the NDVI data, the surface is divided into three categories for the DT and DB merged products, as follows: (1) NDVI < 0.2: use the AOD data from the DB algorithm; (2) NDVI > 0.3: use the AOD data from the DT algorithm; and, (3) 0.2 ≤ NDVI ≤ 0.3: use the average of the AOD data from DT and DB with high quality assurance (DT: QA = 3 and DB: QA ≥ 2). If only one has a higher QA value, then the available one with higher QA is chosen.
3.2. Bilal’s Customized Methods
Bilal, et al. [24] proposed three methods to improve the coverage and reduce the errors of the DTBC6 AOD product. The first method is “use average of the DT and DB AOD retrievals or the available one for all the NDVI values is introduced, which is independent of the NDVI values”. The second method is “use an average of the DT and DB AOD retrievals or the available one for NDVI ≥ 0.2, and use the DB retrievals for NDVI < 0.2”. The third method is to “use AOD retrievals from the DB algorithm for NDVI > 0.3, and use average of the DT and DB retrievals or the available one for NDVI ≤ 0.3”. The results that were obtained from these methods corroborate that the number of coincident observations increased when compared with DTBC6. Thus, these methods significantly increase the spatial coverage of data. Moreover, the performance (within EE and RMSE) of the three methods is better than that of DTBC6, but the R is similar to DTBC6. The merged AOD product calculates the average of the DT and DB retrievals, which have many uncertainties and errors. The results deduce that the performance of the merged method can be further improved. Bilal, et al. [24] concluded that the first method is more suitable than two other methods, which depend on NDVI; the first method, which is called SMS, was used to obtain DT and DB merged AOD (DTBSMS) in other studies with improved results [25,26]. Therefore, DTBRG and DTBSMS AOD are compared in this study.
3.3. Wei’s Land-Use Test Method
Based on various factors, Wei, et al. [28] developed a new merged method for MODIS C6.1 DT and DB retrievals to increase the coverage and reduce the uncertainty. The NDVI over land and land use types are considered in the first land-use-type test (denoted as DTBT1). This test is created, as follows. (1) For the forested areas, the DB retrievals are selected when NDVI < 0.3, and the average of DT and DB retrievals or the available one is used for NDVI ≥ 0.3. (2) For grassland, DB retrievals when NDVI < 0.25 and the average of DT and DB retrievals or the available one when NDVI ≥ 0.25 are used. (3) For cropland, the average of DT and DB retrievals or the available one for all NDVI values are used. (4) For urban areas, the DB retrievals are used for NDVI < 0.2, whereas the average of the DT and DB retrievals or the available one is used when NDVI ≥ 0.2. (5) For bare land, the DB retrievals are used for improved performance in this case. (6) For water bodies and oceans, the DT retrievals are used over this surface type. The DTBT1 merged AOD retrievals performed better when compared with the MODIS DTBC6.1 product over various surface types with the combination of NDVI and land cover [28]. Thus, the comparative analysis of DTBRG and DTBT1 AOD retrievals is also considered.
3.4. Regression Method
The MODIS aerosol optical depth at 550 nm (AOD550) has different data accuracy for the DT and the DB algorithms over different land types due to the differences in their retrieval methods. In previous studies, the DT and DB algorithms tended to be overestimated and underestimated, respectively, which may have been due to the selection of an inappropriate aerosol model and the under- or over-estimation of the surface reflectance [34]. Thus, the opposite bias can be reduced with the combination of DT and DB products. Similar to the previous algorithm, the new regression aerosol merged algorithm that is based on the NDVI value is shown, as follows:
where refers to the AOD merged by the regression method; and represent the MODIS AOD products from the DT and the enhanced DB algorithms, respectively; and, and refer to the linear regression coefficients that are dependent on NDVI values.
4. Results and Discussion
4.1. Relationship between Regression Coefficient and NDVI
The collected datasets from 2003 to 2016 are applied to fit Equation (1) via the least squares method to obtain the regression coefficients ( and ). The coincident observations from 2003 to 2016 are divided into eight different NDVI bins according to the NDVI values (0 ≤ NDVI < 0.2, 0.2 ≤ NDVI < 0.3, 0.3 ≤ NDVI < 0.4, 0.4 ≤ NDVI < 0.5, 0.5 ≤ NDVI < 0.6, 0.6 ≤ NDVI < 0.7, 0.7 ≤ NDVI < 0.8, and 0.8 ≤ NDVI) to further obtain the relationship between the regression coefficients and NDVI. Thereafter, the fitting equation and correlation coefficient (R) in each bin are separately calculated (Figure 2).
The regression results confirm that , , and AERONET AOD have a good linear relationship, thereby indicating the preferable feasibility of the new regression method. The scatterplot of DTBRG and AERONET AOD550 under different NDVI ranges shows the number of coincident observations (N) from 2395 to 23,927 and R from 0.90 to 0.95 in Figure 2. The different regression coefficients ( and ) are apparently different in different NDVI bins. The incremental from 0.23 to 0.74 and decreasing from 0.75 to 0.17 monotonously change with enhanced surface darkness (i.e., increased NDVI), which are observed from Figure 2b–i. These results infer that and have a strong linear dependence on the NDVI values.
The regression coefficients b1 and of regression Equation (1) change with the MODIS NDVI. A linear regression method is applied to obtain the empirical relationship between the regression coefficients ( and ) and NDVI. The regression line is denoted by red () and blue () in Figure 3. The linear relationship between the regression coefficients and NDVI is , and , with fitting determination coefficients (R2) of 0.83 and 0.86, respectively. A large R2 indicates good correlation between the regression coefficients and the NDVI, thereby suggesting that the regression Equation (1) can perform well to merge the aerosol products from the MODIS DT and DB algorithm over bright and dark surfaces.
Figure 3 shows that and have a relative distinct influence on regression Equation (1). Figure 3 depicts that the weight coefficients clearly differ from one another. When the NDVI < 0.45, > 0.5, and < 0.5. When the NDVI > 0.45, < 0.5, and > 0.5. and continue to decrease and increase with the NDVI values, and they cross point with equal weight coefficient of about 0.5 exists around NDVI of 0.45. A diametrically opposite tendency between and varies with increased NDVI values, thereby implying that the selection of weight coefficients for DT and DB AOD550 should follow the dynamic NDVI values for pixel selection criteria. In the official algorithm, the merged aerosol products are obtained by using the average of the AOD data from DT and DB with high QA when 0.2 ≤ NDVI ≤ 0.3 [17]. In DTBSMS, merged AOD550 also uses an average of the DT and DB aerosol retrievals for different selection criteria that are based on the NDVI values [24]. These methods signify an equal weight coefficient (0.5) for DT. DB AOD550 is chosen to obtain the merged aerosol retrievals for the MODIS official and DTBSMS methods. However, Figure 3 demonstrates that the weight coefficient of 0.5 only exists when the NDVI value is within the range of 0.4–0.5, thereby suggesting that the weight coefficients that are applied in official and DTBSMS methods should be improved.
4.2. Validation of the Regression Method
Figure 4 shows the comparisons of DTBRG AOD550 retrievals with ground observations worldwide. The NDVI values are divided into eight bins to facilitate the comparison and exploration of the influence of NDVI on the retrievals. The total times that the satellite passed over the AERONET site within 30 km and 30 min. were approximately 8656 from 1 January 2017 to 31 December 2017. Moreover, the numbers of valid matchups with the ground sun photometer ranged from 167 to 1714 for different NDVI bins. A global validation revealed encouraging results, with high R (0.92), small bias (−0.001), RMSE (0.087), within EE (83%), and GCOSF (53%) in the DTBRG AOD550 versus AERONET measurements in Figure 4a. Figure 4b–i show the results of the matchup between DTBRG and AERONET over land at different NDVI bins. The colors in these scatterplots indicate the number of data points for a corresponding pixel. The different comparisons at different NDVI bins (e.g., maximum R of 0.94 when the NDVI ranges from 0.6 to 0.7; minimum R of 0.88 when NDVI ≥ 0.8 and 0.4 ≤ NDVI ≤ 0.5) may imply differences in performance. Furthermore, the large GCOSF of 46–63% and within an EE of 76–92% suggest that the DTBRG method can be applied to aerosol products within different NDVI bins.
4.3. Comparison with MODIS Official Method
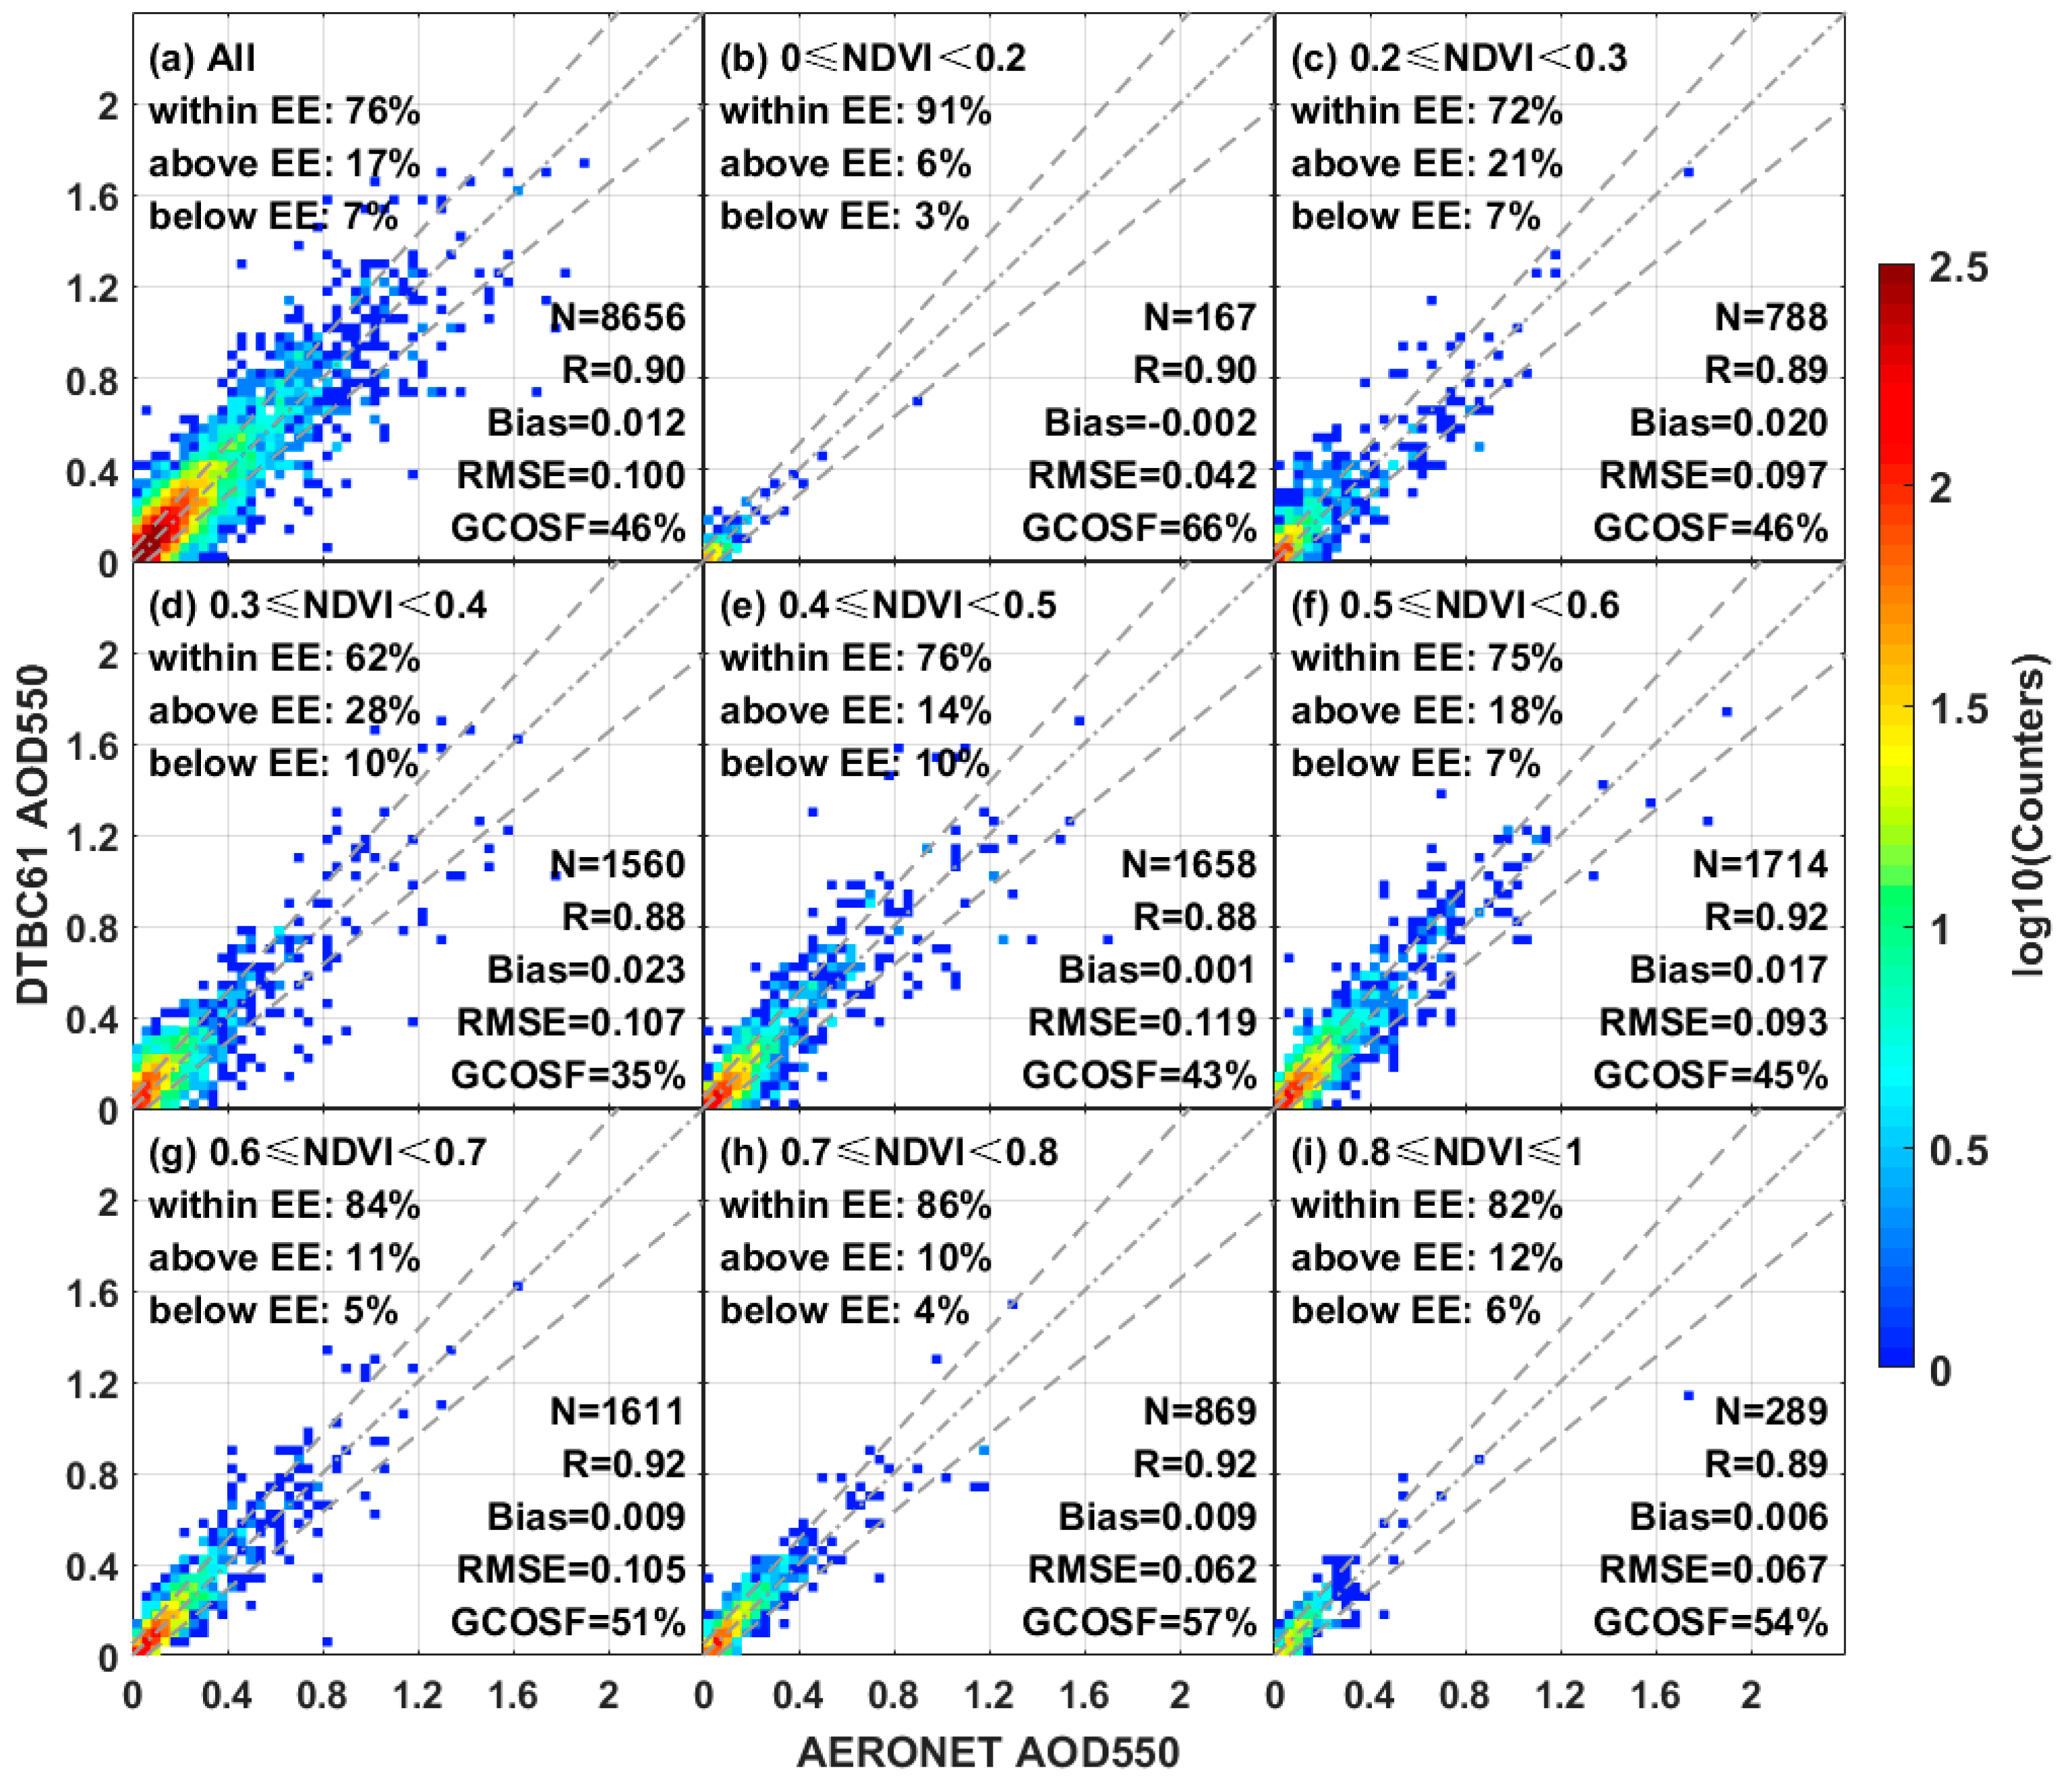
A comparison was made with the traditional DTBC61 product of MODIS to evaluate the quality of aerosol retrieval for the new regression method. When compared with the frequency scatter plots of AERONET, those of DTBC61 from 1 January 2017 to 31 December 2017 were plotted with evaluation indicators in Figure 5. The comparison of DTBC61 aerosol retrievals with the ground sun photometer measurements showed high consistency, with an R of 0.90 and a bias of 0.012, 76% of retrievals falling within EE, and GCOSF of 46% (Figure 5a). Figure 5b,i display the performance of DTBC61 retrievals in different NDVI ranges (R = 0.88–0.92, bias = −0.002–0.119, within EE = 62–91%, and GCOSF = 35–66%). A relatively poor performance of DTBC61 retrieval is shown when NDVI was in the range 0.3–0.4 in Figure 5d and was relatively small within EE (62%) and GCOSF (35%). A relatively better performance of DTBC61 retrieval is shown when NDVI < 0.2 in Figure 5b, with a relatively small bias (−0.002) and GCOSF (66%).
Overall, the quality of DTBRG retrievals is better when compared with those of DTBC61. In the case of the same number of observations, the results contend that the percentage within EE (83% versus 76%) and GCOSF (53% versus 46%) increased by 9.2% and 15.2%, respectively. The RMSE (0.087 versus 0.100) decreased by 13% and bias (−0.001 versus 0.012) declined by 91.7% as compared with DTBC61. However, when compared with DTBC61, the retrieval quality of the new regression algorithm is even worse than the traditional algorithm when the NDVI value is low. For NDVI < 0.2, the percentage of GCOSF (58% versus 66%) decreased, and the bias (0.017 versus −0.002) increased as compared with DTBC61, thereby indicating that the retrieval quality of DTBRG AOD550 declined. Given the poor performance of the DT method at low NDVI, more errors are introduced for the new regression method, thereby resulting in a worse retrieval performance of the DTBRG method when compared with DTBC61 for AOD on bright surfaces (NDVI < 0.2). By contrast, the DTBRG method performs better than DTBC61 when NDVI ≥ 0.2. At high NDVI (NDVI ≥ 0.6), the accuracy of aerosol retrieval significantly improved with increasing GCOSF from 51% to 58% for 0.6 ≤ NDVI < 0.7, 57% to 63% for 0.7 ≤ NDVI < 0.8, and 54% to 57% for 0.8 ≤ NDVI. For sites with NDVI ≥ 0.2, the retrieval results of DTBRG are better than those of DTBC61. For areas with dense vegetation, DTBC61 only considers the DT retrieval of these regions, whereas DTBRG combines the DT and DB retrievals with reasonable and dynamic weight coefficients, which thereby significantly improves the accuracy of AOD retrieval. These findings support the findings in [24,25,26] that the DB retrievals can improve the quality of the merged product for areas with dense vegetation.
4.4. Comparison with Bilal’s SMS Method
Validation of the DTBSMS retrievals was conducted at globe scale using AERONET AOD550 measurements in Figure 6. The DTBRG and Bilal’s SMS methods were compared to show the performance of the two merged methods at the same location and time in addition to the comparison between DTBRG AOD550 and DTBC61 retrievals. Overall, when compared with MODIS official method in Figure 5a, DTBSMS has the better performance with the larger GCOSF of 51%, within EE of 80%, and the smaller RMSE of 0.089 in Figure 6a. However, the worst retrieval quality can be found when NDVI < 0.2 in Figure 6b), with the smallest GCOSF of 32% and within EE of 63%. The AOD of DTBSMS has a worse performance than MODIS official products at bright surface (NDVI < 0.2). In Bilal’s SMS methods, merged AOD550 is obtained by using an average of the DT and DB AOD retrievals or the available one for all of the NDVI values. However, DB AOD550 has better quality than DT retrievals over a bright surface with low NDVI, which is because the DT method has difficulty in retrieving AOD when NDVI < 0.2. Therefore, the low-quality retrievals of DT AOD550 over a bright region may reduce the performance of the merged AOD by using the DTBSMS method. Furthermore, the better performance of DTBSMS is observed at NDVI ≥ 0.4 with larger GCOSF of 49–59% and within EE of 80–89% as compared with DTBC61 aerosol retrievals (GCOSF ranges from 43% to 57% and within EE ranges from 75% to 86%). Averaging DT and DB retrievals at high NDVI values can improve the accuracy of the merged AOD products.
A comparison of Figure 4a and Figure 6a shows that DTBRG AOD550 has a slightly large GCOSF (53% versus 51%) and within EE (83% versus 80%), as well as an evidently small bias (−0.001 versus 0.008) when compared with the DTBSMS aerosol retrievals, thereby suggesting that the DTBRG method has a slightly better performance than the DTBSMS method overall. For a bright surface (NDVI < 0.2), the DTBRG method has an evidently higher within EE of 92% and R of 0.92 as compared with DTBSMS (within EE: 63% and R of 0.86) by comparing Figure 6b with Figure 4b. However, the performance of the DTBRG method when NDVI < 0.2 may be slightly worse than that of DTBC61, as shown in Figure 4b and Figure 5b, because the DT method has difficulty in retrieving AOD over a bright surface with low NDVI. Combining the DT and DB retrievals has a negative influence on merging the AOD product over a bright surface. Moreover, the better performance of the DTBSMS method when NDVI > 0.5 must be highlighted (Figure 6f–i). These high within EE of 84–91% and R of 0.88–0.94 indicate that the DTBRG method also has a slightly better performance of DTBSMS (within EE of 82–89% and R of 0.86–0.94) over a dark surface. Furthermore, the inter-comparison of the three methods also suggests that combining DT and DB retrievals can improve the accuracy of the merged AOD products.
4.5. Comparison with Wei’s Land-Use Test Method
Figure 7 presents the validations of DTBT1 retrievals against AERONET measurements at 422 sites around the world in 2017. Figure 7a shows the remarkable result of DTBT1 AOD550 with high R (0.92), satisfactory accuracy within EE (82%), and considerable GCOSF (52%) as compared with DTBC6.1 AOD550 (Figure 5a) and DTBSMS AOD550 (Figure 6a). When compared with DTBC61 AOD550, the performance of DTBT1 is comparatively better in NDVI < 0.8, especially in medium vegetation coverage (0.2 < NDVI < 0.7), thereby indicating better performance with increasing the percentage of retrievals falling within EE (by 3.6–17.7%), large GCOSF (by 9.3–25.7%), decreasing RMSE (by 0.0–20.6%), and lower bias (by 22.2–100.0%). However, for densest vegetation areas in Figure 7i and Figure 5i, the DTBC61 AOD550 has a slightly better performance as compared with DTBT1. The DT algorithm is considered to be more accurate over the densest vegetation areas [17], which may introduce more errors in this case by simply using the average of the DT and DB AOD retrievals without considering the weight. This also can be founded in DTBSMS (Figure 6i).
The DTBT1 retrievals (Figure 7a) have a slightly better performance than DTBSMS (Figure 6a) for an equal number of observations. The retrievals of DTBT1 and DTBSMS exhibit similar performances for NDVI > 0.3, whereas DTBSMS shows poor performance in low NDVI, because the DT algorithm is inappropriate for retrieving AOD over a brighter surface. Furthermore, the comparison results between Figure 4a and Figure 7a illustrate that DTBRG has a slightly better performance with the percentage of within EE and GCOSF increase from 82% to 83% and 52% to 53%, respectively. The DTBT1 retrievals display the best performance when NDVI < 0.3, because the combination of surface type and NDVI is considered. However, the comparison of Figure 4d–i and Figure 5d–i shows that DTBRG has a better quality than DTBT1 with the percentage within EE being increased by 1.3–4.1%, GCOSF increasing by 0.0–7.5%, and RMSE being reduced by 1.7–5.5%. These results suggest that merging DT and DB by a simple average is inappropriate for most cases when NDVI > 0.3. The extremely low RMSE of DTBRG AOD550 ranges from 0.041 to 0.117, DTBC61 ranges from 0.042 to 0.119, DTBSMS ranges from 0.059 to 0.119, and DTBT1 ranges from 0.042 to 0.119, which demonstrates that the proposed DTBRG method has the best performance among the methods.
5. Conclusions
In this study, a new regression method (DTBRG) that is dependent on the NDVI values is introduced to reduce the error in the MODIS C6.1 combined AOD products (DTBC61) at 550 nm. The DTBRG is a regression method that is based on the NDVI that explores the multiple linear regression relationship between DT, DB, and AERONET AOD, as well as the relationship between the regression coefficient and the MODIS NDVI product (MYD13C1). The regression coefficients of the proposed regression method were obtained by DT, DB, and AERONET AOD550 from 2003 to 2016 worldwide. Subsequently, merged AOD550 can be derived from the regression coefficients and regression equation. A global validation of DTBRG AODs demonstrate the results with small bias (−0.001), high R (0.92), within EE (83%), and GCOSF (53%) in the DTBRG AOD550 versus AERONET measurements (level 2.0 version 3) at 550 nm from 1 January 2017 to 31 December 2017 over 422 sites worldwide. A comparison of DTBRG and DTBC61 shows that, except for NDVI < 0.2, the percentage of retrievals within EE in DTBRG is improved, the percentage of GCOSF is remarkably raised (from 46% to 53%), and the RMSE is decreased (from 0.100 to 0.087). The comparison of DTBRG, DTDSMS, and DTBT1 method also demonstrated that the proposed regression method has the best performance. Moreover, the following can be concluded according to the results of the comparison:
(1) The retrieval quality of DTBRG over dark surfaces is greatly improved when compared with DTBC61 over the areas with high vegetation coverage (NDVI ≥ 0.2), but it is not as good as DTBC61 over the condition of bright surfaces (NDVI < 0.2).
(2) The weight coefficients for DT and DB AOD550 monotonously increase and decrease with NDVI variation, respectively, and cross point with equal weight coefficient of about 0.5 exists around an NDVI of 0.45.
(3) The combining aerosol product that is only derived from the DB AOD has better performance than combining DT and DB aerosol retrievals over a bright surface with NDVI < 0.2.
This study proposes a new regression method (DTBRG) that is dependent on the NDVI values to reduce the errors in the MODIS C6.1 combined AOD products. Future research into MODIS merged aerosol retrievals must search for more practical methods.
Author Contributions
This work was conducted in collaboration with all authors. W.W., W.X., and L.W. defined the research theme. All authors performed the experiments. This manuscript was written by W.W., W.X. checked the experimental results and revised this paper. All authors agreed to the submission of the manuscript.
Funding
This study is supported by the National Key Research and Development Program of China (2018YFB0504500), the Talents gathering program of Hunan Province, China (2018RS3013) and the Open Fund of State Laboratory of Information Engineering in Surveying, Mapping and Remote Sensing, Wuhan University (Grant No. 18R06).
Acknowledgments
The authors are grateful to the MODIS science teams for providing excellent and accessible data products that made this study possible. These data were obtained from the NASA LAADS Web (http://ladsweb.nascom.nasa.gov/). The authors also thank the AERONET principal investigators and site managers who provided the data used in the validation analysis (https://aeronet.gsfc.nasa.gov/). This study is supported by the National Key Research and Development Program of China (2018YFB0504500), the Talents gathering program of Hunan Province, China (2018RS3013) and the Open Fund of State Laboratory of Information Engineering in Surveying, Mapping, and Remote Sensing, Wuhan University (Grant No. 18R06). The authors are grateful to the MODIS science teams for providing excellent and accessible data products that made this study possible. These data were obtained from the NASA LAADS Web (http://ladsweb.nascom.nasa.gov/). The authors would also like to thank the AERONET principal investigators and site managers who provided the data used in the validation analysis (https://aeronet.gsfc.nasa.gov/).
Conflicts of Interest
The authors declare no conflict of interest.
References
- Stocker, T.; Qin, D.; Plattner, G.; Tignor, M.; Allen, S.; Boschung, J.; Nauels, A.; Xia, Y.; Bex, B.; Midgley, B. Climate Change 2013: The Physical Science Basis. Contribution of Working Group I to the Fifth Assessment Report of the Intergovernmental Panel on Climate Change. Available online: https://www.ipcc.ch/site/assets/uploads/2017/09/WG1AR5_Frontmatter_FINAL.pdf (accessed on 15 April 2019).
- Huang, J.; Wang, T.; Wang, W.; Li, Z.; Yan, H. Climate effects of dust aerosols over East Asian arid and semiarid regions. J. Geophys. Res. Atmos. 2014, 119, 11, 398–416. [Google Scholar] [CrossRef]
- Wang, W.; Mao, F.; Pan, Z.; Gong, W.; Yoshida, M.; Zou, B.; Ma, H. Evaluating Aerosol Optical Depth from Himawari-8 with Sun Photometer Network. J. Geophys. Res. Atmos. 2019, 124. [Google Scholar] [CrossRef]
- Pope, C.A., 3rd; Burnett, R.T.; Thun, M.J.; Calle, E.E.; Krewski, D.; Ito, K.; Thurston, G.D. Lung cancer, cardiopulmonary mortality, and long-term exposure to fine particulate air pollution. JAMA 2002, 287, 1132–1141. [Google Scholar] [CrossRef] [PubMed]
- Zhang, M.; Wang, Y.; Ma, Y.; Wang, L.; Gong, W.; Liu, B. Spatial distribution and temporal variation of aerosol optical depth and radiative effect in South China and its adjacent area. Atmos. Environ. 2018, 188, 120–128. [Google Scholar] [CrossRef]
- Wang, W.; Mao, F.; Zou, B.; Guo, J.; Wu, L.; Pan, Z.; Zang, L. Two-stage model for estimating the spatiotemporal distribution of hourly PM1.0 concentrations over central and east China. Sci. Total Environ. 2019, 675, 658–666. [Google Scholar] [CrossRef] [PubMed]
- Wang, W.; Mao, F.; Du, L.; Pan, Z.; Gong, W.; Fang, S. Deriving Hourly PM2.5 Concentrations from Himawari-8 AODs over Beijing-Tianjin-Hebei in China. Remote Sens. 2017, 9, 858. [Google Scholar] [CrossRef]
- Twomey, S. Aerosols, clouds and radiation. Atmos. Environ. 1991, 25, 2435–2442. [Google Scholar] [CrossRef]
- Twomey, S. The Influence of Pollution on the Shortwave Albedo of Clouds. J. Atmos. Sci. 1977, 34, 1149–1154. [Google Scholar] [CrossRef]
- Wang, W.; Zhang, T.; Pan, Z. Four-year ground-based observations of the aerosol effects on cloud base height in Wuhan, China. Atmos. Pollut. Res. 2019, 5. [Google Scholar] [CrossRef]
- Kaufman, Y.J.; Tanré, D.; Boucher, O. A satellite view of aerosols in the climate system. Nature 2002, 419, 215–223. [Google Scholar] [CrossRef]
- Liu, B.; Ma, Y.; Gong, W.; Zhang, M.; Yang, J. Determination of boundary layer top on the basis of the characteristics of atmospheric particles. Atmos. Environ. 2018, 178, 140–147. [Google Scholar] [CrossRef]
- Liu, B.; Ma, Y.; Liu, J.; Gong, W.; Wang, W.; Zhang, M. Graphics Algorithm for Deriving Atmospheric Boundary Layer Heights from CALIPSO Data. Atmos. Meas. Tech. Discuss. 2018, 11. [Google Scholar] [CrossRef]
- Mao, F.; Pan, Z.; Wang, W.; Li, S.; Gong, W. Iterative method for determining boundaries and lidar ratio of permeable layer of a space lidar. J. Quant. Spectrosc. Radiat. Transf. 2018, 218. [Google Scholar] [CrossRef]
- Yang, J.; Cheng, Y.; Du, L.; Gong, W.; Shi, S.; Sun, J.; Chen, B. Analyzing the effect of the incidence angle on chlorophyll fluorescence intensity based on laser-induced fluorescence lidar. Opt. Express. 2019, 27. [Google Scholar] [CrossRef]
- Yang, J.; Du, L.; Gong, W.; Shi, S.; Sun, J.; Chen, B. Analyzing the performance of the first-derivative fluorescence spectrum for estimating leaf nitrogen concentration. Opt. Express. 2019, 27. [Google Scholar] [CrossRef]
- Levy, R.C.; Mattoo, S.; Munchak, L.A.; Remer, L.A.; Sayer, A.M.; Patadia, F.; Hsu, N.C. The Collection 6 MODIS aerosol products over land and ocean. Atmos. Meas. Tech. 2013, 6, 2989–3034. [Google Scholar] [CrossRef] [Green Version]
- Qin, K.; Zou, J.; Guo, J.; Lu, M.; Bilal, M.; Zhang, K.; Ma, F.; Zhang, Y. Estimating PM1 concentrations from MODIS over Yangtze River Delta of China during 2014–2017. Atmos. Environ. 2018, 195, 149–158. [Google Scholar] [CrossRef]
- Wang, W.; Mao, F.; Pan, Z.; Du, L.; Gong, W. Validation of VIIRS AOD through a Comparison with a Sun Photometer and MODIS AODs over Wuhan. Remote Sens. 2017, 9, 403. [Google Scholar] [CrossRef]
- Sayer, A.M.; Munchak, L.A.; Hsu, N.C.; Levy, R.C.; Bettenhausen, C.; Jeong, M.J. MODIS Collection 6 aerosol products: Comparison between Aqua’s e-Deep Blue, Dark Target, and “merged” data sets, and usage recommendations. J. Geophys. Res. Atmos. 2014, 119, 13, 965–989. [Google Scholar] [CrossRef]
- Remer, L.A.; Kaufman, Y.J.; Tanré, D.; Mattoo, S.; Chu, D.A.; Martins, J.V.; Li, R.R.; Ichoku, C.; Levy, R.C.; Kleidman, R.G. The MODIS Aerosol Algorithm, Products, and Validation. J. Atmos. Sci. 2005, 62, 947–973. [Google Scholar] [CrossRef] [Green Version]
- Hsu, N.C.; Jeong, M.J.; Bettenhausen, C.; Sayer, A.M.; Hansell, R.; Seftor, C.S.; Huang, J.; Tsay, S.C. Enhanced Deep Blue aerosol retrieval algorithm: The second generation. J. Geophys. Res. Atmos. 2013, 118, 9296–9315. [Google Scholar] [CrossRef]
- Bilal, M.; Nichol, J.E. Evaluation of the NDVI-Based Pixel Selection Criteria of the MODIS C6 Dark Target and Deep Blue Combined Aerosol Product. IEEE J. Sel. Top. Appl. Earth Obs. Remote Sens. 2017, 10, 3448–3453. [Google Scholar] [CrossRef]
- Bilal, M.; Nichol, J.E.; Wang, L. New customized methods for improvement of the MODIS C6 Dark Target and Deep Blue merged aerosol product. Remote Sens. Environ. 2017, 197, 115–124. [Google Scholar] [CrossRef]
- Bilal, M.; Nazeer, M.; Qiu, Z.; Ding, X.; Wei, J. Global Validation of MODIS C6 and C6.1 Merged Aerosol Products over Diverse Vegetated Surfaces. Remote Sens. 2018, 10, 475. [Google Scholar] [CrossRef]
- Bilal, M.; Qiu, Z.; Campbell, J.; Spak, S.; Shen, X.; Nazeer, M. A New MODIS C6 Dark Target and Deep Blue Merged Aerosol Product on a 3 km Spatial Grid. Remote Sens. 2018, 10, 463. [Google Scholar] [CrossRef]
- The MODIS Level 2 Aerosol Products (Collection 6.1). Available online: https://ladsweb.nascom.nasa.gov/ (accessed on 21 May 2019).
- Wei, J.; Li, Z.; Sun, L.; Peng, Y.; Wang, L. Improved merge schemes for MODIS Collection 6.1 Dark Target and Deep Blue combined aerosol products. Atmos. Environ. 2019, 202, 315–327. [Google Scholar] [CrossRef]
- Holben, B.N.; Eck, T.F.; Slutsker, I.; Tanré, D.; Buis, J.P.; Setzer, A.; Vermote, E.; Reagan, J.A.; Kaufman, Y.J.; Nakajima, T.; et al. AERONET—A Federated Instrument Network and Data Archive for Aerosol Characterization. Remote Sens. Environ. 1998, 66, 1–16. [Google Scholar] [CrossRef]
- AERONET (Aerosol Robotic Network). Available online: http://aeronet.gsfc.nasa.gov (accessed on 21 May 2019).
- Liu, H.; Remer, L.A.; Huang, J.; Huang, H.-C.; Kondragunta, S.; Laszlo, I.; Oo, M.; Jackson, J.M. Preliminary evaluation of S-NPP VIIRS aerosol optical thickness. J. Geophys. Res. Atmos. 2014, 119, 3942–3962. [Google Scholar] [CrossRef]
- Sayer, A.M.; Hsu, N.C.; Bettenhausen, C.; Jeong, M.J. Validation and uncertainty estimates for MODIS Collection 6 “Deep Blue” aerosol data. J. Geophys. Res. Atmos. 2013, 118, 7864–7872. [Google Scholar] [CrossRef]
- Popp, T.; de Leeuw, G.; Bingen, C.; Brühl, C.; Capelle, V.; Chedin, A.; Clarisse, L.; Dubovik, O.; Grainger, R.; Griesfeller, J.; et al. Development, Production and Evaluation of Aerosol Climate Data Records from European Satellite Observations (Aerosol_cci). Remote Sens. 2016, 8, 421. [Google Scholar] [CrossRef]
- Bilal, M.; Nichol, J.E.; Nazeer, M. Validation of Aqua-MODIS C051 and C006 Operational Aerosol Products Using AERONET Measurements Over Pakistan. IEEE J. Sel. Top. Appl. Earth Obs. Remote Sens. 2016, 9, 2074–2080. [Google Scholar] [CrossRef]
Figure 1.
Study region and aerosol robot network (AERONET) sites (red circle).

Figure 2.
Relationship between , , and AERONET aerosol optical depth (AOD) within different normalized difference vegetation index (NDVI) ranges from 2003 to 2016. (a) All the coincident observations. (b–i) The relationship under different NDVI bins.
Figure 2.
Relationship between , , and AERONET aerosol optical depth (AOD) within different normalized difference vegetation index (NDVI) ranges from 2003 to 2016. (a) All the coincident observations. (b–i) The relationship under different NDVI bins.

Figure 3.
Relationship between regression coefficients (i.e., b1, and ) and the MODIS NDVI.

Figure 4.
Global validation of merged AOD550 from the regression method (DTBRG) over 422 sites worldwide using AERONET AOD550 measurements from 1 January 2017 to 31 December 2017. (a) The overall retrieval results of DTBRG. (b–i) The retrieval results of DTBRG under different NDVI bins. The gray solid line is the 1:1 line, and the gray dashed lines are the expected error (EE) envelopes.

Figure 5.
Global validation of merged AOD550 from the official algorithm (DTBC61) over 422 sites worldwide using AERONET AOD550 measurements from 1 January 2017 to 31 December 2017. (a) The overall retrieval results of DTBC61. (b–i) The retrieval results of DTBC61 under different NDVI bins. The gray solid line is the 1:1 line, and the gray dashed lines are the EE envelopes.

Figure 6.
Global validation of merged AOD550 from Bilal’s SMS method (DTBSMS) over 422 sites worldwide using AERONET AOD550 measurements from 1 January 2017 to 31 December 2017. (a) The overall retrieval results of DTBSMS. (b–i) The retrieval results of DTBSMS under different NDVI bins. The gray solid line is the 1:1 line, and the gray dashed lines are the EE envelopes.

Figure 7.
Global validation of merged AOD550 from the Wei’s land-use test method (DTBT1) over 422 sites worldwide using AERONET AOD550 measurements from 1 January 2017 to 31 December 2017. (a) The overall retrieval results of DTBT1. (b–i) The retrieval results of DTBT1 under different NDVI bins. The gray solid line is the 1:1 line and the gray dashed lines are the EE envelopes.


Table 1.
Summary of the dataset used in the current study at a global scale from 2003 to 2017.
| Dataset | Scientific Data Set (SDS) Name | Contents |
|---|---|---|
| C061 MYD04 | Corrected_Optical_Depth_Land | DT over land |
| Deep_Blue_Aerosol_Optical_Depth_550_Land_Best_Estimate | DB over land | |
| AOD_550_Dark_Target_Deep_Blue_Combined | DB, DT, or their average | |
| AOD_550_Dark_Target_Deep_Blue_Combined_QA_Flag | Indicates the quality of pixels | |
| MYD13C1 | 1 km NDVI | 16-day NDVI |
| MCD12C1 | Majority_Land_Cover_Type_1 | land use cover |
| AERONET | Level 2.0 version 3 | AOD at 550 nm |
© 2019 by the authors. Licensee MDPI, Basel, Switzerland. This article is an open access article distributed under the terms and conditions of the Creative Commons Attribution (CC BY) license (http://creativecommons.org/licenses/by/4.0/).
Share and Cite
MDPI and ACS Style
Xu, W.; Wang, W.; Wu, L. New Regression Method to Merge Different MODIS Aerosol Products Based on NDVI Datasets. Atmosphere 2019, 10, 303. https://doi.org/10.3390/atmos10060303
AMA Style
Xu W, Wang W, Wu L. New Regression Method to Merge Different MODIS Aerosol Products Based on NDVI Datasets. Atmosphere. 2019; 10(6):303. https://doi.org/10.3390/atmos10060303
Chicago/Turabian StyleXu, Weiwei, Wei Wang, and Lixin Wu. 2019. "New Regression Method to Merge Different MODIS Aerosol Products Based on NDVI Datasets" Atmosphere 10, no. 6: 303. https://doi.org/10.3390/atmos10060303
Note that from the first issue of 2016, this journal uses article numbers instead of page numbers. See further details here.