Analysis of a Haze Event over Nanjing, China Based on Multi-Source Data


Key Laboratory of Aerosol and Cloud Precipitation Physics, Nanjing University of Information Science & Technology, Nanjing 210044, China
*
Author to whom correspondence should be addressed.
Atmosphere 2019, 10(6), 338; https://doi.org/10.3390/atmos10060338
Submission received: 22 May 2019
/
Revised: 12 June 2019
/
Accepted: 17 June 2019
/
Published: 20 June 2019
(This article belongs to the Special Issue Remote Sensing of Aerosols)
Abstract
:We analyzed a June 2018 Nanjing, China haze event using ground-based and spaceborne sensors, combined with sounding and HYSPLIT backward trajectory data, with the ground-based and spaceborne sensor data exhibiting good consistency. Water vapor content showed significant positive correlation with AOD (aerosol optical depth), and AOD measured in urban and industrial areas was much higher compared to other similar zones. The afternoon convection caused the aerosol uplift during the haze event. Higher aerosol concentration was detected below 2 km. Due to the summer afternoon convective movement, pollutants at high altitude were dominated by small particles, while the overall pollutant mix was dominated by mixed aerosols. During a stable period over June 11–18, a single, near-surface inversion layer, and occasional two inversion layers, stopped pollutant dispersal, with only very stable ocean air mass transport in the southeast direction available. The Air Quality Index drop which took place during June 28–30 was caused by two inversion layers, combined with the immigration of pollutants from inland air masses.
1. Introduction
Atmospheric aerosols are multiphase systems formed by solid and liquid particles, with diameters between 0.001–100 μm, suspended in the atmosphere [1]. Aerosols are an important part of the earth–atmosphere system despite the atmosphere’s low aerosol content [2]. Toxic substances contained in aerosols can cause diseases, endanger human health, and affect the radiation balance of the climate system [3,4]. To better understand the effect of aerosols, we need comprehensive observations and analyses of aerosol characteristics from ground-based [5,6,7] and spaceborne sensors [8,9,10].
In the past few decades, China has experienced rapid industrialization and urbanization, which has led to a sharp increase of aerosols and pollution, especially in eastern China [11,12,13,14,15]. In 2011 and 2012, Li et al. observed aerosol characteristics during two Beijing winter haze events, by using a sun photometer [16], and analyzed the aerosol compositions. Qin et al. studied a long-term haze event over Shijiazhuang from the end of 2013 to the beginning of 2014 [17]. They found that aerosol observations using a sun photometer, at 500 nm, were more accurate than results at other bands. Kang et al. studied aerosol optical property changes during a June 12, 2008, haze event in Nanjing [18] and found that the pollutants were dominated by industrial aerosols.
Nanjing, the capital of Jiangsu Province, is located in the middle and lower reaches of the Yangtze River, in the SW of Jiangsu Province, China, and is an important gateway city in the Yangtze River Delta. Nanjing is a cosmopolitan city, with well-developed industry and a large population—and has serious pollution issues [19]. Figure 1 is a map of Nanjing’s administrative divisions.
By focusing on the analysis of the ground pollution events using remote sensing equipment, we can improve understanding of pollution’s causes, and identify timely countermeasures to reduce its hazards.
From June 10–30 2018, a long-lasting summer haze event occurred in Nanjing. This study is dedicated to aerosol characterization by using ground-based (sun photometer, Mie-Lidar) and spaceborne (Moderate Resolution Imaging Spectroradiometer (MODIS) and Cloud-Aerosol Lidar and Infrared Pathfinder Satellite Observations (CALIPSO)) remote sensing instrumentation and data. In particular, vertical aerosol profiles were described, using Mie-Lidar and CALIPSO data. The haze event’s formation mechanism, and possible Nanjing summer pollutant sources, were also analyzed, based on sounding data and the Hybrid Single Particle Lagrangian Integrated Trajectory (HYSPLIT) backward trajectory model.
2. Instruments and Data
2.1. Sun Photometer and Spectral Extinction Method
A CIMEL CE-318 sun photometer is installed in Nanjing University of Information Science and Technology (NUIST) (118.7° E, 32.2° N). When it receives sunlight, a weak current is generated in the detector, and the current is transformed into a voltage signal through the amplifier. The required observation data can then be calculated according to the detected voltage signal value, using the data inversion algorithm (spectral extinction method) [20]. The basic principle of the spectral extinction method is to assume that the total optical depth of the atmosphere consists of three parts, including aerosol optical depth (AOD), atmospheric molecular optical depth and the optical depth of atmospheric absorbed gases, as shown in Equation (1).
In this formula, τaero(λ) represents atmospheric AOD, τR(λ) represents atmospheric molecular Rayleigh scattering optical depth, and τab(λ) represents the optical depth of atmospheric absorbed gases. Atmospheric molecules, including water, ozone, and oxygen, make a great contribution to atmosphere attenuation because of their absorption. In the visible band, water absorption is only considered at 936 nm, while in other bands, ozone absorption is mainly considered, and any effects of other gases, such as NO2 and CO2, are very small and can be ignored.
In addition to optical depth, a sun photometer can detect atmospheric water content. We used ASTP Win software, developed by CIMEL Co. Ltd., to inverse atmospheric data by ourselves. Our AOD data was level 1.5 which excluded the cloud data. To guarantee accuracy, we calibrated the sun photometer every year.
2.2. Ground-Based Lidar and the Fernald Method
A ground-based, Mie-Lidar, with a wavelength of 532 nm, is also installed in NUIST, at approximately the same geographic location as the sun photometer. In this study, we used the Fernald method, which divides lidar signals into those from air molecules and those from aerosols, for inversion of the lidar equation [21]. The total atmosphere extinction coefficient is the sum of the extinction coefficients for air molecules and for aerosols, and it is on this basis that the original Mie-scattering Lidar equation can be solved. If the extinction coefficients for aerosol particles and air molecules are known, for altitude Z0, the extinction coefficient for aerosols at altitudes below Z0 (backward integration) is given by Equation (2), and the coefficient for aerosols above Z0 (forward integration) is given by Equation (3).
In these formulae, X(Z) represents the distance correction signal, and S1 and S2 represents the scattering extinction ratios of aerosols and air molecules, respectively. Among them, S1 = σ1/β1, S2 = σ2/β2 = 8π/3. β1 represents the backscattering coefficient of aerosols, β2 represents the backscattering coefficient of air molecules. For stratospheric and tropospheric aerosols, the scattering extinction ratio can be set to 50, at 532 nm [22], which means that the scale spectrum and chemical compositions of aerosols do not change with altitude, and that the change in scattering characteristics is only due to their changed density with altitude [23]. The extinction coefficient in the vertical direction can be obtained by using the formulae above, and the total aerosol optical depth can be obtained by integrating and summing them separately. Due to ground-based Lidar’s limited detection range, the echo signal at high altitude may be distorted, so therefore the height of the minimum echo signal value below 8 km is generally taken as the reference height, Z0, in order that the aerosol optical depth for a certain height range can be obtained by calculating backward integration only [24].
2.3. MODIS Aerosol Products
MODIS is one of the important sensors present on both the Terra (launched on December 18, 1999) and Aqua (launched on May 4, 2002) satellites, which transit the study site daily at 10:30 and 13:30 respectively. MODIS can provide irradiance on 36 channels, ranging from 0.145–14.365 microns—that is, from the visible to the infrared bands. The MODIS scanning width is 2330 km, the scanning period is 1.477 s, and the sub-satellite point spatial resolution is 250 m, 500 m, and 1000 m, covering almost the whole world [25].
MODIS has 44 standard data products. In this study, aerosol data from the 550 nm band, and aerosol characteristic information retrieved from these data, have been used.
2.4. CALIPSO and Vertical Aerosol Characteristic Data
In 1998, NASA and the French National Centre for Space Studies (CNES) cooperated to implement the CALIPSO (Cloud-Aerosol Lidar and Infrared Pathfinder Satellite Observations) program [26]. The signals received by the spaceborne Lidar CALIOP (a two-wavelength polarization-sensitive lidar that provides high-resolution vertical profiles of aerosols and clouds), which is installed on the CALIPSO satellite, can provide five levels of data, including Levels 0, 1A, 1B, 2, 3, and 4 data, after being processed by a data processing system similar to EOS (Earth Observation Satellite). The CALIPSO transit time in Nanjing is 13:27, Beijing time, and the satellite cycle length is 16 days. The CALIPSO track map for its transit over Nanjing is shown in Figure 2, with Nanjing location represented by the colored dot.
In this study, the level 2 aerosol profile product (L2Apro), and the CALIOP vertical feature mask (L2VFM) product were mainly used. L2APro can provide vertical extinction coefficient profiles, and on this basis, aerosol polarization and color ratios can be further calculated. The polarization ratio, which identifies particle shape characteristics, is larger in aspheric particles than in spherical particles [27]. We can obtain the polarization ratio by calculating the ratio of the vertical attenuated backscattering coefficient (at 532 nm) over the parallel attenuated backscattering coefficient (also at 532 nm). The formula for calculating the polarization ratio is expressed in Equation (4).
The color ratio—which characterizes particle size—is obtained by calculating the ratio between the total attenuated backscattering coefficient at 1064 nm and the total attenuated backscattering coefficient at 532 nm. The larger the color ratio is, the larger the particle size, and conversely, the larger the particle size, the larger its color ratio; the formula for calculating the color ratio is expressed in Equation (5).
The aerosol classification method, given by Liu et al. [28,29], defines atmospheric molecules as having backscattering coefficients between 0–8 × 10⁻⁴ km−1·sr−1; aerosols with coefficients between 8 × 10⁻⁴ km−1·sr−1 and 4.5 × 10⁻³ km−1·sr−1; and clouds between 4.5 × 10⁻³ km−1·sr−1 and 1 × 10⁻² km−1·sr−1 (all at 532 nm). Spherical aerosols are defined as having volume depolarization ratios < 0.06, while aspheric aerosols have ratios > 0.06. We use a critical color ratio value of 0.5 to separate aerosol particles by size. The classification criteria for clean, sand-dust, ocean, pollution, and smoke-dust aerosol classes are defined as shown in Table 1.
CALIOP vertical feature mask (VFM) is a level 2 product, which can classify aerosols and clouds according to differences in their physical characteristics [30]; atmospheric features are initially classified into either clouds or aerosols, then the clouds and aerosols are further separated, into different sub-categories [31]. Since under certain conditions the inherent scattering characteristics for dust are similar to those for clouds, dense dust aerosols may be misclassified as clouds, in the VFM product, although, as dust is generally located near the ground, it can be distinguished based on height.
3. Data Processing and Results
3.1. Overview of the Haze Event
The daily air quality index (AQI) given by Nanjing environmental monitoring station is shown in Figure 3, where it can be seen that, between June 10–30 2018, Nanjing was in a slight pollution state, for approximately half of the time. On June 18, 21 and 29, Nanjing air quality approached the moderate pollution state, while the number of days with excellent air quality was only 1, and the AQI exhibited a strong change over the period June 28–29. The error bars represent standard error of hourly AQI data in the same day. It can be seen that the haze was relatively stable, lasting for more than 20 days.
Daily average AODs captured with different instrumentation were compared, using MODIS Level 3 aerosol products, the CALIPSO Level 2 Alay product, CE-318 sun photometer data, and ground-based Mie-Lidar data, as shown in Table 2. As the CE-318 sun photometer directly measures the solar radiation value, in principle, the AOD measured by the CE-318 sun photometer is accurate, and can be used as the benchmark value [32]. During this haze event, we only obtained data on the dates listed in Table 2. As the ground-based Mie-Lidar wavelength is 532 nm, in order to match each instrument’s wavelength as closely as possible, we selected MODIS data from the 550 nm band, and sun photometer data from the 500 nm band.
It can be seen that the results from the ground-based and spaceborne sensors showed good consistency. The relative difference between MODIS and the sun photometer was between 4.1–55.7%, while that between the ground-based Mie-Lidar and the sun photometer was between 8.1–31.1%. The minimum AOD measured by the ground-based Mie-Lidar was due to solar light interference during the day, which resulted in the limited integrated Lidar distance. Under normal circumstances, the daytime AOD can only be calculated using the ground-based Mie-Lidar data below 4 km, and the AOD is the integral of the extinction coefficient with distance. Therefore, the AOD measured by the ground-based Mie-Lidar during the daytime is only the optical depth near the ground, and excludes aerosols at higher altitude, while the optical depth measured by the sun photometer includes the whole air column. When measuring AOD, MODIS cannot distinguish between clouds and aerosols, which results in higher AOD results than those obtained by either the ground-based Mie-Lidar, or the sun photometer.
In theory, the data from sun photometer is more accurate than that from other remote sensing equipment. Plots comparing AOD and vapor variation, as measured by the sun photometer, are shown in Figure 4, where it can be seen that AOD had a very significant positive correlation with atmospheric water content; on one hand, water vapor increase is favorable to new aerosol formation—when the relative humidity is more than 70%, the increased water content results in aerosol particles. The scattering efficiency of secondary inorganic aerosols (such as sulfate and nitrate) [33,34], and the absorption efficiency of aged aerosols coated with black carbon [35] also increased greatly. On the other hand, due to the existence of the SE monsoon in summer, in Nanjing, an ocean air mass transport exists; this can not only bring abundant vapor, which is beneficial to the formation of local aerosols, but also some sea salt aerosols. Together, these two factors lead to a synchronous AOD and water content change in Nanjing in summer.
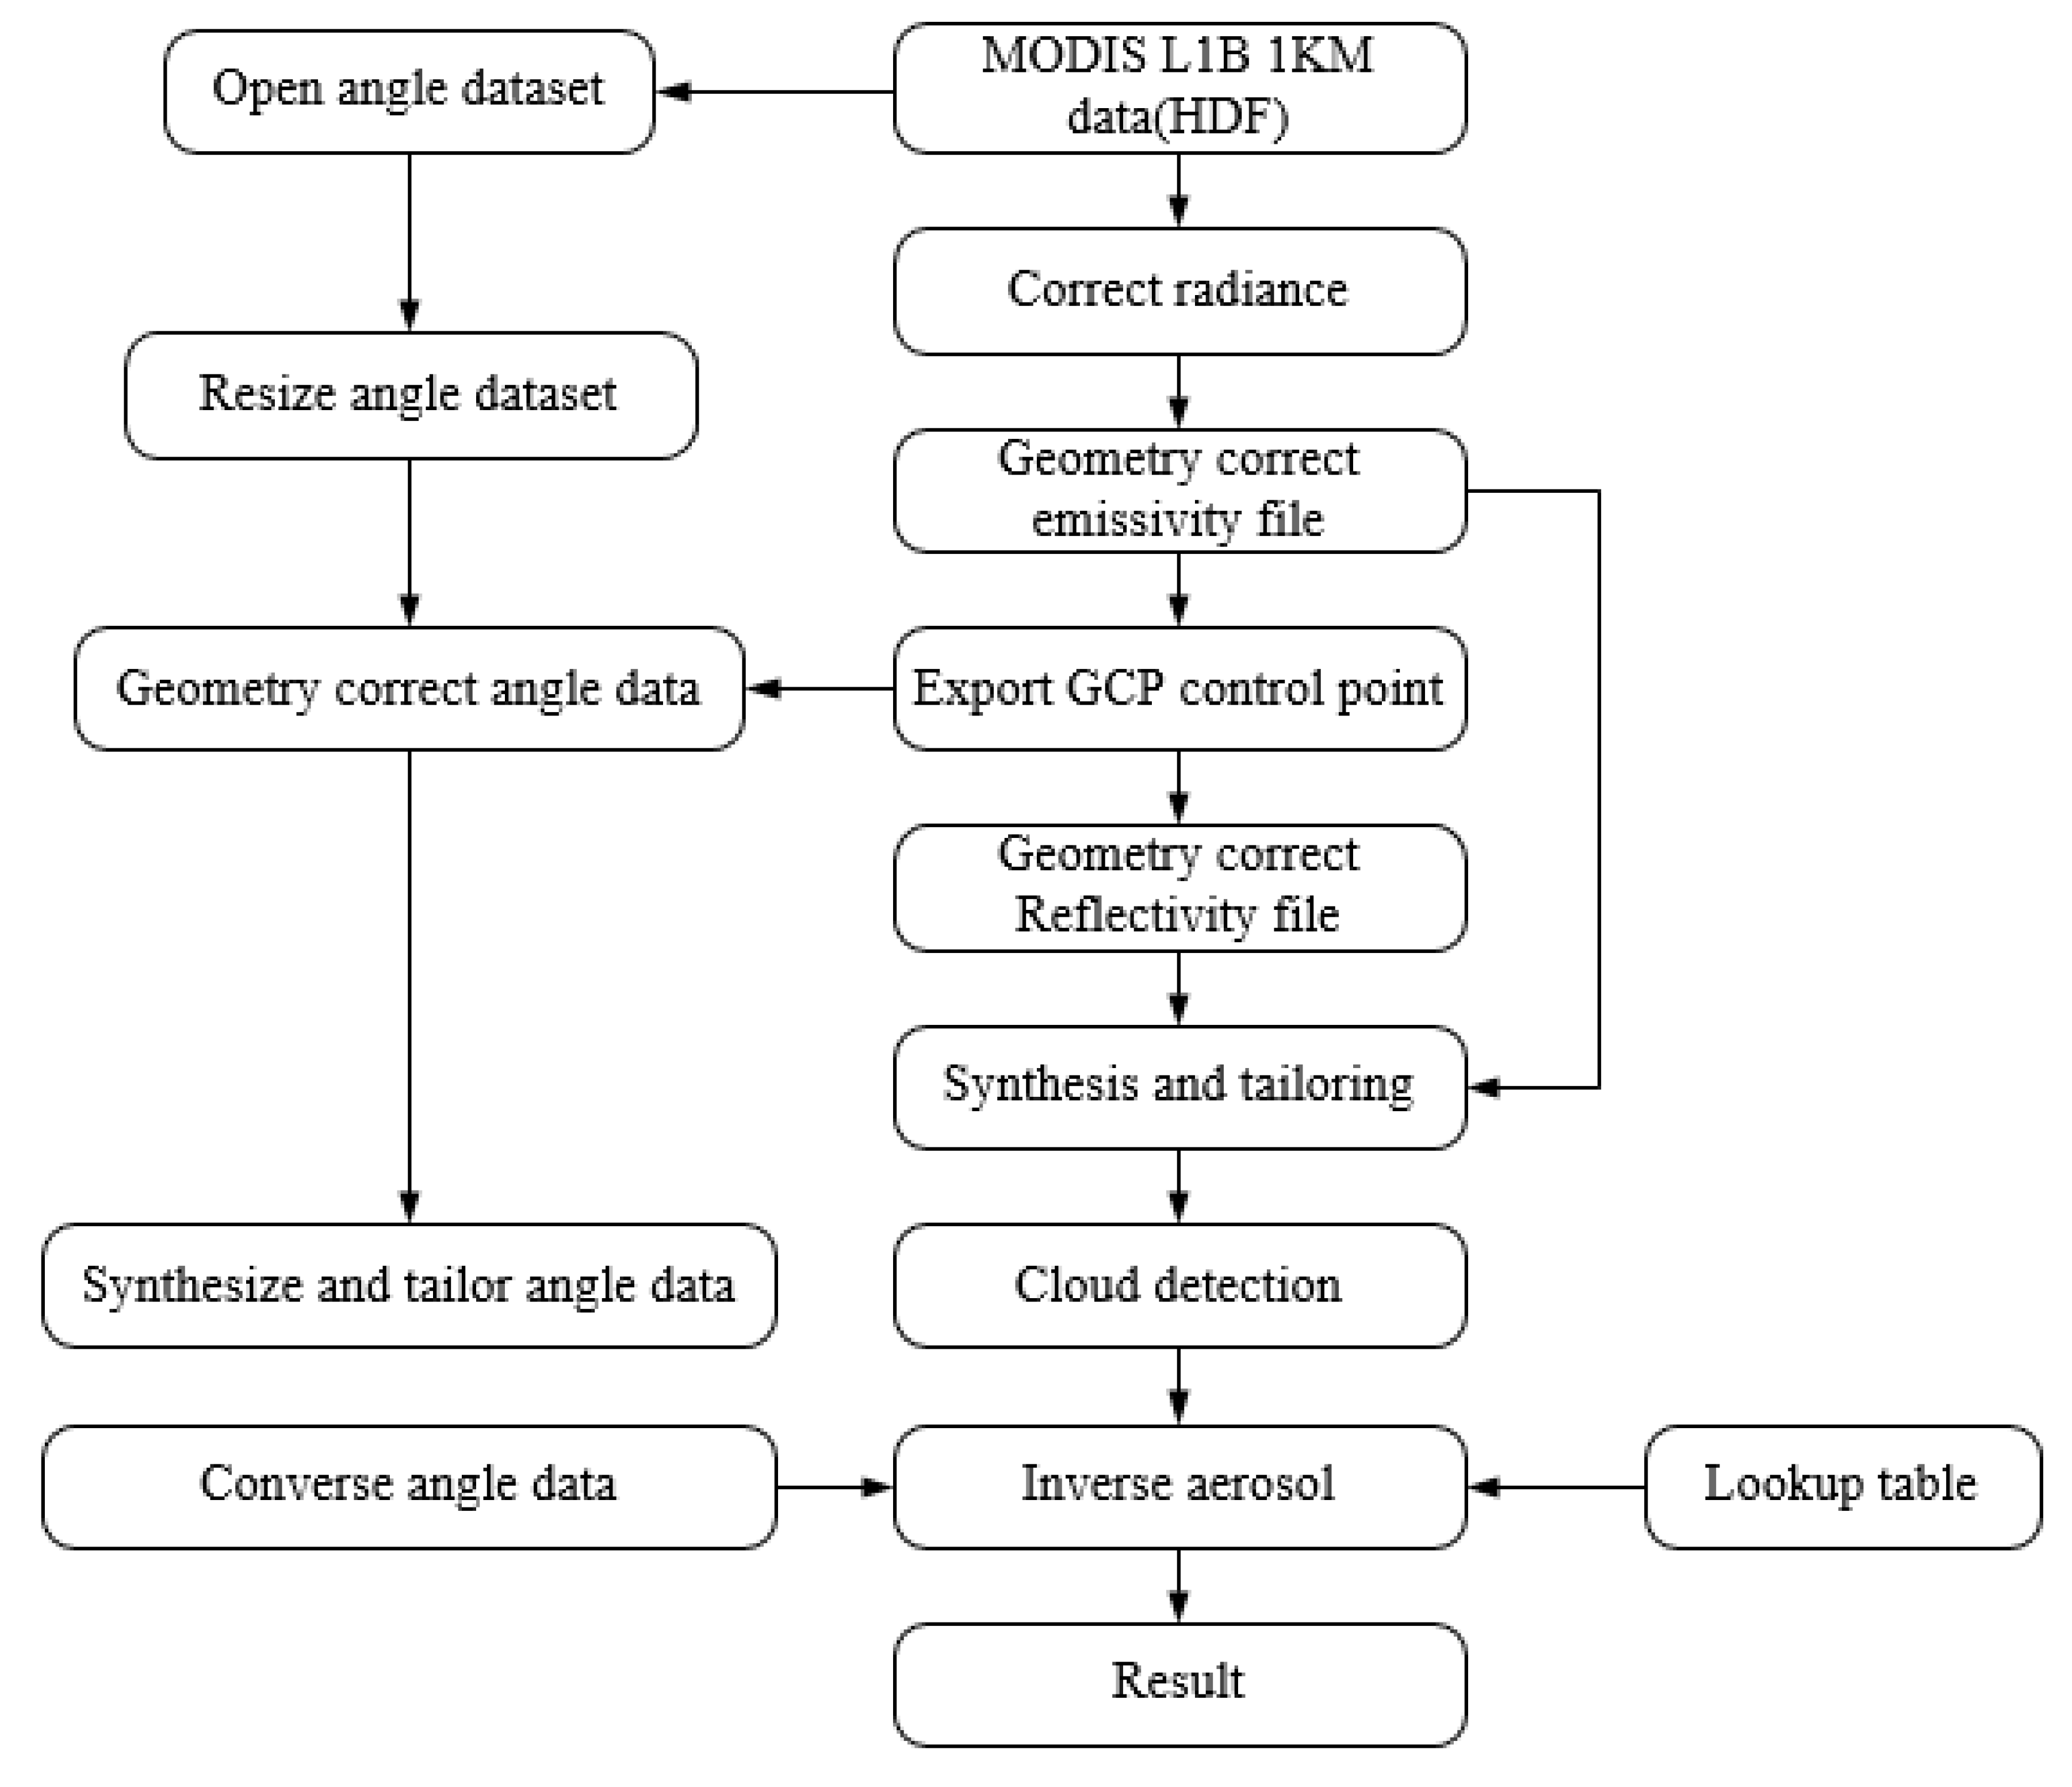
Moreover, the refined AOD distribution can be inverted, by using the MODIS Level 1B, calibrated radiances product (MOD021KM). Research shows that the 1 km-resolution, AOD distribution retrieved by this algorithm has the same macro trend as the MODIS 10 km AOD product, while reflecting small-scale AOD changes better [36]. This algorithm uses the classic dark pixel method (DDV), also known as the dense vegetation method. This has a poor effect on AOD inversion in winter, and water body AODs inverted by this algorithm exhibit higher than normal values [37]. The specific inversion process is shown in Figure 5.
Data for clear skies and few clouds were selected, by screening MODIS L1B data from June 10–30, and the DDV algorithm was applied for aerosol inversion. The AOD distribution in the Nanjing area was obtained by averaging the inversion data for the selected time, as shown in Figure 6. Since the water body AOD obtained by the DDV algorithm was higher, the bright red zone in the middle of the figure is the Yangtze River, and the high value zone, at 35 °N and 118.95 °E, is Shijiu Lake in Lishui District, Nanjing. Generally speaking, the AOD in the Pukou and Liuhe districts was high, between 0.5 and 1, which was due to industrial development and the presence of numerous factories in these two districts. The city center AOD was around 0.5 because the population of the city center is dense, with a high volume of traffic. This is also consistent with the findings from Chen’s research [38], in that AOD is closely related to population density and vehicle emissions. At the same time, AOD at the Sun Yassin Mausoleum and Laoshan was low, near 0.25, as there are fewer people and motor vehicles in this area, the vegetation is dense and the greenery is better, and thus the air quality is better. It was found that the NUIST (118.7° E, 32.2° N) AOD was 0.5, which was a more accurate result than the original, 10 km-resolution AOD, according to Table 2.
3.2. Analysis of a Single Day Case
Data from June 29 was selected for single day analysis. The main reason for selecting this date was that the AQI variation occurred from June 28 to June 29, Nanjing was slightly polluted (even near moderately polluted) on June 29, and the ground-based Mie-Lidar data quality for this date was good. The second reason was that CALIPSO transited Nanjing at 13:27 Beijing time on this day, thus providing suitable aerosol characteristic vertical distribution data.
Figure 7 is the time sequence diagram of extinction coefficients retrieved by ground-based Mie-Lidar, on June 29, after removing the near-ground signal. Figure 8 is the time sequence diagram of Angstrom Exponent (AE) in Nanjing on the same day, based on MODIS. Ground-based Mie-Lidar is affected by geometric overlap factors, so the low-altitude signal was not usable, and data analysis was carried out after removing the signal below 400 m. It can be seen from Figure 7 that the extinction coefficient at 1.5 km was very high, which meant aerosol particles were present. The altitude of the boundary layer was also 1.5 km. It can be observed that some small haze particles, at 0.6 km altitude in the lower layer, were elevated to the aerosol layer, at 1.5 km altitude, at about 10:00. This was brought about by the strong summer convective activity, and the large number of particles converging at 1.5 km altitude, in combination with small particles, gave rise to the high extinction coefficient (some particle extinction coefficients reached 0.4 / km and above).
It could be seen that there were scattered high extinction coefficient points above 2 km in the afternoon, and with the passage of time, fewer and fewer particles were gathered at 1.5 km, which was due to the continual rise on thermals of some of the 1.5 km altitude particles. In combination with Figure 8, it can be seen that the small aerosol particles were lifted up to high altitude in the afternoon, while the large particles remained near the ground (mainly below 0.5 km). This resulted in the continuous increase in the proportion of small aerosol particles at high altitude, which was reflected in the continuous AE increase.
After 17:30, convective activity weakened, large particles at high altitude settled back to the ground due to gravity, and AE continued to rise. However, the relative humidity in summer early morning is high [39], and during this period, aerosols absorbed moisture, particle sizes became larger, and AE decreased.
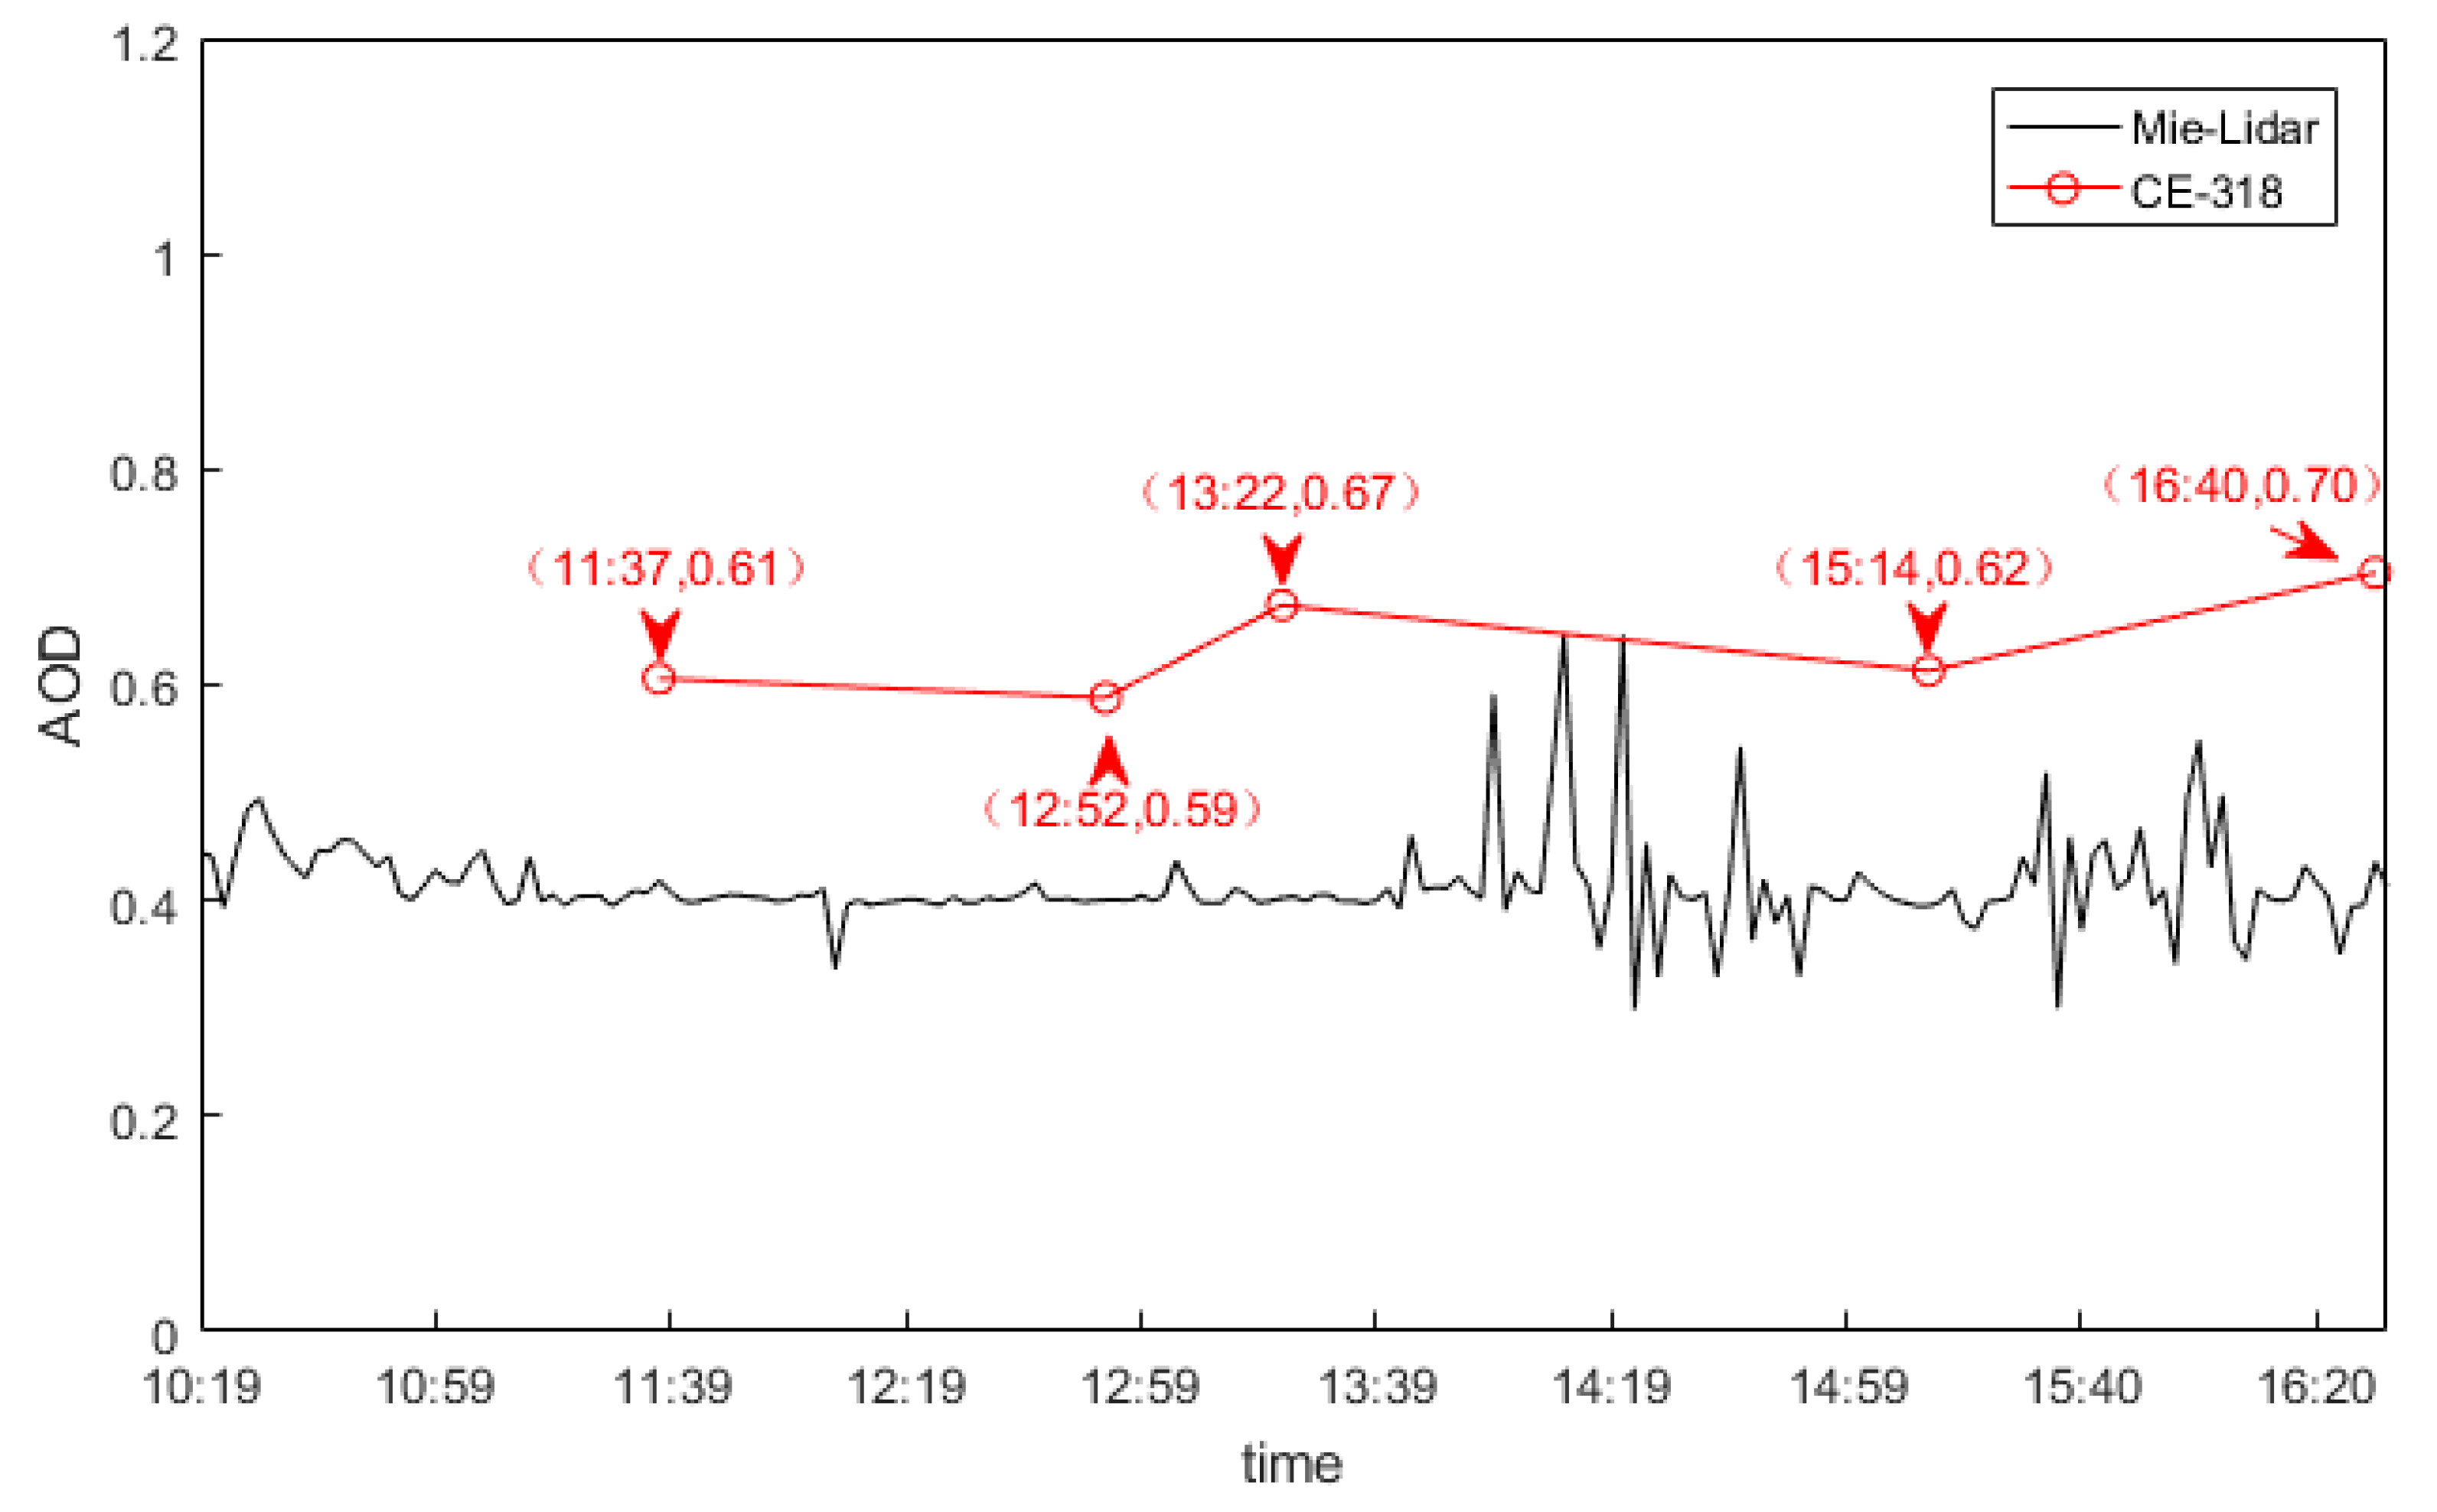
By integrating the extinction coefficient within 4 km, the AOD below 4 km was obtained, as shown in Figure 9, where the black line represents the AOD time-varying curve retrieved from the ground-based Mie-Lidar, at the 532 nm band, and the red line represents the AOD time-varying curve retrieved by the CE-318 sun photometer at the 500 nm band. When calculating AOD with the data of lidar, we removed the data of blind area near the ground. Generally speaking, AOD was stable on that day. The AOD retrieved by the sun photometer fluctuated around 0.7, while the AOD retrieved from the ground-based, Mie-Lidar fluctuated around 0.5, giving a difference of approximately 0.2, which was due to ground-based Lidar’s limited integration distance and blind area [40,41]. It can be seen that the AOD retrieved by the ground-based Mie-Lidar fluctuated in the afternoon, which was caused by convective motion, and instability in the associated aerosol particle aggregation.
The extinction coefficient profile for CALIPSO transiting through Nanjing at 13:27 local time was analyzed and compared with the extinction coefficient profile retrieved by ground-based Mie-Lidar at the same time, as shown in Figure 10a. Vertical profiles with simultaneous polarization ratios, and color ratios retrieved from the CALIPSO L2APro product are shown in Figure 10b,c, respectively. Standard errors of extinction coefficient, polarization ratio and color ratio at each altitude were calculated by processing all profiles in Nanjing from CALIPSO. The errors were not large, which indicated that there was no significant difference in aerosol characteristics between different regions in Nanjing. According to Figure 10a, although the CALIPSO extinction coefficient profile was not completely consistent with the ground-based Mie-Lidar, it still had sufficient accuracy to allow determination of the boundary layer height. The high extinction coefficient appeared at 1–1.5 km altitude, which corresponded to the aerosol particle concentration at 1 km altitude, in Figure 7. The high extinction coefficient near the ground was caused by low-altitude signal interference. According to Figure 10b,c, the polarization and color ratios varied greatly, below 2 km, and the degree of sphericity and the particle sizes differed, indicating that the pollution was dominated by mixed aerosols, on the whole, which could be classified using the information from Table 1. The color ratios below 0.4 km were bigger than 0.5, and the polarization ratios below 0.4 km were also bigger than 0.5, which is to say that the pollutants were mainly sand-dust aerosols below 0.4 km. Above 0.4 km, color ratios could be very small, and polarization ratios fluctuated greatly, which is to say that the main pollutants were mixed ocean aerosols and dust aerosols. Building dust was one of the reasons why sand-dust aerosols dominated at low altitude. The overall pollutant mix was dominated by mixed aerosols.
CALIPSO is a polar satellite, and we can analyze the aerosol data along its orbit. Figure 11 is the vertical signal feature classification map, based on L2VFM products, and it can be seen that there was a clear cloud signal, at 11 km altitude in the Nanjing area, which resulted in a weak echo signal at low altitude [42]. The aerosol altitude over Nanjing and its surrounding areas basically stayed at approximately 2 km, with some aerosols rising to approximately 3 km, which was consistent with the ground-based Mie-Lidar observations.
3.3. Analysis of Sounding Data and HYSPLIT Backward Trajectory Data
Temperature profiles varying with altitude were drawn, based on the Nanjing station sounding data for 08:00 and 20:00. Two time periods are selected for this analysis, including one from June 11–18, as shown in Figure 12. It can be seen from the figure that, during this period, air stratification in the Nanjing area was stable, the pollution was stable, and so was the AQI, at approximately 130. From June 11–14, at both 08:00 and 20:00, there was only one inversion layer, at 1–2 km altitude. The existence of a single, near-surface inversion layer ensured the accumulation of pollutants, and, as expected, the pollutants were concentrated below 2 km. From June 15–18, two inversion layers existed, with the second inversion layer appearing at about 2.5 km altitude. The two inversion layers meant that the pollutants could not diffuse vertically through the atmosphere, and so the pollutants continuously accumulated [43]. Only one inversion layer existed at 20:00 from June 15–17, and its height was extremely low, at approximately 0.2 km from the ground, and this very low inversion layer further exacerbated the pollution phenomenon. The temperature stratification curve for 20:00 on June 18 shows that there was no inversion layer then, the vertical movement of the atmosphere was enhanced, and as a result, the air quality improved. On June 19, Nanjing air quality was good.
The second period was from June 28–30, as shown in Figure 13. The AQI jumped from 38 on June 28, to 137, on June 29—and then suddenly dropped to 60, on June 30. As can be seen from the figure, there was no inversion layer over Nanjing in either the morning or evening of June 28, so the vertical movement of the atmosphere was strong, which resulted in there being no pollutant accumulation, and, therefore, excellent air quality. However, at 08:00 on June 29, two inversion layers appeared near the ground, at 1 km and 3 km altitude, and, these layers caused pollutant accumulation by the mechanism explained above. As the pollution could not diffuse away via convection, the air quality deteriorated sharply—and then, by 20:00, the inversion layer near the ground had disappeared, leaving only a single inversion, at 3 km. At this time, the convection motion below 3 km increased and the pollutants started to disperse, until June 30, when there was no inversion layer, the air quality improved significantly.
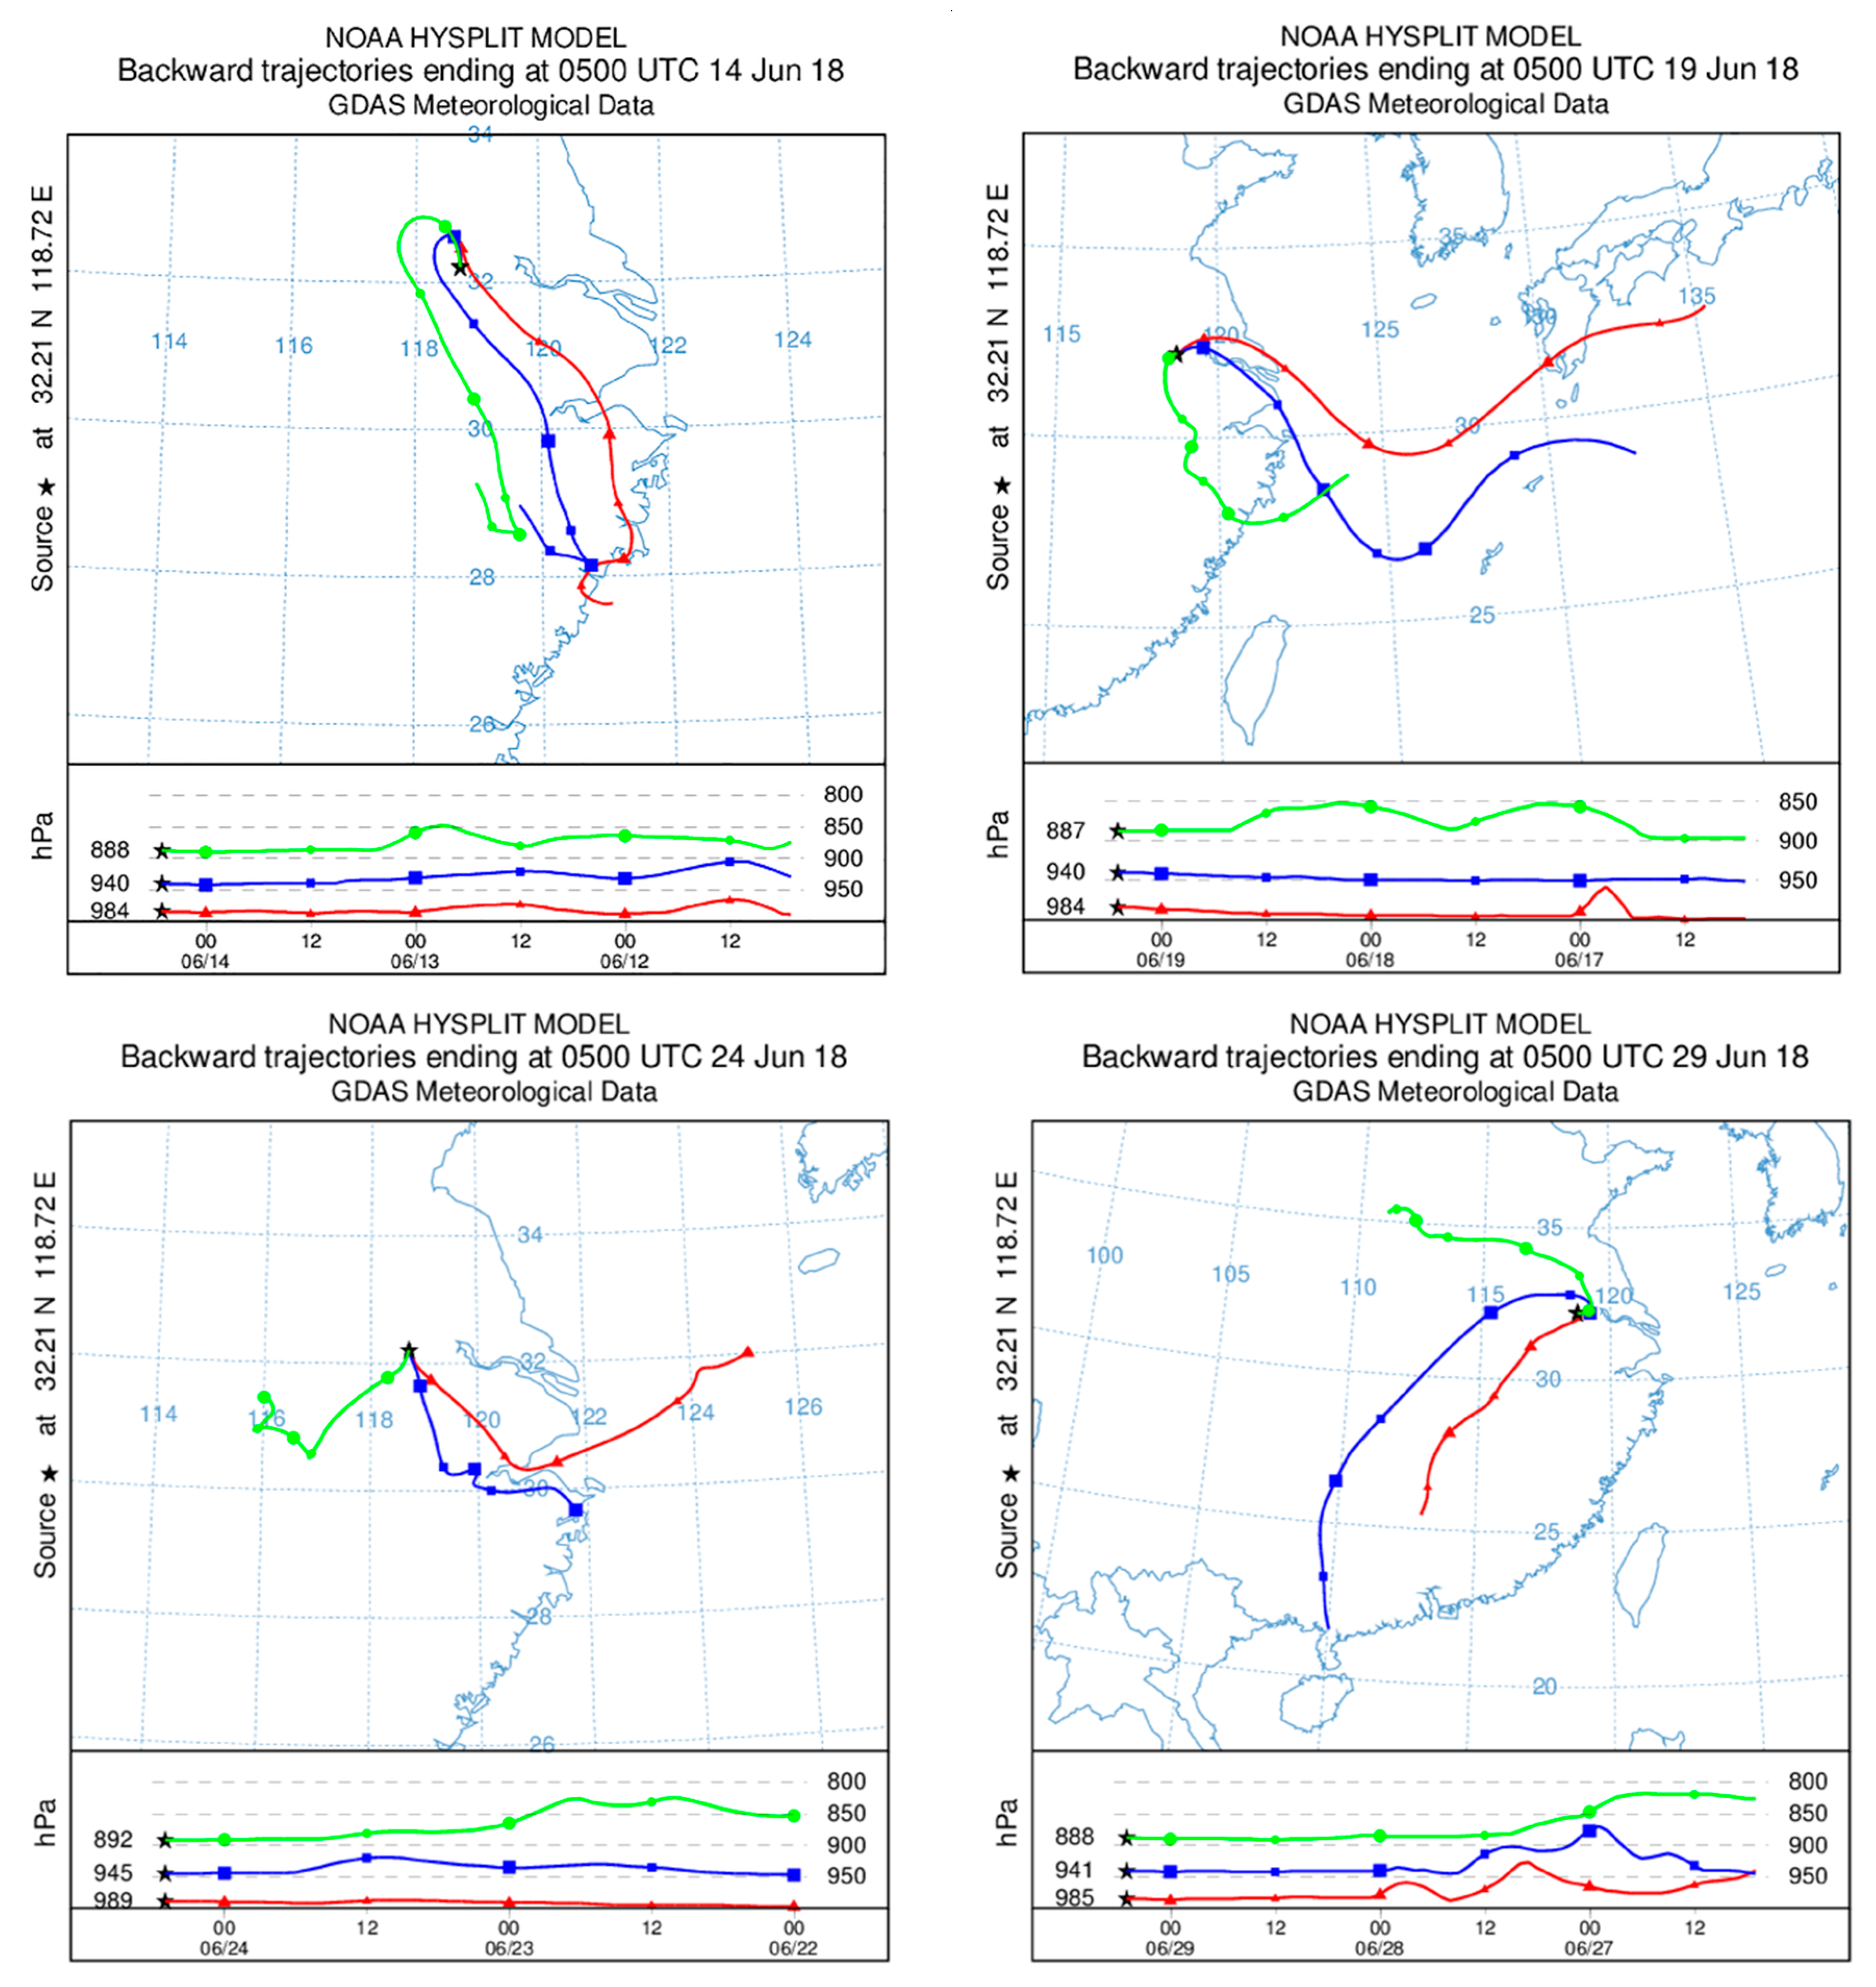
Using the HYSPLIT backward trajectory model, and taking NUIST as the starting point, 72 h backward trajectory analyses were carried out, from 13:00 on June 14th, 19th, 24th, and 29th respectively, with this time span basically covering the entire haze event, as shown in Figure 14.
By analyzing the backward trajectory for June 14, it could be seen that there were air masses transmitting from the SE to Nanjing at all three altitudes, as well as the backward trajectory for June 19, when there were ocean air masses from the E, at all three altitudes. It was noted that during the period June 11–18, the Nanjing AQI was stable, at approximately 130, as there was only SE air mass transport into Nanjing during this period, which was relatively stable.
Ocean air masses can not only bring a lot of vapor, but also many oceanic aerosols. The backward trajectory from June 24 showed air mass transport from two opposite directions. At 800 hPa altitude, aerosols transported from Nanjing and surrounding industrial areas (Anhui Province and other places) could be seen. The length of the backward trajectory was short, which indicated that the air mass moved slowly. At 900 hPa altitude, there was still only the ocean air mass transport, and due to the massive transport of ocean air masses during this period, a large amount of vapor was brought to Nanjing. The day before, the Nanjing AQI was 40, indicating excellent air quality, however on June 29, the AQI rose sharply, to 140, indicating that the air quality was close to the definition for moderate pollution. According to the backward trajectory of June 29, air masses were transmitting from the inland direction at all three altitudes. At 800 hPa altitude, the air mass from the NW moved slowly, and there was pollutant transport from the Nanjing Jiangbei Industrial Zone and from Shandong Province [44]. At 900 hPa altitude, there was also long-range air mass transport from the SW, which brought many aerosols and haze particles. In addition, two inversion layers occurred in Nanjing on 29 June, and these two factors combined to cause the sharp increase in the Nanjing AQI on June 29.
4. Conclusions
The June 2018 Nanjing haze event has been analyzed in this study, using multi-source data. While the data from ground-based and spaceborne sensors showed good consistency, the AOD observed by the ground-based Mie-Lidar was lower, due to the integral distance and geometric overlap factors. The vapor content during the haze event was found to have a significant positive correlation with AOD. Through refined analysis, we found that the urban area and Industrial Zone AODs were much higher than for other regions, and that the AOD calculated with this method was more accurate than the AOD derived using the original MODIS product. The ground-based Mie-Lidar observation result showed that aerosol particles over Nanjing were elevated by afternoon convection, although they were basically concentrated below 2 km, which was consistent with the CALIPSO results. The CALIPSO and ground-based Mie-Lidar extinction coefficient profiles also exhibited good consistency, and the CALIPSO VFM product accurately reflected aerosol heights. Because of the strong summer afternoon convective movement, many small particles were lifted to higher altitudes, with CALIPSO color ratio analysis showing that the color ratio at high altitude was small, indicating that the particle sizes were small, which was consistent with the MODIS Angstrom Exponent. Applying the classification criteria for aerosol type based on polarization ratio, there were mixed aerosols over Nanjing.
Temperature stratification and air masses transport were analyzed, using sounding data and the HYSPLIT backward trajectory model, and it was found that the long-term and stable haze event was due to the existence of a near-surface inversion layer—and occasional two inversion layers—which hindered vertical diffusion of the pollutants. During this stable period, only the SE ocean air mass movement existed, and the air mass transport was stable. The results also showed that the sudden emergence of two inversion layers, coupled with the transport of haze particles from inland air masses, could lead to a sharp deterioration of air quality.
Author Contributions
Conceptualization, Y.Z. and L.B.; Formal analysis, Y.Z.; Methodology, J.W.; Resources, J.W.; Writing—original draft, Y.Z.; Writing—review & editing, L.B.
Funding
This research was funded by National Natural Science Foundation of China (41675133) and National Natural Science Foundation of China (41705009).
Acknowledgments
MODIS and CALIOP data are available at NASA’s Earth Observing Data and Information System Website (https://search.earthdata.nasa.gov/search?fst0=Atmosphere). Sounding data are available at the University of Wyoming Website (http://weather.uwyo.edu/upperair/sounding.html).
Conflicts of Interest
The authors declare no conflict of interest.
References
- Wang, M.X. Aerosol and Climate. J. Clim. Environ. Stud. 2000, 5, 1–5. (In Chinese) [Google Scholar]
- Mao, J.T.; Zhang, J.H.; Wang, M.H. A review of atmospheric aerosols in China. J. Meteorol. 2002, 5, 625–634. (In Chinese) [Google Scholar]
- Kang, C.M.; Lee, H.S.; Kang, B.W.; Lee, S.K.; Sunwoo, Y. Chemical characteristics of acidic gas pollutants and PM2.5 species during hazy episodes in Seoul, South Korea. Atmos. Environ. 2004, 38, 4749–4760. [Google Scholar] [CrossRef]
- Charlson, R.J.; Langner, J.; Rodhe, H. Perturbation of the northern hemisphere radiative balance by backscattering from anthropogenic sulfate aerosols. Chem. Phys. Meteorol. 1991, 43, 152–163. [Google Scholar] [Green Version]
- Dubovik, O.; Smimov, A.; Holben, B.N. Accuracy assessments of aerosol optical properties retrieved from Aerosol Robotic Network (AERONET) sun and sky radiance measurements. J. Geophys. Res. 2000, 105, 9791–9806. [Google Scholar] [CrossRef]
- O’neil, N.T.; Eck, T.F.; Holben, B.N. Optical properties of boreal forest fire smoke derived from sun photometry. J. Geophys. Res. 2002, 107, AAC 6-1–ACC 6-19. [Google Scholar]
- Che, H.Z.; Shi, G.; Uchiyama, A. Intercomparison between aerosol optical properties by a PREDE sky radiometer and CIMEL sun photometer over Beijing, China. Atmos. Chem. Phys. 2008, 8, 3199–3214. [Google Scholar] [CrossRef]
- Campbell, J.R.; Reid, J.S.; Westphal, D.L. Characterizing the vertical profile of aerosol particle extinction and linear depolarization over Southeast Asia and the Maritime Continent: The 2007–2009 view from CALIOP. Atmos. Res. 2013, 122, 520–543. [Google Scholar] [CrossRef]
- Bourgeois, Q.; Ekman, A.M.L.; Krejci, R. Aerosol transport over the Andes from the Amazon Basin to the remote Pacific Ocean: A multiyear CALIOP assessment. J. Geophys. Res. Atmos. 2015, 120, 8411–8425. [Google Scholar] [CrossRef]
- Huang, J.; Guo, J.; Wang, F. CALIPSO inferred most probable heights of global dust and smoke layers. J. Geophys. Res. Atmos. 2015, 120, 5085–5100. [Google Scholar] [CrossRef]
- Li, S.; Ma, Z.; Xiong, X.; Christiani, D.C.; Wang, Z.; Liu, Y. Satellite and Ground Observations of Severe Air Pollution Episodes in the Winter of 2013 in Beijing, China. Aerosol Air Qual. Res. 2016, 16, 977–989. [Google Scholar] [CrossRef] [Green Version]
- Shang, H.; Chen, L.; Letu, H.; Zhao, M.; Li, S.; Bao, S. Development of a daytime cloud and haze detection algorithm for Himawari-8 satellite measurements over central and eastern China. Geophys. Res. 2017, 122, 3528–3543. [Google Scholar] [CrossRef]
- Guo, J.P.; He, J.; Liu, H.L.; Miao, Y.C.; Liu, H.; Zhai, P.M. Impact of various emission control schemes on air quality using WRF-Chem during APEC China 2014. Atmos. Environ. 2016, 140, 311–319. [Google Scholar] [CrossRef]
- Qin, K.; Rao, L.; Xu, J.; Bai, Y.; Zou, J.; Hao, N.; Li, S.; Yu, C. Estimating ground level NO2 concentrations over central-eastern china using a satellite-based geographically and temporally weighted regression model. Remote Sens. 2017, 9, 950. [Google Scholar] [CrossRef]
- Qin, K.; Wu, L.; Wong, M.S.; Letu, H.; Hu, M.; Lang, H.; Sheng, S.; Teng, J.; Xiao, X.; Yuan, L. Trans-boundary aerosol transport during a winter haze episode in China revealed by ground-based Lidar and CALIPSO satellite. Atmos. Environ. 2016, 141, 20–29. [Google Scholar] [CrossRef] [Green Version]
- Li, Z.; Gu, X.; Wang, L.; Li, D.; Xie, Y.; Li, K.; Dubovik, O.; Schuster, G.; Goloub, P.; Zhang, Y.; et al. Aerosol physical and chemical properties retrieved from ground-based remote sensing measurements during heavy haze days in Beijing winter. Atmos. Chem. Phys. 2013, 13, 10171–10183. [Google Scholar] [CrossRef] [Green Version]
- Qin, K.; Wang, L.; Wu, L.; Xu, J.; Rao, L.; Letu, H.; Shi, T.W.; Wang, R.F. A campaign for investigating aerosol optical properties during winter hazes over Shijiazhuang, China. Atmos. Res. 2017, 198, 113–122. [Google Scholar] [CrossRef]
- Kang, N.; Kumar, K.R.; Yu, X.; Yin, Y. Column-integrated aerosol optical properties and direct radiative forcing over the urban-industrial megacity Nanjing in the Yangtze River Delta, China. Environ. Sci. Pollut. Res. 2016, 23, 17532–17552. [Google Scholar] [CrossRef] [PubMed]
- Wang, H.; Cao, N.W.; Wang, P.; Yan, P.; Yang, S.B.; Xie, Y.H.; Sun, H.B.; Jing, Q.Q. Comprehensive observation and analysis of atmospheric aerosols in Nanjing. J. Remote Sens. 2017, 1. (In Chinese) [Google Scholar] [CrossRef]
- Schmid, B.; Wehrli, C. Comparison of sun photometer calibration by use of the Langley technique and the standard lamp. Appl. Opt. 1995, 34, 4500–4512. [Google Scholar] [CrossRef] [PubMed]
- Fernald, F.; Herman, B.; Reagan, J. Determination of aerosol height distribution by lidar. J. Appl. Meteorol. 1972, 11, 482–489. [Google Scholar] [CrossRef]
- Tamio, T.; Yasuhiro, S. Ratio of aerosol backscatter to extinction coefficients as determined from angular scattering measurements for use in atmospheric lidar applications. Opt. Quantum Electron. 1987, 19, 293–302. [Google Scholar]
- Yasuhiro, S. Tropospheric aerosol extinction coefficient profiles derived from scanning lidar measurements over Tsukuba, Japan, from 1990 to 1993. Appl. Opt. 1996, 35, 4941–4952. [Google Scholar] [Green Version]
- Xia, J.R. Detection of Atmospheric Aerosol Radiation Characteristics by Lidar. Ph.D. Thesis, Lanzhou University, Lanzhou, China, 2006. (In Chinese). [Google Scholar]
- Remer, L.A.; Kaufman, Y.J.; Tanré, D.; Mattoo, S.; Chu, D.A.; Martins, J.V.; Li, R.-R.; Ichoku, C.; Levy, R.C.; Kleidman, R.G.; et al. The MODIS Aerosol Algorithm, Products, and Validation. J. Atmos. Sci. 2005, 62, 947–973. [Google Scholar] [CrossRef] [Green Version]
- Omar, A.H.; Winker, D.M.; Vaughan, M.A.; Hu, Y.; Trepte, C.R.; Ferrare, R.A.; Lee, K.-P.; Hostetler, C.A.; Kittaka, C.; Rogers, R.R.; et al. The CALIPSO automated aerosol classification and lidar ratio selection algorithm. J. Atmos. Ocean. Technol. 2009, 26, 1994–2014. [Google Scholar] [CrossRef]
- Winker, D.M.; Vaughan, M.A.; Omar, A.; Hu, Y.; Powell, K.A.; Liu, Z.; Hunt, W.H.; Young, S.A. Overview of the CALIPSO Mission and CALIOP Data Processing Algorithms. J. Atmos. Ocean. Technol. 2009, 26, 2310–2323. [Google Scholar] [CrossRef]
- Liu, Z.; Liu, D.; Huang, J. Airborne dust distributions over the Tibetan Plateau and surrounding areas derived from the first year of CALIPSO Lidar observations. Atmos. Chem. Phys. 2008, 8, 5045–5060. [Google Scholar] [CrossRef]
- Huang, J.; Minnis, P.; Chen, B.; Huang, Z.; Liu, Z.; Zhao, Q.; Yi, Y.; Ayers, J.K. Long-range transport and vertical structure of Asian dust from CALIPSO and surface measurements during PACDEX. J. Geophys. Res. Atmos. 2008, 113. [Google Scholar] [CrossRef]
- Vaughan, M.; Oung, S.; Winker, D.M.; Powell, K.A.; Omar, A.H.; Liu, Z.; Hu, Y.; Hostetler, C.A. Fully automated analysis of space-based lidar data: An overview of the CALIPSO retrieval algorithms and data products. In Proceedings of the SPIE, Laser Radar Techniques for Atmospheric Sensing, Maspalomas, Spain, 14–16 September 2004; Volume 5575, pp. 16–30. [Google Scholar]
- Omar, A.H.; Winker, D.; Won, J. Aerosol models for the CALIPSO lidar inversion algorithms. In Proceedings of the SPIE, Laser Radar Technology for Remote Sensing, Barcelona, Spain, 8–9 September 2003; Volume 5240, pp. 153–164. [Google Scholar]
- Eck, T.F.; Holben, B.N.; Reid, J.S.; Dubovik, O.; Smirnov, A.; O’Neill, N.T.; Slutsker, I.; Kinne, S. Wavelength dependence of the optical depth of biomass burning, urban, and desert dust aerosols. J. Geophys. Res. Atmos. 1999, 104, 31333–31349. [Google Scholar] [CrossRef]
- Liu, X.; Gu, J.; Li, Y.; Cheng, Y.; Qu, Y.; Han, T.; Wang, J.; Tian, H.; Chen, J.; Zhang, Y. Increase of aerosol scattering by hygroscopic growth: Observation, modeling, and implications on visibility. Atmos. Res. 2013, 132–133, 91–101. [Google Scholar] [CrossRef]
- Sun, Y.; Wang, Z.; Fu, P.; Jiang, Q.; Yang, T.; Li, J.; Ge, X. The impact of relative humidity on aerosol composition and evolution processes during wintertime in Beijing, China. Atmos. Environ. 2013, 77, 927–934. [Google Scholar] [CrossRef]
- Wu, Y.; Zhang, R.; Tian, P.; Tao, J.; Hsu, S.-C.; Yan, P.; Wang, Q.; Cao, J.; Zhang, X.; Xia, X. Effect of ambient humidity on the light absorption amplification of black carbon in Beijing during January 2013. Atmos. Environ. 2016, 124, 217–223. [Google Scholar] [CrossRef]
- Chen, W.; Yan, L.; LI, C.C.; Tang, H.Z. Retrieval and verification of high resolution AOD of MODIS. In Proceedings of the 2010 International Conference on Remote Sensing, Hangzhou, China, 27–31 August 2010; pp. 260–262. (In Chinese). [Google Scholar]
- Zhu, J.S. High resolution retrieval of aerosols by satellite. Urban Geogr. 2015, 10, 251–252. (In Chinese) [Google Scholar]
- Chen, X.X.; Jin, L.J.; Zhu, J.M. Diurnal variation of atmospheric aerosol number concentration at the bottom of Huangshan Mountain. Environ. Sci. China 2013, 33, 1167–1173. (In Chinese) [Google Scholar]
- Han, F.; Xu, J. Vertical distribution characteristics of aerosols in Beijing-Tianjin-Hebei region detected by CALIOP. Environ. Eng. 2017, 6, 108–113. (In Chinese) [Google Scholar]
- Wang, J.; Niu, S.J.; Xu, D. Ground-based observation of aerosol optical characteristics in Nanjing. Meteorol. Sci. 2017, 2, 248–255. (In Chinese) [Google Scholar]
- Chiang, C.W.; Chen, W.N.; Liang, W.A.; Das, S.K.; Nee, J.B. Optical properties of tropospheric aerosols based on measurements of lidar, sun-photometer, and visibility at Chung-Li (25° N, 121° E). Atmos. Environ. 2007, 41, 4128–4137. [Google Scholar] [CrossRef]
- Wang, Y. Analysis of a floating dust process based on vertical distribution of aerosol optical characteristics. Environ. Sci. 2014, 35, 830–838. (In Chinese) [Google Scholar]
- Wang, X.; Cao, N.W.; Huang, J.T.; Wang, H.; Zhou, J.; Zheng, K.D. Vertical distribution characteristics of aerosols and influences of meteorological elements during a haze process in Xi’an. Environ. Sci. Res. 2018, 31, 1519–1526. (In Chinese) [Google Scholar]
- Wang, H.; Zhu, B.; Shen, J.; An, J.; Yin, Y.; Kang, H. Number size distribution of aerosols at Mt. Huang and Nanjing in the Yangtze River Delta, China: Effects of air masses and characteristics of new particle formation. Atmos. Res. 2014, 150, 42–56. [Google Scholar] [CrossRef]
Figure 1.
Nanjing administrative divisions.

Figure 2.
The track map for CALIPSO transiting Nanjing.

Figure 3.
Nanjing air quality index (AQI) time evolution during the haze event.

Figure 4.
Sequential variations in AOD and water content, based on sun photometer data.

Figure 5.
MODIS Level1B data retrieval of aerosol algorithm.

Figure 6.
The 550 nm band AOD distribution for the Nanjing area during the haze event.

Figure 7.
June 29 extinction coefficient over time.

Figure 8.
June 29 AE over time in Nanjing.

Figure 9.
AOD time evolution during June 29.

Figure 10.
The vertical profile of aerosol characteristics, at 13:27 on June 29. (a) profile of extinction coefficient; (b) profile of polarization ratio; and (c) profile of color ratio.
Figure 10.
The vertical profile of aerosol characteristics, at 13:27 on June 29. (a) profile of extinction coefficient; (b) profile of polarization ratio; and (c) profile of color ratio.

Figure 11.
The feature type of aerosols.

Figure 12.
Nanjing station upper air sounding temperature stratification curves, for 08:00 and 20:00, on June 11–18.
Figure 12.
Nanjing station upper air sounding temperature stratification curves, for 08:00 and 20:00, on June 11–18.

Figure 13.
Nanjing station upper air sounding temperature stratification curves, at 08:00 and 20:00 on June 28–30.
Figure 13.
Nanjing station upper air sounding temperature stratification curves, at 08:00 and 20:00 on June 28–30.

Figure 14.
The 72 h HYSPLIT backward trajectory over Nanjing.


Table 1.
Aerosol type classification criteria.
| Aerosol Type | Volume Depolarization Ratio | Color Ratio | Backscattering Coefficient/(km−1·sr−1) |
|---|---|---|---|
| Clean | <0.075 | — | <0.0005 |
| Sand-dust | >0.200 | >0.500 | — |
| Ocean | — | 0–0.75 | — |
| Pollution | <0.075 | <0.500 | >0.0005 |
| Smoke-dust | 0.075–0.200 | — | — |
Table 2.
Comparison of AOD (aerosol optical depth) estimated using ground-based and airborne data sources.
Table 2.
Comparison of AOD (aerosol optical depth) estimated using ground-based and airborne data sources.
| Date | CE-318 | Mie-Lidar | MODIS | CALIPSO | Absolute Difference | Relative Difference | ||
|---|---|---|---|---|---|---|---|---|
| MO-CE | ML-CE | MO-CE | ML-CE | |||||
| 6.12 | 0.3672 | 0.2946 | 0.4200 | — | 0.0528 | −0.0724 | 14.4% | −19.8% |
| 6.13 | 0.4045 | 0.3072 | 0.4500 | 0.3326 | 0.0455 | −0.0973 | 11.2% | −24.1% |
| 6.14 | 0.7108 | 0.6531 | 0.7400 | — | 0.0292 | −0.0577 | 4.1% | −8.1% |
| 6.15 | 0.3628 | 0.2503 | 0.3100 | — | −0.0528 | −0.1125 | −14.6% | −31.0% |
| 6.24 | 0.5922 | 0.5311 | 0.6400 | — | 0.0478 | −0.0611 | 8.1% | −10.3% |
| 6.25 | 0.4206 | 0.3647 | 0.3400 | — | −0.0806 | −0.0559 | −19.2% | −13.3% |
| 6.26 | 0.4061 | 0.3528 | 0.1800 | — | −0.2261 | −0.0533 | −55.7% | −13.1% |
| 6.29 | 0.6372 | 0.5730 | 0.7500 | 0.5642 | 0.1128 | −0.0642 | 17.7% | −10.1% |
| 6.30 | 0.2854 | 0.2561 | 0.2700 | — | −0.0154 | −0.0293 | −5.4% | −10.3% |
© 2019 by the authors. Licensee MDPI, Basel, Switzerland. This article is an open access article distributed under the terms and conditions of the Creative Commons Attribution (CC BY) license (http://creativecommons.org/licenses/by/4.0/).
Share and Cite
MDPI and ACS Style
Zhang, Y.; Wang, J.; Bu, L. Analysis of a Haze Event over Nanjing, China Based on Multi-Source Data. Atmosphere 2019, 10, 338. https://doi.org/10.3390/atmos10060338
AMA Style
Zhang Y, Wang J, Bu L. Analysis of a Haze Event over Nanjing, China Based on Multi-Source Data. Atmosphere. 2019; 10(6):338. https://doi.org/10.3390/atmos10060338
Chicago/Turabian StyleZhang, Yiyang, Jing Wang, and Lingbing Bu. 2019. "Analysis of a Haze Event over Nanjing, China Based on Multi-Source Data" Atmosphere 10, no. 6: 338. https://doi.org/10.3390/atmos10060338
Note that from the first issue of 2016, this journal uses article numbers instead of page numbers. See further details here.