Modulation of the Westerly and Easterly Quasi-Biennial Oscillation Phases on the Connection between the Madden–Julian Oscillation and the Arctic Oscillation


1
Center for Monsoon System Research, Institute of Atmospheric Physics, Chinese Academy of Sciences, Beijing 100029, China
2
School of Earth Sciences, Zhejiang University, Hangzhou 310058, China
*
Author to whom correspondence should be addressed.
Atmosphere 2020, 11(2), 175; https://doi.org/10.3390/atmos11020175
Submission received: 2 January 2020
/
Revised: 21 January 2020
/
Accepted: 26 January 2020
/
Published: 8 February 2020
(This article belongs to the Special Issue Improving Understanding of Arctic Oscillation and Its Impact on Weather and Climate)
Abstract
:Previous studies have revealed the relationship between the Madden–Julian oscillation (MJO) and the Arctic Oscillation (AO). The MJO phase 2/3 is followed by the positive AO phase, and the MJO phase 6/7 is followed by the negative AO phase. This study reveals that the MJO phase 6/7–AO connection is modulated by the Quasi-Biennial Oscillation (QBO) through both tropospheric and stratospheric pathways during boreal winter. The MJO 2/3 phase and AO relationship is favored in both QBO easterly (QBOE) and westerly (QBOW) years because of the MJO-triggered tropospheric Rossby wave train from the tropics toward the polar region. The AO following the MJO 6/7 phase shifts to negative in QBOW years, but the MJO–AO connection diminishes in QBOE years. In QBOW years, the Asian-Pacific jet is enhanced, leading to more evident poleward propagation of tropospheric Rossby wave train, which contributes to the tropospheric pathway of the AO–MJO 6/7 connection. Besides, the enhanced Asian-Pacific jet in QBOW years is favorable for vertical propagation of planetary waves into the stratosphere in MJO phase 6/7, leading to negative AO, which indicates the stratospheric pathway of the AO–MJO 6/7 connection.
1. Introduction
The Madden–Julian Oscillation (MJO) [1,2], which manifests as eastward propagation of tropical convection and precipitation perturbations from the Indian Ocean to the central Pacific on the time scale of 20–60 days, is the dominant intraseasonal variability over the tropics [3]. Previous studies have revealed that the MJO is linked to the Arctic Oscillation (AO), a leading mode in the Northern Hemisphere [4,5]. The Arctic Oscillation (AO) is manifested as a symmetric structure with cyclonic anomalies over the polar region and two anticyclonic anomalies over the North Atlantic and the North Pacific in its positive phase. The AO can exert an impact over the Eurasian climate through the mid-latitude Rossby wave train on both interannual and intraseasonal time scales [6,7,8,9,10]. Lin and Brunet [11] indicated that the extratropical response to the MJO is more evident when the MJO convection anomaly manifests as a dipole structure. The enhanced MJO convection over the tropical Indian Ocean accompanied by reduced MJO convection over the western Pacific is followed by the positive AO phase, whereas the enhanced MJO convection over the western Pacific and suppressed MJO convection over the tropical Indian Ocean is followed by the negative AO phase [12,13,14,15,16].
The MJO and AO are connected through both tropospheric and stratospheric pathways. The tropospheric Rossby wave train can be associated with the MJO convection through the Kelvin wave response [17,18] that propagates poleward and eastward and modulates the atmospheric Pacific-North America (PNA)-like teleconnection pattern [19] over the North Pacific and North Atlantic. The MJO can also influence the AO [12]. The MJO can also modify the meridional heat flux that is in phase with climatological stationary waves over the North Pacific, which interferes constructively with climatological stationary waves and induces vertical propagation of planetary waves into the stratosphere, contributing to the polar vortex variation [20,21,22,23]. The anomalous signal of the stratospheric polar vortex propagates downward and influences the tropospheric AO [24].
Both the MJO and the AO are associated with the Quasi-Biennial Oscillation (QBO), which manifests as alternating easterly and westerly zonal winds over the stratospheric tropics on the time scale of 2.5 years [25,26,27]. During boreal winter, about 40% of the interannual variation of the MJO is contributed by the QBO [28,29,30]. The strength of the MJO can be influenced by the QBO, and thus the MJO-related teleconnection changes in QBO easterly and westerly years [29]. The MJO tends to be stronger in the easterly wind phase of the QBO (QBOE) than the westerly wind phase of the QBO (QBOW), which may be attributed to the change in the static stability at the tropopause caused by the QBO [26,27,28,29,31,32,33]. The QBO can be linked to the stratospheric polar vortex through upward propagation of planetary waves and the interaction between the stratospheric zonal mean zonal wind and the planetary waves [27]. The variation of the stratospheric polar vortex can influence the AO by downward propagation of stratospheric anomalous signals [24]. The zero-wind line at 50 hPa differs in the easterly and westerly QBO phases, which leads to a difference in the upward propagation of the tropospheric planetary wave. In easterly QBO, the planetary wave is confined to the extratropics and poleward planetary wave propagation is more evident, which contributes to the weakening of a polar vortex. In westerly QBO, more planetary waves propagate into the tropics, and the poleward propagation is weaker, leading to a stronger polar vortex [27,34,35]. Both the MJO and the QBO can influence the atmospheric rivers, mid-latitude storm track, and extratropical climate [36,37,38,39].
A recent study by Feng and Lin [40] indicated that the North Atlantic Oscillation (NAO) and the MJO connection can be modulated by the QBO. The positive NAO follows the MJO convection over the tropical Indian Ocean, and negative NAO is led by the MJO convection over the western Pacific [41,42]. The Rossby wave trains triggered by the MJO convection over the tropical Indian Ocean and the western Pacific manifest as different wave phases, which leads to opposite height anomalies over the North Pacific, contributing to the building of the relationship between the MJO and the NAO [42]. The MJO–NAO connection is closer during QBOW years than during QBOE years, which indicates that the correlation between the MJO and NAO phases is stronger and lasts longer [40]. The jet stream over the North Pacific is stronger and shifts southward during QBOW years, which is favorable for the meridional propagation of the MJO triggered tropospheric Rossby wave train [11], and thus contributes to the building of a stronger relationship between the MJO and the NAO.
The AO and the NAO have different spatial structures, which makes this study different from Feng and Lin [40]. The AO is manifested as zonally symmetric structure over the Northern Hemisphere. The NAO is a surface dipole pattern over the North Atlantic, with one center over \ Iceland and the other center over the Azores. Despite the difference between the AO and the NAO [43], the similarity in the correlations between the MJO and NAO phases and the MJO and the AO inspires us to wonder if the QBO can modulate the MJO–AO connection like the QBO modulation on the MJO–NAO connection revealed by Feng and Lin [40]. In this study, we will address how the QBOE and QBOW modulates the MJO–AO connection. It should be noted that the extratropical response to the MJO is nonlinear, and the background states’ variation associated with the QBO should be considered together with the MJO phases in this study.
The data set and diagnostic method are presented in Section 2. In Section 3, we inspect if the MJO–AO connection differs in QBOW and QBOE years. Then, we investigate the possible tropospheric and stratospheric pathways that lead to the variation in the MJO–AO connection. A brief summary and discussion are given in Section 4.
2. Data and Methodology
The daily outputs from the National Centers for Environmental Prediction (NCEP) Department of Energy (DOE) Reanalysis 2 provided by the National Oceanic and Atmospheric Administration (NOAA) [44] were used in this study. We investigated 37 boreal winters (December, January, and February) from 1979 to 2016. The variables used included the sea level pressure, geopotential height, air temperature, and meridional and zonal winds at different levels. The horizontal resolution of these variables is 2.5° × 2.5°, with 17 vertical layers extending from 1000 to 10 hPa.
The definition of the MJO phases in this study is based on the daily real-time multivariate MJO (RMM) index [45], which was obtained from the website of the Bureau of Meteorology of Australia (http://www.bom.gov.au/climate/mjo/graphics/rmm.74toRealtime.txt). The RMM index is based on the leading two EOFs of the combined fields of the zonal wind at 200 and 850 hPa, and the outgoing longwave radiation (OLR) meridionally averaged over the tropics. The projections of the daily anomaly data on EOF1 and EOF2 are denoted as RMM1 and RMM2, respectively [45]. The location and strength of the MJO convection can be captured by this index very well [46]. The amplitude of the MJO is defined by .
We obtained the daily AO index from the NOAA Climate Prediction Center (CPC) website (http://www.cpc.ncep.noaa.gov/products/precip/CWlink/daily_ao_index/ao.shtml). This AO index is defined by projecting the daily 1000 hPa height anomalies poleward of 20° N onto the leading spatial pattern of the AO [4]. In the present study, we defined the QBO index following Nishimoto and Yoden [26]. The monthly mean zonal-mean zonal wind at 50 hPa from 10° S to 10° N was used. The QBOE (QBOW) was defined as when the QBO index is below negative (above positive) 1.5 of the standard deviation of the QBO index. In this study, only neutral El Niño-Southern Oscillation (ENSO) winters were considered in selecting the QBOE and QBOW years to exclude the influence of ENSO. Neutral ENSO winters were defined as when the oceanic Nino Index (ONI, 3-month running mean of ERSST.v5 SST anomalies in the Niño 3.4 region (5° N–5° S, 120°–170° W)) falls between ±1 °C. The ONI index was obtained from the National Weather Service, Climate Prediction Center website (https://origin.cpc.ncep.noaa.gov/products/analysis_monitoring/ensostuff/ONI_v5.php). In a total 37 winters, we identified 8 QBOE winters and 10 QBOW winters (Table 1).
Composite analysis based on the RMM index was performed in this study. Before conducting the composite analysis, the climatological mean (winter mean from 1981 to 2010) was removed from all variables. Previous studies have indicated that the MJO–AO connection is evident when the MJO convection situates over the tropical Indian Ocean and western Pacific Ocean (i.e., MJO phases 2/3 and 6/7 based on the RMM index) [12,15,16,40]. So, the adjacent phases (2 and 3, 6, and 7) were combined during the composite analysis [16,46]. Only the days when the MJO amplitude exceeds one standard deviation were considered in constructing the composite. The Student’s t test was used to estimate the statistical significance of the composite anomalies. We found 116 and 115 MJO phase 2/3 days in easterly and westerly QBO years, and 165 and 209 MJO phase 6/7 days in easterly and westerly QBO years. These sample sizes were divided by 5 because one MJO phase can last for several days (about 5 days), leading to autocorrelation in these samples. After the adjustment, we identified 24 and 23 MJO phases 2/3 samples for easterly and westerly QBO years, and 33 and 42 MJO phases 6/7 samples for easterly and westerly QBO years. In order to depict the propagation of tropospheric Rossby wave, the Rossby wave activity flux [47] was employed. The vertical propagation of stationary planetary waves is illustrated by the quasi-geostrophic Eliassen-Palm flux (EP flux) [48,49].
3. Results
Previous study has indicated that the MJO–AO connection can be modulated by the mean state change [16]. To examine if the MJO–AO connection varies with the phase of the QBO, the probability density functions (PDF) of the daily AO index in MJO phases 2/3 and 6/7 during QBOW and QBOE years are depicted in Figure 1a,b. The calculation of the PDF was based on the 5-day mean AO index from 10 to 14 days after the MJO amplitudes at phases 2/3 and 6/7 exceed one standard deviation. The 10–14-day time lag was considered because it takes about 1 to 2 weeks for the MJO-triggered teleconnection pattern, which contributes to the MJO–AO connection [12,16], to form over the North Pacific and the North Atlantic [19].
The PDF of the AO index shifts to positive in the MJO phase 2/3 during both QBOW and QBOE years (Figure 1a). The shift of the AO index is slightly larger in QBOE years than in QBOW years. The two-sample Kolmogorov–Smirnov statistic could not exceed 0.35, the 90% confidence level for the samples in Figure 1a (Figure 1c). This suggests that the QBO modulation of the MJO phase 2/3–AO connection is not evident.
The PDF of the AO index in MJO phase 6/7 shifts to negative in QBOW years (Figure 1b). The distribution of the PDF of the AO index in QBOE years is nearly evenly separated by the zero line, with two peaks emerging around −1 and 1. The two-sample Kolmogorov–Smirnov statistic exceeds 0.28, passing the 90% confidence level for the samples in Figure 1b. This indicates that the MJO phase 6/7–AO connection is different between QBOW and QBOE years. The MJO phase 6/7 leads negative AO phases in QBOW years, consistent with previous studies [12,13,15,16]. The MJO phase 6/7–AO relationship, however, vanishes in QBOE years.
The AO pattern can be well captured by sea level pressure (SLP) anomalies. As shown in Figure 2a,b, positive SLP anomalies are observed over the North Atlantic following the MJO phase 2/3 in all years and the QBOW years, which corresponds to the result in Feng and Lin [40]. Positive SLP anomalies appear over the North Pacific as well. Negative SLP anomalies extend from the high-latitude North Atlantic toward the polar region. This pattern indicates the positive AO phase [4]. In QBOE years, positive SLP anomalies appear over the North Pacific (Figure 2c) following the MJO 2/3 phase. The SLP anomalies are weak over the North Atlantic. Negative SLP anomalies are observed around the polar region, and weak positive SLP anomalies appear near the pole. We can infer from Figure 1a that the AO tends to be in the positive phase following the MJO 2/3 phase in both QBOE and QBOW years, and the SLP anomalies following the MJO 2/3 phase agree with this result.
As shown in Figure 2d,e for the MJO 6/7 phase, negative SLP anomalies are situated over the North Pacific and the North Atlantic, and positive SLP anomalies extend from the high-latitude North Atlantic toward the polar region. The SLP anomalies over the North Pacific and the North Atlantic are stronger in QBOW years compared with the all year mean. This suggests an evident negative AO pattern following the MJO 6/7 phase in QBOW years, which corresponds to the PDF in Figure 1b. It should be noted that the extratropical response to the MJO is not mirrored between phases 2–3 and 6–7, which leads to distinct AO patterns [11]. The SLP anomaly pattern differs from the AO in QBOE years (Figure 2f), suggesting a weak MJO–AO relationship in this case. The SLP anomalies following the MJO 6/7 phase in westerly and easterly QBO years confirm the difference of the PDFs in Figure 1b,d and the modulation of the QBO on the MJO–AO connection in the MJO 6/7 phase.
Previous studies revealed that a key mechanism for the tropical and polar connection is the poleward tropospheric Rossby wave train emanating from the tropics [36,40]. The tropospheric Rossby wave activity fluxes following the MJO phases 2/3 and 6/7 in QBOW and QBOE years are illustrated in Figure 3. As shown in Figure 3a,b, poleward propagation of wave packets at 300 hPa from the tropics is observed over the North Pacific north of 40° N following the MJO 2/3 phase, and anomalous anticyclonic anomalies appear over the North Pacific in both QBOW and QBOE years. This suggests the connection between the MJO phase 2/3 and AO is contributed by the poleward tropospheric Rossby wave train in both QBOW and QBOE years. The poleward wave fluxes following the MJO 6/7 phase are much stronger in QBOW years than in QBOE years (Figure 3c,d). This confirms that the connection between the MJO 6/7 phase and the AO is more evident in QBOW years (Figure 1b and Figure 2e).
The poleward propagation of the MJO-triggered Rossby wave train is influenced by the Asian-Pacific jet [19]. Comparing the QBOW and QBOE years, the anomalous jet at 200 hPa shifts southward in QBOW years (Figure 4a,b), which indicates the modulation of the QBO on the zonal winds. The anomalous jet at 200 hPa following the MJO 2/3 phase shifts southward in QBOW years (Figure 5a–c), which is consistent with the background states associated with the QBO phases indicated by the anomalous jet at 200 hPa (Figure 4a,b). The anomalous jet following MJO 6/7 is accelerated in QBOW years (Figure 5d–f). This result suggests the modulation of the QBO on the MJO-related circulation. The enhancement and the southward shift of the jet lead to the intensification of the extratropical response of the MJO (i.e., the PNA-like teleconnection pattern), which favors the Rossby wave propagation [11,40]. It should be noted that the polar vortex located north of 60° N is decelerated evidently following the MJO 6/7 phase in QBOW years (Figure 5d,f). This corresponds to the negative AO pattern shown in Figure 2e.
The MJO–AO connection has also been explained by vertical wave propagation into the stratosphere [16,20,21,22,23,50]. The EP flux anomalies following the MJO 2/3 phase are confined to the upper troposphere and stratosphere in both QBOW and QBOE years (Figure 6a,b). In comparison, the EP flux anomalies are opposite during the two types of years, leading to large differences (Figure 6c). There are no significant anomalous poleward wave fluxes in both types of years in the troposphere. The poleward heat fluxes in QBOE and QBOW years following the MJO phase 2/3 are confined in the stratosphere. We can hardly observe vertical EP fluxes transporting from the stratosphere to the troposphere in this case. This suggests that the connection between the MJO 2/3 phase and the AO is through the tropospheric pathway.
Anomalous upward and poleward EP fluxes are observed over the mid-latitudes following the MJO 6/7 phase in QBOW years (Figure 6d). The upward propagation of planetary waves is attributed to the combined effect of upward EP fluxes in the MJO phase 7 [51] and the enhanced westerlies in QBOW years [40]. The anomalous divergence of the EP flux over the latitude from 40° N to 60° N leads to an acceleration of westerlies in situ, and the convergence of the EP flux north of 70° N contributes to the deceleration of the polar vortex (Figure 5d) and negative AO (Figure 2e). In QBOE years, anomalous EP fluxes are much weaker and downward fluxes are seen in the troposphere (Figure 6e). The discrepancy is confirmed by the difference of the EP fluxes between QBOW and QBOE years (Figure 6f). Therefore, the MJO 6/7 phase and the AO are connected in QBOW years through vertical wave propagation into the stratosphere.
4. Summary and Discussions
Previous studies have found a relationship between the MJO and AO, with the positive and negative AO phases following the MJO convection over the tropical Indian Ocean (phase 2/3) and the western Pacific (phase 6/7), respectively. In this study, we found that the MJO–AO connection can be modulated by the QBO through both tropospheric and stratospheric pathways.
The AO following the MJO 2/3 phase shifts to positive in both QBOW and QBOE years. The relationship between the MJO 2/3 phase and positive AO is contributed by the poleward propagation of the tropospheric Rossby wave triggered by the MJO convection. The strength of the MJO is weaker in westerly QBO years compared to that in easterly QBO years, but the MJO convection can still excite the Rossby wave train in westerly QBO years. The stratospheric pathway is not evident in this case.
The AO following the MJO 6/7 phase shifts to negative in QBOW years, but this connection diminishes in QBOE years. The AO and MJO 6/7 phase connection in QBOW years is established through both tropospheric and stratospheric pathways. The westerlies in the high-latitude upper troposphere over the North Pacific are enhanced in QBOW years. The enhanced Asian-Pacific jet contributes to more evident poleward propagation of tropospheric Rossby waves that are emitted from the tropical MJO convection. The stronger westerlies over the North Pacific provide a favorable condition for evident vertical propagation of planetary waves into the stratosphere, which leads to negative AO. The subtropical jet over the North Pacific (i.e., the Asian-Pacific jet) helps the poleward propagation of the tropospheric Rossby wave and the vertical propagation of planetary waves, which are the tropospheric and stratospheric pathways of the MJO–AO connection, respectively, and the weakened Asian-Pacific jet during easterly QBO years results in the destruction of the MJO–AO relationship.
This study investigated the modulation of the QBO phase on the MJO–AO connection, which is mainly attributed to the changes in atmospheric circulation with the QBO phase. Further studies would be needed to understand the modulation by other interannual modes on the connection of tropical–extratropical intraseasonal variabilities by using longer datasets. In this study, we have shown some evidence on the modulation of the QBO phases on the MJO–AO connection, but the cause-and-effect relationship are not clear. A model study may be conducted to better reveal the physical process.
Author Contributions
Conceptualization, L.S. and R.W.; methodology, L.S. and R.W.; software, L.S.; validation, L.S. and R.W.; formal analysis, L.S.; investigation, L.S. and R.W.; resources, L.S. and R.W.; data curation, L.S.; writing—original draft preparation, L.S.; writing—review and editing, R.W. and L.S.; visualization, L.S.; supervision, R.W.; project administration, L.S. and R.W.; funding acquisition, L.S. and R.W. All authors have read and agreed to the published version of the manuscript.
Funding
This research was funded by the National Natural Science Foundation of China grants (41705063, 41530425, 41721004, and 41475081).
Acknowledgments
The comments from two anonymous reviewers and Dr. Shangfeng Chen that have helped the improvement of this manuscript are appreciated. The NCEP reanalysis 2 data were obtained from ftp://ftp.cdc.noaa.gov/.
Conflicts of Interest
The authors declare no conflict of interest.
References
- Madden, R.A.; Julian, P.R. Detection of a 40–50 days oscillation in the zonal wind in the tropical pacific. J. Atmos. Sci. 1971, 28, 702–708. [Google Scholar] [CrossRef]
- Madden, R.A.; Julian, P.R. Description of global-scale circulation cells in the tropics with a 40–50 day period. J. Atmos. Sci. 1972, 29, 1109–1123. [Google Scholar] [CrossRef]
- Zhang, C. Madden-Julian Oscillation. Rev. Geophys. 2005, 43. [Google Scholar] [CrossRef] [Green Version]
- Thompson, D.W.J.; Wallace, J.M. The Arctic oscillation signature in the wintertime geopotential height and temperature fields. Geophys. Res. Lett. 1998, 25, 1297–1300. [Google Scholar] [CrossRef] [Green Version]
- Thompson, D.W.J.; Wallace, J.M. Annular modes in the extratropical circulation. Part I: Month-to-month variability. J. Clim. 2000, 13, 1000–1016. [Google Scholar] [CrossRef]
- Gong, D.-Y.; Wang, S.-W.; Zhu, J.-H. East Asian winter monsoon and Arctic Oscillation. Geophys. Res. Lett. 2001, 28, 2073–2076. [Google Scholar] [CrossRef]
- Wu, B.; Wang, J. Winter Arctic Oscillation, Siberian high and East Asian winter monsoon. Geophys. Res. Lett. 2002, 29, 1897. [Google Scholar] [CrossRef]
- Jeong, J.-H.; Ho, C.-H. Changes in occurrence of cold surges over east Asia in association with Arctic Oscillation. Geophys. Res. Lett. 2005, 32, L14704. [Google Scholar] [CrossRef]
- Park, T.-W.; Ho, C.-H.; Yang, S. Relationship between the Arctic Oscillation and cold surges over East Asia. J. Clim. 2011, 24, 68–83. [Google Scholar] [CrossRef]
- Song, L.; Wu, R. Comparison of intraseasonal East Asian winter cold temperature anomalies in positive and negative phases of the Arctic Oscillation. J. Geophys. Res. Atmos. 2018, 123, 8518–8537. [Google Scholar] [CrossRef]
- Lin, H.; Brunet, G. Extratropical response to the MJO: Nonlinearity and sensitivity to the initial state. J. Atmos. Sci. 2018, 75, 219–234. [Google Scholar] [CrossRef]
- Zhou, S.; Miller, A.J. The interaction of the Madden–Julian Oscillation and the Arctic Oscillation. J. Clim. 2005, 18, 143–159. [Google Scholar] [CrossRef]
- Flatau, M.; Kim, Y.J. Interaction between the MJO and polar circulations. J. Clim. 2013, 26, 3562–3574. [Google Scholar] [CrossRef]
- Miller, A.J.; Zhou, S.; Yang, S.-K. Relationship of the Arctic and Antarctic oscillations to the outgoing longwave radiation. J. Clim. 2003, 16, 1583–1592. [Google Scholar] [CrossRef]
- L’Heureux, M.L.; Higgins, R.W. Boreal winter links between the Madden–Julian Oscillation and the Arctic Oscillation. J. Clim. 2008, 21, 3040–3050. [Google Scholar] [CrossRef]
- Song, L.; Wu, R. Different cooperation of the Arctic Oscillation and the Madden-Julian Oscillation in the East Asian cold events during early and late winter. J. Geophys. Res. Atmos. 2019, 124, 4913–4931. [Google Scholar] [CrossRef]
- Jin, F.; Hoskins, B.J. The direct response to tropical heating in a baroclinic atmosphere. J. Atmos. Sci. 1995, 52, 307–319. [Google Scholar] [CrossRef] [Green Version]
- Matthews, A.J.; Hoskins, B.J.; Masutani, M. The global response to tropical heating in the Madden–Julian oscillation during the northern winter, Q.J.R. Meteorol. Soc. 2004, 130, 1991–2011. [Google Scholar] [CrossRef] [Green Version]
- Seo, K.-H.; Lee, H.-J. Mechanisms for a PNA-Like teleconnection pattern in response to the MJO. J. Atmos. Sci. 2017, 74, 1767–1781. [Google Scholar] [CrossRef]
- Garfinkel, C.I.; Hartmann, D.L.; Sassi, F. Tropospheric precursors of anomalous Northern Hemisphere stratospheric polar vortices. J. Clim. 2010, 23, 3282–3299. [Google Scholar] [CrossRef]
- Garfinkel, C.I.; Feldstein, S.B.; Waugh, D.W.; Yoo, C.; Lee, S. Observed connection between stratospheric sudden warmings and the Madden-Julian Oscillation. Geophys. Res. Lett. 2012, 39. [Google Scholar] [CrossRef] [Green Version]
- Garfinkel, C.I.; Benedict, J.J.; Maloney, E.D. Impact of the MJO on the boreal winter extratropical circulation. Geophys. Res. Lett. 2014, 41, 6055–6062. [Google Scholar] [CrossRef]
- Garfinkel, C.I.; Schwartz, C. MJO-related tropical convection anomalies lead to more accurate stratospheric vortex variability in subseasonal forecast models. Geophys. Res. Lett. 2017, 44, 10054–010062. [Google Scholar] [CrossRef] [PubMed]
- Baldwin, M.P.; Dunkerton, T.J. Stratospheric harbingers of anomalous weather regimes. Science 2001, 294, 581–584. [Google Scholar] [CrossRef]
- Baldwin, M.P.; Gray, L.J.; Dunkerton, T.J.; Hamilton, K.; Haynes, P.H.; Randel, W.J.; Holton, J.R.; Alexander, M.J.; Hirota, I.; Horinouchi, T.; et al. The quasi-biennial oscillation. Rev. Geophys. 2001, 39, 179–229. [Google Scholar] [CrossRef]
- Nishimoto, E.; Yoden, S. Influence of the stratospheric Quasi-Biennial Oscillation on the Madden–Julian Oscillation during Austral Summer. J. Atmos. Sci. 2017, 74, 1105–1125. [Google Scholar] [CrossRef]
- Andrews, M.B.; Knight, J.R.; Scaife, A.A.; Lu, Y.; Wu, T.; Gray, L.J.; Schenzinger, V. Observed and simulated teleconnections between the stratospheric Quasi-Biennial Oscillation and Northern Hemisphere winter atmospheric circulation. J. Geophys. Res.: Atmos. 2019, 124, 1219–1232. [Google Scholar] [CrossRef]
- Yoo, C.; Son, S.-W. Modulation of the boreal wintertime Madden-Julian oscillation by the stratospheric quasi-biennial oscillation. Geophys. Res. Lett. 2016, 43, 1392–1398. [Google Scholar] [CrossRef] [Green Version]
- Son, S.-W.; Lim, Y.; Yoo, C.; Hendon, H.H.; Kim, J. Stratospheric control of the Madden–Julian Oscillation. J. Clim. 2017, 30, 1909–1922. [Google Scholar] [CrossRef]
- Peña-Ortiz, C.; Manzini, E.; Giorgetta, M.A. Tropical deep convection impact on southern winter stationary waves and its modulation by the Quasi-Biennial Oscillation. J. Clim. 2019, 32, 7453–7467. [Google Scholar] [CrossRef]
- Hendon, H.H.; Abhik, S. Differences in vertical structure of the Madden-Julian Oscillation associated with the Quasi-Biennial Oscillation. Geophys. Res. Lett. 2018, 45, 4419–4428. [Google Scholar] [CrossRef]
- Zhang, C.; Zhang, B. QBO-MJO connection. J. Geophys. Res.: Atmos. 2018, 123, 2957–2967. [Google Scholar] [CrossRef]
- Klotzbach, P.; Abhik, S.; Hendon, H.H.; Bell, M.; Lucas, C.; Marshall, A.G.; Oliver, E.C.J. On the emerging relationship between the stratospheric Quasi-Biennial oscillation and the Madden-Julian oscillation. Sci. Rep. 2019, 9, 2981. [Google Scholar] [CrossRef] [PubMed] [Green Version]
- Holton, J.R.; Tan, H.-C. The influence of the equatorial Quasi-Biennial Oscillation on the global circulation at 50 mb. J. Atmos. Sci. 1980, 37, 2200–2208. [Google Scholar] [CrossRef] [Green Version]
- Holton, J.R.; Tan, H.-C. The Quasi-Biennial Oscillation in the Northern Hemisphere lower stratosphere. J. Meteorol. Soc. Japan. Ser. II 1982, 60, 140–148. [Google Scholar] [CrossRef] [Green Version]
- Baggett, C.; Lee, S.; Feldstein, S. An investigation of the presence of atmospheric rivers over the North Pacific during planetary-scale wave life cycles and their role in Arctic warming. J. Atmos. Sci. 2016, 73, 4329–4347. [Google Scholar] [CrossRef]
- Baggett, C.F.; Barnes, E.A.; Maloney, E.D.; Mundhenk, B.D. Advancing atmospheric river forecasts into subseasonal-to-seasonal time scales. Geophys. Res. Lett. 2017, 44, 7528–7536. [Google Scholar] [CrossRef]
- Mundhenk, B.D.; Barnes, E.A.; Maloney, E.D.; Baggett, C.F. Skillful empirical subseasonal prediction of landfalling atmospheric river activity using the Madden–Julian oscillation and quasi-biennial oscillation. npj Clim. Atmos. Sci. 2018, 1, 20177. [Google Scholar] [CrossRef] [Green Version]
- Wang, J.; Kim, H.-M.; Chang, E.K.M.; Son, S.-W. Modulation of the MJO and North Pacific storm track relationship by the QBO. J. Geophys. Res: Atmos. 2018, 123, 3976–3992. [Google Scholar] [CrossRef]
- Feng, P.-N.; Lin, H. Modulation of the MJO-related teleconnections by the QBO. J. Geophys. Res.: Atmos. 2019. [Google Scholar] [CrossRef] [Green Version]
- Cassou, C. Intraseasonal interaction between the Madden-Julian Oscillation and the North Atlantic Oscillation. Nature 2008, 455, 523–527. [Google Scholar] [CrossRef] [PubMed]
- Lin, H.; Brunet, G.; Derome, J. An observed connection between the North Atlantic Oscillation and the Madden–Julian Oscillation. J. Clim. 2009, 22, 364–380. [Google Scholar] [CrossRef]
- Feldstein, S.B.; Franzke, C. Are the North Atlantic Oscillation and the Northern Annular Mode distinguishable? J. Atmos. Sci. 2006, 63, 2915–2930. [Google Scholar] [CrossRef]
- Kanamitsu, M.; Ebisuzaki, W.; Woollen, J.; Yang, S.-K.; Hnilo, J.J.; Fiorino, M.; Potter, G.L. NCEP–DOE AMIP-II Reanalysis (R-2). Bull. Ameri. Meteorol. Soc. 2002, 83, 1631–1643. [Google Scholar] [CrossRef]
- Wheeler, M.C.; Hendon, H.H. An all-season real-time multivariate MJO index: Development of an index for monitoring and prediction. Mon. Wea. Rev. 2004, 132, 1917–1932. [Google Scholar] [CrossRef]
- Barnes, E.A.; Samarasinghe, S.M.; Ebert-Uphoff, I.; Furtado, J.C. Tropospheric and stratospheric causal pathways between the MJO and NAO. J. Geophys. Res.: Atmos. 2019. [Google Scholar] [CrossRef]
- Takaya, K.; Nakamura, H. A formulation of a phase-independent wave-activity flux for stationary and migratory quasigeostrophic eddies on a zonally varying basic flow. J. Atmos. Sci. 2001, 58, 608–627. [Google Scholar] [CrossRef]
- Edmon, H.J.; Hoskins, B.J.; McIntyre, M.E. Eliassen-Palm cross sections for the troposphere. J. Atmos. Sci. 1980, 37, 2600–2616. [Google Scholar] [CrossRef] [Green Version]
- Andrews, D.G.; Holton, J.R.; Leovy, C.B. Middle Atmosphere Dynamics; Academic Press: New York, NY, USA, 1987; pp. 1–489. [Google Scholar]
- Green, M.R.; Furtado, J.C. Evaluating the joint influence of the Madden-Julian Oscillation and the stratospheric polar vortex on weather patterns in the Northern Hemisphere. J. Geophys. Res.: Atmos. 2019, 22, 11693–11709. [Google Scholar] [CrossRef]
- Wang, F.; Tian, W.; Xie, F.; Zhang, J.; Han, Y. Effect of Madden–Julian Oscillation occurrence frequency on the interannual variability of Northern Hemisphere stratospheric wave activity in winter. J. Clim. 2018, 31, 5031–5049. [Google Scholar] [CrossRef]
Figure 1.
The probability density function (PDF) of the Arctic Oscillation (AO) index when the Madden–Julian oscillation (MJO) phases 2/3 (a) and 6/7 (b) lead the AO for 10 to 14 days. The red and blue vertical lines represent the median values of the PDFs in QBOE and QBOW years, respectively. Two-sample Kolmogorov–Smirnov statistics for PDFs in (a) and (b) are presented in (c) and (d), respectively. Red and blue lines indicate the empirical distribution function in QBOE and QBOW years, respectively. The black arrows are the two-sample Kolmogorov–Smirnov statistic.

Figure 2.
Composite sea level pressure (SLP) anomalies (shading, hPa) averaged from 10 to 14 days after the MJO phase 2/3 in all years (a), QBOW (b), and QBOE (c) years. Subplots (d)–(f) are the same as (a)–(c) but for the MJO phase 6/7. The black dots indicate anomalies significant at the 95% confidence level by Student’s t test. The red and blue contours denote positive and negative SLP anomalies of the AO pattern.

Figure 3.
Composite stream function anomalies (shading, ×106 m2/s2), and wave activity flux (vector, scale at the right bottom) at 300 hPa averaged from 10 to 14 days after the MJO phase 2/3 in QBOW (a) and QBOE (b) years. Subplots (d)–(f) are the same as (a)–(c) but for the MJO phase 6/7.
Figure 3.
Composite stream function anomalies (shading, ×106 m2/s2), and wave activity flux (vector, scale at the right bottom) at 300 hPa averaged from 10 to 14 days after the MJO phase 2/3 in QBOW (a) and QBOE (b) years. Subplots (d)–(f) are the same as (a)–(c) but for the MJO phase 6/7.
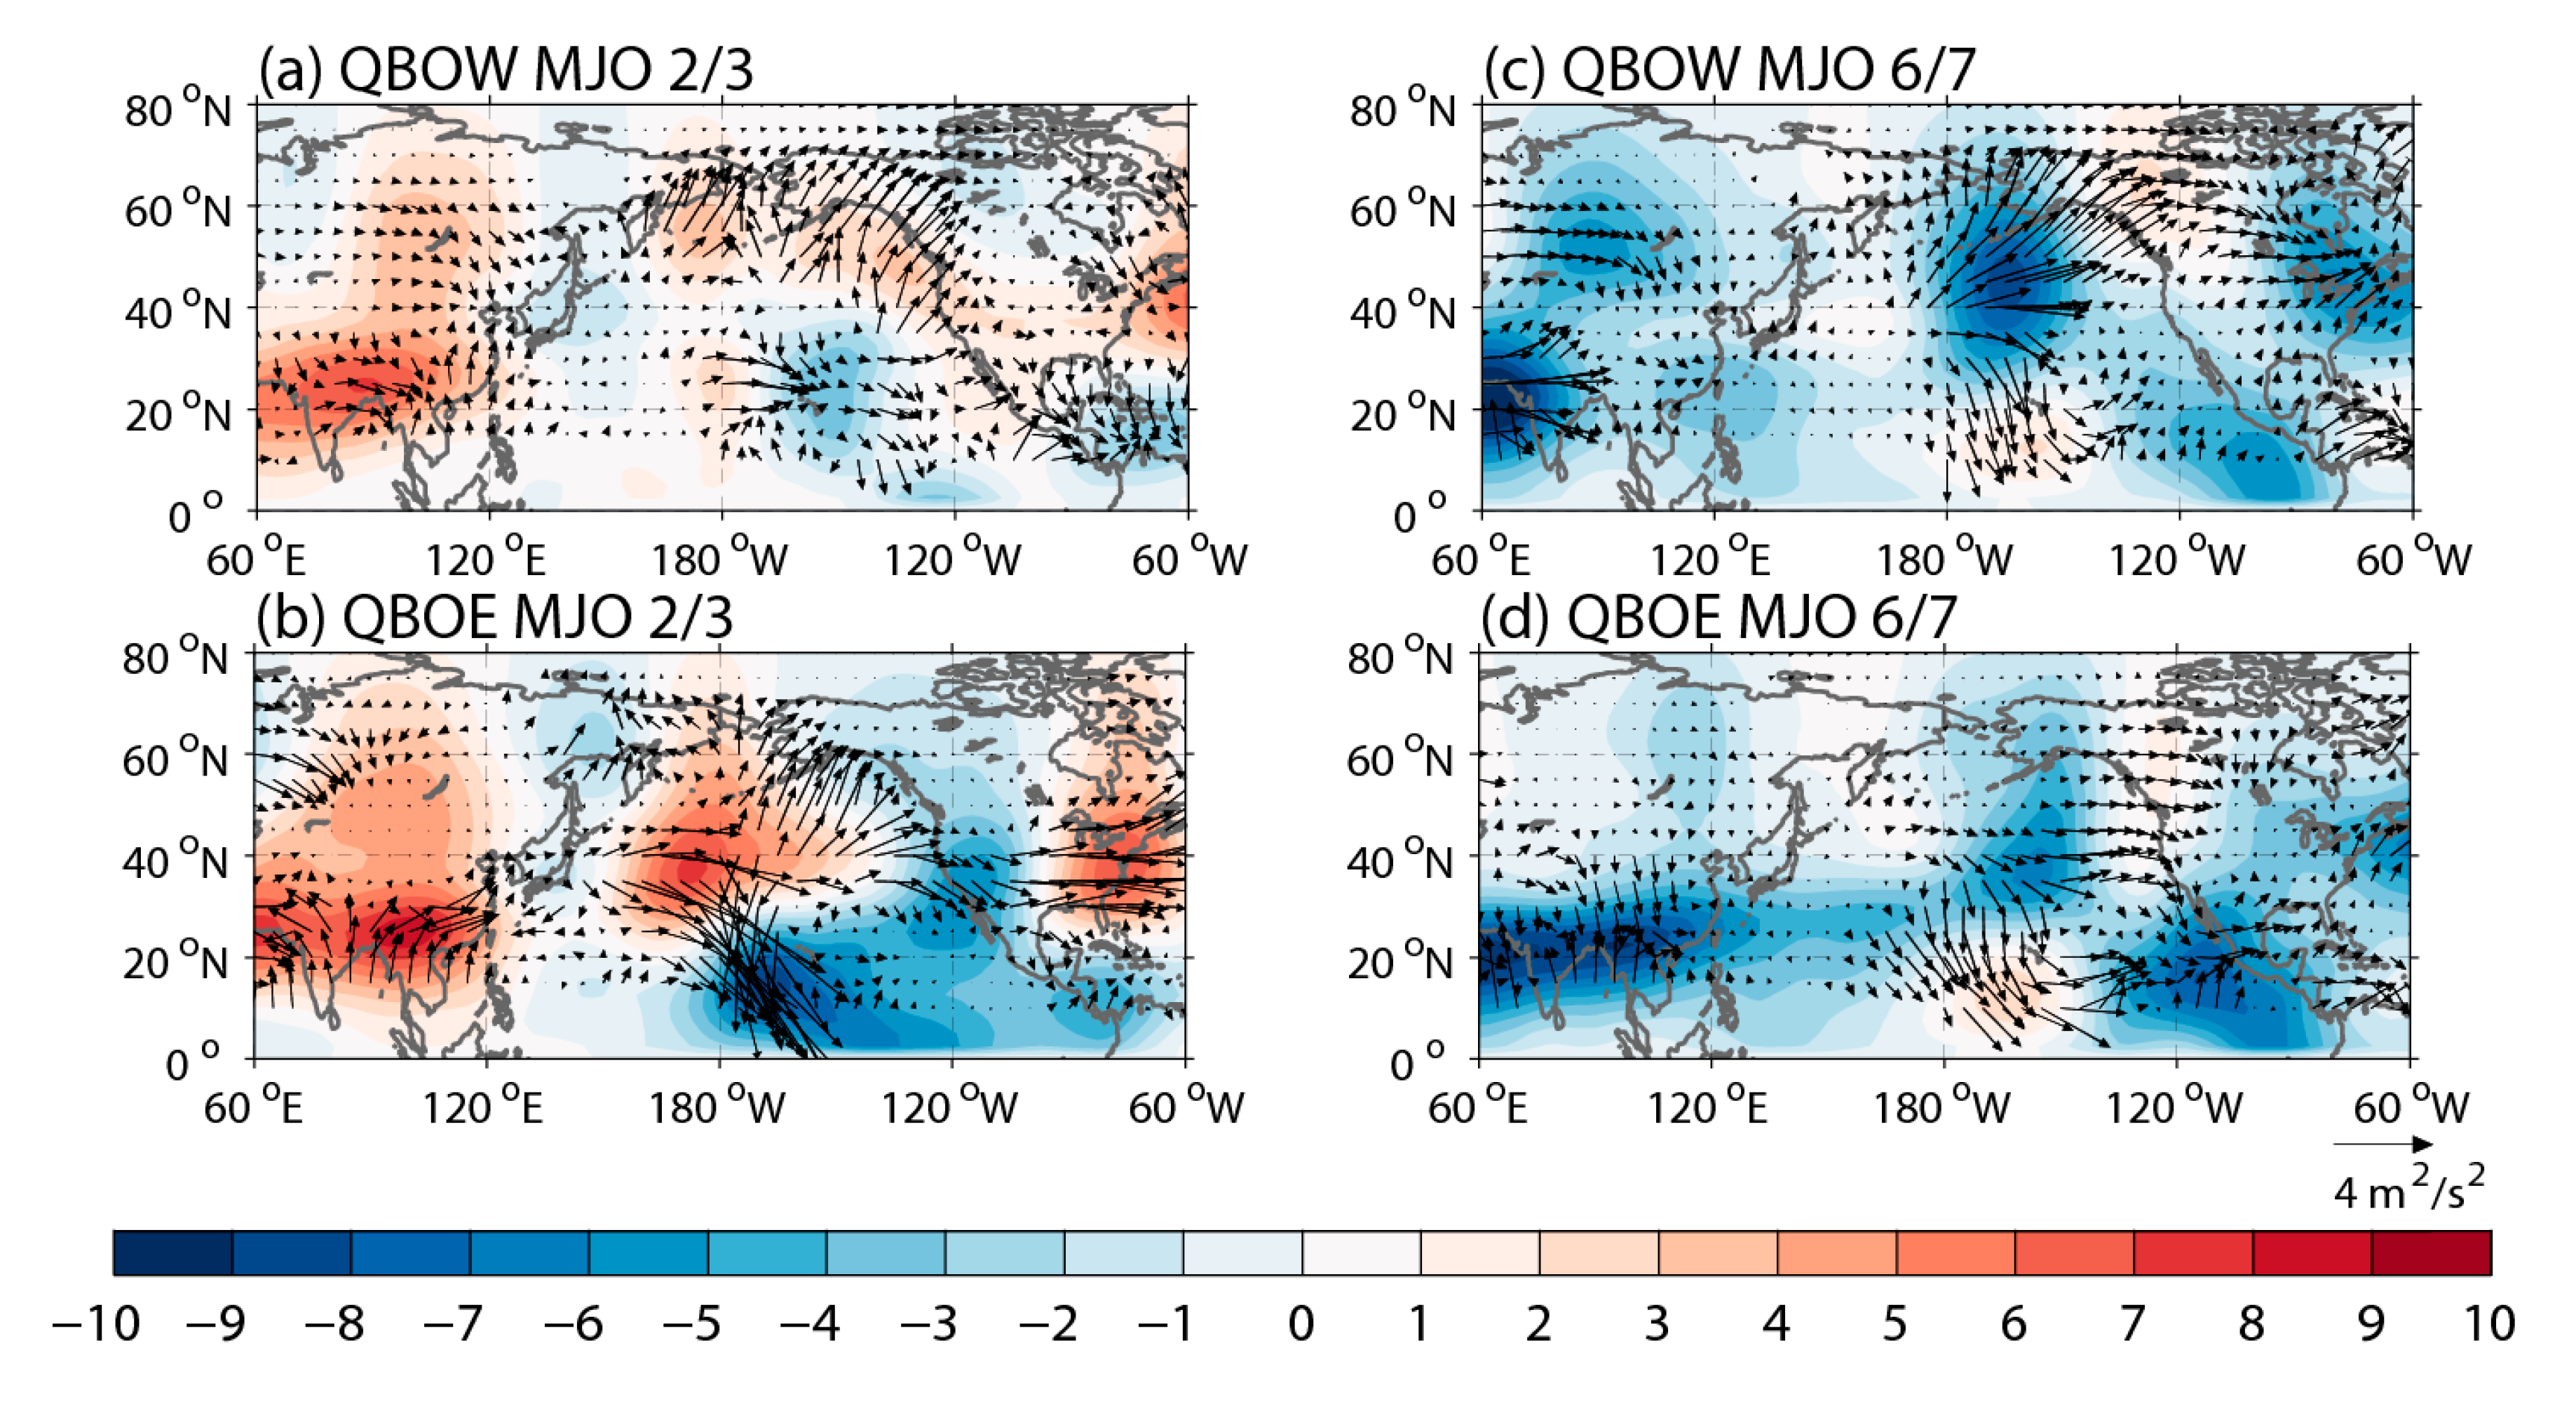
Figure 4.
Composite zonal wind anomalies at 200 hPa (shading, m/s) averaged in QBOW (a), QBOE (b) years. The black contours denote the climatological zonal wind in winter. The black dots indicate anomalies significant at the 95% confidence level by Student’s t test.
Figure 4.
Composite zonal wind anomalies at 200 hPa (shading, m/s) averaged in QBOW (a), QBOE (b) years. The black contours denote the climatological zonal wind in winter. The black dots indicate anomalies significant at the 95% confidence level by Student’s t test.

Figure 5.
Composite zonal wind anomalies at 200 hPa (shading, m/s) averaged from 10 to 14 days after the MJO phase 2/3 in QBOW (a), QBOE (b) years, and the difference between the QBOW and QBOE years (c). Subplots (d)–(f) are the same as (a)–(c) but for the MJO phase 6/7. The black contours denote the climatological zonal wind in winter. The black dots indicate anomalies significant at the 95% confidence level by Student’s t test.
Figure 6.
Latitude–height vertical cross-section of zonal-mean zonal wind (contour, interval: 5 m/s) and Eliassen–Plam flux anomalies (vector, scale on the right bottom) averaged from 10 to 14 days after the MJO phase 2/3 in QBOW (a), QBOE (b) years, and the difference between the QBOW and QBOE years (c). Subplots (d)–(f) are the same as (a)–(c) but for the MJO phase 6/7. The vertical component of the E-P flux has been multiplied by 100.


Table 1.
The QBO easterly (QBOE) and QBO westerly (QBOW) years in neutral El Niño-Southern Oscillation (ENSO) years.
Table 1.
The QBO easterly (QBOE) and QBO westerly (QBOW) years in neutral El Niño-Southern Oscillation (ENSO) years.
| QBO Phase | Years |
|---|---|
| QBOE | 1979/1980; 1989/1990; 1996/1997; 2001/2002; 2003/2004; 2005/2006; 2012/2013; 2014/2015 |
| QBOW | 1980/1981; 1985/1986; 1987/1988; 1990/1991; 1995/1996; 2002/2003; 2004/2005; 2006/2007; 2008/2009; 2013/2014 |
© 2020 by the authors. Licensee MDPI, Basel, Switzerland. This article is an open access article distributed under the terms and conditions of the Creative Commons Attribution (CC BY) license (http://creativecommons.org/licenses/by/4.0/).
Share and Cite
MDPI and ACS Style
Song, L.; Wu, R. Modulation of the Westerly and Easterly Quasi-Biennial Oscillation Phases on the Connection between the Madden–Julian Oscillation and the Arctic Oscillation. Atmosphere 2020, 11, 175. https://doi.org/10.3390/atmos11020175
AMA Style
Song L, Wu R. Modulation of the Westerly and Easterly Quasi-Biennial Oscillation Phases on the Connection between the Madden–Julian Oscillation and the Arctic Oscillation. Atmosphere. 2020; 11(2):175. https://doi.org/10.3390/atmos11020175
Chicago/Turabian StyleSong, Lei, and Renguang Wu. 2020. "Modulation of the Westerly and Easterly Quasi-Biennial Oscillation Phases on the Connection between the Madden–Julian Oscillation and the Arctic Oscillation" Atmosphere 11, no. 2: 175. https://doi.org/10.3390/atmos11020175
Note that from the first issue of 2016, this journal uses article numbers instead of page numbers. See further details here.