Evaluating the Adaptation of Chinese Torreya Plantations to Climate Change


1
Department of Biological and Environmental Sciences, Alabama A & M University, Normal, AL 35762, USA
2
Jiyang College of Zhejiang A & F University, Zhuji 311800, China
3
School of Soil and Water Conservation, Beijing Forestry University, Beijing 100083, China
*
Author to whom correspondence should be addressed.
Atmosphere 2020, 11(2), 176; https://doi.org/10.3390/atmos11020176
Submission received: 17 December 2019
/
Revised: 18 January 2020
/
Accepted: 6 February 2020
/
Published: 8 February 2020
(This article belongs to the Special Issue Development of Precise Indexes for Assessing the Potential Impacts of Climate Change)
Abstract
:Studying the capacity of some plant species to adapt to climate change is essential for ecological research and agricultural policy development. Chinese Torreya (Torreya grandis ‘Merrillii’) has been an important crop tree in subtropical China for over a thousand years. It is necessary to characterize its adaptation to climate change. In this study, the average monthly temperature and precipitation from 1901 to 2017 in the six regions with Chinese Torreya plantations at different provinces were analyzed. The results indicated that the average annual air temperature across these regions had increased by about 2.0 °C, but no general trend in the annual precipitation and incidence of drought was found. The annual air temperature that Chinese Torreya plantations had experienced was 12.96–18.23 °C; the highest and the lowest average monthly air temperatures were 30.1 °C and −0.8 °C, respectively. The lowest and the highest annual precipitation were 874.56 mm and 2501.88 mm, respectively. Chinese Torreya trees endured a severe drought period in the 1920s. The monthly air temperature at Zhuji, which is the central production region, showed a significant correlation with the air temperature in the other five regions. The monthly precipitation in Hunan and Guizhou had no significant correlation with that of Zhuji. Chinese Torreya plantations have been grown in the regions with a similar climate distance index of air temperatures but different precipitation. This tree has a high capacity to adapt to climate change based on the climate dynamics across its range. This approach may provide a way to evaluate climate adaptation in other tree species. These results may provide helpful information for the development of Chinese Torreya plantations.
1. Introduction
Climate is considered to be the primary limiting factor for the range limits of species [1,2], such as the distribution of forests and trees. There are three possible outcomes for tree populations under climate change scenarios: migration to new habitats (habitats shrink or expand), adaptation to new conditions at their current locations, and local extinction.
Considerable attention has been paid to the prediction of the future distribution of trees and forests using bio-climate envelope models. The assumptions behind these models include that (i) climate and environmental conditions are the primary factors of a realized tree species niche, and (ii) climate and tree species or forest distribution are at an equilibrium [3], which means that there are strong associations between climate and species range. In this way, the future distribution of a species can be directly predicted from future climate scenarios using the environmental parameters associated with the current species distribution [4]. Spatial climate variations among test sites are used to substitute for temporal climate variations and to make predictions about the response of populations to future climates, often because appropriate data are unavailable for some process-based parameters [5,6,7].
However, consideration of the biological capacity of populations, or recognition of the extent and role of adaptation under local climate dynamics, is needed [8]. Successful adaptation cases should be characterized [9]. The role of intrinsic biological factors in regulating tree distribution remains poorly understood. This missing information results in inconsistency in our understanding of species responses to recent warming. Some species have moved northward as expected, while others have remained static or have shifted in the opposite direction to the expected [10,11]. Despite regional warming of 0.6 °C, the forests of northern Canada showed no expansion over the last 25 years from satellite imaging [12]. Progress should be made in the monitoring and evaluation of adaptation [9].
Thus, it is essential to study the extent of climate variation within species distribution regions to understand the adaptations of species to climate change. Studying adaptations to climate change is necessary so that people can adjust ecological, social, or economic systems in response to actual or expected climate change and its impact [13]. Quantifying the adaptability of plant species may provide strategies to mitigate the effects of climate change through species diversity [7,14]. Changes in the viability or distribution of some species may bring impacts on ecosystem functions and services [15,16].
The Chinese Torreya tree (Torreya grandis ‘Merrillii’) is an evergreen conifer that is found in the subtropical mountains of China, such as in Zhejiang, Anhui, and Fujian Provinces (Figure 1) [17,18]. The origin of Chinese Torreya plantations can be traced back to over a thousand years ago to the late Tang Dynasty in China. The trees can live for hundreds of years, sometimes even over a thousand years; some existing trees are as old as approximately 1500 years [17]. These trees were selected from quality trees of Torreya grandis Fortune ex Lindl. that were grafted on other trees in the Torreya genus [17,18]. Chinese Torreya is an important economic tree species that has been used for the production of nuts as food in China for thousands of years [18,19,20,21,22]. The tree also has a high medicinal value [17,18,23]. Due to the increasing requirement of nuts for recreational food, the price of the processed nuts has increased to $50–70 per kg. More than 50,000 farmers have been raised out of poverty by planting this valuable tree species to produce nuts in the Shaoxing region of China [18,20,24]. During the past ten years, in Zhuji County of Zhejiang Province alone (which is at the central production area), the total area of Chinese Torreya plantations increased from about 5333 ha in 2007 to 9000 ha in 2017 [20]. Currently, thousands of hectares of Chinese Torreya plantations have been planted in the surrounding counties and provinces. Regional farmers are developing large industrial plantations to increase nut production, especially in mountainous regions with weak economies. The governments in these regions have used Chinese Torreya plantations as an approach to help raise local people out of poverty.
Global climate change can affect local or regional vegetation in southeastern China [25]. Since Chinese Torreya trees are essential to the local economy, it is necessary to evaluate their adaptation to climate change, even though Chinese Torreya trees still grow well throughout their old habitat regions. However, the adaptability of tree species to climate change is challenging to test experimentally due to their long life cycles, high reproductive age, and the slow rate of speciation and extinction of trees [26]. Drought stress could affect the survival of seedlings and saplings of Chinese Torreya [17,27] because young roots cannot reach deep groundwater; however, this can often be combined with other factors (such as intensive solar radiation and extreme high and low temperatures) that cause tree deaths. So far, there have been limited reports on climate change and Chinese Torreya on a large scale. Thus, the goal of this study was to estimate how much climate variation Chinese Torreya had already experienced. The detailed objectives for this study included determining answers to the following questions: (1) Has there been a general trend in climate dynamics during the past several decades in regions with Chinese Torreya plantations? (2) How much variation in temperature and precipitation occurred in the regions with Chinese Torreya plantations in China? Was there a trend of increasing occurrences of drought? Finally, (3) how similar is the climate in those regions? The answers to these questions may help with the establishment of Chinese Torreya plantations in the new areas and with the management of established Chinese Torreya plantations.
2. Materials and Methods
2.1. Study Areas
Chinese Torreya plantations are sparsely distributed across the middle part of the subtropical region of China (Figure 1). For this study, six regions that have Chinse Torreya plantations in different provinces were selected [17]. The detailed information of these regions is listed in Table 1. These regions included Shexuan, Anhui Province (short name: Anhui); Qianshan, Jiangxi Province (Jiangxi); Wuyishan, Fujian Province (Fujian); Rongshan, Hunan Province (Hunan); Songtao, Guizhou Province (Guizhou); and Zhuji, Zhejiang Province (Zhuji). Since the seedlings in other regions were once introduced from Zhuji, then, Zhuji was considered to be the central production area. The climate niche of Chinese Torreya was initially supposed to be an annual air temperature that is above 15 °C and annual precipitation of 1000 mm [17], based on its geographic distribution.
2.2. Climate Data
Since there were limited ground observations of climate data in regions with Chinese Torreya plantations, the climate data for these six regions were obtained from the Climate Research Unit (University of East Anglia, UK). High-resolution gridded (0.5° × 0.5°) data for monthly air temperature and precipitation from 1901 to 2017 were used in this study. The data were drawn directly from the CRU TS 4.03 dataset, which included nearby observations [28].
2.3. Climate Properties
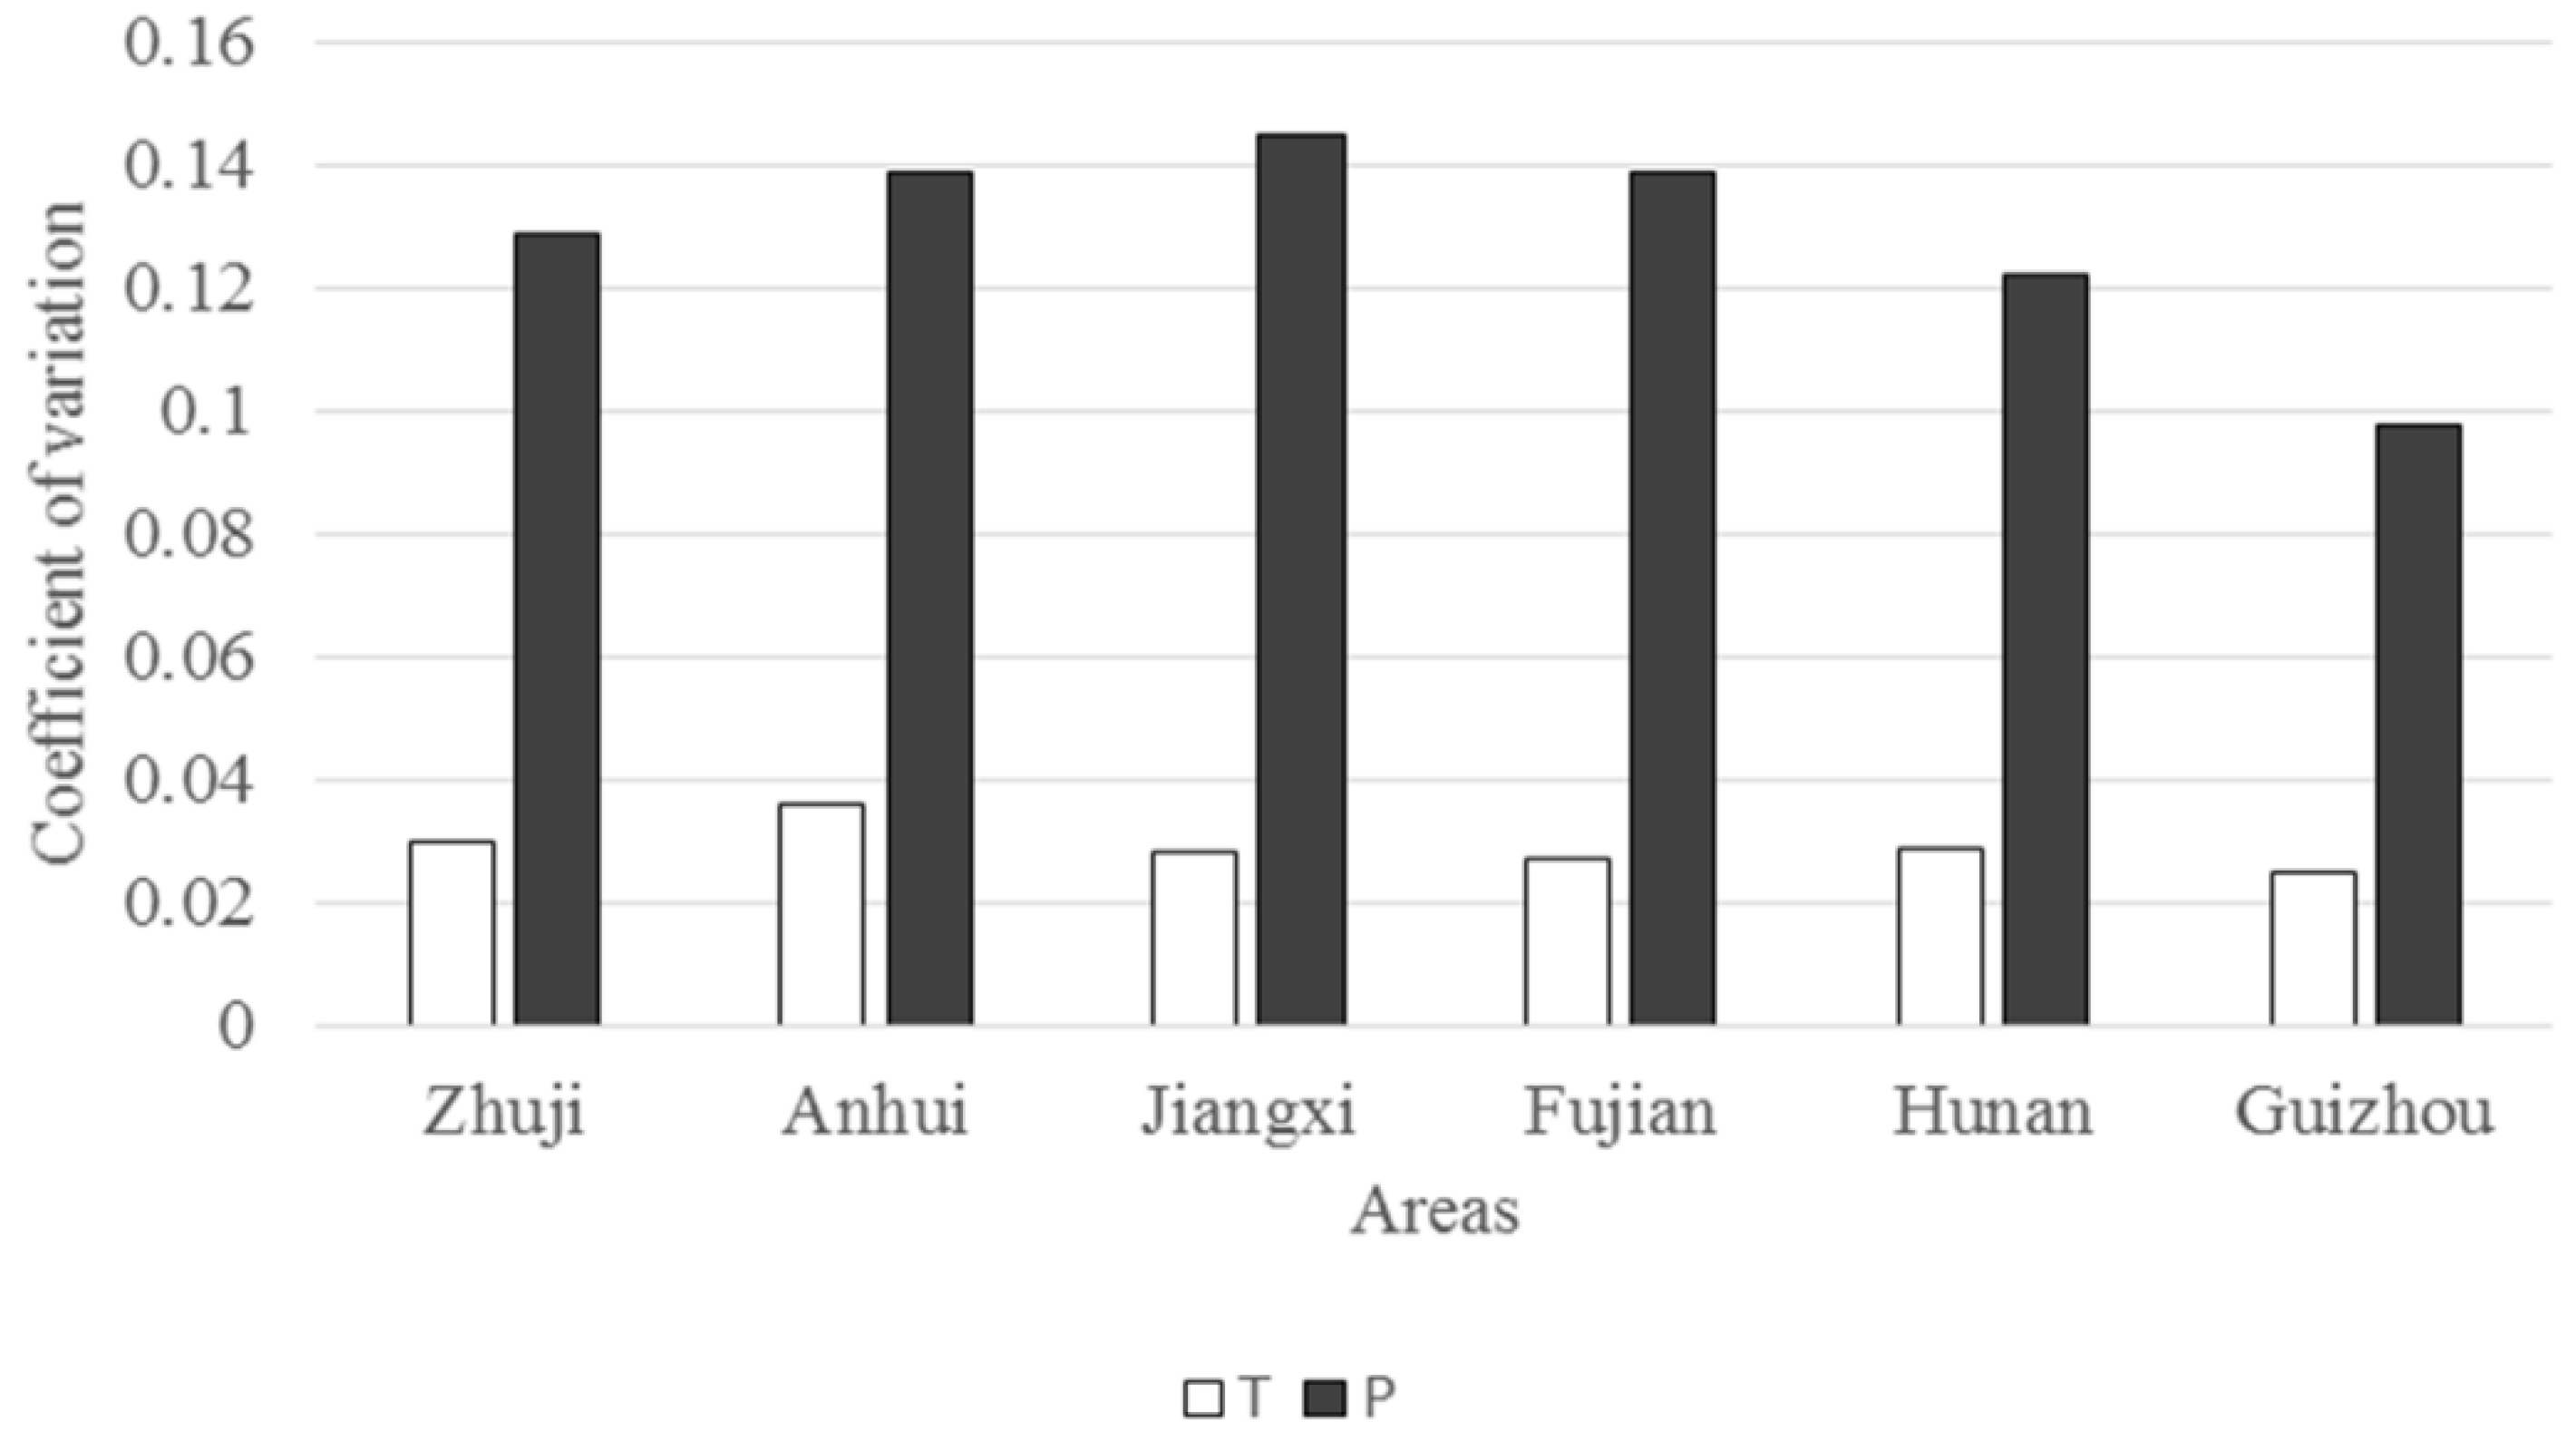
Stability was estimated using the coefficient of variation (CV), which is equal to the standard deviation/average. The average refers to the mean air temperature (monthly or yearly) from 1901 to 2017. A low CV suggests that the climate (temperature and precipitation) was stable.
The occurrence of the drought was estimated using the standardized precipitation index (SPI), which is based on [29], and only precipitation is included.
Monthly SPI = (Monthly Precipitation – the average precipitation of this month from 1901 to 2017)/standard deviation of precipitation in this month from 1901 to 2017.
Yearly SPI = Sum of every monthly SPI in that year.
If the yearly SPI < −1.0, then that year was considered a drought year [29]. The number of drought years was totaled for each decade from 1901 to 2017, which might be meaningful for forest plantations. Then, the drought probability in each decade was derived.
Since Zhuji is considered to be the central production area for Chinese Torreya plantations, the climate in Zhuji was compared with the climate in other regions with Chinese Torreya plantations. In order to measure the difference in climate among various sites, we used the distance index to estimate climate distance with the following equation:
This index includes any similarity in monthly temperature and precipitation in each year from 1901 to 2017. Tn: average monthly temperature in Zhuji from January to December of each year; Tx,n: average temperature in another region (x) from January to December; Pn: average monthly precipitation in Zhuji from January to December; Px,n: average monthly precipitation in another region (x) from January to December. A low climate distance index indicates that the climates of the two regions are very similar.
2.4. Statistical Analysis
Pearson correlation was used to determine any correlations in the monthly air temperature and precipitation from 1901 to 2017 between Zhuji and other production regions. The correlation coefficients were recorded. The statistical test was considered significant at p < 0.05.
3. Results
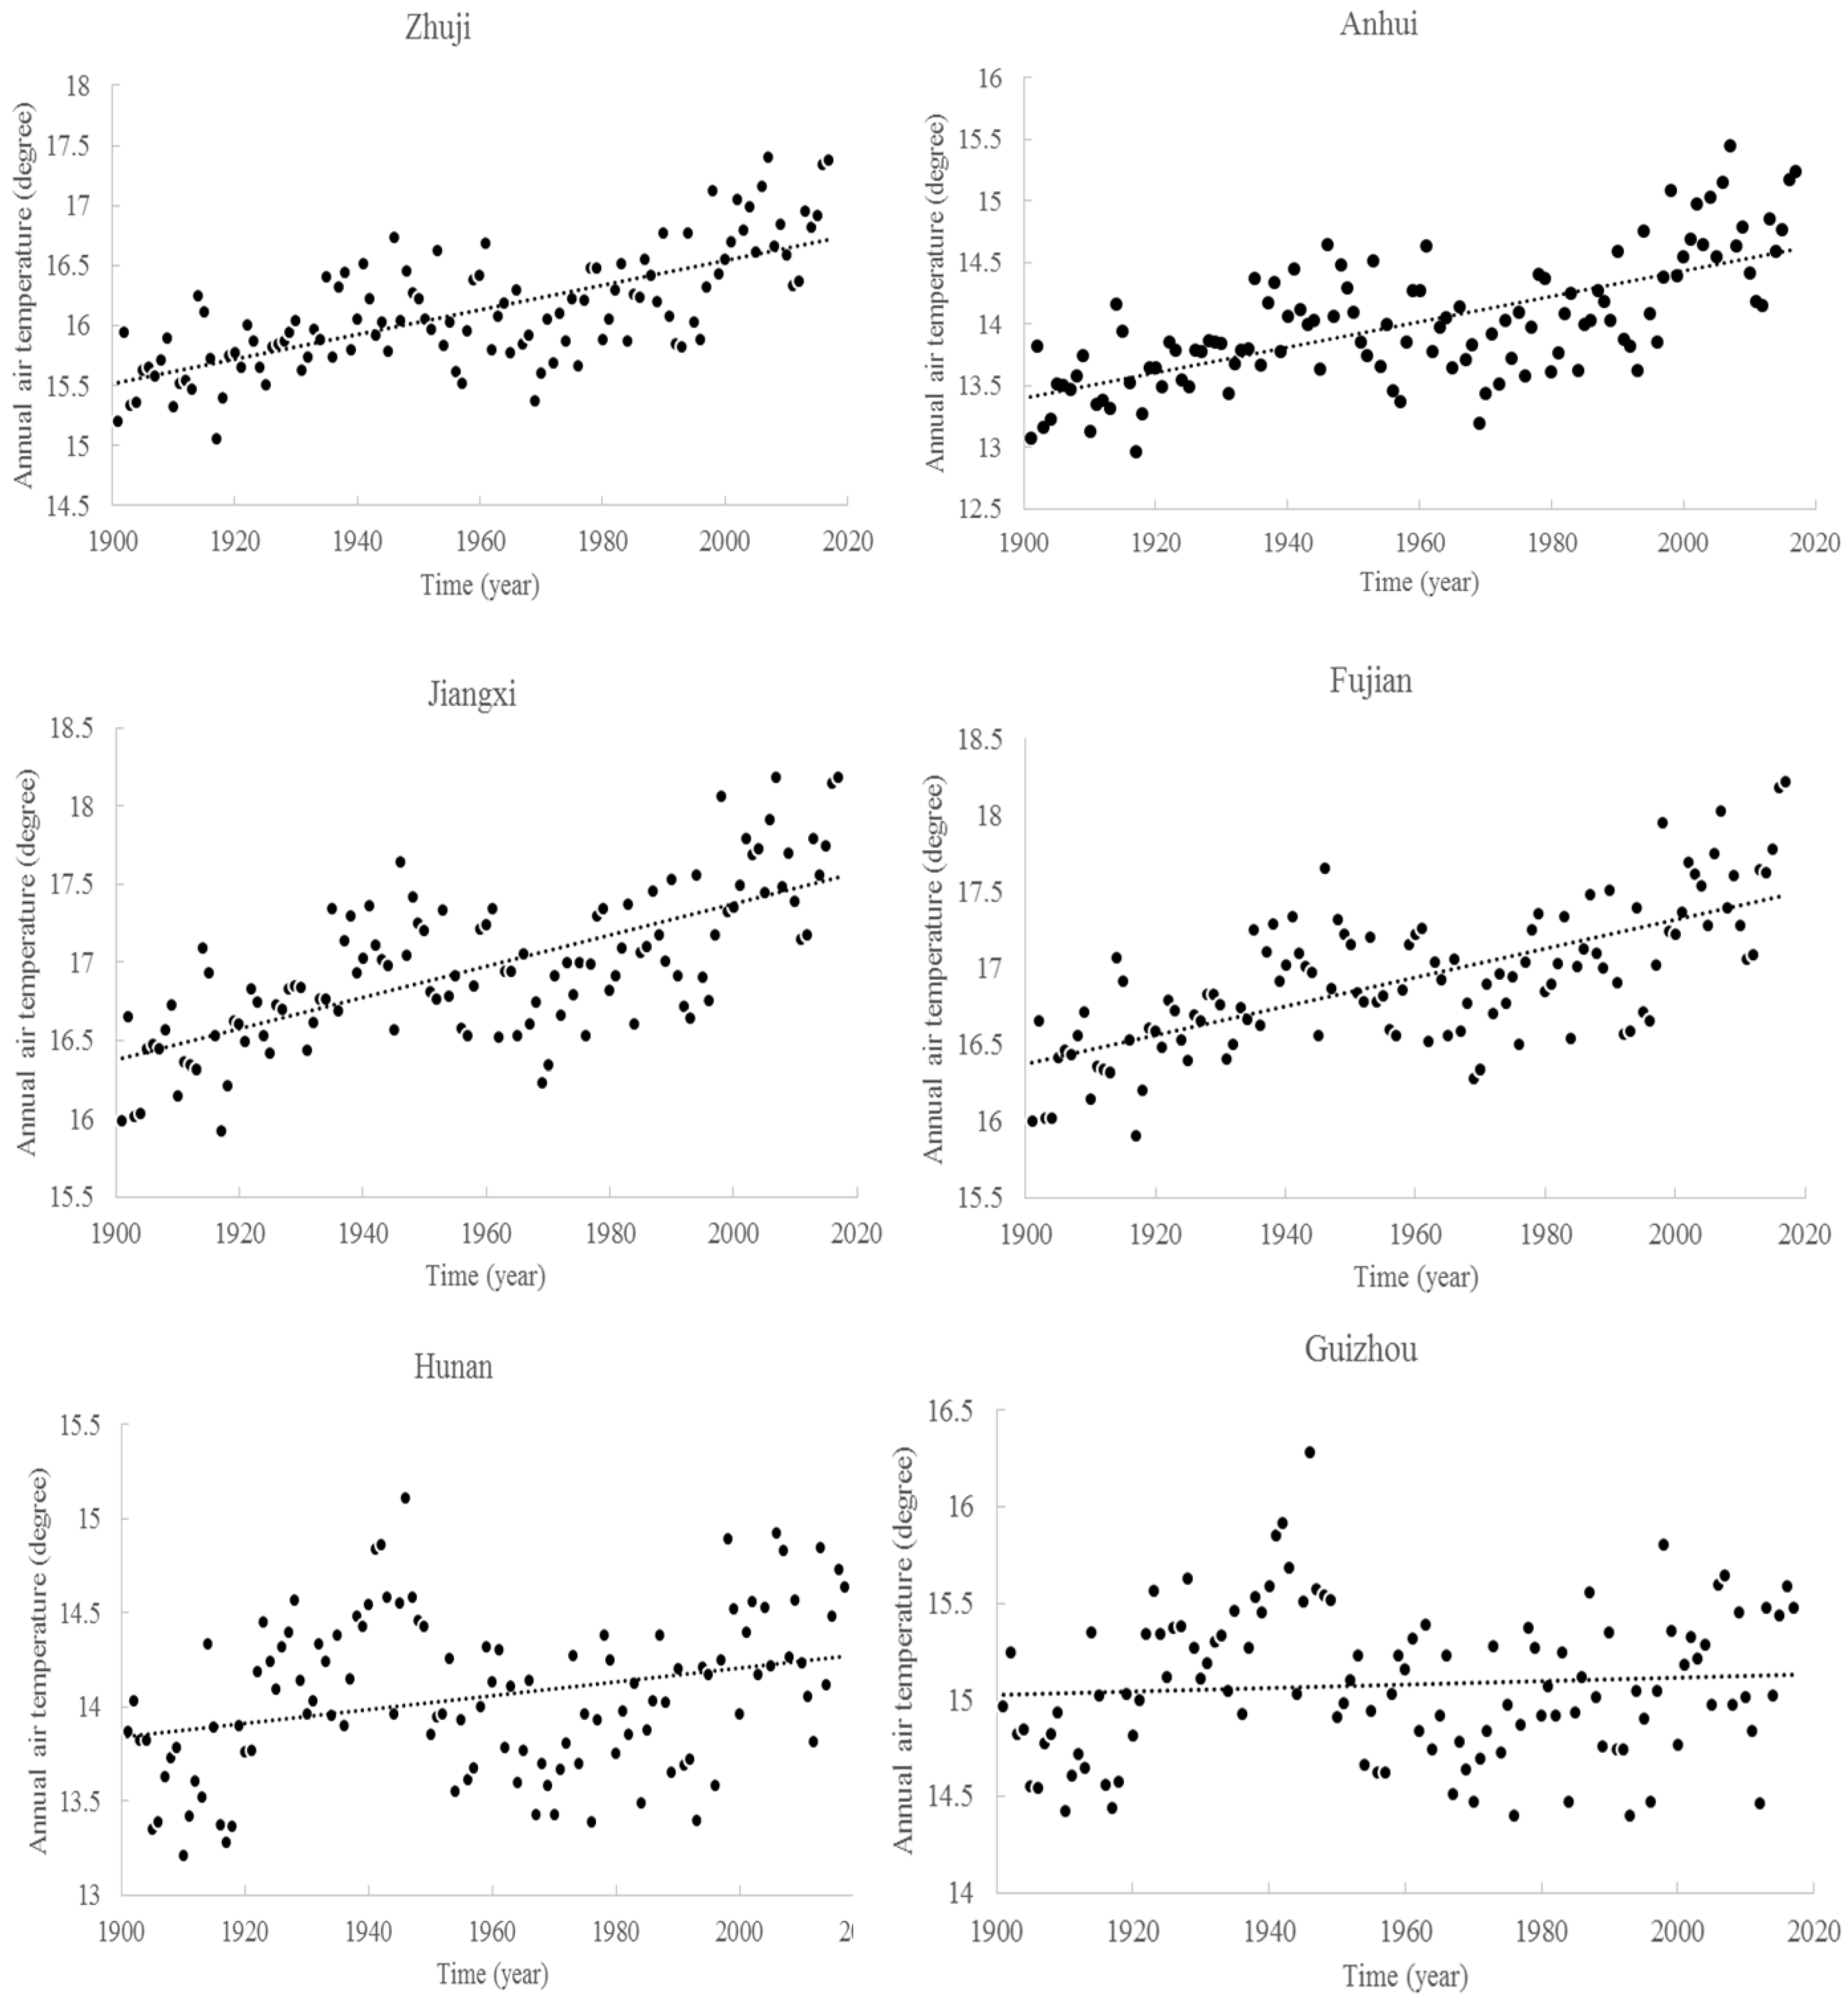
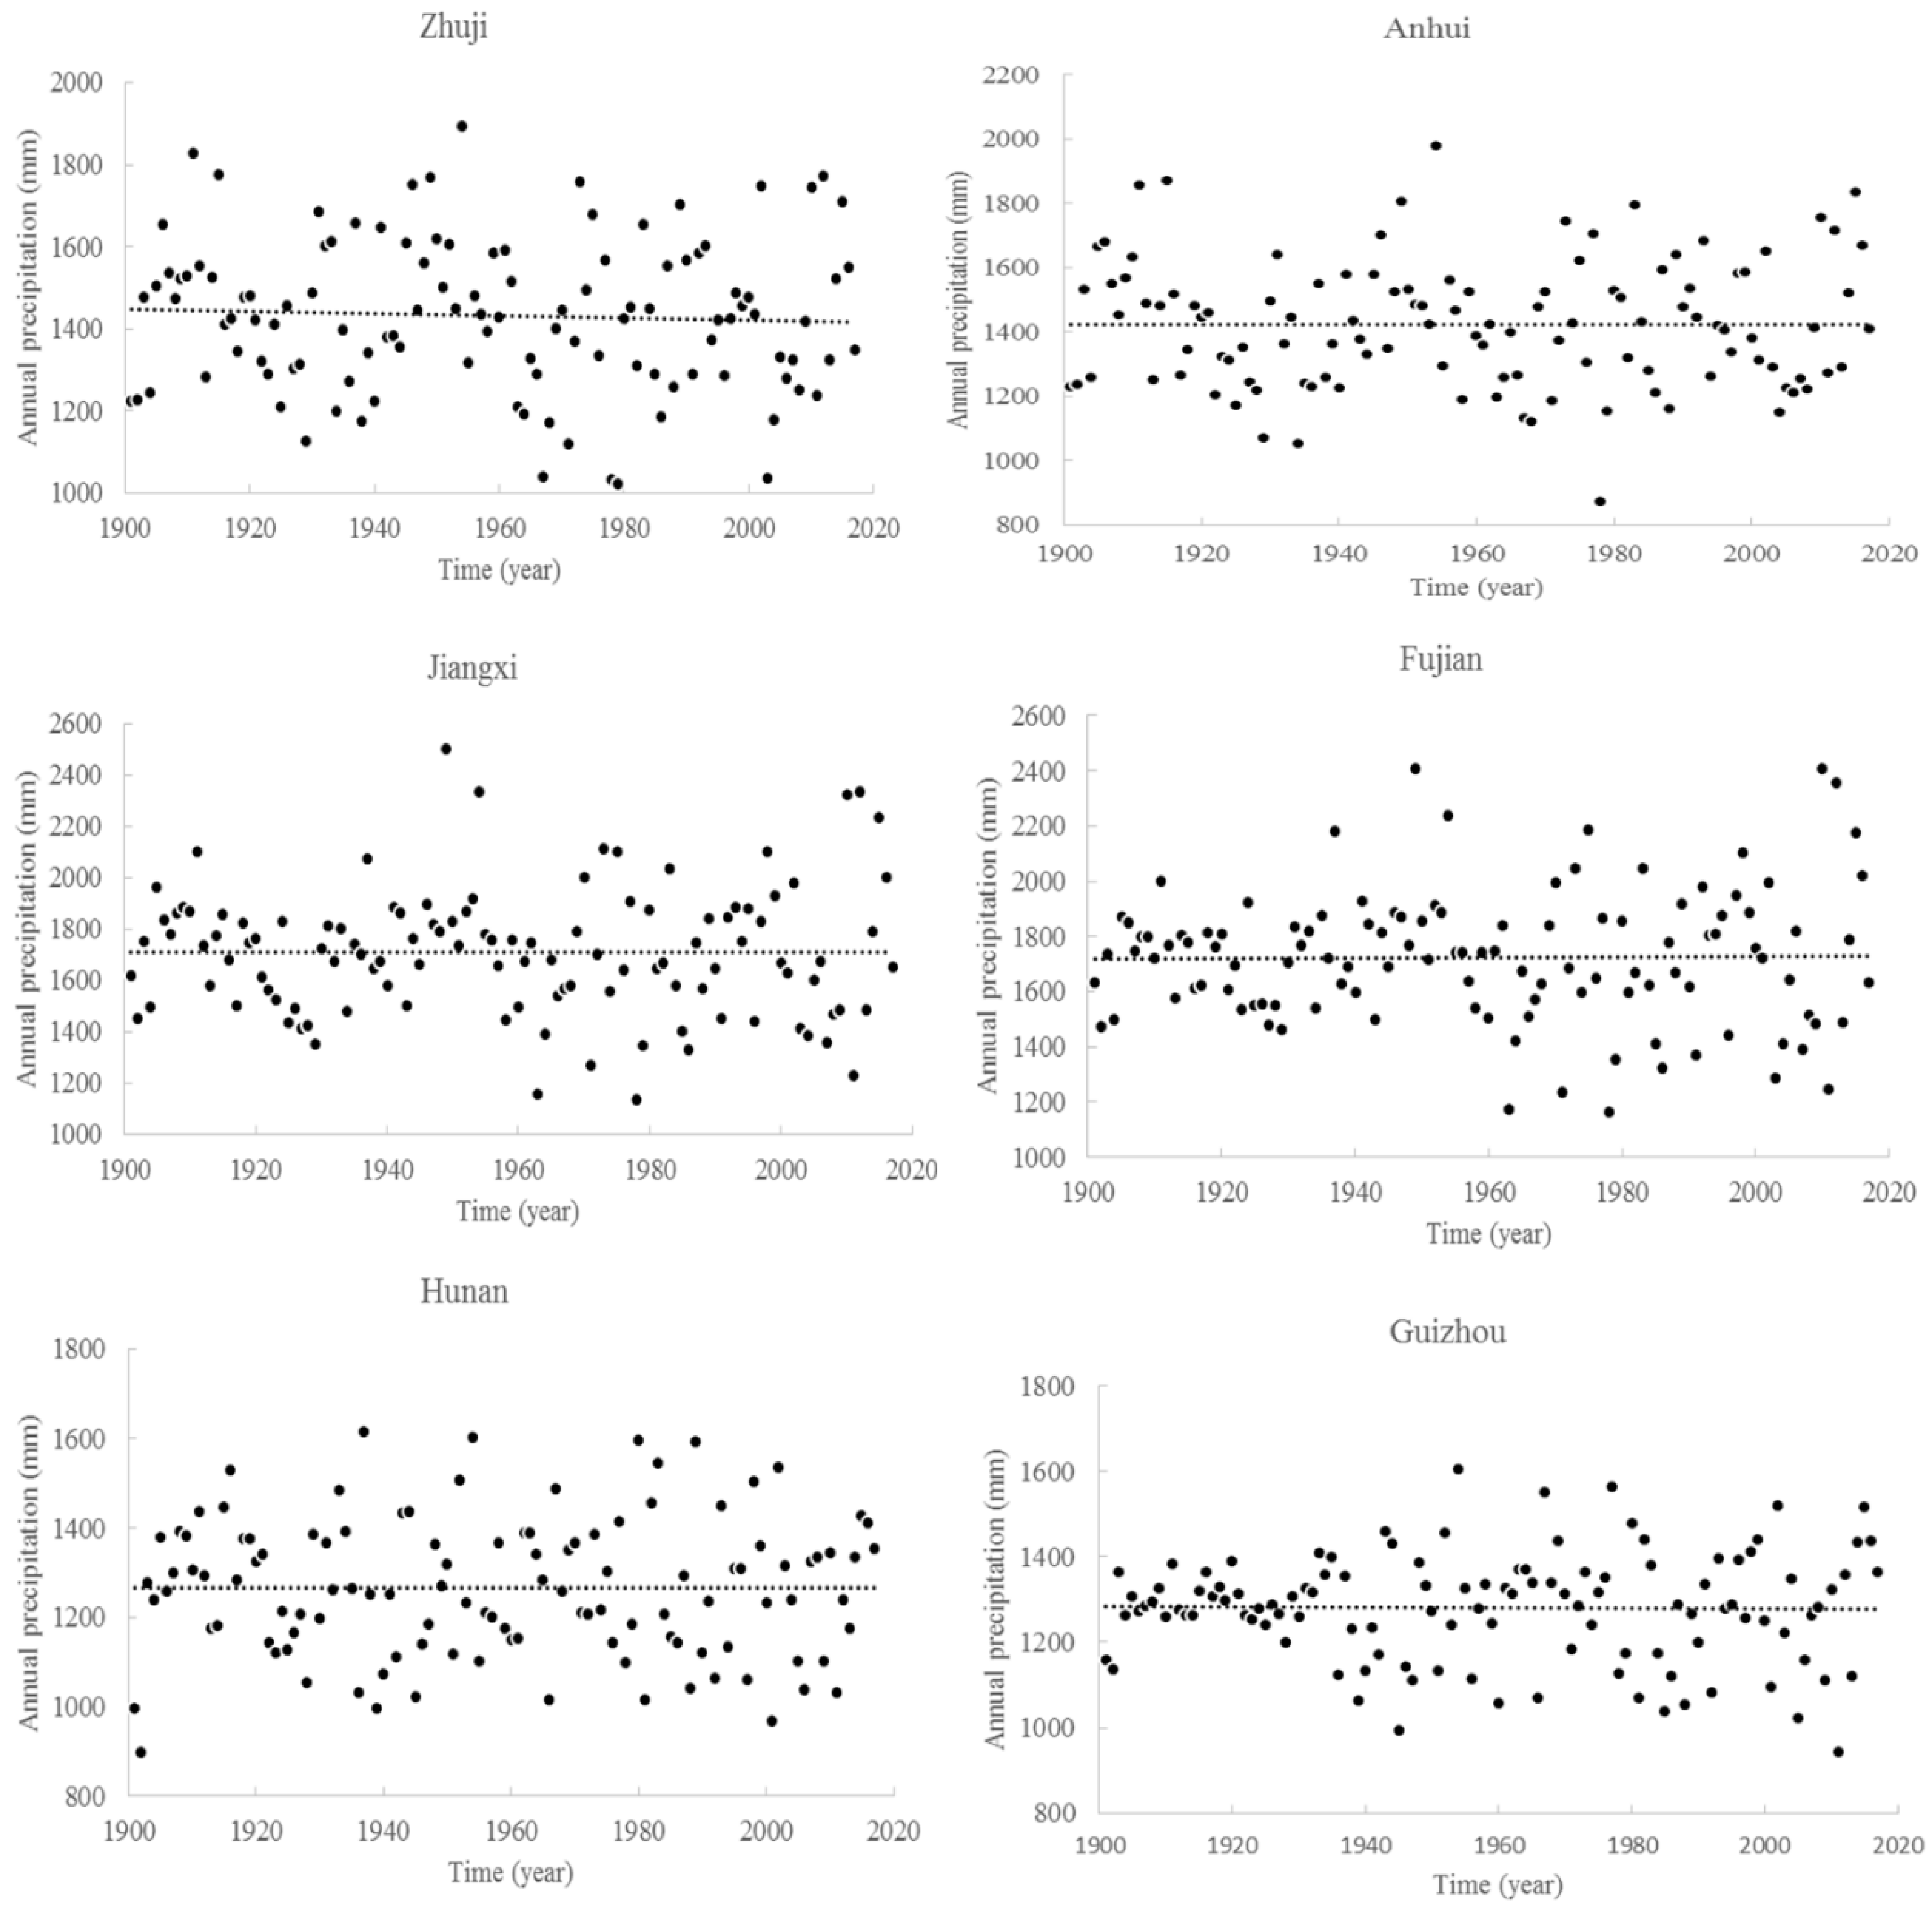
There was a general trend of increasing annual air temperatures across these regions with Chinese Torreya plantations except for Guizhou (Figure 2). The average annual air temperature across these regions increased by 2.0 °C from the 1900s to the 2010s. Fujian, Anhui, and Jiangxi increased by about 2.3 °C, but Guizhou only increased by about 1.2 °C. There was no general trend in the annual precipitation across all of the regions (Figure 3). Fujian had the highest annual precipitation (1700 mm), and Hunan had the lowest (1200 mm). The annual air temperature was more stable than the annual precipitation across all of the regions (Figure 4). Guizhou had the most stable climate, with a CV of 0.025 for the annual air temperature and 0.098 for the annual precipitation. The annual air temperature and the annual precipitation of Anhui and Jiangxi, respectively, were less stable.
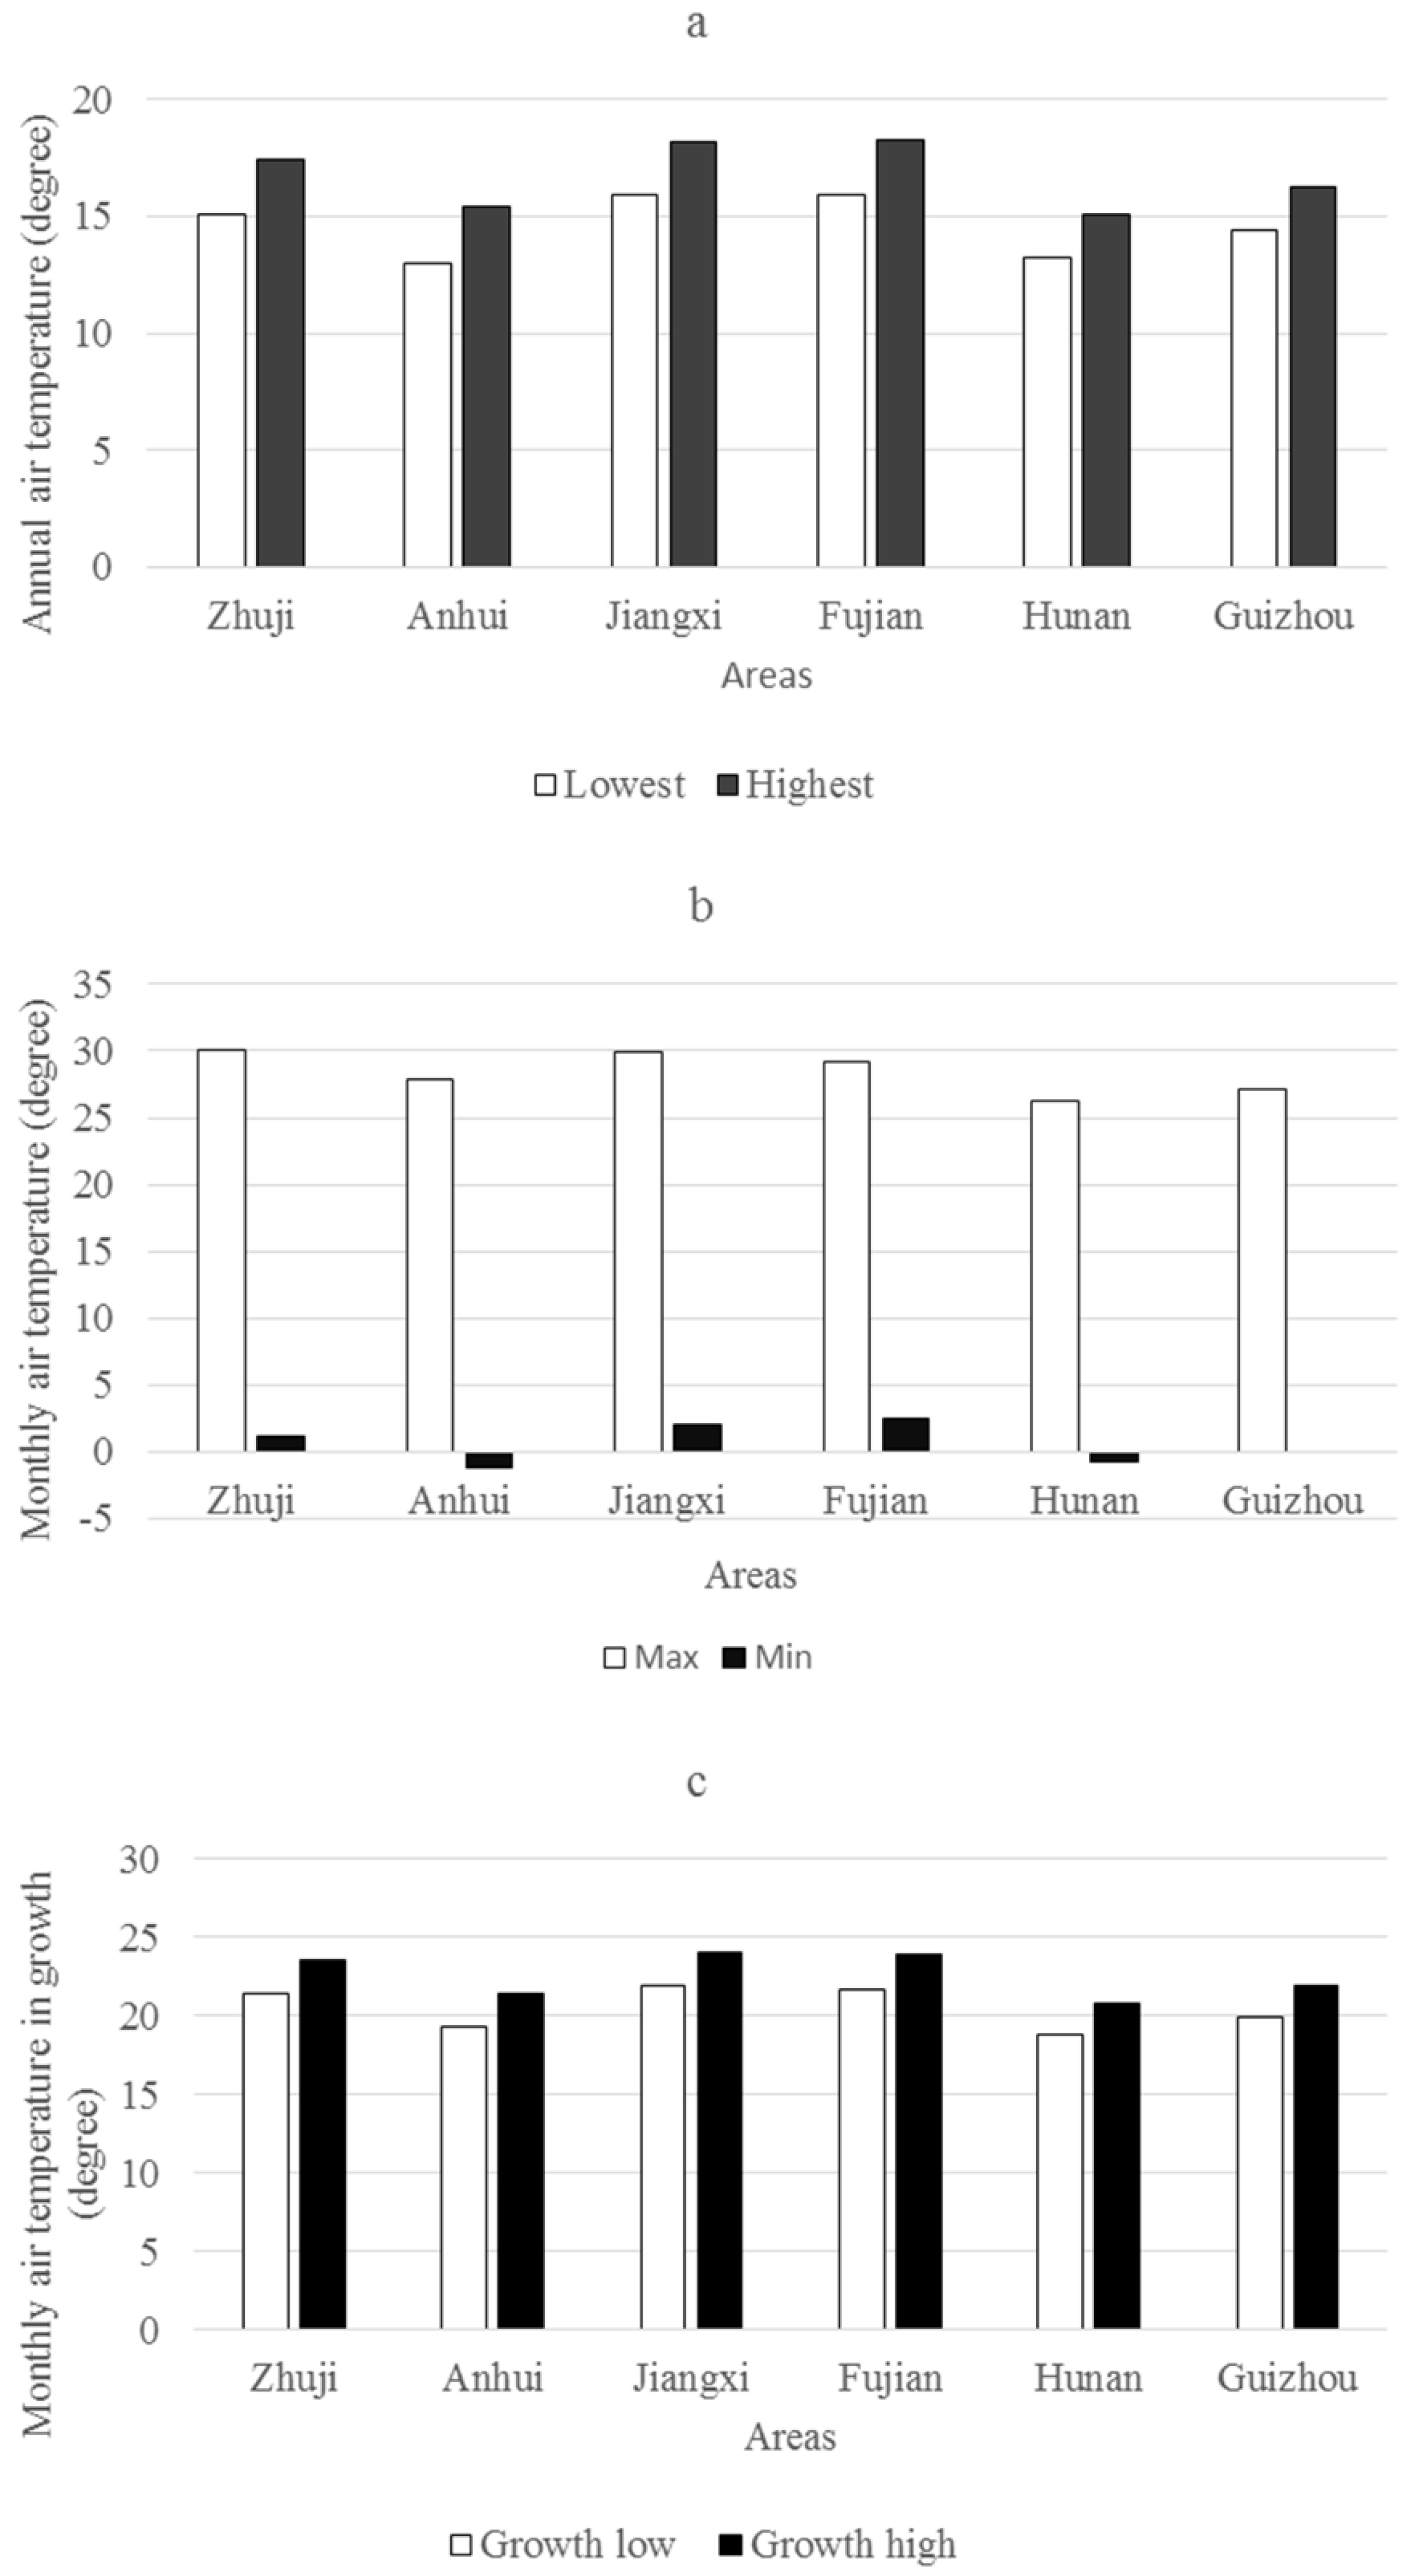
The lowest and highest annual air temperatures varied across the different regions with Chinese Torreya plantations (Figure 5a). The average difference between the upper and low limits of annual air temperatures was about 2.2 °C across all regions. Overall, the annual air temperature range that Chinese Torreya plantations had experienced was 12.96–18.23 °C across these regions. The highest and the lowest average monthly air temperatures that had occurred in these regions were 30.1 °C and −0.8 °C, respectively (Figure 5b). The average monthly air temperature during the growing season (from April to November) varied from 18.84 °C to 24.06 °C (Figure 5c).
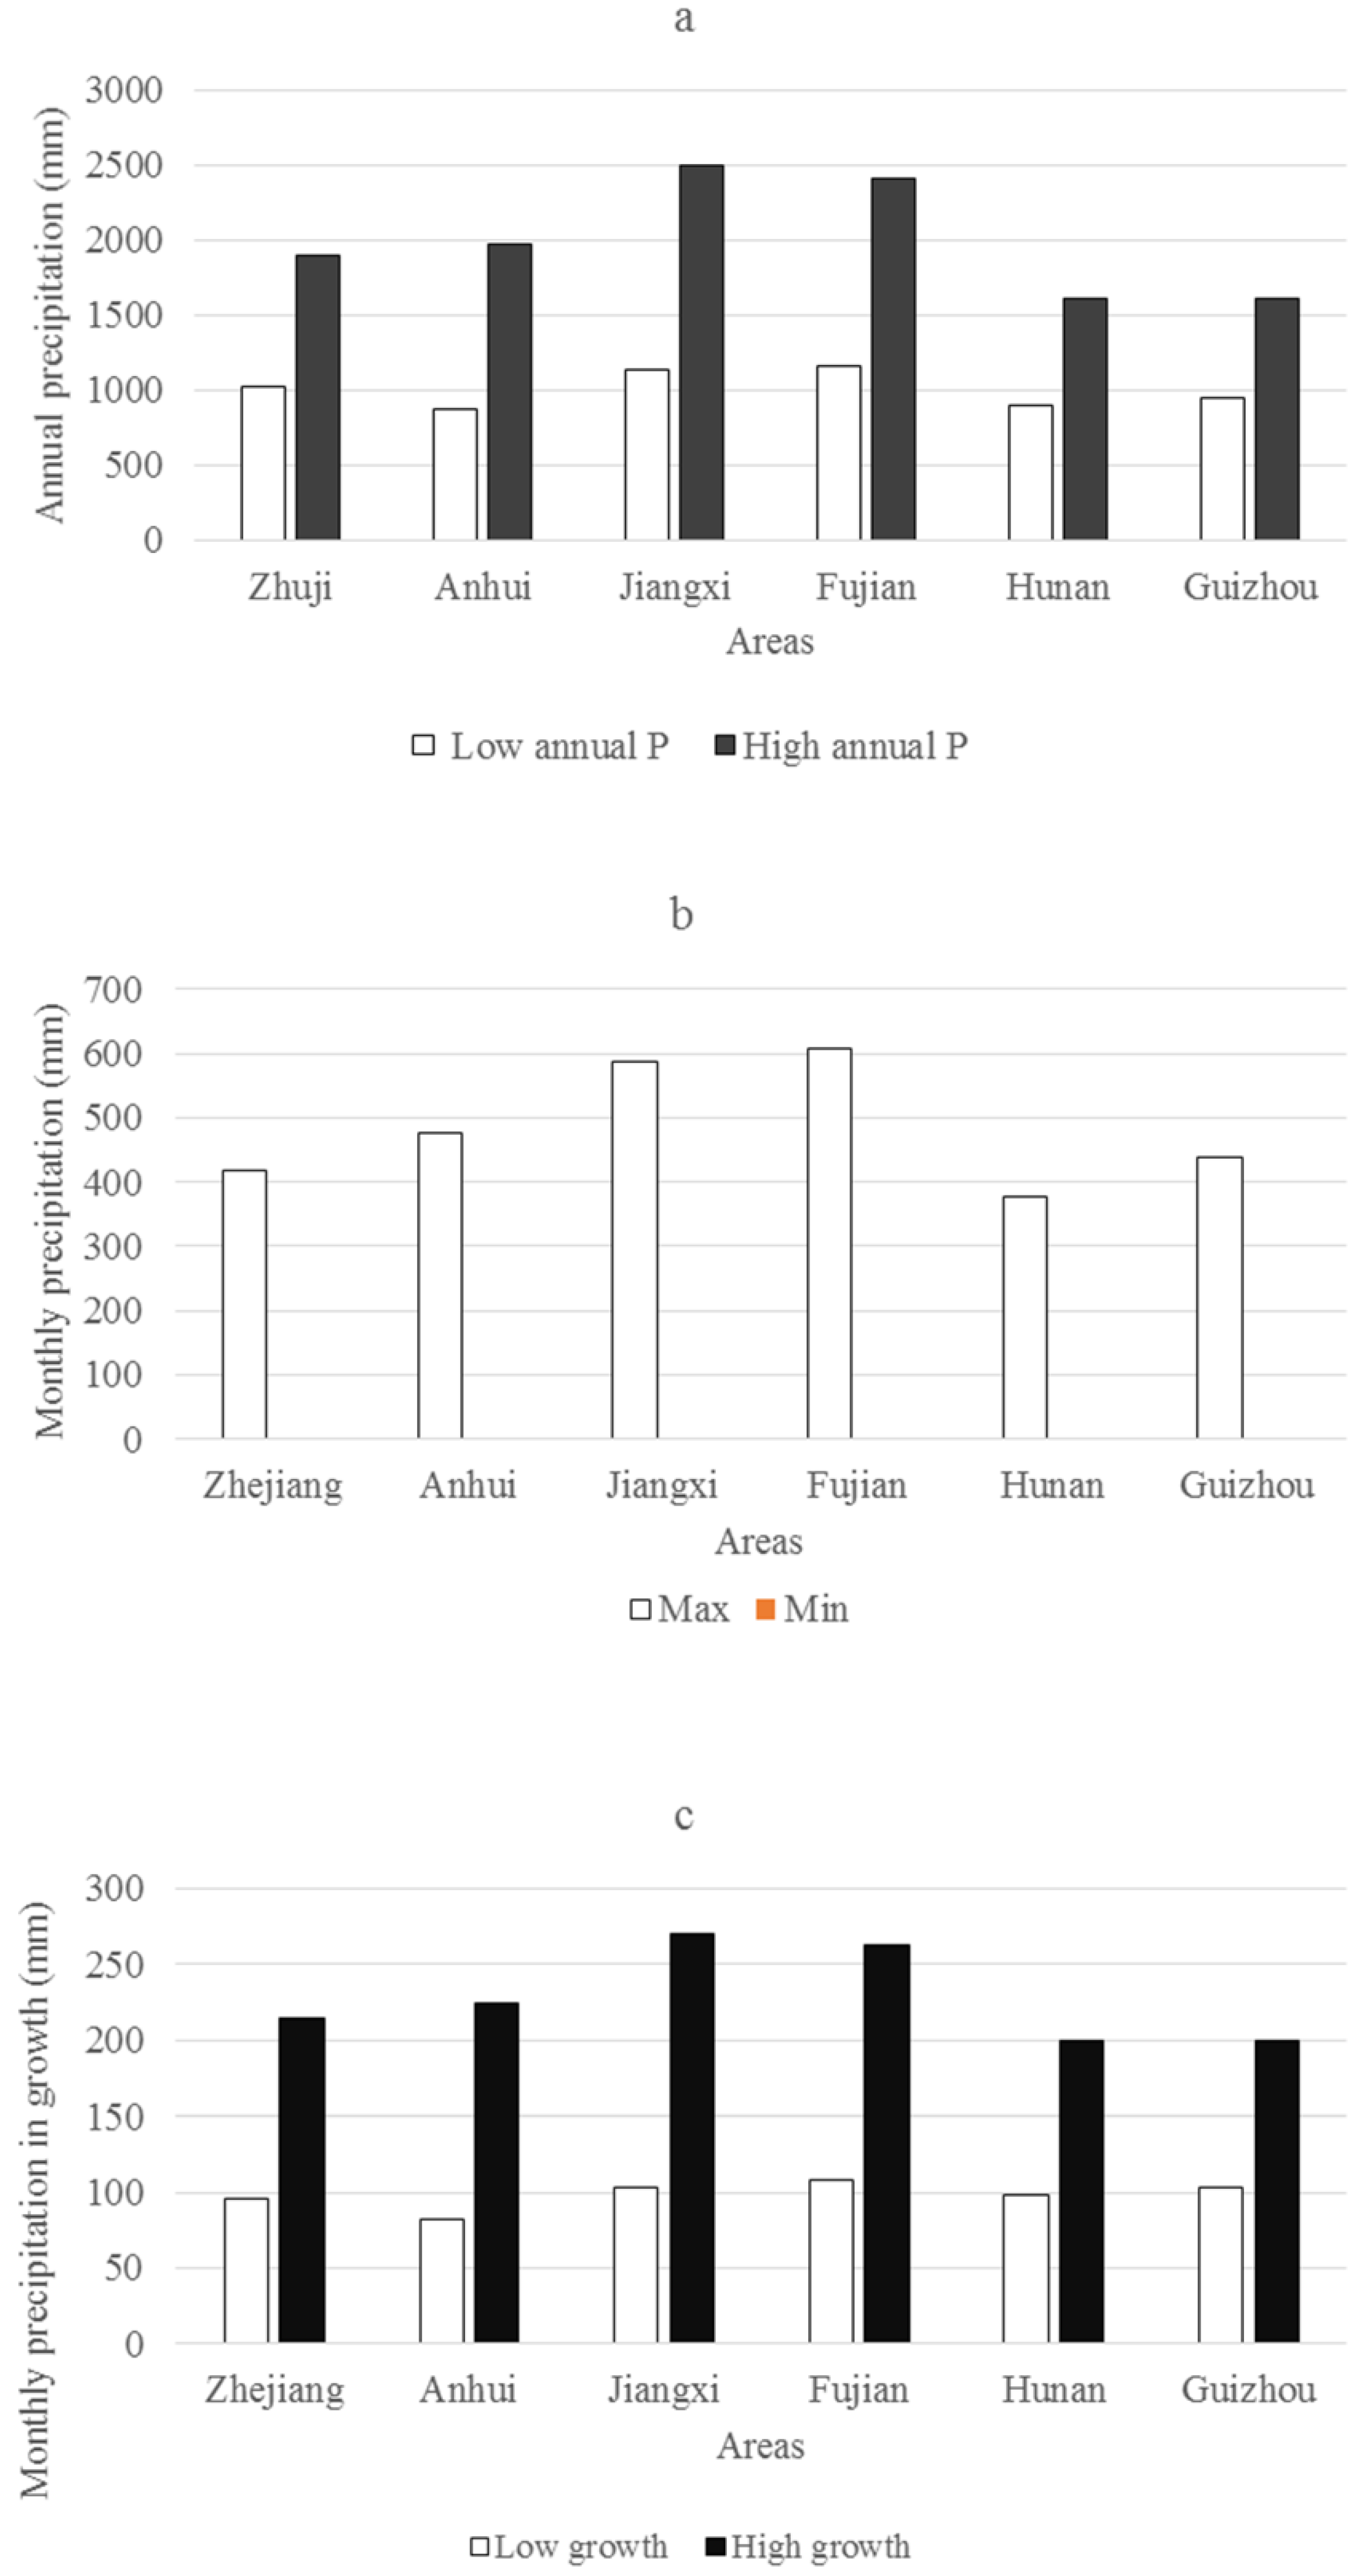
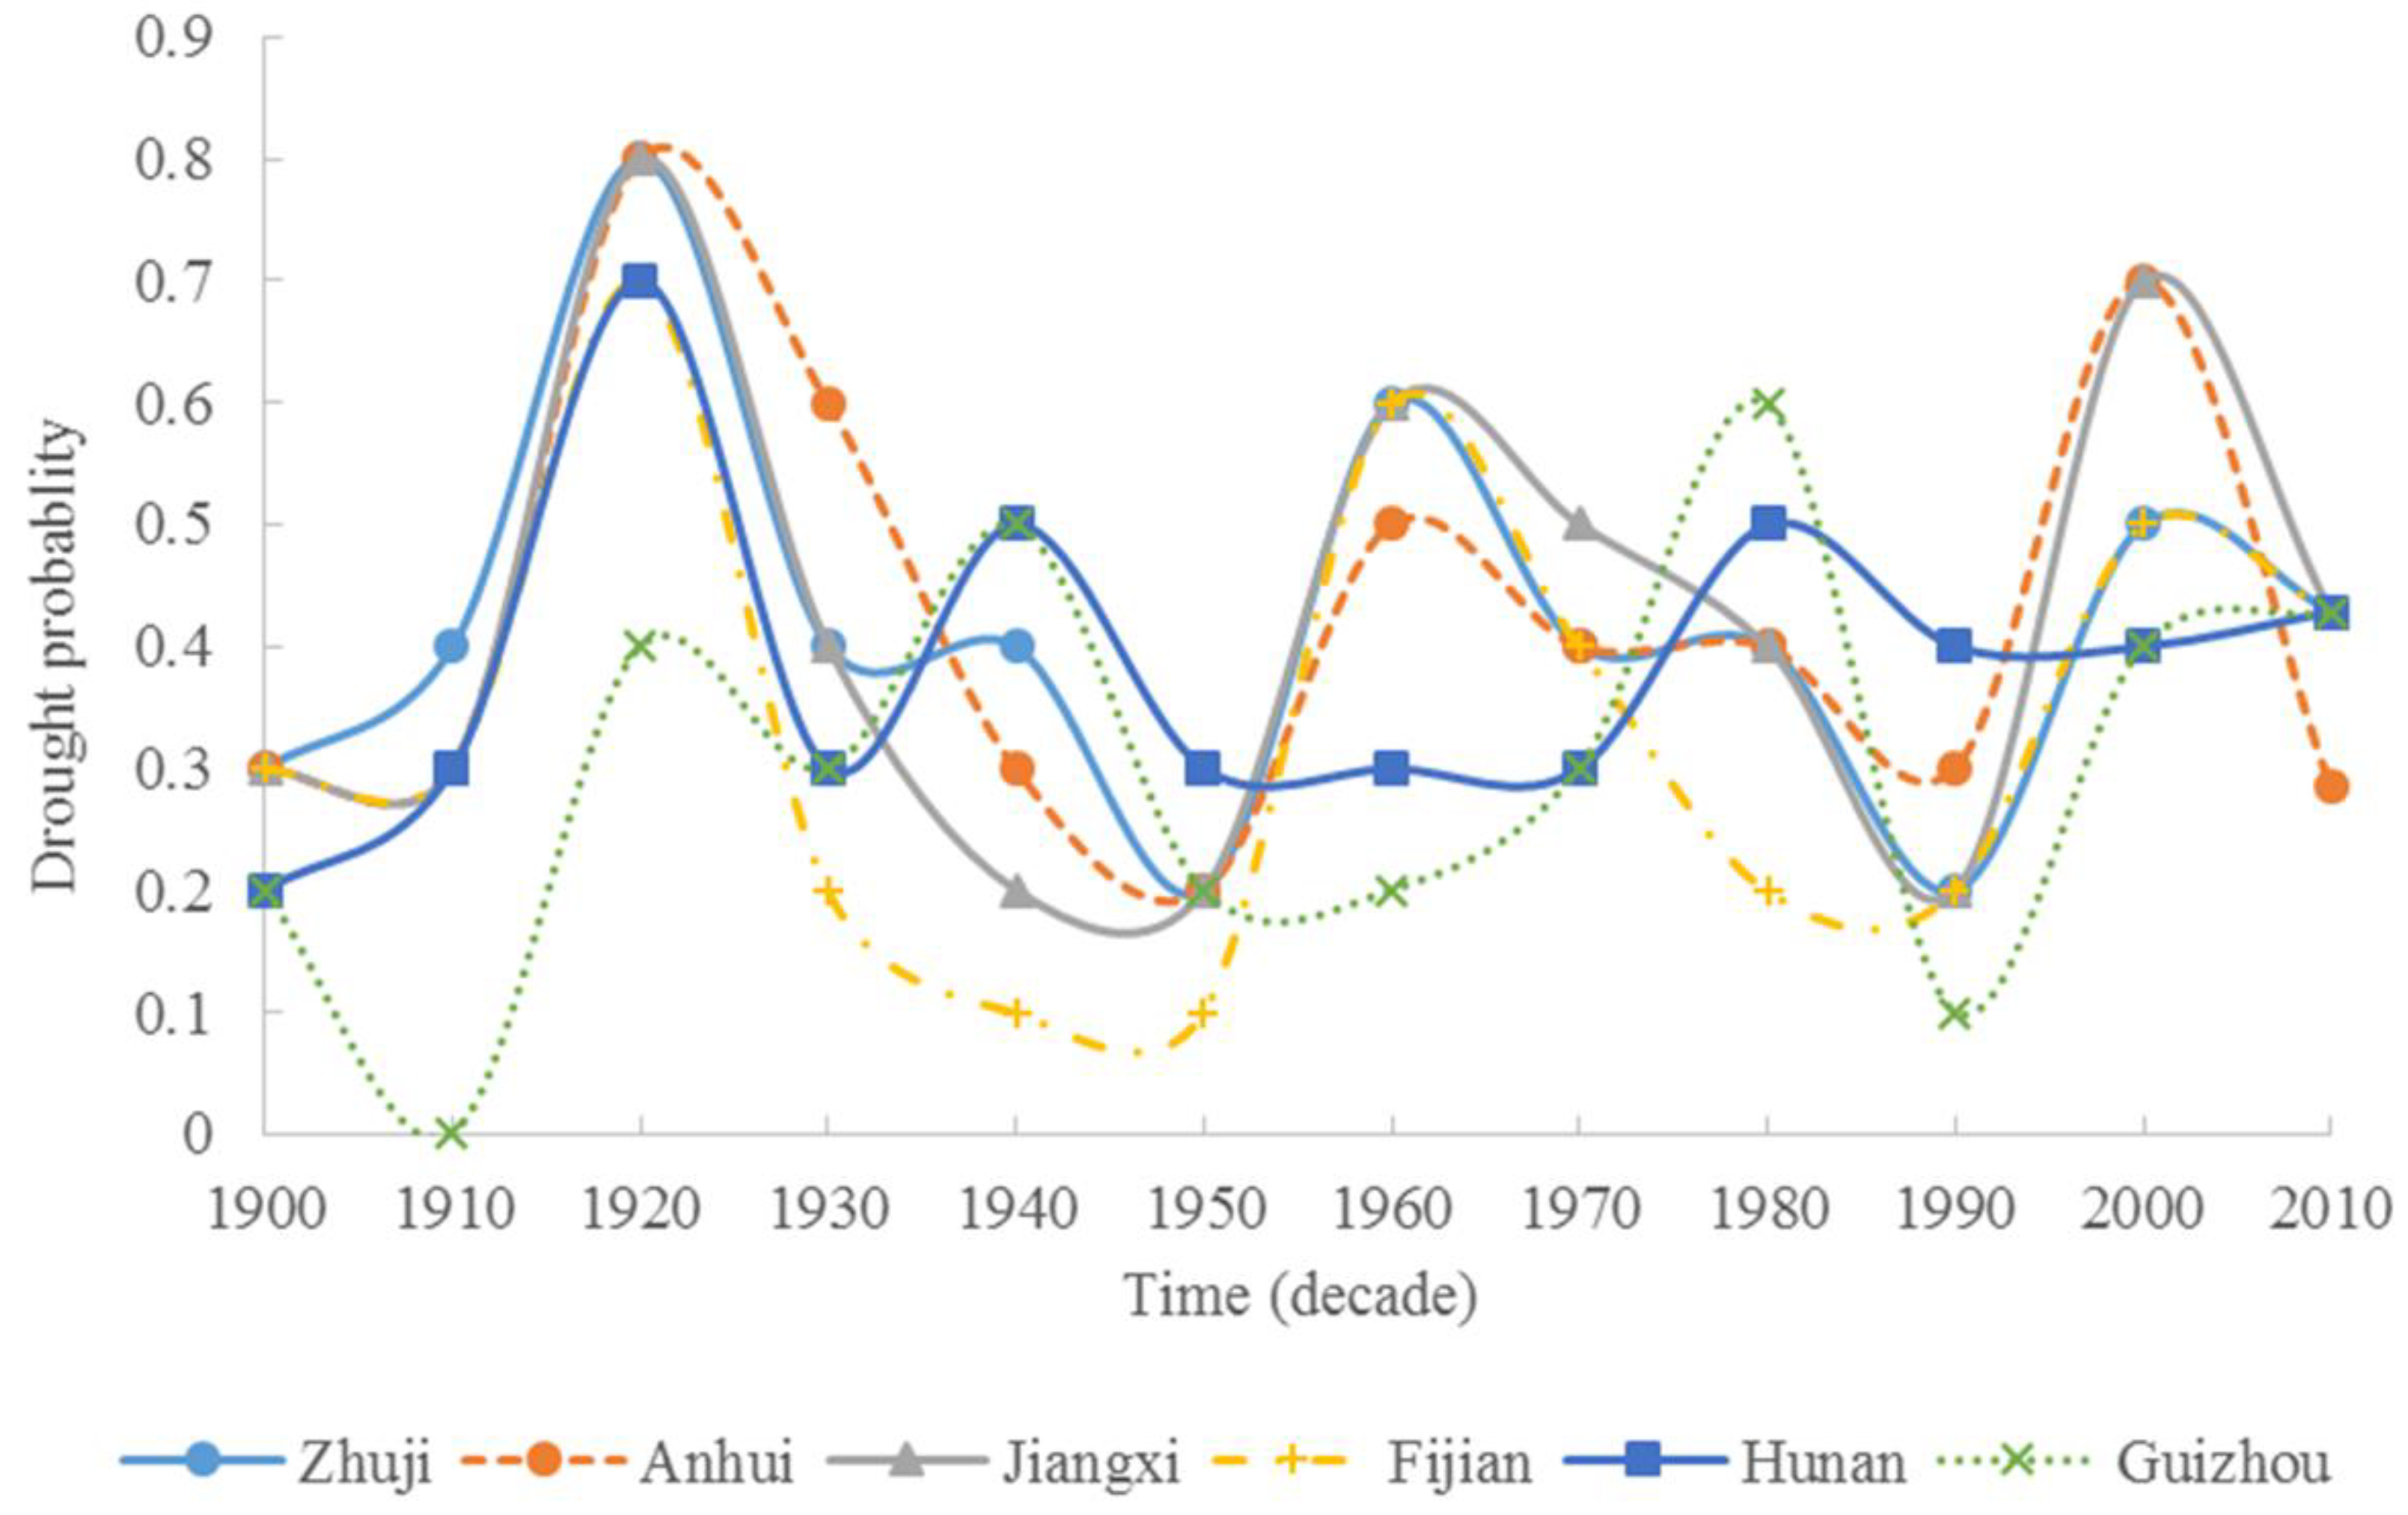
The lowest and highest annual precipitations that had occurred across the regions with Chinese Torreya plantations were 874.56 mm and 2501.88 mm, respectively (Figure 6a). The highest and lowest monthly precipitations were 606.8 mm and 0 mm, respectively (Figure 6b). The latter suggests that the Chinese Torreya plantation could tolerate conditions with no monthly precipitation. During the growing seasons, the average monthly precipitation varied from 82.29 mm to 269.84 mm (Figure 6c). The dynamics of drought occurrences at the decade scale were similar among Zhuji, Anhui, and Jiangxi (Figure 7), but Hunan and Guizhou were both different from Zhuji. Chinese Torreya plantations endured a long drought period (70–80% of the time) during the 1920s in all of these regions except for Guizhou. There was no general trend for increases in the drought occurrences at a decade scale from 1901 to 2017.
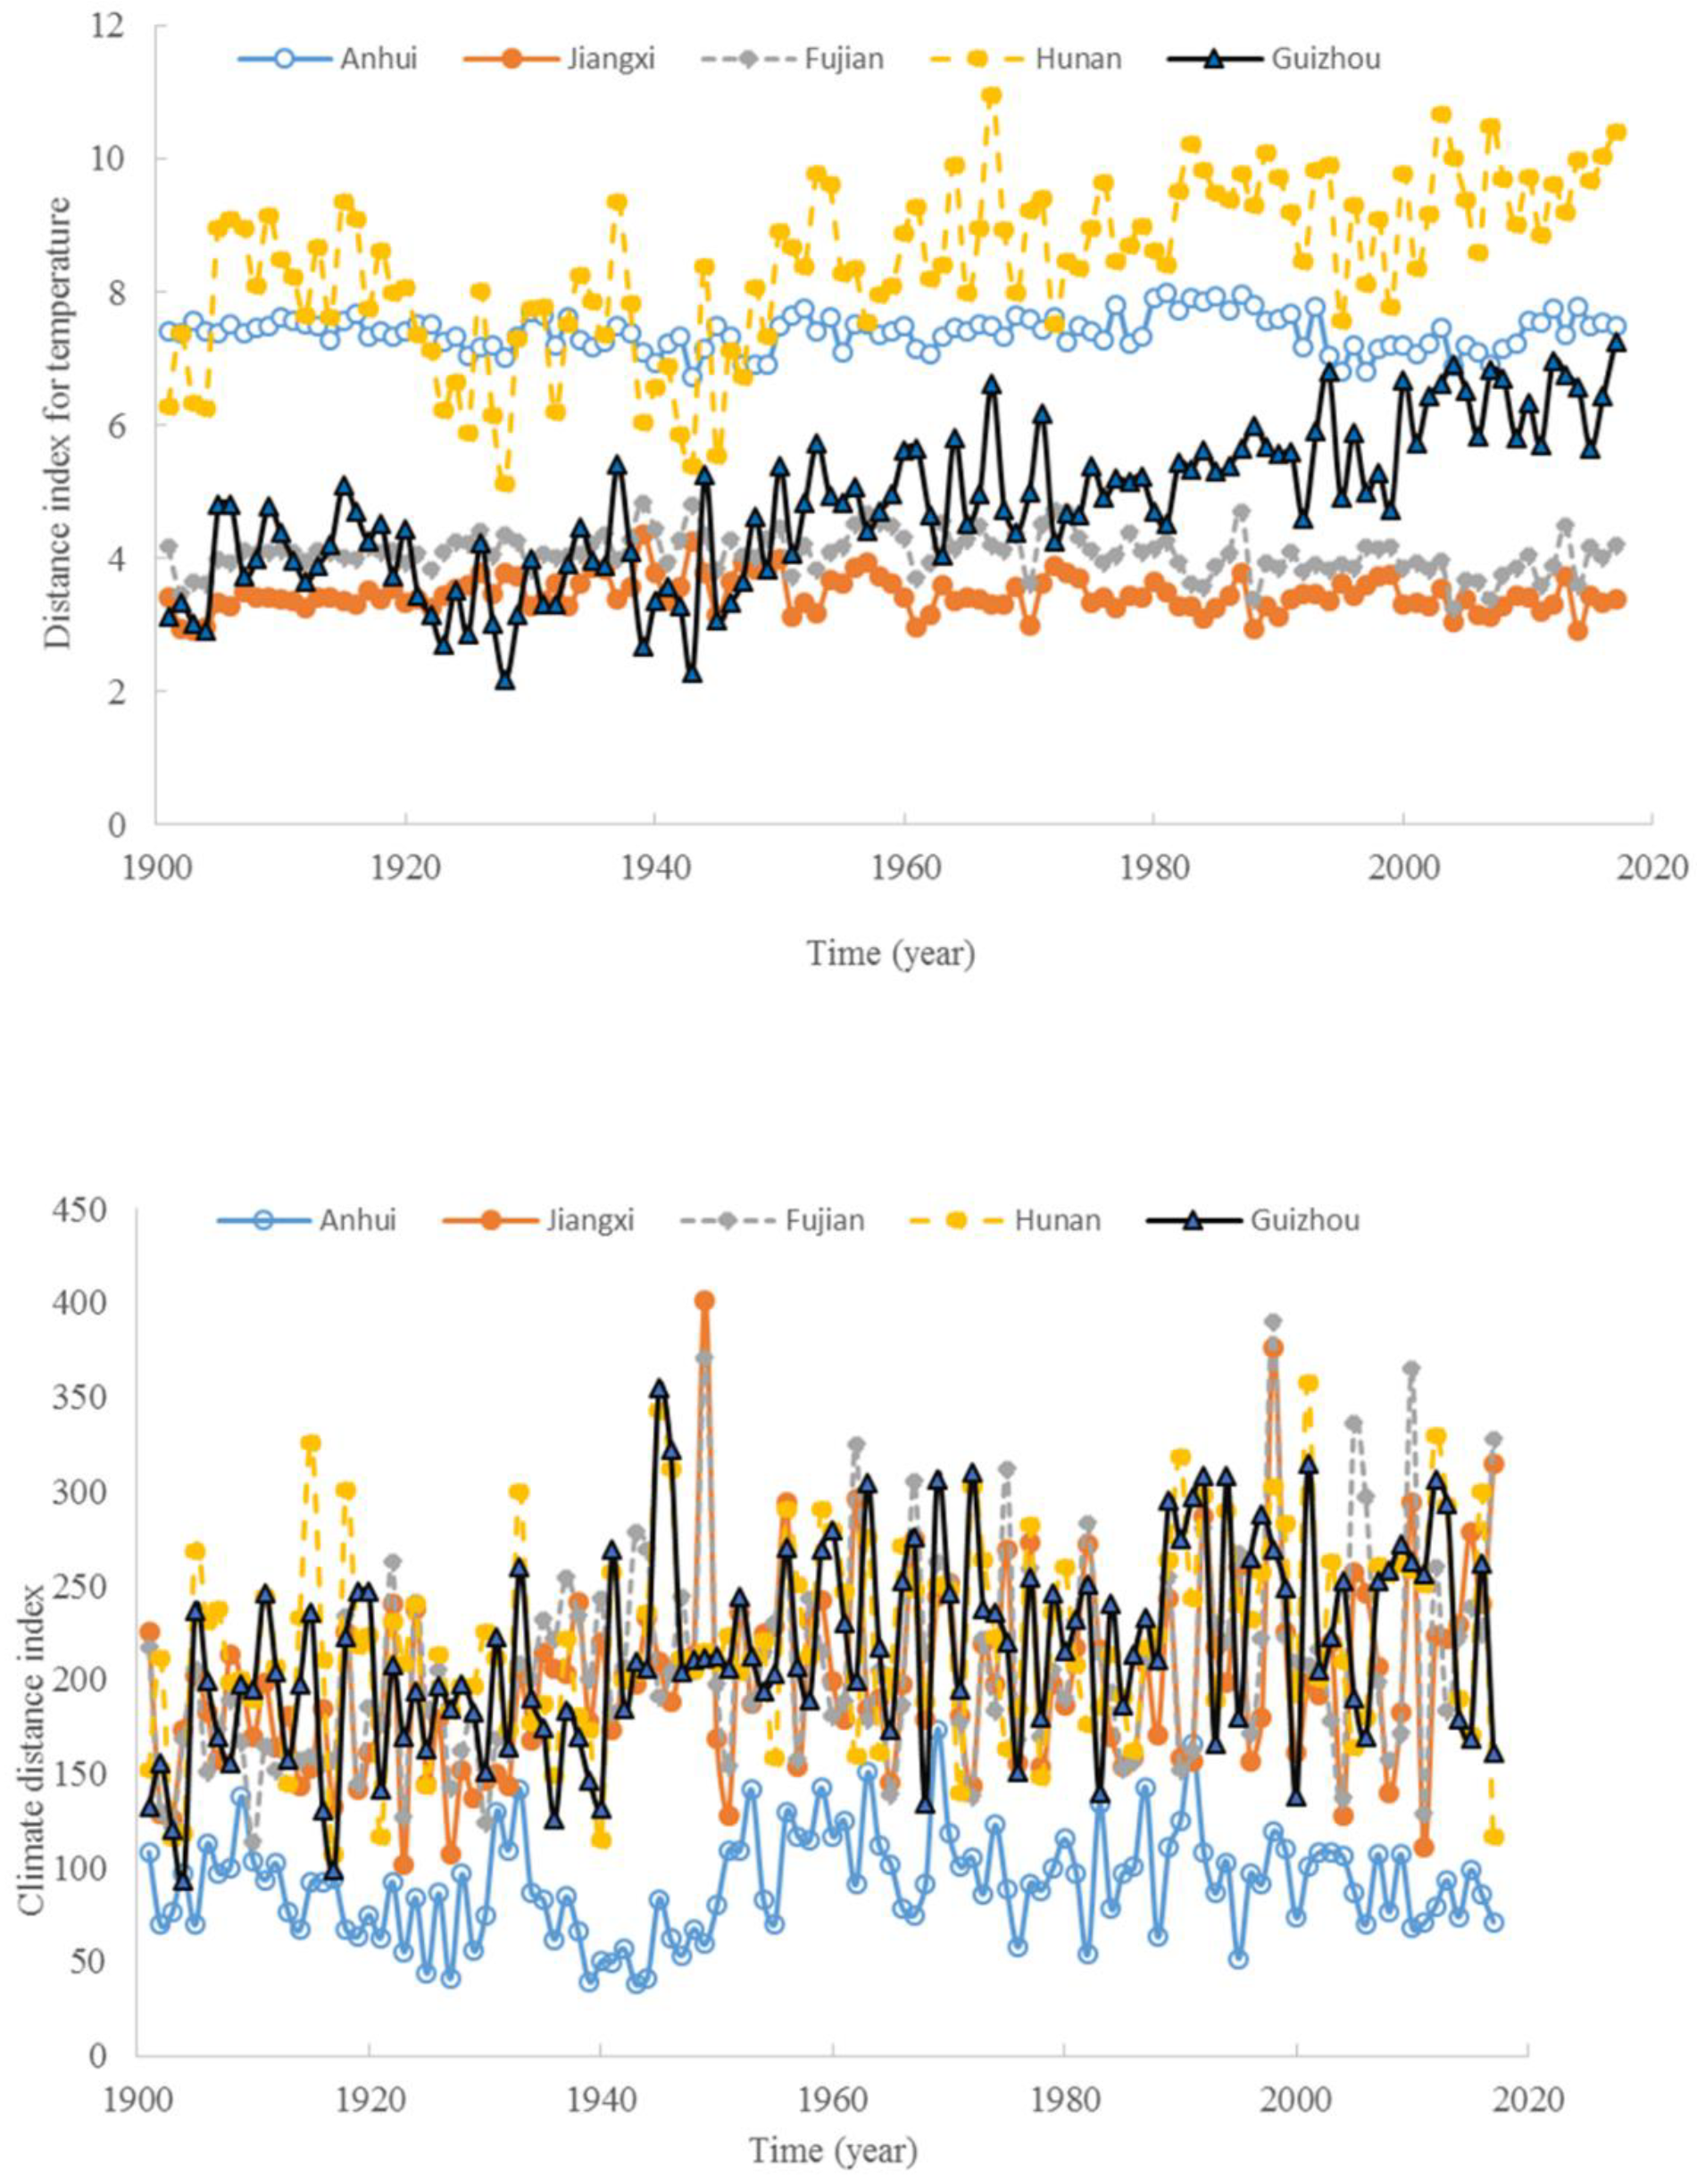
In comparison with the monthly air temperature at Zhuji, Jiangxi had a similar monthly air temperature with a distance index of 3.4 (Figure 8). Hunan had an entirely different monthly air temperature, with a distance index of 8.4. The monthly temperature for Zhuji correlated significantly with the other regions (Table 2), but the monthly precipitation did not correlate significantly with Hunan or Guizhou. For overall climate similarity, Anhui had a similar climate to Zhuji, and the climate distance index was 91 (Figure 8). Hunan had quite a different climate to Zhuji, and the climate distance index was 221. Jiangxi, Fujian, and Guizhou had close climate distance indices among themselves. The difference in climate between Zhuji and other regions was mainly caused by variations in precipitation because the difference in temperature was tiny.
4. Discussion
Air temperature increased across these Chinese Torreya plantation regions, but the annual precipitation did not show any noticeable trend. Overall, the annual air temperature (CV < 3%) was more stable than the annual precipitation (CV < 15%), and Guizhou had the highest stability among these regions. The magnitude of air temperature change varied by location. Zhuji, Anhui, and Jiangxi had a slightly higher increase in air temperature than Hunan and Guizhou. Consequently, Chinese Torreya plantations have already experienced climate change in the past century, such as the average increase of 2.3 °C documented here. The results of this study were broader than the previous [30], which found that the annual air temperature had increased 1.0–2.0 °C, while annual precipitation varied by 80–150 mm, during the past 50 years in Zhuji region. Our findings may partially explain why Chinese Torreya trees have been present in Zhuji and surrounding regions for more than a thousand years. The oldest Chinese Torreya trees in the region are around 1500 years [17].
It was indicated that the warmest period in the history of eastern China was around the 1230–1250s, which had a temperature of 0.9 °C higher than it was from 1950 to 1981 [31]. The coldest period was during the 1650–1670s, which was 1.1 °C lower than it was during the 1950–1980s. This suggests that Chinese Torreya trees that are growing today might be experiencing the highest temperatures in their recorded history. However, it is not known what further increases in air temperature due to climate change Chinese Torreya trees can tolerate. A previous study indicated that latitude 25–35° N might experience a decrease in air temperature based on the output of a global circulation model [25].
It appears that Chinese Torreya trees still grow well under current climate change conditions. The possible mechanism that allows for this may be the grafting processes because the scions of selected quality trees of Torreya grandis with edible nuts were grafted on to other Torreya trees with inedible nuts, which were then cultivated and propagated [18]. As long as other Torreya trees (the stock trees) can grow well, then, it should be possible to develop Chinese Torreya. Agroforestry may provide strategies for adaptation to changing local climates, through grafting, shading, and irrigation [32]. However, the adaptive plasticity of this species may not be able to maintain adaptive phenotypes under extreme environmental shifts [33]. Because of this, it is necessary to study the effects of climate change on the growth and production of Chinese Torreya trees, due to their social and economic benefits.
The annual air temperature required for the survival of Chinese Torreya plantations could be inferred as being within 12.96–18.23 °C, because trees in these plantations still grow well and produce seeds. The highest and the lowest average monthly air temperatures that occurred in these regions were 30.1 °C and −0.8 °C, respectively. Also, the extent of annual precipitation suitable for the survival of Chinese Torreya plantations was broad and varied from 874.56 mm and 2501.88 mm. The average monthly precipitation ranged from 82 mm to 269 mm. Furthermore, the trees could even tolerate growing without rain for at least a month as well as a drought occurrence of 70–80% during the 1920s. This is because big trees can reach deep groundwater through their root systems, but seedlings and saplings cannot.
The ranges in air temperature and precipitation that were observed during this study were much broader than the values reported in previous studies [17,34], such as the annual air temperature of 15 °C and the annual precipitation of 1500 mm. This is because detailed climate data covering these main regions of Chinese Torreya plantations over a timeframe of more than a hundred years were included in this study. It also confirms that the current understanding of the adaptive response of species to climate change may be insufficient [35]. Our results may provide additional information regarding the air temperature, precipitation, and drought that Chinese Torreya plantations have experienced. The adaptability of the species to climate change will influence the future distribution of tree species under climate change conditions [36]. Simply expanding the climate envelope model of Chinese Torreya trees to account for new climate change scenarios may not provide an accurate understanding of the real potential distribution of the species. This point is essential for the introduction of Chinese Torreya plantations into other provinces, where Chinese Torreya trees have not previously grown.
By using the climate distance index, the climate in different regions with Chinese Torreya plantations can be compared with Zhuji, which is considered to be the central production area. It has also been shown that the distance index for temperature in the regions with Chinese Torreya plantations is very similar, which means the air temperatures in these regions were very similar. The presence of suitable air temperature is vital for plants to conduct photosynthesis and for survival. However, the precipitation in some regions was quite different from Zhuji, and the precipitation was the major contributor to the observed deviation in the climate distance index. Insufficient precipitation would lead to drought, which would affect the seedlings and saplings of Chinese Torreya. This result suggests that precipitation is not as significant as air temperature for Chinese Torreya plantations in these regions. The monthly precipitation varied among the regions (e.g., Zhuji and Hunan), and did not impact the growth of Chinese Torreya. This result can be partially explained by the fact that Chinese Torreya trees usually grow in steeply sloping areas (e.g., with a slope of 65°), even though surface water drains away rapidly in these areas due to gravity. They can grow in such an area because Chinese Torreya trees are drought tolerant [17]. Some prominent Chinese Torreya trees even grow between rocks, because their roots can absorb water from the groundwater. However, based on field observations, it is known that drought could dry up young Chinese Torreya trees. In addition, Chinese Torreya trees cannot grow in areas that experience frequent flooding or soil water accumulation [17].
A critical factor for the growth of Chinese Torreya trees is soil aeration; the space between soil particles can affect the respiration of the plant roots [37]. Stones and rocks in the soil can significantly increase soil aeration. Human management practices or agroforestry technology may also help the growth of Chinese Torreya trees. These factors all enable Chinese Torreya trees to grow in regions with different monthly levels of precipitation. Species distributions may mainly be affected by climate dynamics, which can be indicated by the past climate changes and by similar climates in the existing regions [38,39]. However, non-climatic factors should also be considered when assessing potential habitats. The climate distance index may be helpful in identifying potential new regions for Chinese Torreya plantations.
5. Conclusions
It is useful to compare climate dynamics across the growing regions with Chinese Torreya plantations. This tree species has already experienced about 2.3 °C warming over the past century across its range in southeastern China. The climate thresholds for the tree identified by this study are much broader than the past findings, which were based only on the geographic distribution. Estimation of the climate niches of species needs to include climate dynamics across the distribution range. It is possible that Chinese Torreya has a very high level of adaptability to climate change.
The climate distance index could show the similarities between the climates of new regions and the central production region. The air temperatures of the different regions were very similar, but the precipitation varied. It seems likely that the distribution of Chinese Torreya trees is primarily determined by the air temperature.
This study may provide a new approach for uncovering the adaptations to climate change and potential regions for growing Chinese Torreya trees. Further research on the adaptive responses of Chinese Torreya trees (e.g., trait change) to climate change would be beneficial.
Author Contributions
Conceptualization, X.C.; Formal analysis, X.C. and J.N.; Funding acquisition, X.C.; Investigation, X.C.; Validation, J.N. All authors have read and agreed to the published version of the manuscript.
Funding
This study was partially supported by the USDA Mc-Stennis project (1008643) and Shaoxing 330.
Conflicts of Interest
The authors declare that the research was conducted in the absence of any commercial or financial relationships that could be construed as a potential conflict of interest.
References
- Grinnell, J. Field tests of theories concerning distributional control. Am. Nat. 1917, 51, 115–128. [Google Scholar] [CrossRef]
- MacArthur, R.H. Geographical Ecology; Harper and Row: New York, NY, USA, 1972. [Google Scholar]
- Araujo, M.B.; Pearson, R.G. Equilibrium of species’ distributions with climate. Ecography 2005, 28, 693–696. [Google Scholar] [CrossRef]
- Pearson, R.G.; Dawson, T.P. Predicting the impacts of climate change on the distribution of species: Are bioclimate envelope models useful? Glob. Ecol. Biogeogr. 2003, 12, 361–371. [Google Scholar] [CrossRef] [Green Version]
- Pierson, J.C.; Beissinger, S.R.; Bragg, J.G.; Coates, D.J.; Oostermeijer, J.G.B.; Sunnucks, P.; Schumaker, N.H.; Trotter, M.V.; Young, A.G. Incorporating evolutionary processes into population viability models. Conserv. Biol. 2015, 29, 755–764. [Google Scholar] [CrossRef] [PubMed]
- Rehfeldt, G.E.; Tchebakova, N.M.; Parfenova, Y.I.; Wykoff, W.R.; Kuzmina, N.A.; Milyutin, L.I. Intraspecific responses to climate in Pinus sylvestris. Glob. Chang. Biol. 2002, 8, 912–929. [Google Scholar] [CrossRef] [Green Version]
- Urban, M.C.; Bocedi, G.; Hendry, A.P.; Mihoub, J.-B.; Peer, G.; Singer, A.; Bridle, J.R.; Grozier, L.G.; De Meester, L.; Godsoe, W.; et al. Improving the forecast for biodiversity under climate change. Science 2016, 353, 1113–1122. [Google Scholar] [CrossRef] [PubMed] [Green Version]
- Aitken, S.N.; Yeaman, S.; Holliday, J.A.; Wang, T.; Curtis-McLane, S. Adaptation, migration or extirpation: Climate change outcomes for tree populations. Evol. Appl. 2008, 1, 95–111. [Google Scholar] [CrossRef]
- Morecroft, M.D.; Duffield, S.; Harley, M.; Pearce-Higgins, J.W.; Stevens, N.; Watts, O.; Whitaker, J. Measuring the success of climate change adaptation and mitigation in terrestrial ecosystems. Science 2019, 366. [Google Scholar] [CrossRef] [Green Version]
- Harsch, M.A.; Hulme, P.E.; McGlone, M.S.; Duncan, R.P. Are treelines advancing? A global meta-analysis of treeline response to climate warming. Ecol. Lett. 2009, 12, 1040–1049. [Google Scholar] [CrossRef]
- Parmesan, C. Ecological and evolutionary responses to recent climate change. Ann. Rev. Ecol. Evol. Syst. 2006, 37, 637–669. [Google Scholar] [CrossRef] [Green Version]
- Masek, J.G. Stability of boreal forest stands during recent climate change: Evidence from Landsat satellite imagery. J. Biogeogr. 2001, 28, 967–976. [Google Scholar] [CrossRef]
- IPCC. Third Assessment Report of the Intergovernmental Panel on Climate Change IPCC (WG I & II); Cambridge University Press: Cambridge, UK, 2001. [Google Scholar]
- Schindler, D.E.; Hilborn, R. Prediction, precaution, and policy under global change. Science 2015, 347, 953–954. [Google Scholar] [CrossRef] [PubMed] [Green Version]
- Pacifici, M.; Visconti, P.; Butchart, S.H.M.; Watson, J.E.M.; Cassola, F.M.; Rondinini, C. Species’ traits influenced their response to recent climate change. Nat. Clim. Chang. 2017, 7, 205–208. [Google Scholar] [CrossRef] [Green Version]
- Sakschewski, B.; von Bloh, W.; Boit, A.; Poorter, L.; Pena-Claros, M.; Heinke, J.; Joshi, J.; Thonicke, K. Resilience of Amazon forests emerges from plant trait diversity. Nat. Clim. Chang. 2016, 6, 1032–1036. [Google Scholar] [CrossRef]
- Li, Z.-J.; Dai, W.-S. Chinese Torreya; Science Press: Beijing, China, 2007. (In Chinese) [Google Scholar]
- Chen, X.; Jin, H. Review of cultivation and development of Chinese torreya in China. For. Trees Liveli. 2019, 28, 68–78. [Google Scholar] [CrossRef]
- Chen, X.; Chen, H. Dynamics in production of four heritage foods at the mountainous region of Shaoxing City, China. Emir. J. Food Agric. 2019, 31, 645–653. [Google Scholar] [CrossRef] [Green Version]
- Chen, X.; Jin, H. A case study of enhancing sustainable intensification of Chinese Torreya forest in Zhuji of China. Environ. Nat. Res. Res. 2019, 9, 53–60. [Google Scholar] [CrossRef] [Green Version]
- Cheng, X.-J.; Li, Z.-J.; Yu, W.-W.; Dai, W.-S.; Fu, Q.-G. Distribution and ecological characteristics of Torreya grandis in China. J. Zhejiang For. Coll. 2007, 24, 383–388. [Google Scholar]
- Wu, S.T. Chinese Torreya Legends; Xiling Seal Engraver’s Society’s Publishing House: Hangzhou, China, 2013. (In Chinese) [Google Scholar]
- Huang, Y.; Wang, J.; Li, G.; Zheng, Z.; Su, W. Antitumor and antifungal activities in endophytic fungi isolated from pharmaceutical plants Taxus mairei, Cephalataxus fortunei and Torreya grandis. FEMS Immunol. Med. Microbiol. 2001, 31, 163–167. [Google Scholar] [CrossRef] [Green Version]
- People’s Government of Shaoxing City. Kuanjishan Ancient Chinese Torreya Community; Proposal for Global Important Agricultural Heritage System Initiative: Shaoxing, China, 2013.
- Chen, X.; Zhang, X.; Li, B.-L. The possible response of life zones in China under climate change. Glob. Plane. Chang. 2003, 38, 327–337. [Google Scholar] [CrossRef]
- Petit, R.J.; Hampe, A. Some evolutionary consequences of being a tree. Ann. Rev. Ecol. Evol. Syst. 2006, 37, 187–214. [Google Scholar] [CrossRef] [Green Version]
- Lin, J.; Zhang, R.; Hu, Y.; Song, Y.; Hanninen, H.; Wu, J. Interactive effects of drought and shading on Torreya grandis seedlings: Physiological and growth responses. Trees 2019, 33, 951–961. [Google Scholar] [CrossRef]
- Harris, I.; Jones, P.D.; Osborn, T.J.; Lister, D.H. Updated high-resolution grids of monthly climatic observations – the CRU TS3.10 Dataset. Int. J. Climatol. 2014, 34, 623–642. [Google Scholar] [CrossRef] [Green Version]
- McKee, T.B.; Doesken, N.J.; Kliest, J. The relationship of drought frequency and duration to time scales. In Proceedings of the 8th Conference of Applied Climatology, Anaheim, CA, USA, 17–22 January 1993; American Meteorological Society: Boston, MA, USA; pp. 179–184. [Google Scholar]
- Kong, X.; Chen, H. Climate Change at Shaoxing in the Past 2500 Years; Zhejiang University Press: Hangzhou, China, 2012. (In Chinese) [Google Scholar]
- Ge, Q.; Zheng, J.; Man, Z. Winter temperature in eastern China in the past 2000 years. Quat. Sci. 2002, 22, 165–173. [Google Scholar]
- Apuri, I.; Peprah, K.; Achana, G.T.W. Climate change adaptation through agroforestry: The case of Kassena Nankana West District, Ghana. Environ. Dev. 2018, 28, 32–41. [Google Scholar] [CrossRef]
- Chevin, L.M.; Lande, R.; Mace, G.M. Adaptation, plasticity, and extinction in a changing environment: Towards a predictive theory. PLoS Biol. 2010, 8, e100357. [Google Scholar] [CrossRef] [Green Version]
- Lou, W.; Sun, K. Climate Resource, Distribution and Application for fine Agriculture at Shaoxing City; China Meteorological Press: Beijing, China, 2015. (In Chinese) [Google Scholar]
- Radchuk, V.; Reed, T.; Teplitsky, C.; van de Pol, M.; Charmantier, A.; Hassall, C.; Adamík, P.; Adriaensen, F.; Ahola, M.P.; Arcese, P.; et al. Adaptive responses of animals to climate change are most likely insufficient. Nat. Commun. 2019, 10, 3109. [Google Scholar] [CrossRef] [Green Version]
- Garzón, M.B.; Alía, R.; Robson, T.M.; Zavala, M.A. Intra-specific variability and plasticity influence potential tree species distributions under climate change. Glob. Ecol. Biogeogr. 2011, 20, 766–778. [Google Scholar] [CrossRef] [Green Version]
- Si, H. Understanding Chinese Torreya by Pictures; Zhejiang University Press: Hangzhou, China, 2018. (In Chinese) [Google Scholar]
- Rabasa, S.G.; Granda, E.; Benavides, R.; Kunstler, G.; Espelta, J.M.; Ogaya, R.; Peñuelas, J.; Scherer-Lorenzen, M.; Gil, W.; Grodzki, W.; et al. Disparity in elevational shifts of European trees in response to recent climate warming. Glob. Chang. Biol. 2013, 19, 2490–2499. [Google Scholar] [CrossRef]
- Schwörer, C.; Henne, P.D.; Tinner, W. A model-data comparison of Holocene timberline changes in the Swiss Alps reveals past and future drivers of mountain forest dynamics. Glob. Chang. Biol. 2014, 20, 1512–1526. [Google Scholar] [CrossRef]
Figure 1.
The distribution area of Chinese Torreya plantations in the provinces of China.

Figure 2.
The general trend of annual air temperature in the six regions with Chinese Torreya plantations.
Figure 2.
The general trend of annual air temperature in the six regions with Chinese Torreya plantations.

Figure 3.
The change of annual precipitation in the six regions with Chinese Torreya plantations.

Figure 4.
The stability of annual air temperature and precipitation in the six regions. (T: annual air temperature, P: annual precipitation).
Figure 4.
The stability of annual air temperature and precipitation in the six regions. (T: annual air temperature, P: annual precipitation).

Figure 5.
The lowest and highest values of annual air temperature varied at the six regions of Chinese Torreya plantations (a), the maximum (Max) and minimum (Min) values of monthly air temperature (b), and average monthly air temperature in the growing season (c).
Figure 5.
The lowest and highest values of annual air temperature varied at the six regions of Chinese Torreya plantations (a), the maximum (Max) and minimum (Min) values of monthly air temperature (b), and average monthly air temperature in the growing season (c).

Figure 6.
The lowest and highest values of annual precipitation varied at the six regions with Chinese Torreya plantations (a), the maximum (Max) and minimum (Min) values of monthly precipitation (b), and average monthly precipitation in the growing season (c).
Figure 6.
The lowest and highest values of annual precipitation varied at the six regions with Chinese Torreya plantations (a), the maximum (Max) and minimum (Min) values of monthly precipitation (b), and average monthly precipitation in the growing season (c).

Figure 7.
The drought probability in a decade scale among the six regions with Chinese Torreya plantations. (1910 means 1910s).
Figure 7.
The drought probability in a decade scale among the six regions with Chinese Torreya plantations. (1910 means 1910s).

Figure 8.
The distance index for air temperature between Zhuji and other regions and climate distance between Zhuji and other regions.
Figure 8.
The distance index for air temperature between Zhuji and other regions and climate distance between Zhuji and other regions.


Table 1.
The six regions with Chinese Torreya plantations in this study.
| Location and Province | Latitude Longitude |
|---|---|
| Shexuan, Anhui | 29°52′ N 118°56′ E |
| Qianshan, Jiangxi | 28°22′ N 117°44′ E |
| Wuyishan, Fujian | 27°52′ N 118°02′ E |
| Rongshan, Hunan | 29°30′ N 109°30′ E |
| Songtao, Guizhou | 28°10′ N 109°08′ E |
| Zhuji, Zhejiang | 29°41′ N 120°19′ E |
Table 2.
Correlation coefficients (R2) between Zhuji and other regions in the monthly air temperature and precipitation from 1901 to 2017.
Table 2.
Correlation coefficients (R2) between Zhuji and other regions in the monthly air temperature and precipitation from 1901 to 2017.
| Anhui | Jiangxi | Fujian | Hunan | Guizhou | |
|---|---|---|---|---|---|
| Monthly air temperature | 0.9988 * | 0.9978 * | 0.9964 * | 0.9906 * | 0.9910 * |
| Monthly precipitation | 0.8823 * | 0.6994 * | 0.6884 * | 0.3836 | 0.3824 |
* correlation is significant at p < 0.05.
© 2020 by the authors. Licensee MDPI, Basel, Switzerland. This article is an open access article distributed under the terms and conditions of the Creative Commons Attribution (CC BY) license (http://creativecommons.org/licenses/by/4.0/).
Share and Cite
MDPI and ACS Style
Chen, X.; Niu, J. Evaluating the Adaptation of Chinese Torreya Plantations to Climate Change. Atmosphere 2020, 11, 176. https://doi.org/10.3390/atmos11020176
AMA Style
Chen X, Niu J. Evaluating the Adaptation of Chinese Torreya Plantations to Climate Change. Atmosphere. 2020; 11(2):176. https://doi.org/10.3390/atmos11020176
Chicago/Turabian StyleChen, Xiongwen, and Jianzhi Niu. 2020. "Evaluating the Adaptation of Chinese Torreya Plantations to Climate Change" Atmosphere 11, no. 2: 176. https://doi.org/10.3390/atmos11020176
Note that from the first issue of 2016, this journal uses article numbers instead of page numbers. See further details here.