Article

Influence of Sudden Stratospheric Warmings on the Migrating Diurnal Tide in the Equatorial Middle Atmosphere Observed by Aura/Microwave Limb Sounder

1
Institute of Applied Physics, University of Bern, 3012 Bern, Switzerland
2
Oeschger Centre for Climate Change Research, University of Bern, 3012 Bern, Switzerland
Atmosphere 2023, 14(12), 1743; https://doi.org/10.3390/atmos14121743
Submission received: 1 November 2023 / Revised: 22 November 2023 / Accepted: 25 November 2023 / Published: 27 November 2023
(This article belongs to the Special Issue Observations and Analysis of Upper Atmosphere)

Abstract

:
The Microwave Limb Sounder (MLS) onboard the satellite Aura measures the temperature at 01:44 LST (after midnight) and at 13:44 LST after noon in the equatorial middle atmosphere. The signatures of the migrating solar diurnal tide (DW1) show up in the difference between the night-time and the daytime temperature profiles. We find a good agreement between the equatorial DW1 proxy of the Aura/MLS observations and the migrating diurnal tide estimated by the Global Scale Wave Model (GSWM) in March. The equatorial DW1 proxy is shown for the time interval from 2004 to 2021 reaching a temporal resolution of 1 day. The amplitude modulations of the DW1 proxy are correlated at several altitudes. There are indications of a semi-annual and annual oscillation (SAO and AO) of the DW1 proxy. The composite of 17 events of major sudden stratospheric warmings (SSWs) shows that the equatorial, mesospheric DW1 proxy is reduced by about 10% during the first week after the SSW event. The nodes and bellies of the equatorial DW1 proxy are shifted downward by about 1–2 km in the first week after the SSW. The 14 day-oscillation of the DW1 proxy in the equatorial mesosphere is enhanced from 25 days before the SSW onset to 5 days after the SSW onset.

1. Introduction

Solar tides are global-scale atmospheric oscillations in temperature, wind, density and pressure at periods which are 24 h/n with n = 1, 2, 3, … The solar tides are excited by the diurnal variation in insolation absorption by ozone and water vapour in the lower and middle atmosphere [1]. Solar tides are important for the transport of energy and momentum from the lower to the middle and upper atmosphere. While the amplitude of the diurnal temperature tide is about 1 Kelvin or less in the stratosphere, the tidal amplitude can easily reach 10 Kelvin in the mesosphere [2,3,4]. The classical tidal theory linearises the primitive equations yielding Laplace’s tidal equations. Then, the tidal theory derives for a given zonal wavenumber and frequency a series of tidal modes [5]. More detailed computations consider tropospheric latent heat release as an additional excitation source for migrating and non-migrating diurnal tides [6,7].
The present study focuses on the migrating diurnal tide in the equatorial middle atmosphere. In the following, we use the common abbreviation of the diurnal westward propagating tide with zonal wavenumber 1 and a period of 24 h which is DW1. The coarse sampling of the satellite Aura in local solar time (LST) only allows for the study of DW1. The potential of slowly precessing satellites for the study of tides was described by [8]. Aura is in a sun-synchronous orbit and crosses the equator at 01:45 LST and 13:45 LST [9]. Depending on the altitude, the Microwave Limb Sounder (MLS) on Aura may observe a temperature maximum just after noon and a temperature minimum just after midnight in the equatorial atmosphere, for example. DW1 has a vertical wavelength of about 25 km in the equatorial stratosphere and mesosphere [4]. At low latitudes, DW1 is the dominant tidal mode [10,11]. The migrating semidiurnal tide (SW2) disappears if the difference in daytime and night-time values at the equator are taken. If SW2 has a temperature maximum at 01:45 LST, then the SW2 maximum also occurs 12 h later at 13:45 LST, so that the SW2 contribution is cancelled by taking the difference between the temperatures at 01:45 LST and 13:45 LST. The same is valid for other phases of SW2.
The non-migrating tidal waves are smoothed out in a whole day average since Aura/MLS samples the equatorial longitudes with a resolution of about 24 degrees. However, it could be that the migrating terdiurnal tide may have an influence so that the present study deals with a proxy of DW1. Nevertheless, the long-term observations of Aura/MLS since 2004 are of high interest, and the tidal proxy has a time resolution of 1 day. A recent study by [12] compared results of DW1 from Aura/MLS with results from the satellite experiment TIMED/SABER (Sounding of the Atmosphere using Broadband Emission Radiometry (SABER) instrument on the Thermosphere, Ionosphere, Mesosphere Energetics and Dynamics (TIMED) satellite) and found a similar vertical structure and seasonal behaviour of DW1. The seasonal behaviour is dominated by a semi-annual oscillation (SAO) of the DW1 amplitude with a maximum at the March equinox [4,12,13]. For a summary of past works about DW1, the reader is referred to [4,12].
The present study takes advantage of the high temporal resolution of the DW1 proxy provided by Aura/MLS. The time series of DW1 are utilised to analyse the response of DW1 at the equator to major stratospheric warmings (SSWs) in the polar stratosphere. Planetary wave breaking causes a severe disturbance, splitting or breaking of the stratospheric polar vortex down. A major SSW is associated with the breaking of Rossby waves, leading to a rapid increase in the polar stratospheric temperature and a reversal of the vortex from eastward to westward flow for at least 5 days [14,15,16,17]. It has been observed and simulated that SSWs affect the whole atmosphere and ionosphere of the Earth [18]. It is well established that variations in polar stratospheric winds can affect mesospheric temperatures through changes in the filtering of gravity wave fluxes, which drive a residual circulation in the mesosphere. This vertical coupling between the stratosphere and the mesosphere was simulated and discussed by [19,20] for the Southern Hemisphere and the Antarctic ozone hole with its strong stratospheric polar vortex. SSWs are often associated with mesospheric cooling since the breakdown of the stratospheric polar vortex leads to an enhanced gravity wave flux from below into the mesosphere with associated upwelling and adiabatic cooling of the mesosphere. In the weeks after the SSW onset, an elevated stratopause appears in the polar mesosphere. The elevated stratopause slowly descends downward during several weeks to about 50 km in altitude [21].
A recent study showed that the equatorial DW1 amplitude at a 90 km altitude decreases after SSWs [22]. The authors showed that the SSWs induce a change in the latitudinal shear of zonal winds in the mesosphere and lower thermosphere. The mesospheric polar vortex extends from 90 to 30 N in latitude. The variability in the mesospheric polar vortex is still a challenge for atmospheric models due to a lack of observations of the complex mesospheric wind field with its many wave–mean flow interactions [23]. The planetary waves and the SSW are changing the mesospheric polar vortex, which causes a change in the tropical wave guide of DW1. This change in the propagation conditions of DW1 explains the tidal variability in DW1 after SSWs and the modulation of DW1 by upwardly propagating planetary waves. Different to [22], an enhancement in DW1 was observed by meteor radars at low latitudes after the SSW of 2006 [24].
The stratospheric and mesospheric polar vortex can be studied by the measurement of dynamical parameters or by measurements of the atmospheric composition. The gases CO and H 2 O are either enhanced or decreased inside the vortex so that the shape, position and the variability of the mesospheric polar vortex can be analysed by the composition measurements of Aura/MLS or other instruments [25]. A strong 16 day-oscillation in mesospheric water vapour occurred before the SSW of January 2012 [26]. This oscillation in the mesosphere is possibly due to an upward-propagating Rossby wave from the lower atmosphere. The Rossby wave also propagates westward along the polar vortex edge, where the meridional gradient of potential vorticity is maximal and baroclinic instabilities occur [27].
The interaction of DW1 with the mesospheric polar vortex is also important for understanding the semi-annual oscillation of DW1. However, at the equator, the Sun is, twice per year, in the zenith at the equinoxes. Thus, the semi-annual variation in the solar radiation also has to be taken into account to explain the SAO of DW1 at the equator [4,28]. Inter-annual variability in the equatorial DW1 can be induced by inter-annual changes in the tropical troposphere. During the El Niño of 2015/2016 the equatorial DW1 amplitude at 90 km altitude was enhanced [29]. A significant modulation of DW1 by the quasi-biennial oscillation (QBO) was reported by [13].
In contrast to past tidal wave studies, the present study does not fit vertical profiles of DW1 amplitude and phase to the Aura/MLS observations. The advantage may be that the data reduction is easier. I assume that the full vertical resolution and time resolution of the observations are conserved by the simple analysis method and less measurement information may be lost compared to more sophisticated tidal wave analysis methods (e.g., determination of the Hough modes). For example, the vertical movement of the DW1 nodes and bellies can be recognised in time series of the DW1 proxy which I use instead of DW1 amplitude and phase profiles. In so doing, the present study is rather complementary to the past DW1 studies. The amplitudes and the vertical wavelengths of DW1 can be easily recognised in the plots of the DW1 proxy. In contrast to the few past studies on SSWs and their influence on DW1, the present study considers all major SSW events in a composite analysis. This method is more objective than a selection of a few SSW events. The composite reveals the mean SSW pattern in the equatorial DW1 proxy. Most tidal wave studies are either limited to the stratosphere or to the mesosphere. The present study shows the results for the stratosphere and mesosphere, and correlations are discussed which sometimes indicate a coincident temporal modulation of the DW1 amplitude in the equatorial stratosphere and mesosphere.
The dataset of Aura/MLS and the data analysis are described in Section 2. The results of the equatorial DW1 and its relation to SSWs are given in Section 3. The discussion is in Section 4.

2. Dataset and Data Analysis

The temperature and geo-potential height profiles from the Microwave Limb Sounder (MLS) on the NASA satellite Aura were used. The satellite was launched in 2004 [9]. Aura has a Sun-synchronous orbit with two equator overpasses at 01:45 local solar time (LST) and 13:45 LST in 2004. The equator crossing times marginally changed since 2004 and, in the mean over 17 years of observation, the equator crossing times are now 01:44 and 13:44 LST. Level 2 data of the retrieval version 5 are utilised in the present study, and the data screening described by [30] was applied. The vertical range of the profiles, used here, is from about 15 to 95 km. The accuracy of the temperature profiles is about 1 K in the stratosphere and about 3 K in the mesosphere [31]. The temperature values beyond 90 km altitude are less reliable, since the influence of the a priori the retrieval is enhanced due to increased measurement uncertainty at upper altitudes [30,31]. The a priori profile of mesospheric temperature originates from the COSPAR International Reference Atmosphere CIRA-86, and it has no dependence on LST [31]. Thus, the retrieved diurnal variation in temperature is possibly underestimated at 90 km altitude and beyond. However, [12] already showed that Aura/MLS provided valuable results about DW1 in the upper mesosphere.
For each day of observation, the zonal mean temperature profiles are computed at the equator (from 2 South to 2 North). Aura/MLS samples the equatorial longitudes with a resolution of about 24 degrees (distance between two ascending (or descending) orbits at the equator). For each equator crossing, one receives three profiles within the selected latitude range, separated by 1.48 in latitude. There are two zonal mean profiles, one at 01:45 LST and the other at 13:45 LST. The profiles are on pressure levels and, by means of the coincident geo-potential height profiles, one can obtain the mean temperature profiles as functions of altitude z.
Figure 1 shows an example for the two zonal mean profiles T ( z ) at 01:45 LST and 13:45 LST observed on 31 March 2014. The characteristics of DW1, such as exponential increase in the amplitude and vertical wavelength of 20–30 km, are already present in the averaged profiles.
Figure 1b shows the nodes and bellies of DW1 in the equatorial atmosphere. The present study mainly discusses the evolution and vertical structure of the nodes and bellies of DW1. However, one has to keep in mind that the nodes and bellies will be marginally shifted in altitude if DW1 is examined in the 00:00 LST to 12:00 LST plane.
It is useful to define the equatorial DW1 proxy Δ T as
Δ T ( z ) = 0.5 ( T 01 : 45 LST ( z ) T 13 : 45 LST ( z ) )
where z is the altitude and the T profiles are zonal means at the equator at the given LST value. The equator crossing time of Aura varies by about 30 seconds in the time interval 2004–2021, so the equator crossing time can also sometimes be 01:44 LST and 13:44 LST instead of 01:45 LST and 13:45 LST.
We also compare the DW1 proxy Δ T ( z ) to the results of the Global Scale Wave Model [7]. GSWM provides the amplitudes and phases of DW1 as function of altitude and latitude [32]. The GSWM model is a two-dimensional, linearised, steady-state numerical tidal model. Briefly, GSWM solves the extended Navier–Stokes equations for a specified wavenumber (s) and period using a finite difference algorithm. The GSWM background atmosphere is specified by a series of empirical models. More details are given in [33]. The GSWM model output has been often utilised for intercomparisons to ground-based and space-borne observations of solar tides [34,35,36].
The composite analysis of the present study is restricted to major SSWs of the northern hemisphere. The central date of a major SSW is defined as when the eastward wind changes to westward wind at 10 hPa, northward of 60 N [16]. The central date gives the onset time of the major SSW which can be used as the timing mark for the composite analysis of major SSWs. A description of the composite analysis method is given by [37]. Recently, another definition of the central date was introduced by Palmeiro et al. [38]. Their study determined the central dates of major SSWs by using the zonal wind data of the fifth-generation ECMWF atmospheric reanalysis (ERA5, [39]). In difference to other studies, e.g., [40], the central dates of SSWs were detected when the zonal mean zonal wind at 10 hPa became easterly at any latitude within the range of 55–70 N (U5570). Using Table 1 of [38], I obtain 17 central dates of major SSWs in the time from August 2004 to December 2021 (selected Aura/MLS data series) fulfilling the U5570 criterium. Palmeiro et al. [38] also provided a list of central dates fulfilling the traditional criterium of a zonal mean zonal wind reversal at 60 N (U60). The results of the present study remain similar for SSW composite analyses based on U5570 or U60. However, in the following, I only show the results for the 17 central SSW dates of the U5570 criterium.
For investigation of planetary wave-like modulations of the DW1 proxy series, the series Δ T ( t ) are filtered with a digital non-recursive, finite impulse response bandpass filter. Zero-phase filtering is ensured by processing the time series in forward and reverse directions. A Hamming window was selected for the filter. The number of filter coefficients corresponds to a time window of three times the central period, so that the bandpass filter has a fast response time to temporal changes in the data series. The variable choice of the filter order permits the analysis of wave trains with a resolution that matches their scale. The bandpass cut-off frequencies are at f c = f p ± 10 % f p , where f c is the cut off frequency and f p is the central frequency. Further details about the bandpass filtering are provided by [41].
The correlation coefficients of the modulations of the DW1 proxy series at different altitudes are well-determined due to the long time interval of about 17 years. I only consider statistically significant correlations with p-values less than 0.05.
The mean seasonal behaviour of the time series Δ T c l i m a t o l o g y ( D O Y ) is obtained by sorting the data for the day of the year (DOY) and taking the mean for all values at DOY in the 17 years of observation. Deseasonalisation of the DW1 proxy is performed by
D T ( t ) = Δ T ( t ) Δ T c l i m a t o l o g y ( D O Y ( t ) ) .

3. Results

3.1. Characteristics of the Equatorial DW1 Proxy

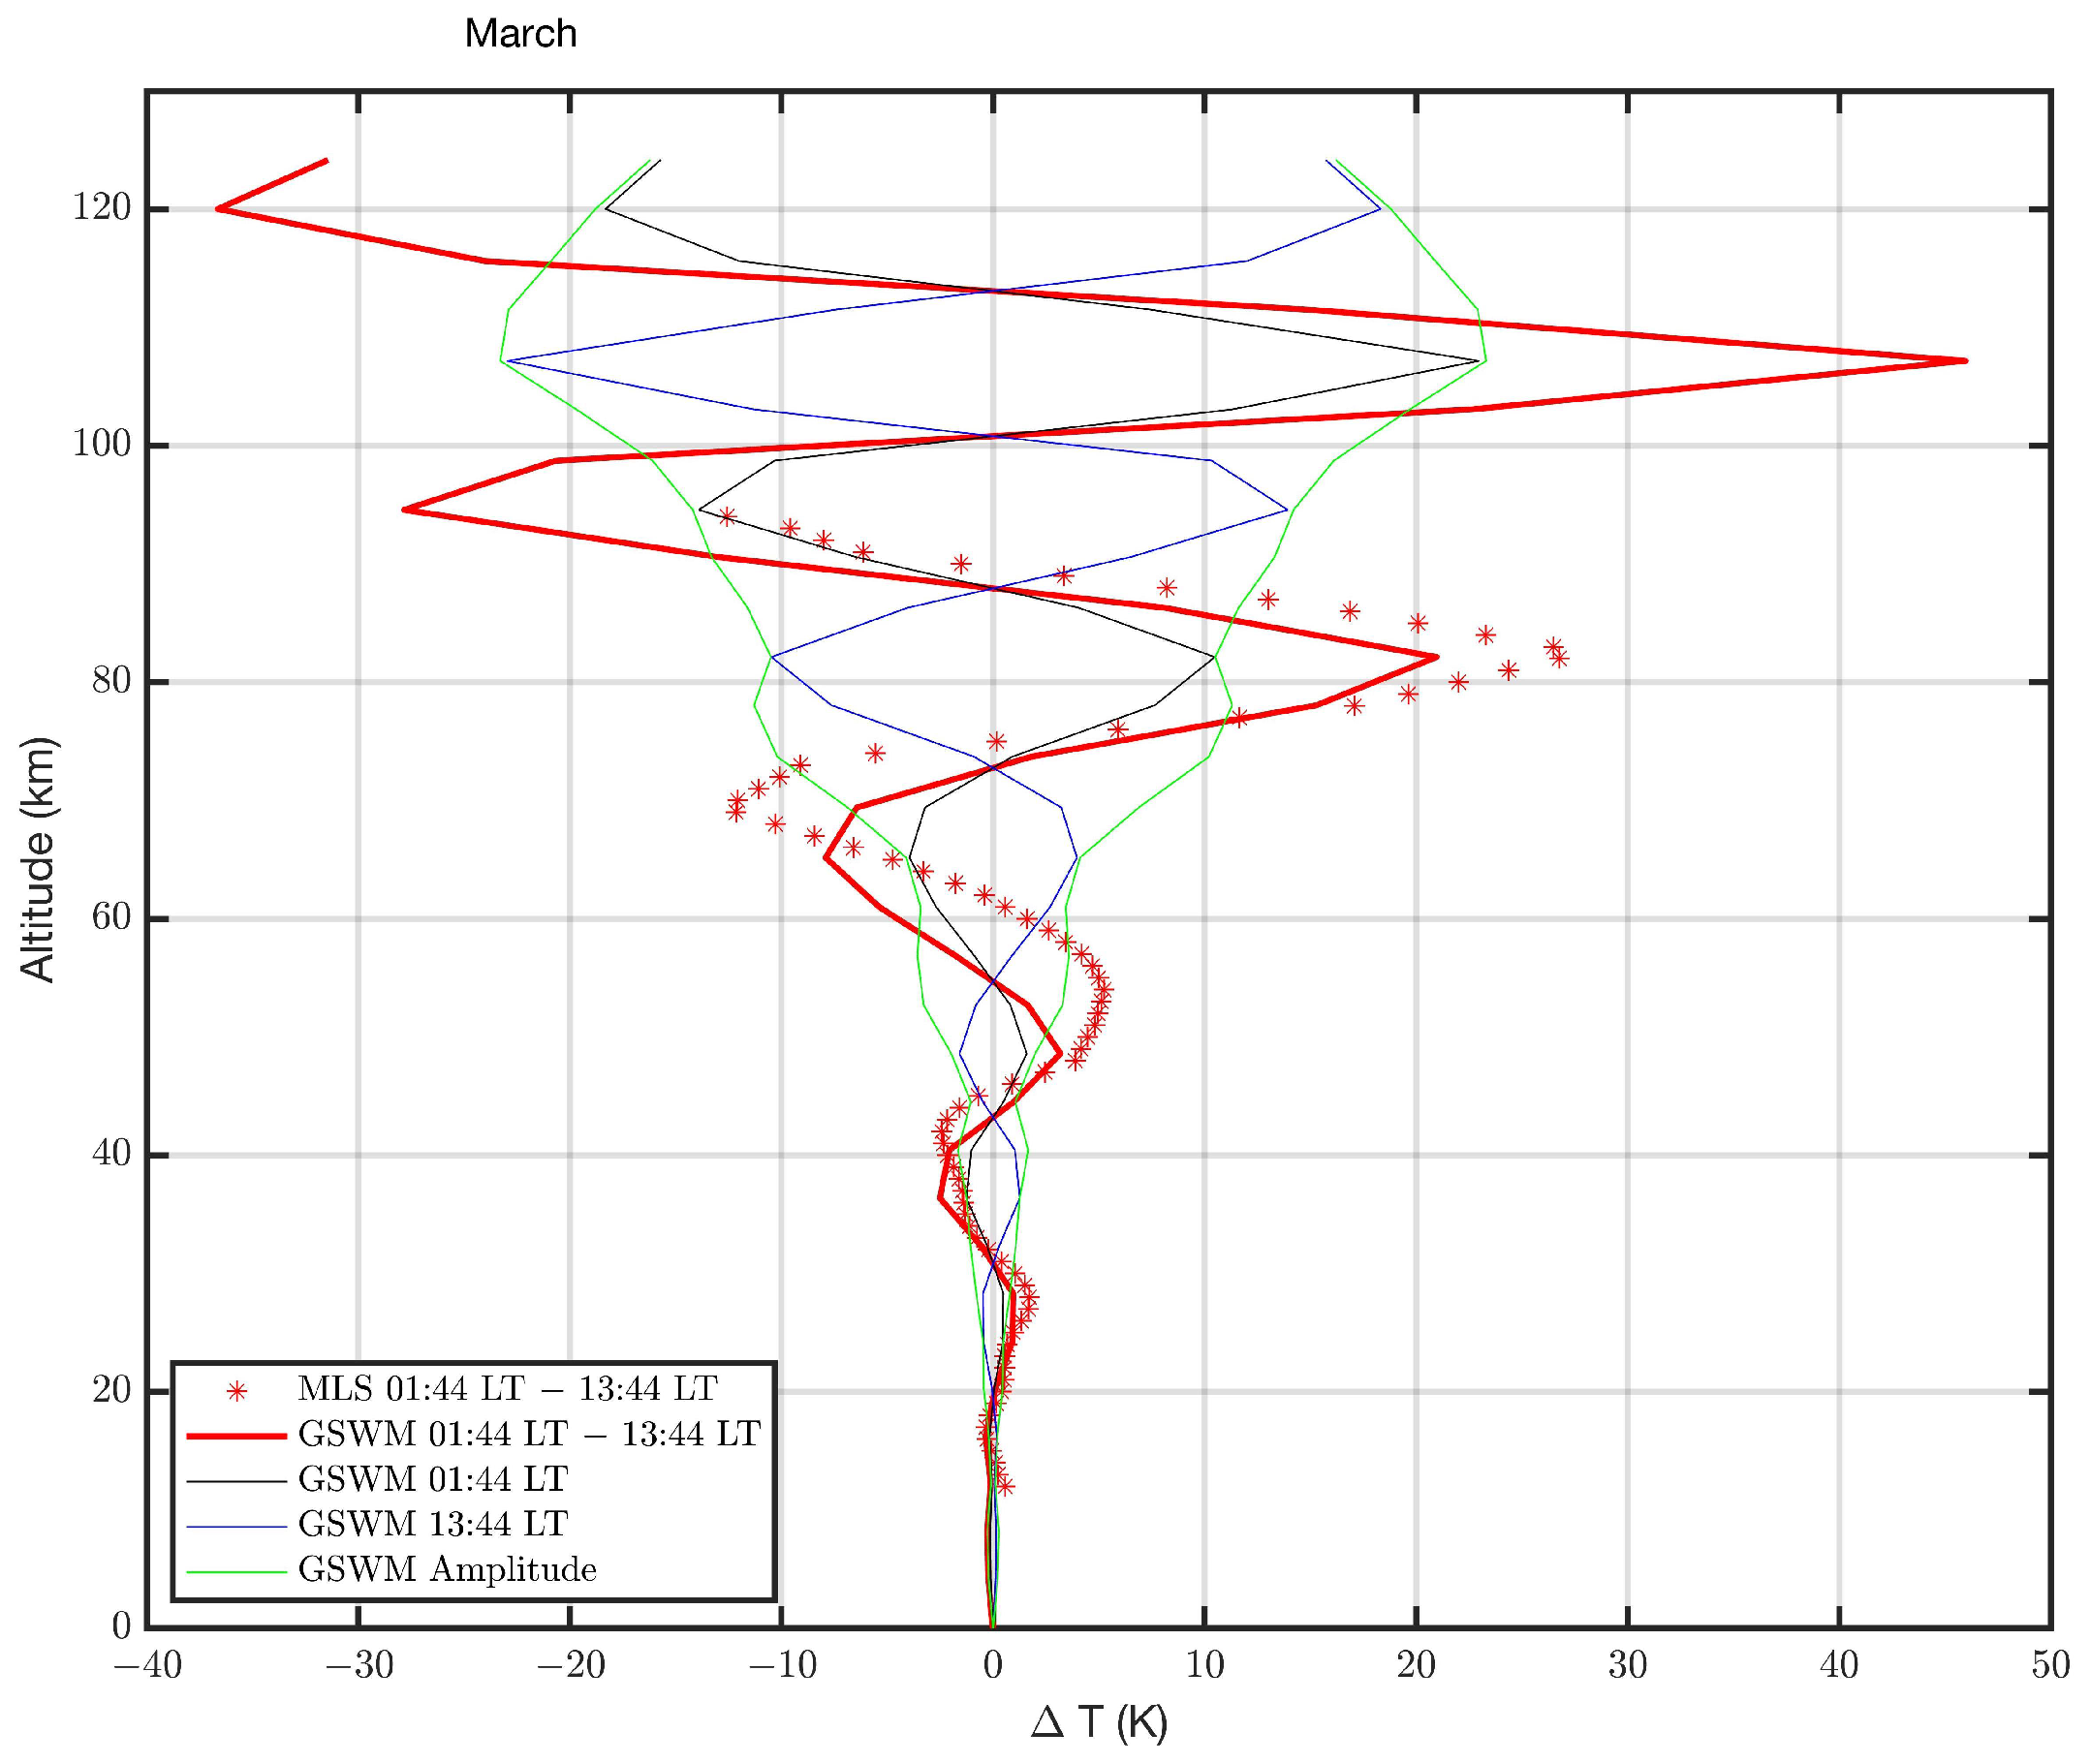
Figure 2 shows the vertical structure of DW1 at March equinox when the DW1 is maximal. The Aura profile is averaged for all March data from 2005 to 2021. The GSWM profiles are computed by means of the amplitudes and phases given by [32]. The vertical wavelength is about 25 km for Aura and GSWM.
The DW1 amplitude is equal to half of the extrema in Figure 2. Thus, we obtain a DW1 amplitude of about 10 K for GSWM and about 14 K for Aura at 82 km altitude. Beyond 85 km, the GSWM amplitude reaches high values. However, it could be that these values are overestimated since the tidal breaking of DW1 plays an important role beyond the mesopause [4].
The exponential increase in DW1 from the troposphere to the mesosphere agrees well for Aura and GSWM. Aura and GSWM both show a smaller amplitude of about 7 K at 80–82 km in altitude at the June solstice (not shown here), confirming the results by other studies on the SAO in DW1 [4,12,13].
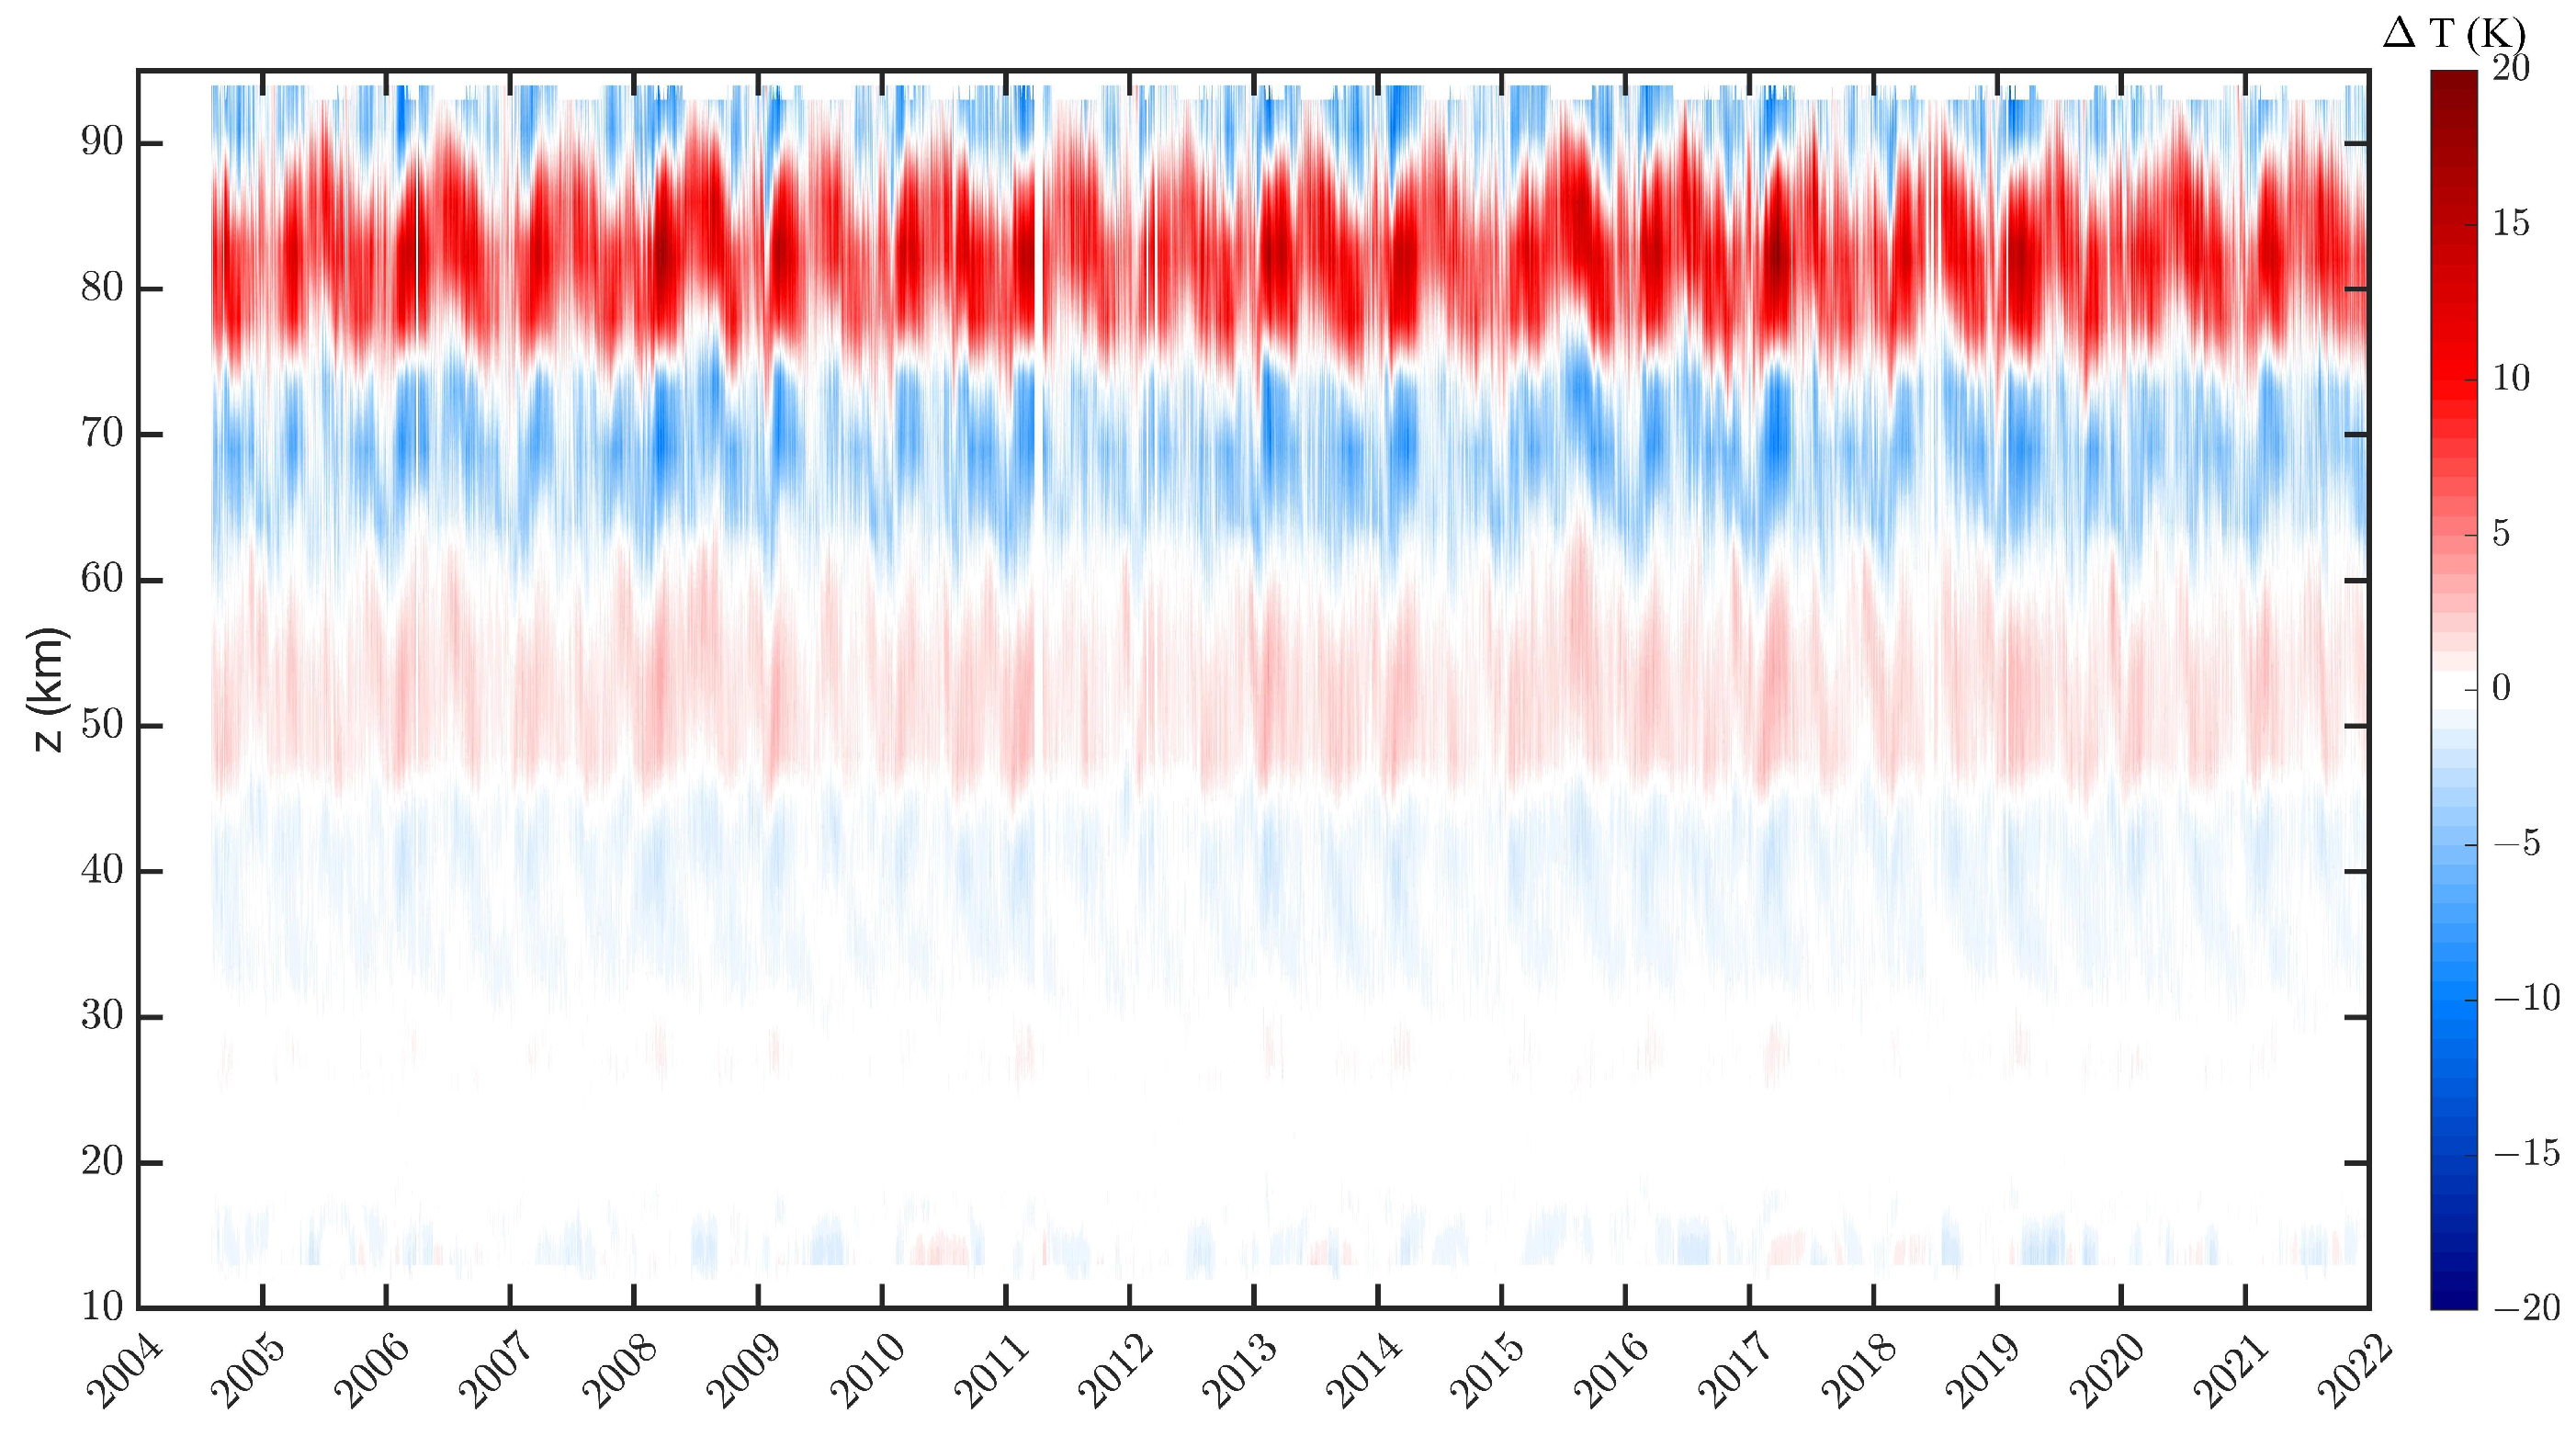
The intercomparison of Aura DW1 proxy Δ T and GSWM shows that Aura can measure the DW1. This result is further supported by the thorough study of [12]. Now, we look at the long-term series of Δ T observed by Aura/MLS at the equator. Figure 3 shows the temporal evolution of the nodes and bellies of DW1. The dominant variation is the SAO in DW1. There are also correlated patterns in different altitude regions from 40 to 80 km in altitude. For example, there is an amplitude increase around August 2015, which is in agreement with the study of [29] who found an increase of the equatorial DW1 amplitude at 90 km altitude due to the El Niño of 2015/2016. A significant linear trend or an 11-years solar cycle of DW1 is not visible in Figure 3.
Figure 4 shows the correlation between the Δ T ( z ) series and the Δ T(z = 50 km) series. There is a strong correlation in the positive bellies and anticorrelation in the negative bellies of DW1. Since the DW1 has an upward propagation of energy and momentum [5], the correlation profile of Figure 4 confirms the role of DW1 for the coupling of the lower, middle and upper atmosphere. Correlated temporal modulations of the equatorial DW1 proxy are present at different altitudes. This can be due to a variability in tropospheric latent heat releases, atmospheric composition changes or to a seasonal and inter-annual variability in the mean wind system in the middle atmosphere [4].
Figure 5 shows the climatology which was derived by sorting the Aura/MLS DW1 proxy series Δ T from Figure 3 for the season. The SAO with the strongest maximum at the March equinox is present at the stratopause and the mesosphere. The second SAO maximum at the September equinox is visible at the stratopause. In the mesosphere, the second SAO maximum is more shifted toward October. There is also a complex seasonal modulation of the altitude position of the nodes and bellies of the DW1 proxy, which could be due to interhemispheric differences in the polar mesospheric vortex and the latitudinal shear of the zonal wind. Beyond 90 km in altitude, an annual oscillation (AO) with a maximum at the June solstice is present.

3.2. Composite Analysis of the Equatorial DW1 Behaviour during Major SSWs

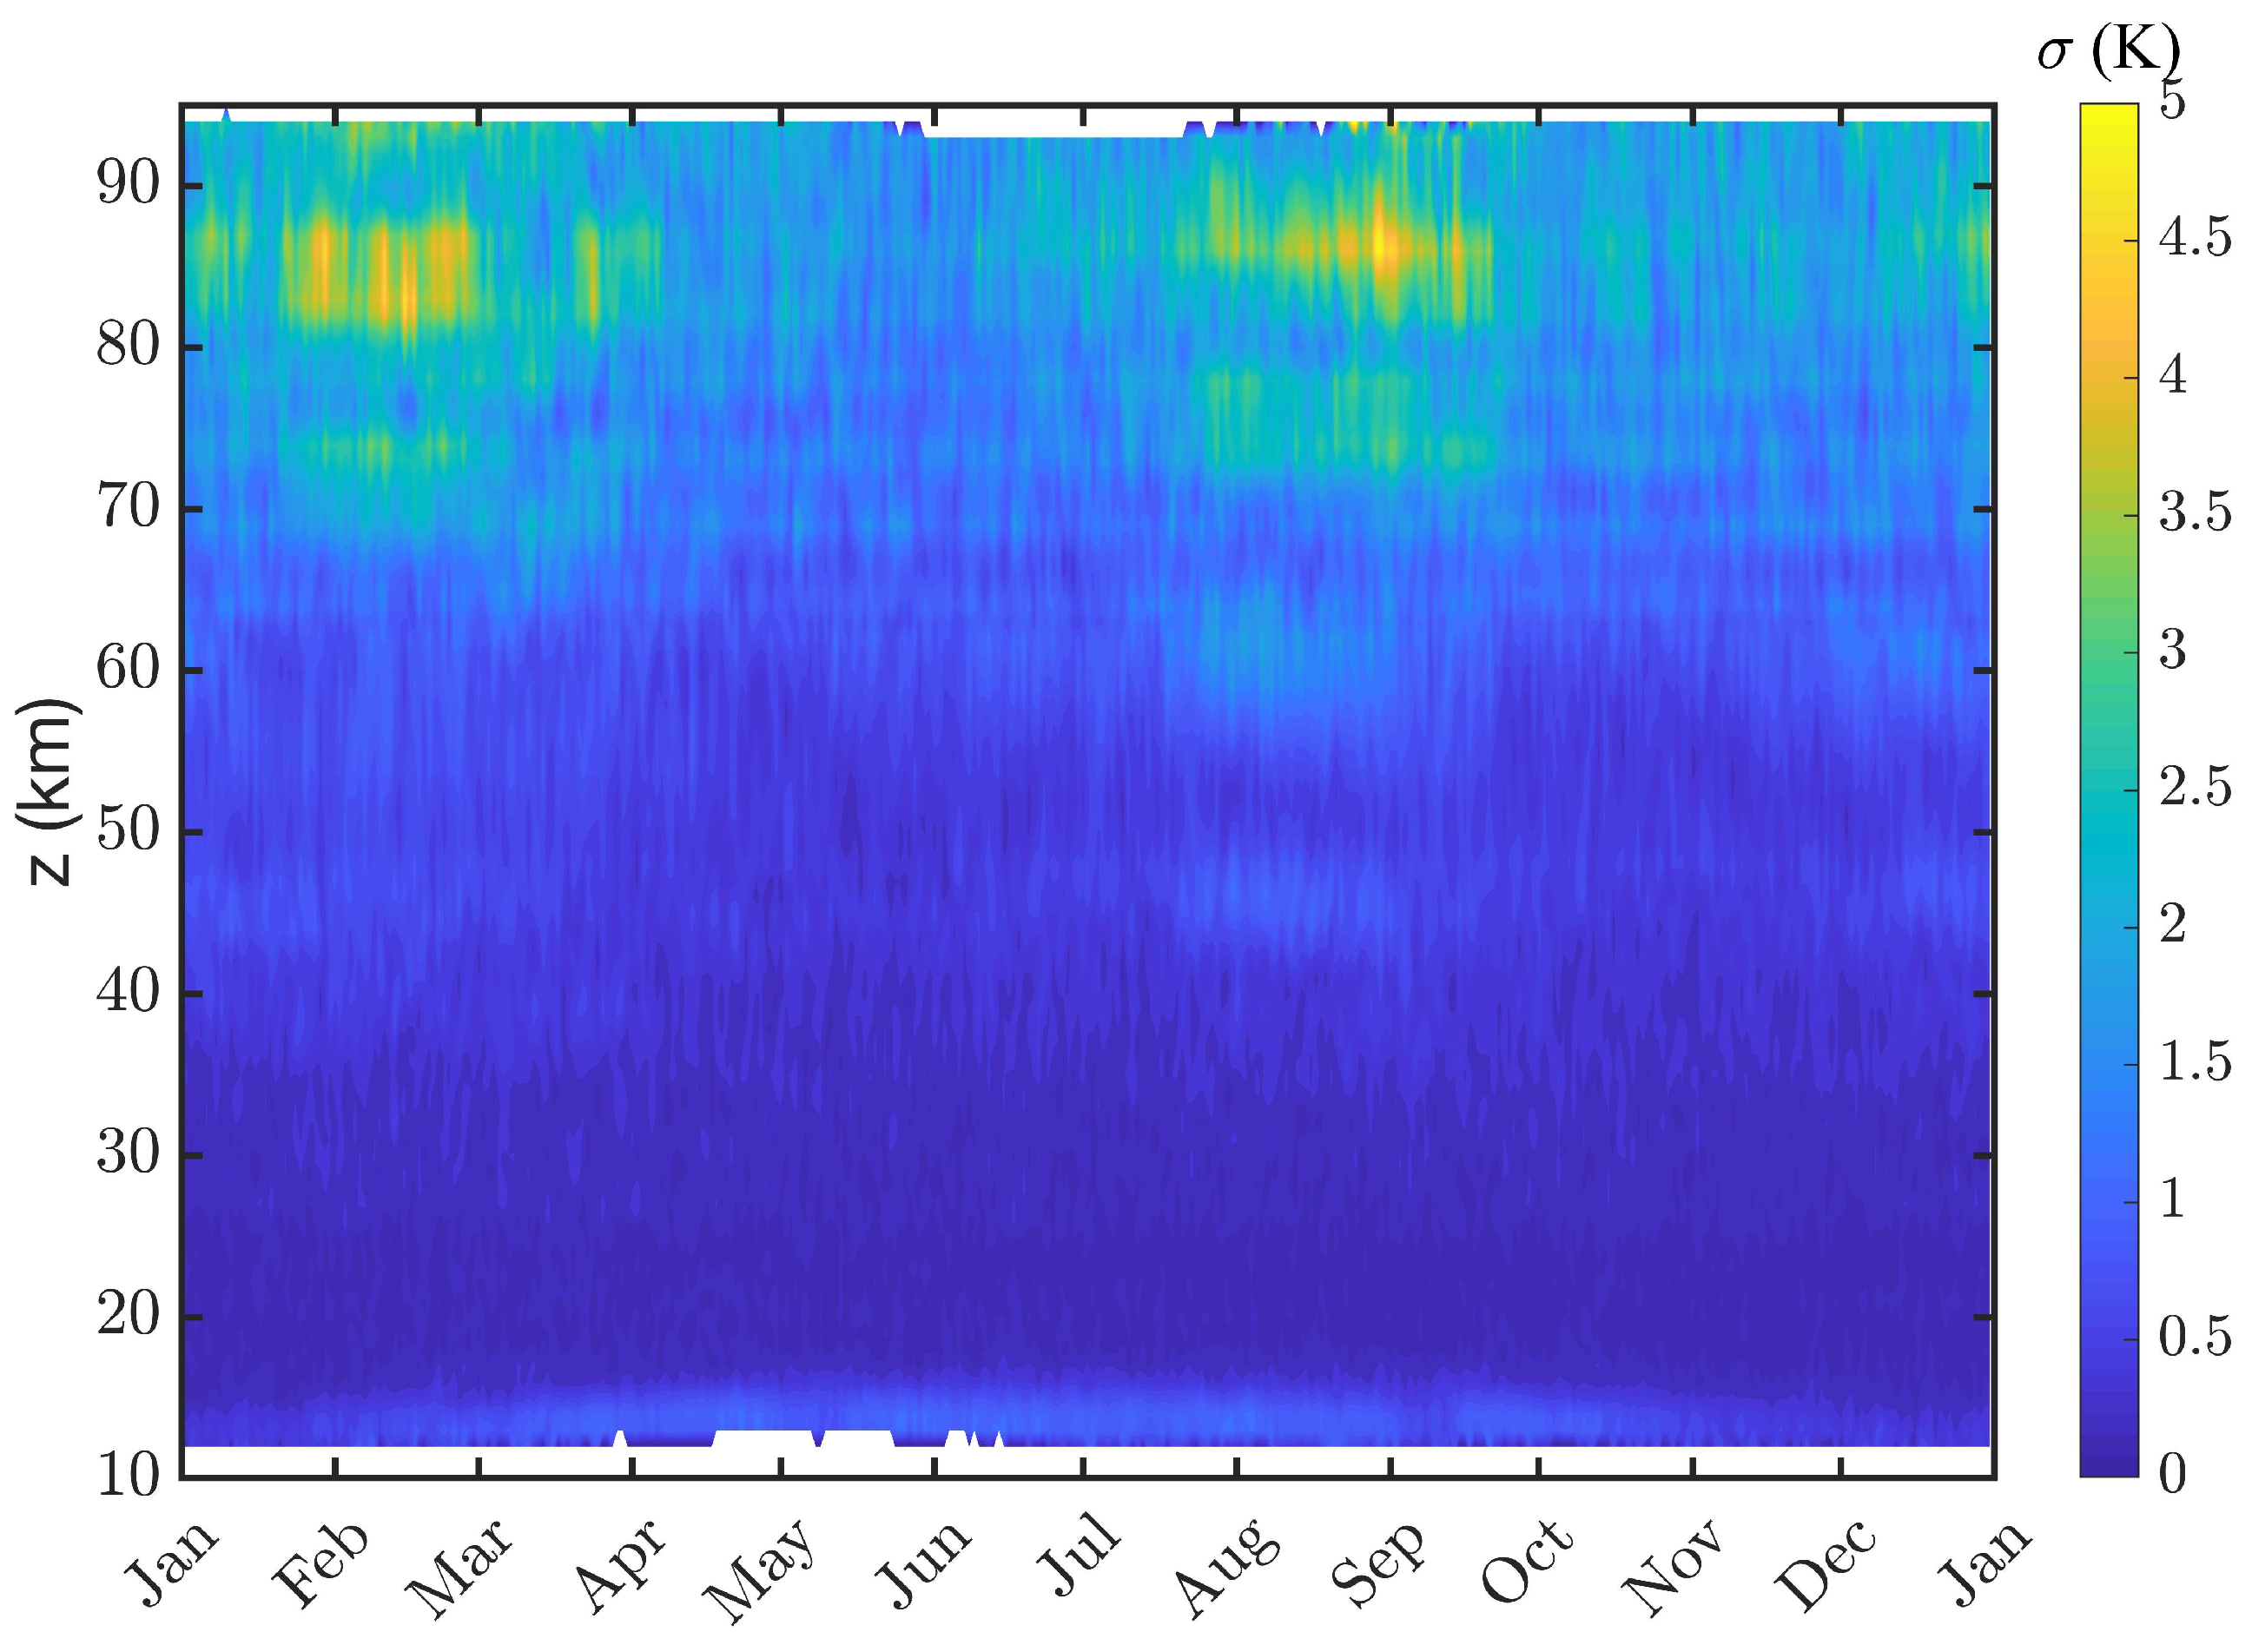
It is interesting to study the standard deviation of the climatological mean from Figure 5 since it can show in which seasons one can observe the strongest deviations from the climatology. The standard deviation σ is shown in Figure 6. It is evident that, in the upper mesosphere, the strongest σ occurs in late winter (February or August) in about 85 km altitude where the vertical gradient of the DW1 proxy Δ T ( z ) is maximal. The variability in the polar vortex is strongest in late winter when SSWs and other wave–mean flow interactions take place and disturb the latitudinal shear of the zonal wind. Thus, the vortex variability generates variations in the propagation of DW1, so that the equatorial DW1 proxy has deviations from the climatology.
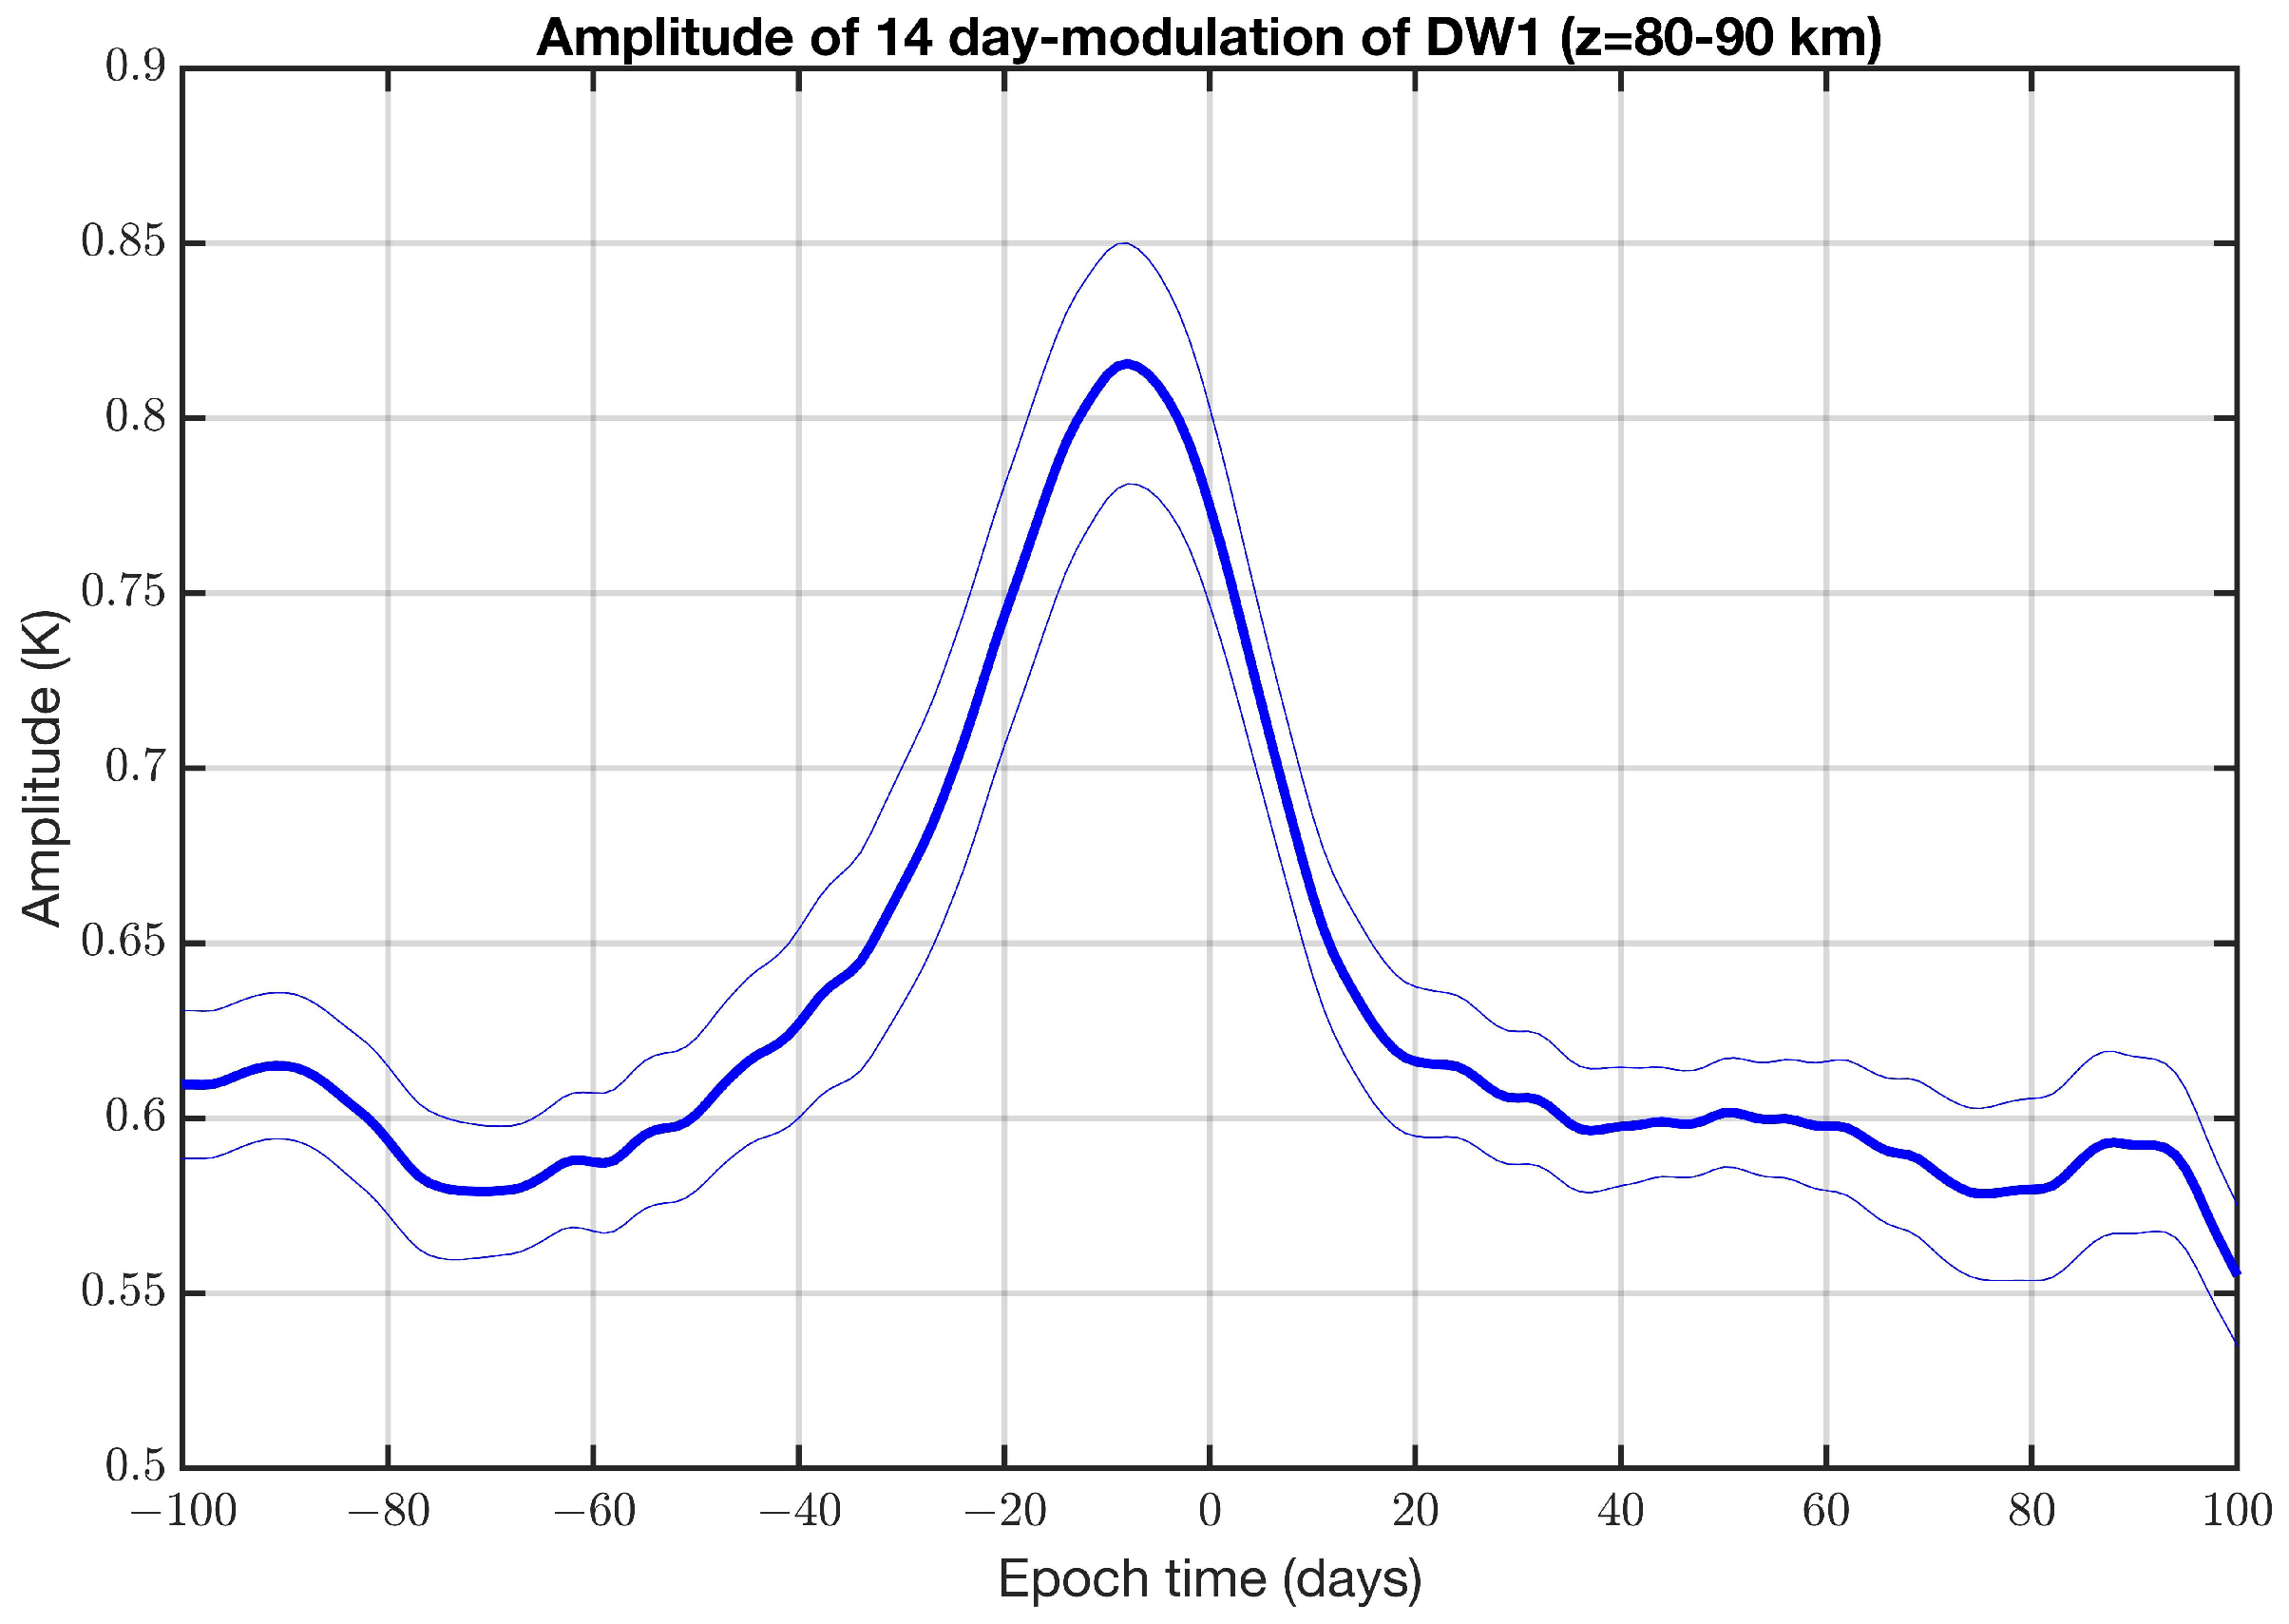
The stratospheric and mesospheric polar vortex in the Northern winter hemisphere often interacts with planetary Rossby waves with periods from 10 to 30 days. Breaking of the planetary wave in the middle atmosphere can induce an SSW associated with a large displacement or splitting of the polar vortex or a breakdown of the polar vortex. The planetary wave also interacts with DW1 and other tides, resulting in a modulation of the DW1 amplitude with the period of the planetary wave [42]. The composite analysis of the 17 SSW events is applied to the envelope of the 14 day-bandpass filtered Δ T series of the equatorial DW1 proxy. Figure 7 shows the result for the mean amplitude of the 14 day-oscillation at altitudes from 80 to 90 km. It is clear that the amplitude has a significant peak from 25 days before the SSW onset to 5 days after the SSW onset (epoch time 0).
Rather similar results are obtained for other planetary wave periods from 10 to 30 days. For longer periods, the peak becomes broader and larger. The planetary wave-like modulations of the DW1 proxy are enhanced before and around the central date of the SSW. The planetary wave-like DW1 modulations in the equatorial mesosphere are not correlated to DW1 modulations in the equatorial stratosphere.
The present study likes to analyse the mean deviation of the equatorial DW1 proxy after major SSWs, which usually happen in late winter (January, February) of the northern winter stratosphere. Figure 8a shows that the observations agree well with the climatology 30 to 5 days before the central date of the SSW. For averaging, the 17 central dates of [38] (U5570 criterium) were utilised to obtain the mean profiles in Figure 8. If the observations of the first week after the SSW are averaged (Figure 8b), the DW1 proxy (red line) is reduced by about 10% with respect to the climatological mean. In addition, the nodes and bellies of the equatorial DW1 in the mesosphere are shifted downward by 1–2 km after the SSW with respect to the climatology. At an 85 km altitude, the variation in DW1 after the SSW is maximal (about 70% reduction).
Figure 9 shows the composite of the deseasonalised equatorial DW1 proxy ( D T ) at 85 km in altitude (as defined in Equation (2)). It is evident that the D T value decreases by about 4 K in the week after the SSW. This SSW-induced variation is significant as the standard error (thin lines) shows in Figure 9. There seems to be a slight increase in the DW1 proxy several weeks after the SSW.
The composite of the deseasonalised equatorial DW1 proxy D T is shown as q function of epoch time and altitude (Figure 10). Again, one can see the significant decrease in the DW1 value at q 85 km altitude after the SSW. Below 73 km, an increase in the DW1 value is evident after the SSW. Since there is a negative belly at this altitude, the positive value of D T at the 73 km altitude after the SSW also means a reduction in DW1.
Finally, it is interesting to have a look at all anomalies in the long-term time series of the deseasonalised equatorial DW1 proxy D T , which is shown in Figure 11. The strongest anomaly is around August 2015, and the study of [29] relates this increase in the DW1 amplitude to the El Niño of 2015/2016, which led to enhanced tropospheric latent heat release. Considering the works of [19,20] about the vertical coupling of the Southern polar stratosphere and mesosphere, it is remarkable that the Antarctic ozone hole of 2015 was large and with a stable polar vortex in August 2015 [43]. Possibly, both phenomena (large ozone hole and strong El Niño) induced the anomaly of the DW1 proxy in August 2015.
Another anomaly which is visible in Figure 11 is the SSW of 5 January 2013. The amplitude of D T increased about 2–3 weeks after the SSW onset. This SSW was analysed for its influence on DW1 in the study of [22].

4. Discussion

In the present study, the behaviour of the equatorial DW1 proxy Δ T ( z ) (Equation (1)) is discussed. The exact derivation in the DW1 amplitude and phase from the Aura/MLS observations is not possible due to the poor sampling in the local solar time. Indeed, Aura/MLS only provides a temperature profile after noon and after midnight. However, the equatorial DW1 proxy agrees well with the adjusted results of the GSWM model. It is possible to estimate the amplitude and the vertical wavelength by looking at the extrema of the equatorial DW1 proxy Δ T ( z ) . In the mesosphere, a vertical wavelength of about 25 km is found, and the maximum and minimum amplitudes achieve 14 K at the March equinox and 7 K at the June equinox in the upper mesosphere, respectively. This is in a good agreement with the GSWM model and with observational studies [4,12,13].
We derived the climatology of the equatorial DW1 proxy. The temporal evolution of the DW1 proxy shows a dominant SAO but also contributions of the AO. The characteristics of the equatorial DW1 proxy are in agreement with other observational studies [4,12,13]. However, one has to keep in mind that the vertical position of the nodes and bellies of the DW1 proxy slightly depend on the local solar time of the equator crossing, which are at 01:44 and 13:44 LST. In spite of this limitation, the DW1 proxy is well-suited for the study of the temporal evolution and modulation of DW1. An advantage of the DW1 proxy is the high temporal resolution of 1 day.
A significant 11-years solar cycle or a linear trend of the DW1 proxy are not present in the 17 years of Aura/MLS observations. However, long-term simulations with the WACCM model showed that the solar cycle influence on the DW1 amplitude is within ± 0.3 Kelvin in the stratosphere and mesosphere ( Δ D W 1 < 0.3 K / 100 s . f . u . ) [44]. In this regard, the Aura observations are in agreement with the WACCM simulation.
The QBO variation in the DW1 proxy of Aura/MLS in the equatorial mesosphere has an average amplitude of about 1 K, which is less than the 3 K which was reported by [13]. We estimated the QBO amplitude by means of a fast Fourier transform (FFT) spectrum for the time interval from August 2004 to December 2021 (not shown here). It is likely that the QBO amplitude exceeds the estimated mean amplitude of 1 K in certain years when the QBO is stronger.
There are short enhancements of the DW1 proxy which contribute to the amplification of the SAO in some years. These modulations are well-correlated from the lower stratosphere to the mesosphere. This correlation is expected since DW1 is propagating upward from the lower atmosphere to the mesosphere. The positive anomaly around August 2015 was already related by [29] to the El Niño of 2015/2016, which caused an increase in tropical tropospheric latent heat release.
The present study shows that the deviations from the climatology are strongest in late winter. There is also a significant increase in planetary wave-like modulations (e.g., 14-day period) of the DW1 proxy before and around the SSW central date. At this time, the polar vortex is disturbed by the breaking of strong planetary waves, which leads to wave–mean flow interactions and the associated SSW onset. This is a consequence of the latitudinal shear of zonal wind changes which influences the propagation of DW1 in the middle atmosphere [22]. It was shown by [22] that the amplitude of the DW1 above the equator is reduced after SSWs. The study of [22] utilised TIMED/SABER observations and found a reduction in the DW1 amplitude after SSW events. However, other studies predicted other responses of solar tides to SSWs (e.g., [24,45]). Thus, it makes sense to utilise the Aura series and to perform a composite analysis of 17 major SSWs and their influence on the deseasonalised, equatorial DW1 proxy. In agreement with [22], a reduction in the DW1 proxy amplitude by 10% occurs in the first week after the central date of the SSW event. As a further new result, it is found that the mesospheric nodes and bellies of the DW1 proxy are downwardly shifted by about 1–2 km in altitude in the first week after the SSW.

Funding

This research received no external funding.

Institutional Review Board Statement

Not applicable.

Informed Consent Statement

Not applicable.

Data Availability Statement

The Aura/MLS data are available at the Aura Validation Data Center (AVDC). https://avdc.gsfc.nasa.gov/ (accessed on 26 October 2023). GSWM model output data are provided here: https://www2.hao.ucar.edu/modeling/gswm-global-scale-wave-model (accessed on 27 October 2023).

Acknowledgments

I thank the University of Bern for supporting the study. I thank the Aura/MLS team for their data and Maura Hagan for the GSWM model output. Gunter Stober and Witali Krochin are thanked for a valuable discussion. The three reviewers are thanked for their improvements of the study.

Conflicts of Interest

The author declares no conflict of interest.

References

  1. Dieminger, W.; Hartmann, G.K.; Leitinger, R. (Eds.) Atmospheric Tides. In The Upper Atmosphere: Data Analysis and Interpretation; Springer: Berlin/Heidelberg, Germany, 1996; pp. 97–109. [Google Scholar] [CrossRef]
  2. Alexander, S.P.; Tsuda, T. Observations of the diurnal tide during seven intensive radiosonde campaigns in Australia and Indonesia. J. Geophys. Res. Atmos. 2008, 113, D04109. [Google Scholar] [CrossRef]
  3. Sakazaki, T.; Fujiwara, M.; Zhang, X.; Hagan, M.E.; Forbes, J.M. Diurnal tides from the troposphere to the lower mesosphere as deduced from TIMED/SABER satellite data and six global reanalysis data sets. J. Geophys. Res. Atmos. 2012, 117, D13108. [Google Scholar] [CrossRef]
  4. Garcia, R.R. On the Structure and Variability of the Migrating Diurnal Temperature Tide Observed by SABER. J. Atmos. Sci. 2023, 80, 687–704. [Google Scholar] [CrossRef]
  5. Lindzen, R.S.; Chapman, S. Atmospheric tides. Space Sci. Rev. 1969, 10, 3–188. [Google Scholar] [CrossRef]
  6. Forbes, J.M. Atmospheric tides: 1. Model description and results for the solar diurnal component. J. Geophys. Res. Space Phys. 1982, 87, 5222–5240. [Google Scholar] [CrossRef]
  7. Hagan, M.E.; Forbes, J.M. Migrating and nonmigrating diurnal tides in the middle and upper atmosphere excited by tropospheric latent heat release. J. Geophys. Res. Atmos. 2002, 107, ACL 6-1–ACL 6-15. [Google Scholar] [CrossRef]
  8. Oberheide, J.; Hagan, M.E.; Roble, R.G. Tidal signatures and aliasing in temperature data from slowly precessing satellites. J. Geophys. Res. Space Phys. 2003, 108, 1055. [Google Scholar] [CrossRef]
  9. Waters, J.W.; Froidevaux, L.; Harwood, R.S.; Jarnot, R.F.; Pickett, H.M.; Read, W.G.; Siegel, P.H.; Cofield, R.E.; Filipiak, M.J.; Flower, D.A.; et al. The Earth Observing System Microwave Limb Sounder (EOS MLS) on the Aura satellite. IEEE Trans. Geosci. Remote Sens. 2006, 44, 1075–1092. [Google Scholar] [CrossRef]
  10. Forbes, J.M.; Vincent, R.A. Effects of mean winds and dissipation on the diurnal propagating tide: An analytic approach. Planet. Space Sci. 1989, 37, 197–209. [Google Scholar] [CrossRef]
  11. Zhou, X.; Wan, W.; Yu, Y.; Ning, B.; Hu, L.; Yue, X. New Approach to Estimate Tidal Climatology From Ground- and Space-Based Observations. J. Geophys. Res. Space Phys. 2018, 123, 5087–5101. [Google Scholar] [CrossRef]
  12. Salinas, C.C.J.H.; Wu, D.L.; Lee, J.N.; Chang, L.C.; Qian, L.; Liu, H. Aura/MLS observes and SD-WACCM-X simulates the seasonality, quasi-biennial oscillation and El Niño–Southern Oscillation of the migrating diurnal tide driving upper mesospheric CO primarily through vertical advection. Atmos. Chem. Phys. 2023, 23, 1705–1730. [Google Scholar] [CrossRef]
  13. Xu, J.; Smith, A.K.; Liu, H.L.; Yuan, W.; Wu, Q.; Jiang, G.; Mlynczak, M.G.; Russell, J.M., III; Franke, S.J. Seasonal and quasi-biennial variations in the migrating diurnal tide observed by Thermosphere, Ionosphere, Mesosphere, Energetics and Dynamics (TIMED). J. Geophys. Res. Atmos. 2009, 114, D13107. [Google Scholar] [CrossRef]
  14. Matsuno, T. Dynamical Model of Stratospheric Sudden Warming. J. Atmos. Sci. 1971, 28, 1479–1494. [Google Scholar] [CrossRef]
  15. Schoeberl, M.R. Stratospheric Warmings—Observations and Theory. Rev. Geophys. 1978, 16, 521–538. [Google Scholar] [CrossRef]
  16. McInturff, R. Stratospheric Warmings: Synoptic, Dynamic and General Circulation Aspects; NASA References Publ. NASA-RP-1017; National Meteorological Center: Washington, DC, USA, 1978. [Google Scholar]
  17. Matthewman, N.J.; Esler, J.G.; Charlton-Perez, A.J.; Polvani, L.M. A New Look at Stratospheric Sudden Warmings. Part III: Polar Vortex Evolution and Vertical Structure. J. Clim. 2009, 22, 1566–1585. [Google Scholar] [CrossRef]
  18. Pedatella, N.M.; Chau, J.L.; Schmidt, H.; Goncharenko, L.P.; Stolle, C.; Hocke, K.; Harvey, V.; Funke, B.; Siddiqui, T.A. How Sudden stratospheric warmings affect the whole atmosphere. EOS Trans. AGU 2018, 99, 35–38. [Google Scholar] [CrossRef]
  19. Lossow, S.; McLandress, C.; Jonsson, A.I.; Shepherd, T.G. Influence of the Antarctic ozone hole on the polar mesopause region as simulated by the Canadian Middle Atmosphere Model. J. Atmos. Sol. Terr. Phys. 2012, 74, 111–123. [Google Scholar] [CrossRef]
  20. Lubis, S.W.; Omrani, N.E.; Matthes, K.; Wahl, S. Impact of the Antarctic Ozone Hole on the Vertical Coupling of the Stratosphere–Mesosphere–Lower Thermosphere System. J. Atmos. Sci. 2016, 73, 2509–2528. [Google Scholar] [CrossRef]
  21. Zülicke, C.; Becker, E. The structure of the mesosphere during sudden stratospheric warmings in a global circulation model. J. Geophys. Res. Atmos. 2013, 118, 2255–2271. [Google Scholar] [CrossRef]
  22. Siddiqui, T.A.; Chau, J.L.; Stolle, C.; Yamazaki, Y. Migrating solar diurnal tidal variability during Northern and Southern Hemisphere Sudden Stratospheric Warmings. Earth Planets Space 2022, 74, 101. [Google Scholar] [CrossRef]
  23. Harvey, V.L.; Randall, C.E.; Bailey, S.M.; Becker, E.; Chau, J.L.; Cullens, C.Y.; Goncharenko, L.P.; Gordley, L.L.; Hindley, N.P.; Lieberman, R.S.; et al. Improving ionospheric predictability requires accurate simulation of the mesospheric polar vortex. Front. Astron. Space Sci. 2022, 9, 1041426. [Google Scholar] [CrossRef]
  24. Wang, J.; Yi, W.; Wu, J.; Chen, T.; Xue, X.; Zeng, J.; Vincent, R.A.; Reid, I.M.; Batista, P.P.; Buriti, R.A.; et al. Coordinated Observations of Migrating Tides by Multiple Meteor Radars in the Equatorial Mesosphere and Lower Thermosphere. J. Geophys. Res. Space Phys. 2022, 127, e2022JA030678. [Google Scholar] [CrossRef]
  25. Scheiben, D.; Straub, C.; Hocke, K.; Forkman, P.; Kämpfer, N. Observations of middle atmospheric H2O and O3 during the 2010 major sudden stratospheric warming by a network of microwave radiometers. Atmos. Chem. Phys. 2012, 12, 7753–7765. [Google Scholar] [CrossRef]
  26. Scheiben, D.; Tschanz, B.; Hocke, K.; Kämpfer, N.; Ka, S.; Oh, J.J. The quasi 16-day wave in mesospheric water vapor during boreal winter 2011/2012. Atmos. Chem. Phys. 2014, 14, 6511–6522. [Google Scholar] [CrossRef]
  27. Woollings, T.; Li, C.; Drouard, M.; Dunn-Sigouin, E.; Elmestekawy, K.A.; Hell, M.; Hoskins, B.; Mbengue, C.; Patterson, M.; Spengler, T. The role of Rossby waves in polar weather and climate. Weather Clim. Dyn. 2023, 4, 61–80. [Google Scholar] [CrossRef]
  28. Riggin, D.M.; Lieberman, R.S. Variability of the diurnal tide in the equatorial MLT. J. Atmos. Sol. Terr. Phys. 2013, 102, 198–206. [Google Scholar] [CrossRef]
  29. Kogure, M.; Liu, H. DW1 Tidal Enhancements in the Equatorial MLT During 2015 El Niño: The Relative Role of Tidal Heating and Propagation. J. Geophys. Res. Space Phys. 2021, 126, e2021JA029342. [Google Scholar] [CrossRef]
  30. Livesey, N.J.; Read, W.G.; Wagner, P.A.; Froidevaux, L.; Santee, M.L.; Schwartz, M.J.; Lambert, A.; Valle, L.F.M.; Pumphrey, H.C.; Manney, G.L.; et al. Earth Observing System (EOS) Aura Microwave Limb Sounder (MLS) Version 5.0x Level 2 and 3 Data Quality and Description Document. Technical Report, JPL D-105336 Rev. B. 2022. Available online: https://mls.jpl.nasa.gov/data/v5-0_data_quality_document.pdf (accessed on 24 November 2023).
  31. Schwartz, M.J.; Lambert, A.; Manney, G.L.; Read, W.G.; Livesey, N.J.; Froidevaux, L.; Ao, C.O.; Bernath, P.F.; Boone, C.D.; Cofield, R.E.; et al. Validation of the Aura Microwave Limb Sounder temperature and geopotential height measurements. J. Geophys. Res. Atmos. 2008, 113, D15S11. [Google Scholar] [CrossRef]
  32. Hagan, M. Global Scale Wave Model. Available online: https://www2.hao.ucar.edu/modeling/gswm-global-scale-wave-model (accessed on 25 October 2023).
  33. Hagan, M.E.; Chang, J.L.; Avery, S.K. Global-scale wave model estimates of nonmigrating tidal effects. J. Geophys. Res. Atmos. 1997, 102, 16439–16452. [Google Scholar] [CrossRef]
  34. Tsuda, T.; Ohnishi, K.; Isoda, F.; Nakamura, T.; Vincent, R.A.; Reid, I.M.; Harijono, S.W.B.; Sribimawati, T.; Nuryanto, A.; Wiryosumarto, H. Coordinated radar observations of atmospheric diurnal tides in equatorial regions. Earth Planets Space 1999, 51, 579–592. [Google Scholar] [CrossRef]
  35. Keckhut, P.; Funatsu, B.M.; Claud, C.; Hauchecorne, A. Tidal effects on stratospheric temperature series derived from successive advanced microwave sounding units. Q. J. R. Meteorol. Soc. 2015, 141, 477–483. [Google Scholar] [CrossRef] [PubMed]
  36. Hagen, J.; Hocke, K.; Stober, G.; Pfreundschuh, S.; Murk, A.; Kämpfer, N. First measurements of tides in the stratosphere and lower mesosphere by ground-based Doppler microwave wind radiometry. Atmos. Chem. Phys. 2020, 20, 2367–2386. [Google Scholar] [CrossRef]
  37. Hocke, K.; Lainer, M.; Schanz, A. Composite analysis of a major sudden stratospheric warming. Ann. Geophys. 2015, 33, 783–788. [Google Scholar] [CrossRef]
  38. Palmeiro, F.M.; García-Serrano, J.; Ruggieri, P.; Batté, L.; Gualdi, S. On the Influence of ENSO on Sudden Stratospheric Warmings. J. Geophys. Res. Atmos. 2023, 128, e2022JD037607. [Google Scholar] [CrossRef]
  39. Hersbach, H.; Bell, B.; Berrisford, P.; Hirahara, S.; Horanyi, A.; Munoz-Sabater, J.; Nicolas, J.; Peubey, C.; Radu, R.; Schepers, D.; et al. The ERA5 global reanalysis. Q. J. R. Meteorol. Soc. 2020, 146, 1999–2049. [Google Scholar] [CrossRef]
  40. Butler, A.H.; Sjoberg, J.P.; Seidel, D.J.; Rosenlof, K.H. A sudden stratospheric warming compendium. Earth Syst. Sci. Data 2017, 9, 63–76. [Google Scholar] [CrossRef]
  41. Studer, S.; Hocke, K.; Kämpfer, N. Intraseasonal oscillations of stratospheric ozone above Switzerland. J. Atmos. Sol. Terr. Phys. 2012, 74, 189–198. [Google Scholar] [CrossRef]
  42. Forbes, J. Wave Coupling and Nonlinear Interactions in the Atmospheres of Earth and Mars. Q. Phys. Rev. 2017, 3. Available online: https://esmed.org/MRA/qpr/article/view/1439 (accessed on 24 November 2023).
  43. World Meteorological Organization. 2015 Ozone Hole One of the Largest on Record. Available online: https://public.wmo.int/en/resources/meteoworld/2015-ozone-hole-one-of-largest-record (accessed on 16 November 2023).
  44. Ramesh, K.; Smith, A.K.; Garcia, R.R.; Marsh, D.R.; Sridharan, S.; Kishore Kumar, K. Long-Term Variability and Tendencies in Migrating Diurnal Tide From WACCM6 Simulations During 1850–2014. J. Geophys. Res. Atmos. 2020, 125, e2020JD033644. [Google Scholar] [CrossRef]
  45. Fuller-Rowell, T.J.; Fang, T.W.; Wang, H.; Matthias, V.; Hoffmann, P.; Hocke, K.; Studer, S. Impact of migrating tides on electrodynamics during the January 2009 sudden stratospheric warming. In Ionospheric Space Weather; American Geophysical Union (AGU): Washington, DC, USA, 2016; Chapter 14; pp. 163–174. [Google Scholar] [CrossRef]
Figure 1. (a) Zonal mean temperature profiles at 01:45 LST (blue) and 13:45 LST (red) including the standard error observed by Aura/MLS on 31 March 2014 (from 2 South to 2 North). (b) The difference T(01:45 LST) − T(13:45 LST).
Atmosphere 14 01743 g001
Figure 2. Night-time minus daytime temperature above the equator ( ± 2 in latitude) observed by Aura/MLS and predicted by GSWM-00 (at 0 latitude) for the DW1 in March (Aura data for 2005–2021). Similar signatures of DW1 show up in the Aura/MLS proxy and in the GSWM output.
Atmosphere 14 01743 g002
Figure 3. Modulation of the Aura/MLS proxy ( Δ T = 0.5 ( T 01 : 44 L S T T 13 : 44 L S T ) ) for the amplitude of the migrating diurnal tide above the equator ( ± 2 in latitude). Semi-annual and annual oscillations are present. The amplitude modulations are correlated at several altitudes.
Atmosphere 14 01743 g003
Figure 4. Correlation between the Aura/MLS DW1 proxy series Δ T ( z ) from Figure 3 with the series at z = 50 km. The correlation of the tidal structures is strong from the lower stratosphere to the upper mesosphere. The stars indicate significant correlation coefficients with probability values less than 0.05 for the null hypothesis.
Atmosphere 14 01743 g004
Figure 5. Climatology of the Aura/MLS proxy series Δ T from Figure 3.
Atmosphere 14 01743 g005
Figure 6. Climatology of the standard deviation of the climatological mean from Figure 5.
Atmosphere 14 01743 g006
Figure 7. Composite analysis of the amplitude (envelope) of the 14 day-modulation of the equatorial DW1 proxy at altitudes from 80 to 90 km. The thin lines denote the standard error. Epoch time 0 corresponds to the central dates of the 17 major SSWs (U5570) from August 2004 to December 2021 [38].
Atmosphere 14 01743 g007
Figure 8. Averaged equatorial DW1 proxy of observation (red) and climatology (blue) 30 to 5 days before the SSW (a) and one week after the SSW (b). The 17 major SSW events (U5570) of [38] were taken. The standard error is ca. 0.2 K at altitudes from 70 to 90 km.
Atmosphere 14 01743 g008
Figure 9. Composite of the deseasonalised equatorial DW1 proxy ( D T ) at a 85 km altitude (thick line). The standard error is shown by the thin lines. The 17 major SSW events (U5570) of [38] were taken. The central dates of the SSWs correspond to epoch time 0.
Atmosphere 14 01743 g009
Figure 10. Composite of the deseasonalised equatorial DW1 proxy D T : Superposition of 17 SSW events. Absolute values are shown. Epoch time 0 corresponds to the central date of the SSW. The standard error is ca. 0.4 K at altitudes from 70 to 90 km.
Atmosphere 14 01743 g010
Figure 11. Long-term time series of the deseasonalised equatorial DW1 proxy D T indicating anomalies where the proxy deviates from the climatological mean. The vertical dotted lines denote the dates 5 January 2013 (SSW event) and 1 August 2015 (El Niño).
Atmosphere 14 01743 g011
Disclaimer/Publisher’s Note: The statements, opinions and data contained in all publications are solely those of the individual author(s) and contributor(s) and not of MDPI and/or the editor(s). MDPI and/or the editor(s) disclaim responsibility for any injury to people or property resulting from any ideas, methods, instructions or products referred to in the content.