Article

Detecting Indonesian Monsoon Signals and Related Features Using Space–Time Singular Value Decomposition (SVD)

1
Program Studi Meteorologi, Sekolah Tinggi Meteorologi Klimatologi dan Geofisika (STMKG), Tangerang Selatan 15221, Indonesia
2
Department of Geophysics and Meteorology, Faculty of Mathematics and Natural Science, IPB University, Bogor 16680, Indonesia
3
Agency for Meteorology Climatology and Geophysics, Jakarta 10720, Indonesia
*
Author to whom correspondence should be addressed.
Atmosphere 2024, 15(2), 187; https://doi.org/10.3390/atmos15020187
Submission received: 12 December 2023 / Revised: 19 January 2024 / Accepted: 29 January 2024 / Published: 31 January 2024

Abstract

:
Several investigations have proven the existence of monsoons in Indonesia. However, this has received little attention due to the scientific argument that the region of 10° N–10° S is not monsoonal because it receives precipitation all year round. This study used space–time SVD analysis of atmospheric and oceanic field data for 30 years (1990–2020) to detect monsoon signals and related features. The single-field SVD analysis of rainfall revealed that the first mode accounts for only 33% of the total variance, suggesting it is highly variable. Both the PC space and time series show the well-known monsoon pattern. Further, the Indonesian monsoon regimes and phases are defined based on the revealed rainfall features. The wet season lasts from November to April, accounting for more than 77% of annual precipitation. The coupled-field SVD analyses show that Indonesian monsoon rainfall strongly correlates with local SST (PC1 accounts for 70.4%), and the pattern is associated with the Asian winter monsoon. The heterogonous vector correlation map analysis revealed that the related features during the monsoon, including the strengthening and weakening of subtropical anticyclones, the intertwining of westerly wind in the Indian Ocean, and variations in the north–south dipole structure of the ocean temperature, are linked to variations in Indonesia’s monsoon rainfall. This result can serve as the dynamic basis for defining the Indonesian monsoon index in the context of the center of action.

1. Introduction

A monsoon is a seasonal change in wind or rainfall patterns in the tropics. [1]. The departure of monsoon precipitation in tropical regions is a critical event in the annual cycle. Local agriculture can be significantly affected by the timing and intensity of this event [2,3]. For example, both excess and deficit monsoon rainfall lead to agricultural failure [4]. Being inside the tropical zone, Indonesia experiences monsoon seasons [5,6,7], necessitating a comprehensive understanding of monsoon variability to mitigate negative consequences and enhance the resilience of local production systems. Moreover, evidence suggests that more extreme incidents of rainfall in Indonesia have occurred, with the frequency and intensity of the anomaly expected to increase [8,9,10,11]. Therefore, understanding monsoon rainfall variability in the region is critical since it promotes socioeconomic development through informed planning.
Many studies have pointed out the existence of monsoons in Indonesia [5,12,13]. However, it is still not well-defined due to the scientific argument that the near-equatorial region between 10° S and 10° N does not belong to the typical monsoon climate because it receives plentiful annual rainfall [14]. Consequently, many scientists have avoided discussing the Indonesian monsoon and exploring other significant large-scale phenomena, such as the El Niño–Southern Oscillation (ENSO), in their investigations of regional monsoons. Indeed, the Indonesia agency for meteorology, climatology, and geophysics (BMKG) continues to utilize the AUSMI index to monitor monsoon activities in Indonesia, regardless of its lack of value. AUSMI was based on local Australian rainfall [15,16], while a monsoon exhibits strong regional characteristics [1,17,18]. Therefore, as a first step, it is imperative to clarify the presence of the Indonesian monsoon in light of its fundamental consequences on the environmental and economic conditions of the region.
Despite hundreds of years of research, defining monsoons is difficult since a monsoon is a complicated multiscale process [19,20]. Several criteria must be considered to characterize a monsoon. The conventional definition of monsoon is a large-scale land–sea breeze induced by the differing temperatures of the ocean and land. As a result, some early methodologies for defining monsoons relied entirely on the seasonal reversal of low-level winds [21]. While the concept of wind reversal provides a valuable framework for understanding Asian monsoons, it may not encompass American monsoons, even though they are also classified as monsoon systems [17,19]. The modern theory is partly prompted by monsoons’ significant socioeconomic and scientific importance. Consequently, delineating monsoon regions based on precipitation, including the Indonesian region, is imperative and beneficial.
Monsoons can be characterized by some features. The features of a monsoon refer to the physical characteristics or processes of the interconnected land–ocean–atmosphere system [1]. Therefore, gaining a comprehensive understanding of the various features of monsoons is crucial in enhancing the prediction of these weather phenomena. Such an approach has provided valuable insights into understanding the dynamic structure and teleconnection for the Australian summer monsoon [15] and success increases its predictability. One of the primary features of the monsoon system is its driving force. Sea surface temperature (SST) and wind structure are the primary internal forces of monsoon systems through the air–sea interaction process. The monsoon system is sensitive to the SST distribution due to variations in circulations triggered by the gradients of the SSTs [22]. In order to make accurate long-term climate predictions, it is crucial to possess an understanding of the complex mechanisms involving heat, momentum, and material exchange between the atmosphere and the ocean. This is mostly due to the fact that the time constants and capacity of the ocean are far greater than those of the atmosphere [1]. The warmer SSTs cause the surface pressure to decrease, leading to local accelerations of atmospheric dynamics. As a result, stronger monsoon intensity is induced.
Some previous studies have revealed the relationship between SST and Indonesian monsoon rainfall [12,18,23,24,25,26]. They show that cooling (warming) of SST results in a lower (higher) rainfall. Both local and remote SST might significantly modulate Indonesian rainfall variability. However, the co-occurrence of local and remote SST anomalies makes it difficult to determine which one has the most significant influence on the variability of Indonesian monsoon rainfall, underscoring the need to better understand the nature and mechanisms of Indonesian monsoon rainfall variability [12,27,28,29]. Moreover, most previous study analyses mentioned were based on simple analysis methods like compositing and correlation based on selected reference grid points or indices that are easy to perform but involve subjective decisions about the choice of reference time series. Or they applied classical single-field empirical orthogonal function (EOF) analyses that highlighted individual rather than coupled modes [18] that make the resulting patterns not physically interpretable.
Thus, this study employs single- and coupled-field SVD techniques instead of classical EOF to examine the possible spatial pattern of rainfall variability, its temporal evolution, and its association with remote and local SST and wind patterns. SVD analysis has been widely used to explore spatial and temporal variability within large atmospheric datasets by projecting the original datasets on an orthogonal basis derived by computing the singular vectors of a spatially weighted anomaly covariance matrix, and the related singular values quantify the percentage of variation explained by each pattern. This success can be explained by the ability of SVDs to extract the primary coupled modes of variability in the original dataset into a few spatial patterns and associated time series [30]. Each extracted coupled mode accounts for a portion of the covariance between the two concurrently investigated fields. Such a technique is important since the primary modes of covariance are often amenable to physical interpretation and usually lead to an insight into the complex processes responsible for modulating the covariability.
This study aims to identify Indonesian monsoon signals and examine related features. For these purposes, we first conducted a single-field SVD analysis of rainfall data to detect monsoon signals. Furthermore, we declared the Indonesian monsoon regime. Second, we carried out a coupled-field SVD analysis of rainfall and SST to investigate related features. We linked the dominant mode of the coupled-field SVD’s PC time series to wind data to depict associated circulation. From this, we gained knowledge of the dynamic basis of the Indonesian monsoon as a novelty for defining the monsoon index in the context of the center of action. Additionally, we used a new dataset and approach in the analysis. The paper is organized as follows: Section 2 describes datasets used and methods for SVD analysis. Section 3 shows the results of the single- and coupled-SVD analysis. Further, associated physical mechanisms are detailed using several atmospheric fields. Section 4 provides concluding remarks and the implications of the findings.

2. Materials and Methods

Various datasets were utilized within the time frame spanning from 1990 to 2020. The Climate Hazards Group InfraRed Precipitation with Station data (CHIRPS), which combines station observations and satellite data with 0.05° × 0.05° resolution, is one of the datasets used in this study [31]. The coverage area of CHRIPS is 50° S–50° N and was obtained for the period 1990–2020. Numerous earlier studies on Indonesia have used CHIRPS [5,32,33,34,35,36] because of its superior geographical and temporal coverage compared to most other gridded rainfall data that are now available.
The optimum interpolation sea surface temperature (OISST) is the SST data employed in this investigation [37], obtained from the National Centers for Environmental Information (NOAA)’s Climate Data Record (CDR). This long-term climate data record combines measurements from many platforms (satellites, ships, buoys, and Argo floats) into a regular global grid as the NOAA 0.25° × 0.25° daily OISST. The dataset is interpolated to build an accurate sea surface temperature map with no blank spaces. Satellite and ship observations are compared to buoys to account for platform differences and sensor biases. The NOAA Optimum Interpolation 0.25° monthly Sea Surface Temperature (OISST) Analysis, Version 2, is the name given to the dataset dOISST.v2 at the National Centers for Environmental Information.
We also used the monthly mean NCEP-DOE Reanalysis II (R2) data provided by the National Centers for Environmental Prediction (NCEP) and National Center for Atmospheric Research (NCAR) from their website at https://psl.noaa.gov/data/gridded/data.ncep.reanalysis2.html (accessed on 1 January 2023) for the period 1981–2010. NCEP-DOE Reanalysis II (R2) is the state-of-the-art version of NCEP-NCAR Reanalysis I (R1). Some improvements include improved models with stronger physical parameterizations, rectified data assimilation issues, and more data [38]. The datasets are acquired as a regular array with a 2.5° × 2.5° grid. The detail-specific techniques and methods of the analysis data used in this study are explained as follows.

2.1. SVD Analysis

SVD is a mathematical technique that extends the eigenvalue problem of a positive, semi-definite, normal matrix. It decomposes a matrix into three components: two orthogonal matrices (known as left and right singular vectors) and a diagonal matrix that contains the singular values along its main diagonal. In this study, SVD is used to analyze the mode of variability of climate variables in space and time, detect their patterns, and further measure the importance of each pattern. SVD was designed to split coupled modes from two different areas with an identical temporal period. This makes SVD ideal compared to other methods such as the empirical orthogonal function.
This study involved implementing two distinct types of SVD, including single-field and coupled-field SVD. The single-field SVD uses rainfall data to extract major modes of variation. The SVD coupled mode of spatial patterns and their temporal variations is identified using two data matrices of two studied domains. Each pair explains a fraction of covariance between the two jointly analyzed fields and the calculation is based on the covariance matrix. This decomposition permits the extraction of dominant modes of coupled covariability between the two analyzed fields. For coupled fields, we perform SVD analysis between the Indonesian rainfall fields (left field) and the global SST (right field).
The primary emphasis of our study was to analyze the variability of the data rather than long-term trends. To facilitate this analysis, we applied least square detrending and mean-removal techniques to the input data while preserving the seasonal component from each of the time series. Thus, each of the data has a mean of zero.

2.2. Correlation Map

We use homogeneous and heterogenous correlation maps to provide SVD analysis results as suggested by [39]. The k-th homogeneous correlation map is a vector that shows the correlation between the expansion coefficient of the k-th mode of a field and its values at each grid point. The spatial distribution of the covariant component that exists between the field and its kth mode may be efficiently evaluated by employing this indicator. The k-th heterogeneous correlation map is defined as an array of correlation values that depict the connection between the expansion coefficient of the k-th mode of a certain field and the grid point of another field, with the aim of establishing a correlation between the two fields. This statement clarifies the degree to which the predicted values of the grid points in the second field can be reliably anticipated by considering the expansion coefficient of the first field.
When applying SVD, a correlation map for the k-th mode represents the correlation between the k-th expansion coefficient of a specific variable and the corresponding grid point values. This correlation can be either between the same variables (homogeneous map) or between the other variables involved in the SVD (heterogeneous map). The depicted contours in all cases represent the distribution of mode centers of action, which have been scaled as correlation coefficients.
Vector correlation maps are generated by calculating the correlation between the k-th expansion coefficient of one variable and the different components of a vector field, such as the u and v components of vector wind. The resultant correlation values can subsequently be graphed as the constituents of a vector correlation. The arrows indicate the wind’s direction, and their length is directly proportionate to the strength of the correlation.

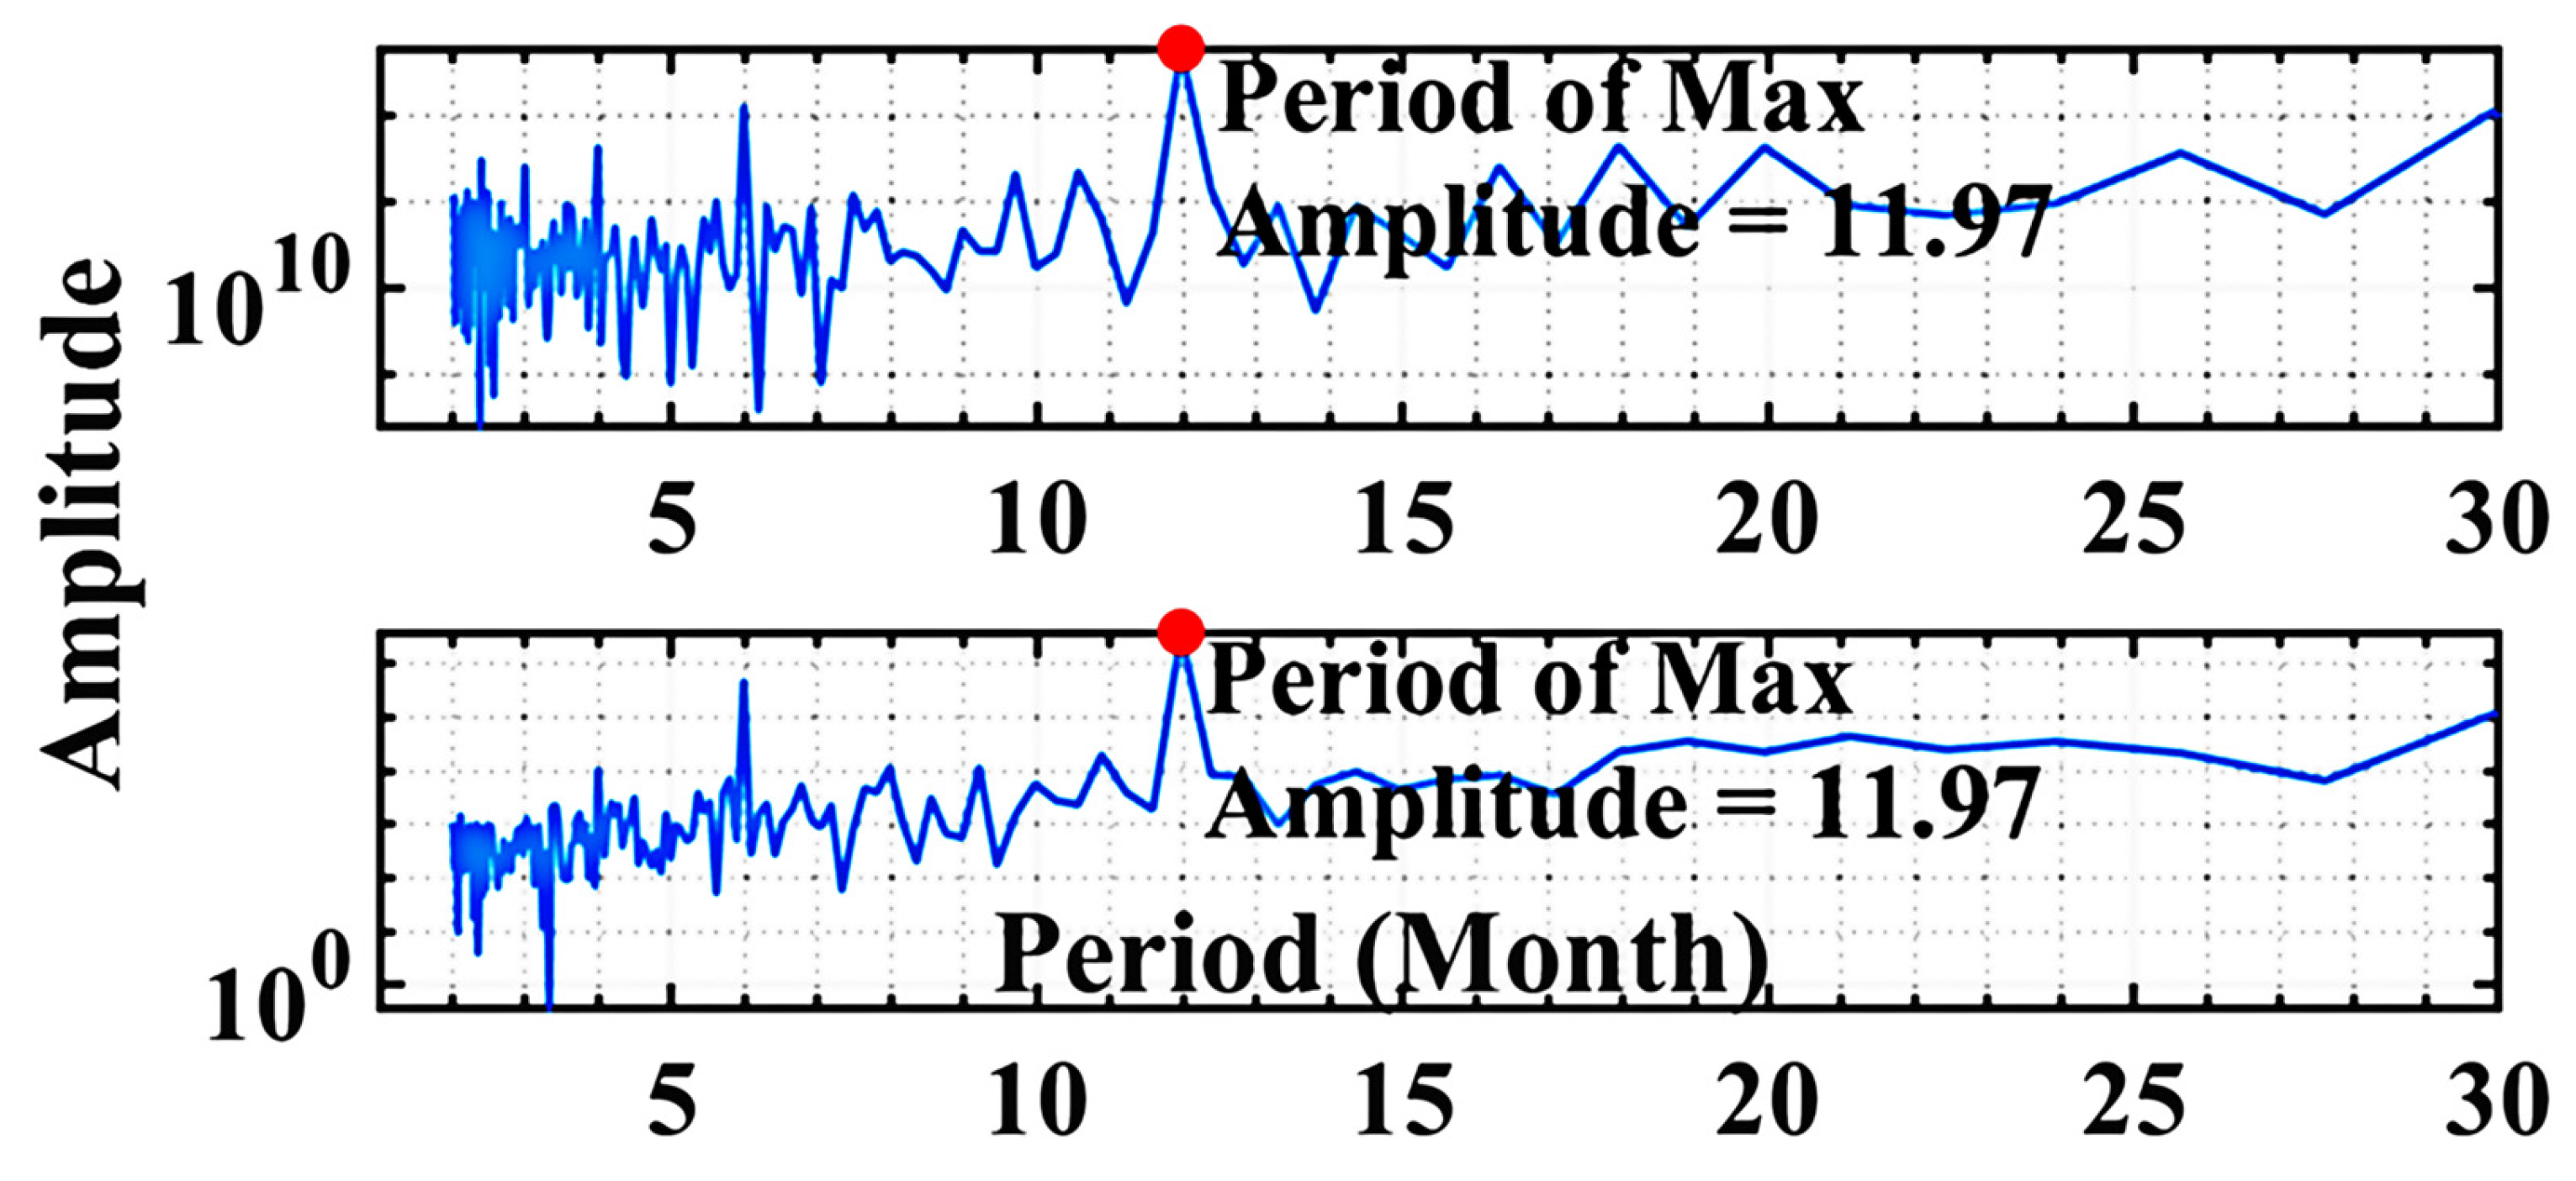
2.3. The Fast Fourier Transform (FFT) Spectrum Algorithm

The FFT was utilized to analyze the rainfall anomalies with the greatest power/amplitude in the time series to determine the dominant frequencies of the associated PC1. It is a very important algorithm in the computation of a sequence’s discrete Fourier transform (DFT). It transforms a time or space signal into a frequency domain signal.
The DFT exhibits mathematical characteristics in the spectral analysis of periodic signals that closely resemble those of the Fourier integral transform. The DFT approach for a series with N terms necessitates N squared (N2) operations, while the FFT requires only 2N log2 N. Thus, the FFT technique efficiently produces spectral data and performs harmonic analysis with enhanced speed while maintaining high accuracy. To perform spectral analysis on a Nyquist sample, where the provided data points are evenly distributed, and the DFT is strongly connected to the Fourier transform of the continuous waveform, the FFT is frequently employed as a substitute for the DFT [40].
A rainfall time series represented by the FFT algorithm as a function of ψ (x, y, t) is presented in Equation (1), where x is the pixel number or longitude, y is the line number or latitude, and t is time measured in months. Therefore, ψ (x, y, t) can be written as a linear combination of basic periodic functions:
ψ x , y , t = n = 1 N A x , y n e i ω n t Φ x , y n
where ω n is frequency, A is amplitude, and g is phase lag. The frequency is directly proportional to the period τ by ω n = 2 π / τ n . Φ represents the collective set of events that occur inside the cycle. An event refers to a specific period of time during which a repeated sequence of events or phenomena, characterized by a particular combination of amplitude and phase, is concluded.

3. Results and Discussion

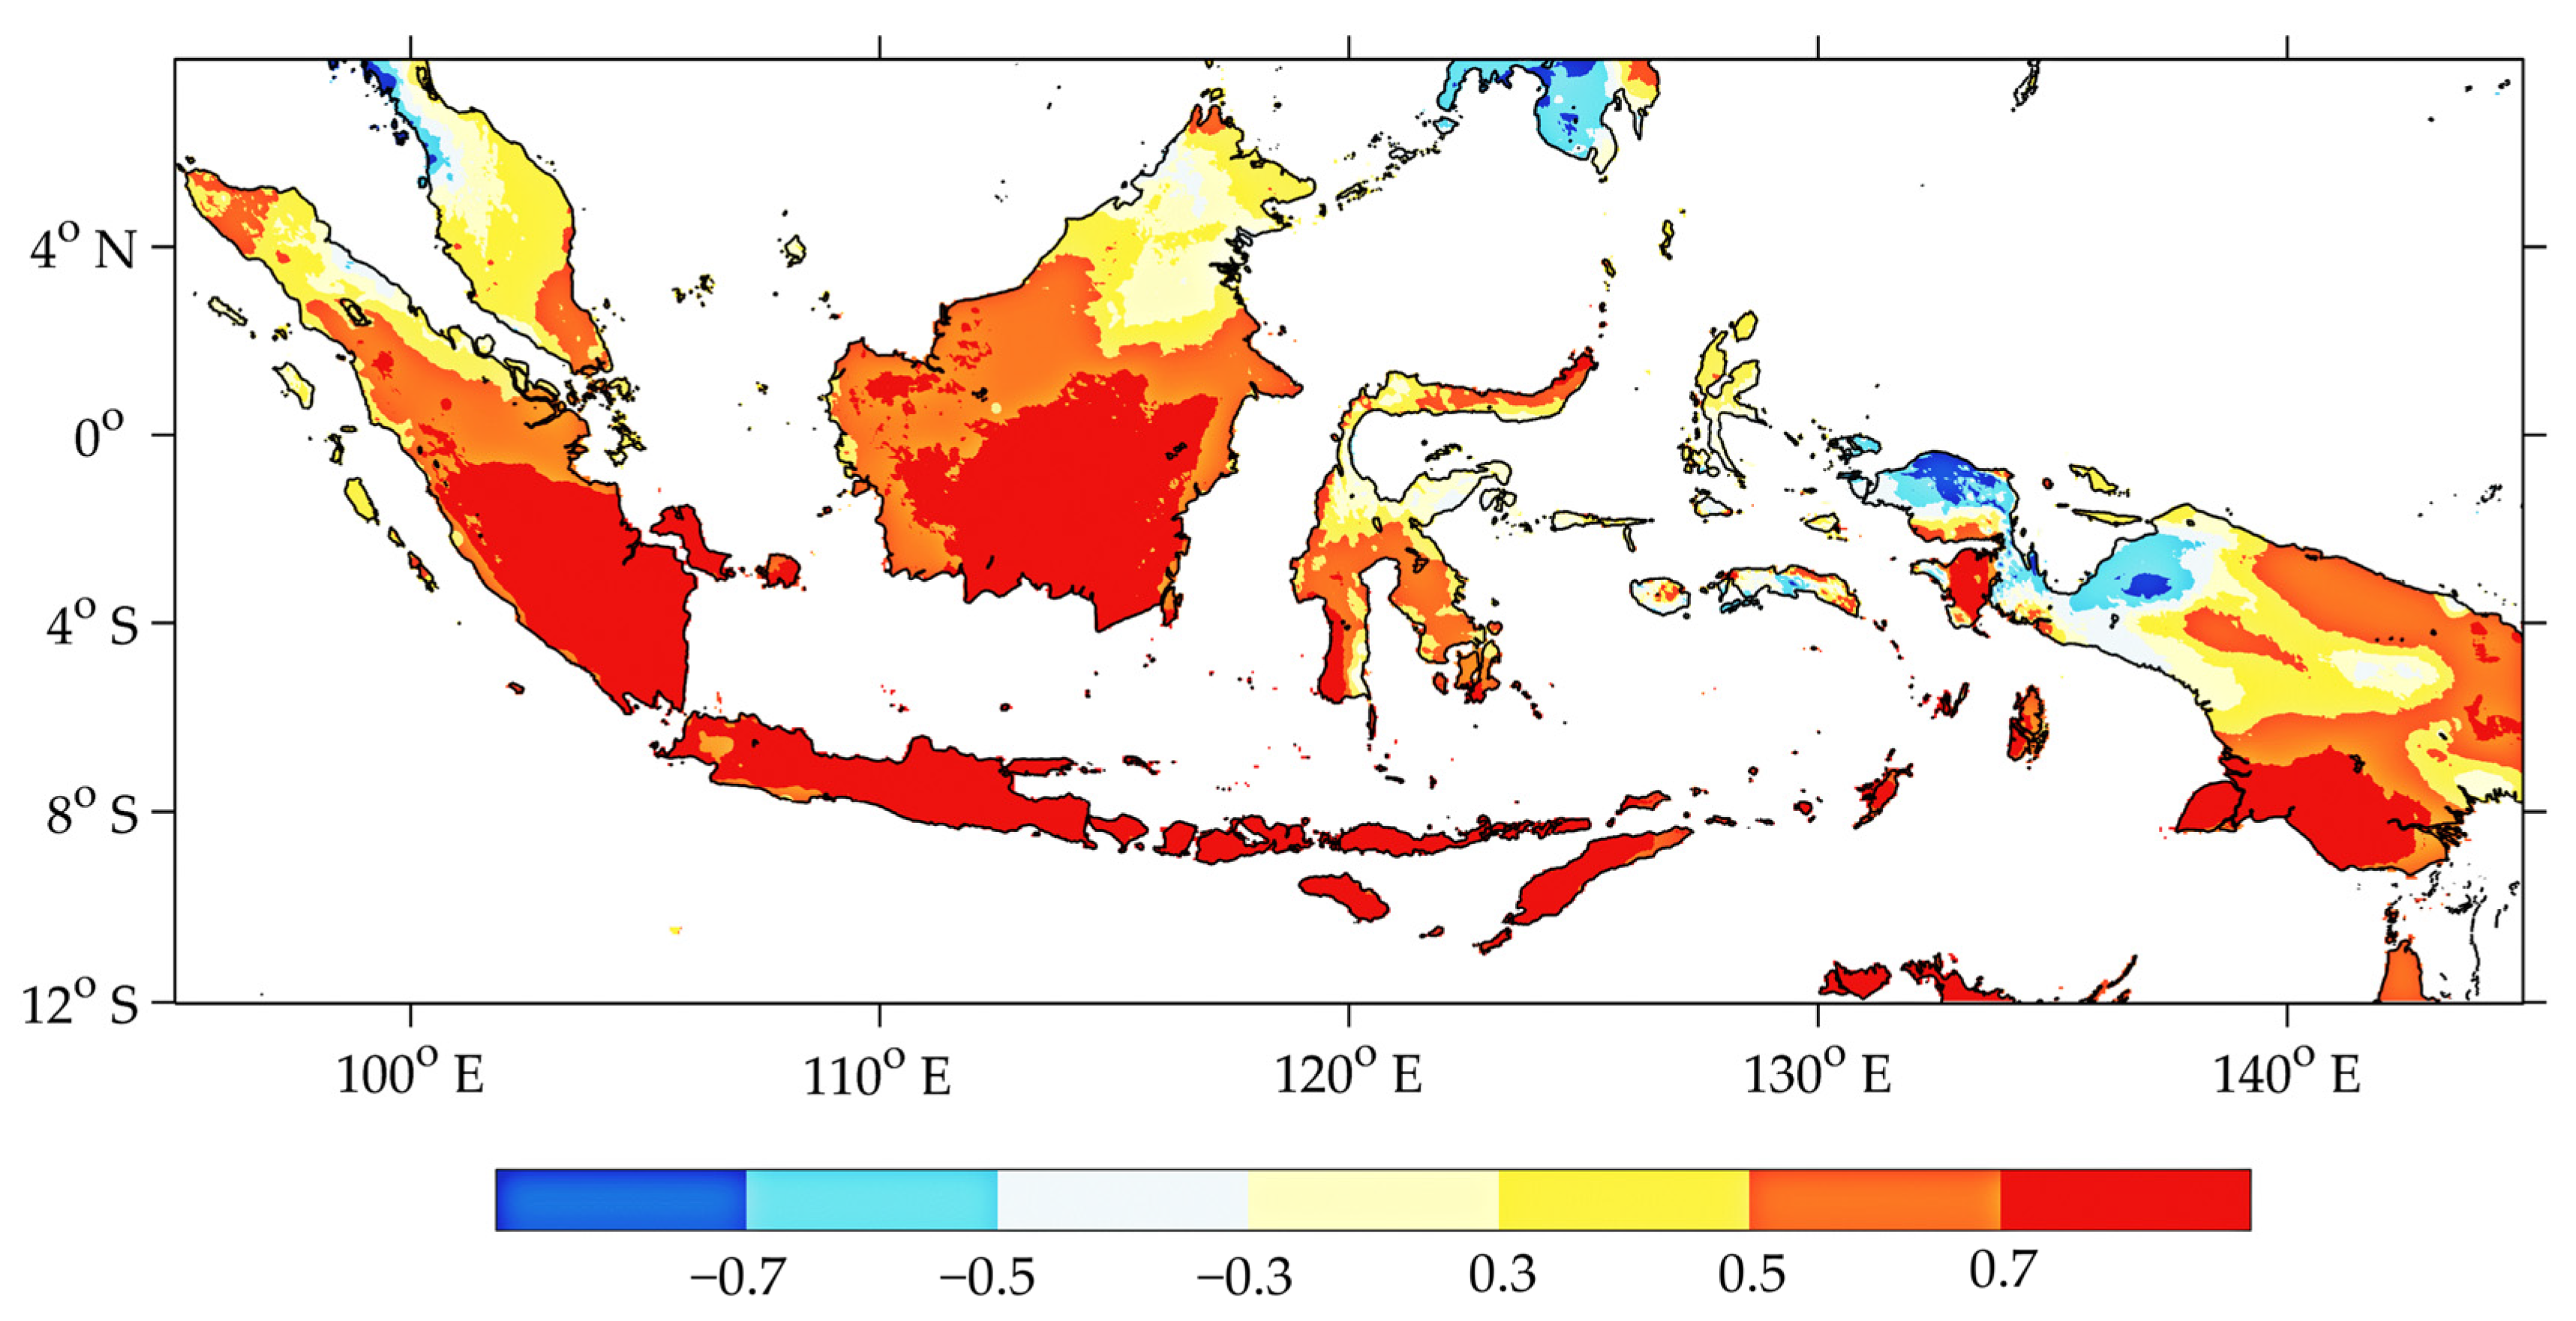
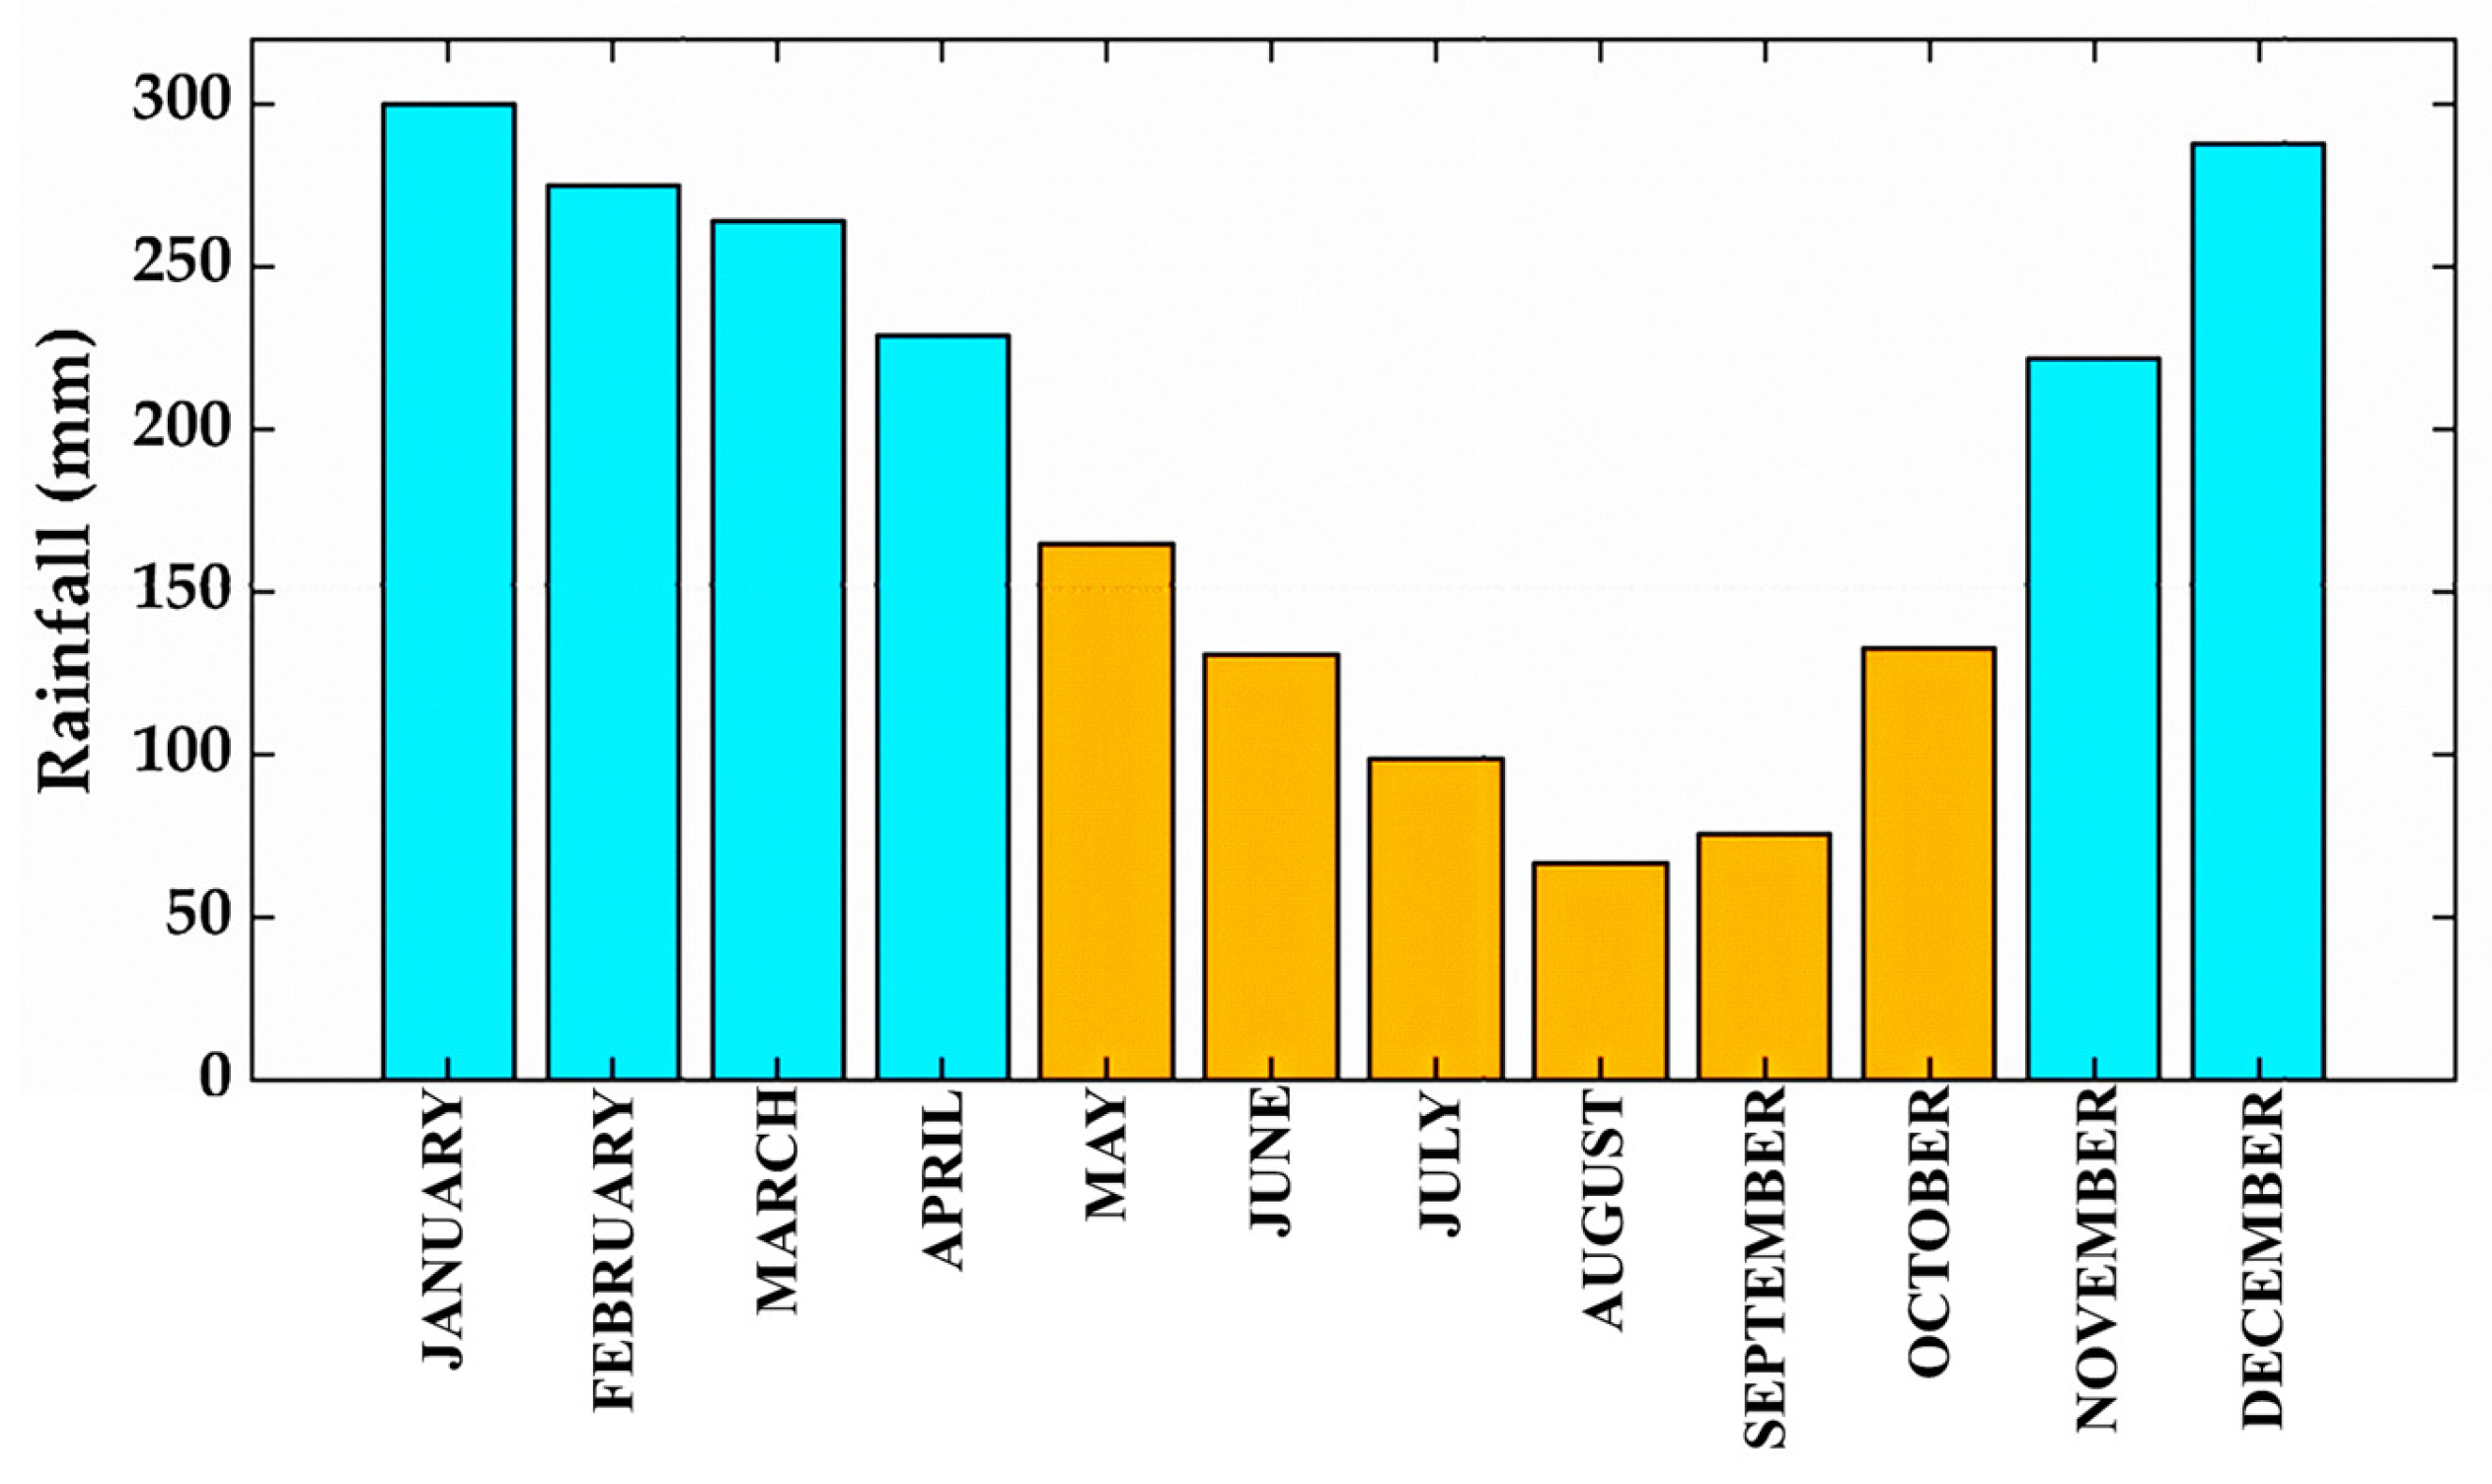
3.1. Detecting Indonesian Monsoon Signal

Table 1 displays the square covariance fractions (SCFs) of the initial ten modes derived from the single-field SVD analysis of Indonesian rainfall. These fractions are given as percentages relative to the total variance. Each mode consists of a spatial pattern, known as the principal component (PC), which represents the explained variance, and a temporal evolution of the PC pattern, known as the PC time series. The computations suggest the existence of multiple modes of rainfall variability within the Indonesian region.
The first PC accounts for 33% of the total Indonesian rainfall variance, which only explains less than half of the total variance, suggesting that Indonesian rainfall is highly variable, as many articles stated [12,13,23,41,42,43,44,45,46]. The first PC has the most robust signatures in southern Indonesia, shown by the higher spatial loadings on the grids, where it has almost three times more variance than any other mode (Figure 1). There is a clear distinction between grids in the southern part and in the northern part of Indonesia as the grids in the northern part of Indonesia display relatively weak loadings. The observed geographical pattern of the PC shows a well-known monsoon pattern, which resembles the extensively recorded Asian winter monsoon pattern. Therefore, it elucidates the presence of the Indonesian monsoon while refuting Xue et al.’s [14] claim.
To confirm the adequacy of the revelation of the Indonesian monsoon signal, the fast Fourier transform (FFT) method is applied to analyze the frequency of the PC time series. Analysis of the temporal pattern of Indonesian rainfall based on the PC1 mode is presented in Figure 2. The power spectrum of the associated PC1 for rainfall anomalies shows a prominent spectral peak for a one-year frequency range of the FFT power spectrum of the time series, which means there are six months in the dry phase and another six months in the wet phase (see Figure 3). Such periodicities are characteristic of a monsoon pattern [12,25,45,46,47,48,49,50,51]. Again, these results also confirm the existence of the Indonesian monsoon. The remaining PCs explain non-annual patterns based on FFT analysis of the periodicities of each PC time series generated by SVD analysis, whereas this study aims at only the annual patterns as the primary focus. In addition, the proportion of the SCFs explained by the remaining PCs is relatively small (~15%). Thus, only the PC that shows the annual pattern will be analyzed.

3.2. Phase of Indonesian Monsoon

Figure 3 shows the long-term monthly means of the first PC time series. The long-term monthly mean distribution was derived by calculating the average rainfall across multiple years. The analysis demonstrates that the annual progression of monsoon rainfall in Indonesia is distinguished by alternating wet and dry seasons. Thus, we define May–October as the dry season and November–April as the wet season according to the monthly evolution of rainfall over Indonesia, which is consistent with the previous literature that indicated the same periods of dry and wet seasons calculated using the double correlation method [12]. It also found that the wet season accounts for more than 77% of the total annual precipitation in Indonesian monsoon regimes, as indicated by the annual rainfall distribution of Indonesian monsoon regimes in Figure 4.

3.3. Indonesian Monsoon Regimes

This section examines the role of the SVD in establishing climate divisions by evaluating the characteristics of both the PC space and PC time series. The meridional dipole pattern of PC space in the SVD result forms a well-known Asian winter monsoon pattern. The annual periodicities of the annual mean of the PC time series can be understood as the annual monsoon cycle. A region of grid cells with similar characteristics is most likely to respond distinctively and homogeneously to a climate phenomenon. Thus, the delineation of monsoon regimes refers to such a characteristic. Grids above a certain threshold value are selected to belong to a region. The threshold value should be the highest correlation value which produces no overlapping boundaries. In this paper, the threshold value chosen is 0.55, which statistically has a greater than 99% significance level in our rainfall dataset from the homogenous map.
Furthermore, according to [52] the monsoon climate consists of a rainy summer and a dry winter. They contend that precipitation is the most fundamental variable in determining a monsoon climate and the most influential variable in human existence. Subsequently, they put forward two specific criteria to delineate the monsoon climate: (a) a summer-minus-winter precipitation differential exceeding 300 mm and (b) a proportional summer precipitation threshold exceeding 55% of the annual total [52]. The first criterion differentiates a monsoon climate from semi-arid and Mediterranean (trade wind) climates, while the second threshold ensures a distinct summer rainy season and differentiates a monsoon climate from a continuous rain pattern. This concise classification aligns well with the monsoon regions that have been previously delineated using more complex and numerous criteria. Thus, it can be stated that Indonesia’s region fulfills the necessary criteria to be classified as a monsoon regime. The first requirement is depicted in Figure 4, whilst the second criterion is satisfied by going beyond a proportional threshold of summer precipitation of Indonesian monsoon that exceeds 77% of the total annual precipitation.
The result of monsoon regime delineation from the SVD is shown in Figure 5. The Indonesian monsoon regime covers south and central Indonesia from south Sumatera to Timor Island, parts of Kalimantan, parts of Sulawesi, and parts of Papua. The distribution of apparent regions in PC1 resembles that of the monsoon region defined by Aldrian and Susanto [12] using the double correlation method (DCM). However, we observe minor northward shifts in the monsoon regime around Sumatra and Kalimantan. Therefore, this result provides an update on Indonesian monsoon regime delineation using a new dataset.

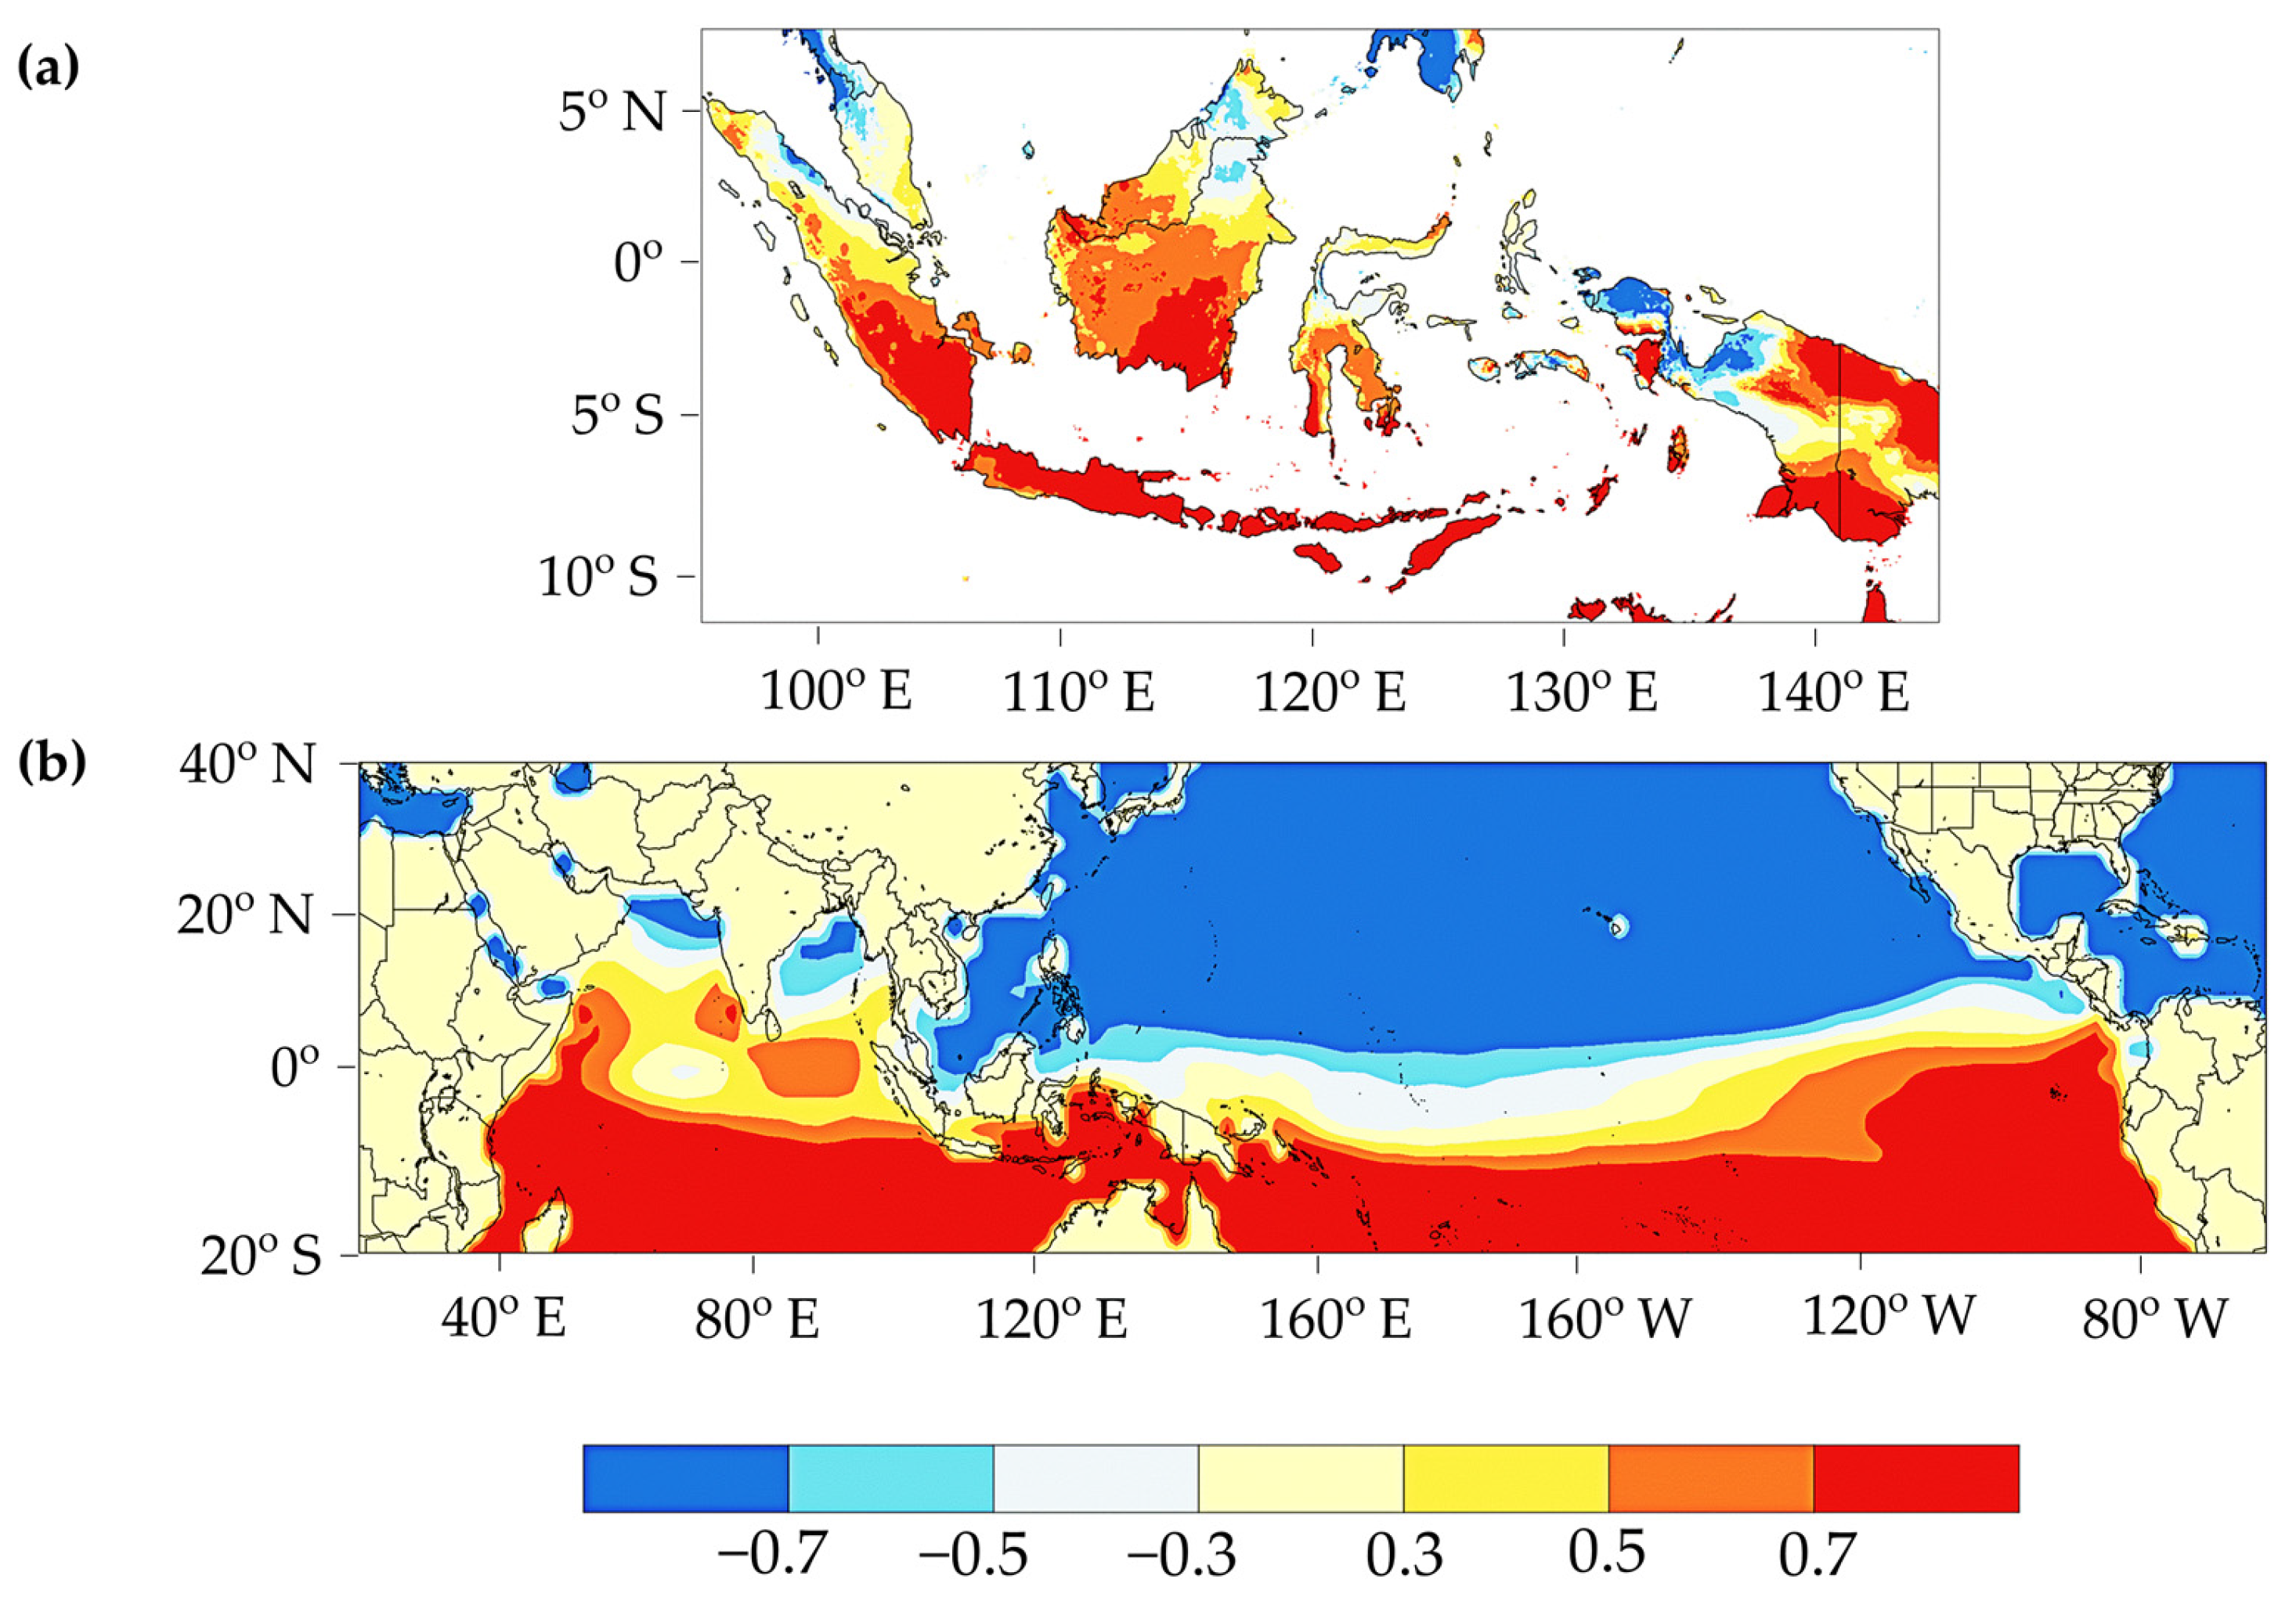
3.4. Related Features of Indonesian Monsoon Analysis

To further understand the main features of Indonesian monsoon, we apply covariability analysis on rainfall and a related atmospheric dynamic variable (e.g., remote and local SST and wind field) using coupled-field SVD. Table 2 provides the square covariance fractions (SCFs) explained by each PC and the correlation coefficients (r) between the PC time series of rainfall and the PC time series of SST as an indicator of the strength of the coupling. There exist significant coupled modes of variability between Indonesian monsoon rainfall and SST. The three leading PCs account for more than 83% and show a strong and highly significant coupling indicated by the coefficient correlation value. The first mode of covariability accounts for 70.4% of the SCF, meaning there is good covariability between Indonesian rainfall and SST. The first PC time series for rainfall and SST also correlate very well (r = 0.86), indicating the strongly coupled nature of the phenomenon. The second and third PC, which account for 7.9% and 5% of the SCF, respectively, are also significant. Their coefficient correlations are 0.78 and 0.68, respectively. The remaining PCs account for an insignificant portion of the SCF. Further, the SVD analysis on the two combined fields identify only the mode of behavior in which the Indonesian monsoon rainfall and SST variation are the most strongly coupled (the first PC), likewise showing monsoon patterns spatially and temporally as the main purpose of the study.
Figure 6 displays the homogeneous map of the first PC that is linked to the variability of Indonesian monsoon rainfall and its corresponding sea surface temperature (SST). The spatial pattern of the first dominant mode is characterized by a strong positive loading of SST in the local Indonesian waters, which can be denoted as an interchange of north–south dipole structures (Figure 6b). This variability is accompanied by a dipole pattern of rainfall showing a negative (positive) variation over the northern (southern) parts of Indonesia (Figure 6a). This implies that a positive phase of local SST enhances rainfall over southern Indonesia, especially where the correlation coefficients are significant. The regional distribution of SST and rainfall again exhibits the characteristic pattern of the Asian winter monsoon during the peak of the boreal winter.
Figure 6b shows that the largest annual SST cycle occurs in the Java Sea, South Java Sea, Timor Sea, Arafura Sea, Flores Sea, and Banda Sea, where the pattern shows the concentration of higher loadings compared to the surroundings (see Figure 5 for the location mentioned). This result is in agreement with the previous study [12] that pointed out the relationships between local SST of South Maluku or the Timor Sea (15–5° S, 120–135° E) and the rainfall in region A (monsoon region). However, the authors of [12] only established the correlation between Indonesian rainfall at a local and regional level, making it impossible to compare it globally and determine the major influence of SST on Indonesian rainfall. By utilizing global SST data in our coupled-field SVD analysis, we can infer that the Indonesian monsoon rainfall is more influenced by local SST compared to SST basins in other regions across the world. This finding is supported by the authors of [18,23,25,45]. They revealed that Indonesian monsoon rainfall shows no relationship with equatorial SSTs over the Indo-Pacific. Instead, they highlighted the local SST’s important role in monsoon rainfall over Indonesia. Indeed, the inclusion of the El Niño–Southern Oscillation (ENSO) index and dipole mode index (DMI) did not provide any added value in the statistical postprocessing of ECMWF Seasonal Forecast System 5 (SEAS5) for the prediction of seasonal monsoon rainfall in Java, Indonesia [53]. It is suggested that the influence of sea surface temperatures (SSTs) in the Pacific Ocean and Indian Ocean on Indonesian monsoon rainfall is not as profound as previously reported. This result answers the speculation regarding the primary force of Indonesian monsoon rainfall variations, whether modulated by ENSO or local SST [12,25,46,47]. The regulation of the Indonesian monsoon is contingent upon the wind-driven transport of heat across the ocean, which modifies the SST gradient across the Equator. Consequently, the SST experiences an increase in the winter hemisphere and decreases in the summer hemisphere. The cross-equatorial pressure gradient is generated by the SST gradient, which also regulates the convergence of moisture approaching the regions of precipitation and the intensity of monsoon winds. In conjunction with the local effect, the overall processes govern the magnitude of the annual monsoon cycle.
The dominant coupled mode shows an annual cycle tendency with a preferred periodicity of one year (Figure 7). This is a strong indication that both the Indonesian rainfall and SST variability are clearly dominantly modulated by monsoon activities, agreeing well with previous reports [12] that explained that the Asian winter monsoon has a dominant influence on Indonesian SST variation. From June–August (December–February), when the southeast (northwest) monsoon prevails, a broad area south of 5° S cools (warms).
Further analysis was conducted to detect the primary dynamic driving force for the dominant mode. Thus, we made correlation maps of SST with reference to each principal component (PC) along with the regressed 850 hPa winds. This level of wind was chosen because the air circulation lows are free from surface perturbation at this level [54]. Figure 8 shows the heterogenous correlation vectors maps between PC1 time series of coupled-field SVD of Indonesian monsoon rainfall and 850 hPa winds.
The most dominant feature is that the variability of Indonesian rainfall due to the strengthening of the westerly wind with establishment of high-latitude circulation systems such as the Siberian high and reversal of the cross-equatorial flow. Therefore, the circulation feature can be described as a strengthening and weakening of subtropical anticyclones and the intertwined westerly wind in the Indian Ocean, accompanied by fluctuation in a north–south dipole structure in the ocean temperature (see Figure 6: lower panel). This SST dipole defines the partition of the dry and rainy season regimes.
Solar insolation drives a global monsoon (GM), and surface features like land–ocean distribution, topography, and oceanic circulations determine regional monsoon systems [17]. Thus, the monsoon exhibits strong regional characteristics [1,17,18]. In the same way, the Indonesian monsoon is distinct as a subsystem monsoon of the Asian–Australian monsoon. The distinction is represented in the phase of monsoon departure and the amplitude of rainfall that differ from other monsoon systems (e.g., Australian monsoon, as indicated by the authors of [15,16]). The uniqueness of monsoons in Indonesia is due to the modification of all the Indonesian monsoon features indicated earlier by local characteristics. For instance, the complex distribution of land, sea, and terrain causes asymmetric seasonal march and low-level divergence, where the maximum convection gradually shifts in a southeastward direction as it transitions from the Asian summer monsoon to the Asian winter monsoon. However, this shift undergoes an abrupt reversal [47]. Moreover, the Indonesian throughflow (ITF) affects Pacific Ocean and Indian Ocean heat and freshwater budgets and air–sea heat fluxes, possibly affecting the Asian–Australian monsoon climate phenomenon [55]. Warm water ITF on the surface caused the sea level to drop and the steric height difference between the western Pacific and eastern Indian Oceans to rise. As a result, the southeast monsoon is stronger [56].

4. Conclusions

This study examines the existence of the Indonesian monsoon signal. Applying single-field SVD makes the monsoon pattern appear in spatial and temporal patterns. The computations suggest the presence of multiple modes of rainfall variability in the Indonesian region. The first PC accounts for 33% of the total Indonesian rainfall variance, which only explains less than half of the total variance, suggesting that Indonesian rainfall is highly variable. Further, we defined the Indonesian monsoon area as comprising regions with (1) monsoonal patterns of rainfall both in space and time and (2) the loading variance, as seen in the SVD result, having a high value of correlation (>0.55). The Indonesian monsoon can be characterized with two distinct seasons. The dry season spans from May to October and is characterized by prevailing winds from the east and minimal precipitation. The wet season spans from November to April and accounts for more than 77% of the total annual precipitation in Indonesian monsoon regimes. As mentioned earlier, the outcome provided further elucidation on the scientific discourse questioning the existence of the Indonesian monsoon.
The behavior of the Indonesian monsoon rainfall variability is examined concerning remote and local SST. The SVD of coupled fields that can objectively identify a pair of patterns with a maximum temporal covariance provides estimates of the amplitudes of the Indonesian monsoon rainfall response to the SST forcing. The first PC that dominates the covariability reveals the covariability between the coupled mode associated with the relationship between Indonesian monsoon rainfall and local SST. This covariability suggests that the increase in local SST causes an increase in rainfall. The circulation feature can be described as a strengthening and weakening of subtropical anticyclones, accompanied by fluctuation in a north–south dipole structure in the ocean temperature. This SST dipole defines the partition of the dry and rainy season regimes.
Figure 9 schematically shows the major features of the warm season circulation over Indonesia. The Indonesian monsoon is characterized by a region of intense precipitation in the southern part of the region including southern part of Sumatera and Kalimantan, Sulawesi, Papua, and all of Java. The regulation of Indonesian monsoon includes: the impact of the wind-driven ocean heat transport homogenizes the SST gradient across the Equator, lowering it in the summer hemisphere and warming it in the winter hemisphere. The SST gradient will produce the cross-equatorial pressure gradient and modulate the intensity of the monsoon winds as well as the convergence of moisture approaching the precipitating regions. The overall processes, along with the local effect, regulate the amplitude of the monsoon’s annual cycle.
It is becoming increasingly clear that Indonesian monsoon rainfall variability is related to the SST response to the atmospheric circulation variation forced by the warming of local Indonesian SST. Thus, the Indonesian region’s SST and atmospheric dynamic are of major importance to the atmospheric state over the area itself, and convection, which depends on the SST, is the dominant atmospheric process. We have provided a general description of the covariability of Indonesian monsoon rainfall and atmosphere and ocean. As the rainfall variability in the region has a great impact on local agriculture, we hope such a description will be useful for climate predictability.

Author Contributions

Conceptualization, A.M., A.S., R.H., A.F. and Y.K.; methodology, A.M., A.S. and R.H.; software, A.M.; validation, A.M. and A.S.; formal analysis, A.M. and A.S.; investigation, A.M. and A.S.; data curation, A.M.; writing—original draft preparation, A.M.; writing—review and editing, A.S., R.H., A.F. and Y.K.; supervision, A.S., R.H., A.F. and Y.K. All authors have read and agreed to the published version of the manuscript.

Funding

This study was partially funded by the Pusat Pendidikan dan Pelatihan Badan Meteorologi Klimatologi dan Geofisika (Pusdiklat BMKG) (grant numbers KEP.28/KRU/VII/2019).

Institutional Review Board Statement

Not applicable.

Informed Consent Statement

Not applicable.

Data Availability Statement

Publicly available datasets were analyzed in this study. Rainfall data can be found here: https://data.chc.ucsb.edu/products/CHIRPS-2.0/ accessed on 1 January 2023. SST data can be found here: https://psl.noaa.gov/data/gridded/tables/sst.html accessed on 1 January 2023. Wind field data can be found here: https://psl.noaa.gov/data/gridded/data.ncep.reanalysis2.html accessed on 1 January 2023.

Acknowledgments

The first author thanks Pusat Pendidikan dan Pelatihan Badan Meteorologi Klimatologi dan Geofisika (Pusdiklat BMKG) for providing a scholarship for his PhD program.

Conflicts of Interest

The authors declare no conflicts of interest. The funders had no role in the design of the study; in the collection, analyses, or interpretation of data; in the writing of the manuscript; or in the decision to publish the results.

References

  1. Webster, P.; Fasullo, J. Tropical Meteorology and Climate: Monsoon: Dynamical Theory. In Encyclopedia of Atmospheric Sciences, 2nd ed.; Elsevier: Amsterdam, The Netherlands, 2014; pp. 151–164. [Google Scholar]
  2. Kirono, D.G.C.; Butler, J.R.A.; McGregor, J.L.; Ripaldi, A.; Katzfey, J.; Nguyen, K. Historical and Future Seasonal Rainfall Variability in Nusa Tenggara Barat Province, Indonesia: Implications for the Agriculture and Water Sectors. Clim. Risk Manag. 2016, 12, 45–58. [Google Scholar] [CrossRef]
  3. Naylor, R.L.; Battisti, D.S.; Vimont, D.J.; Falcon, W.P.; Burke, M.B. Assessing Risks of Climate Variability and Climate Change for Indonesian Rice Agriculture. Proc. Natl. Acad. Sci. USA 2007, 104, 7752–7757. [Google Scholar] [CrossRef]
  4. Dhishana, R.; Dubey, S.K. Characteristics of Spectral Energetics during Excess and Deficient Rainfall Years in India, Copernicus Meetings. In Proceedings of the EGU23, the 25th EGU General Assembly, Vienna, Austria, 23–28 April 2023. [Google Scholar]
  5. Kurniadi, A.; Weller, E.; Min, S.K.; Seong, M.G. Independent ENSO and IOD Impacts on Rainfall Extremes over Indonesia. Int. J. Climatol. 2021, 41, 3640–3656. [Google Scholar] [CrossRef]
  6. Wati, T.; Hadi, T.W.; Sopaheluwakan, A.; Hutasoit, L.M. The Study of Wind Field ERA-20C in Monsoon Domains for Rainfall Predictor in Indonesia (Java, Sumatra, and Borneo). Agromet 2023, 37, 34–43. [Google Scholar] [CrossRef]
  7. Schollaen, K.; Karamperidou, C.; Krusic, P.; Cook, E.; Helle, G. ENSO Flavors in a Tree-Ring δ18O Record of Tectona Grandis from Indonesia. Clim. Past 2015, 11, 1325–1333. [Google Scholar] [CrossRef]
  8. Supari; Tangang, F.; Juneng, L.; Cruz, F.; Chung, J.X.; Ngai, S.T.; Salimun, E.; Mohd, M.S.F.; Santisirisomboon, J.; Singhruck, P.; et al. Multi-Model Projections of Precipitation Extremes in Southeast Asia Based on CORDEX-Southeast Asia Simulations. Environ. Res. 2020, 184, 109350. [Google Scholar] [CrossRef]
  9. Supari; Tangang, F.; Juneng, L.; Aldrian, E. Observed Changes in Extreme Temperature and Precipitation over Indonesia. Int. J. Climatol. 2017, 37, 1979–1997. [Google Scholar] [CrossRef]
  10. Tangang, F.; Chung, J.X.; Juneng, L.; Supari; Salimun, E.; Ngai, S.T.; Jamaluddin, A.F.; Mohd, M.S.F.; Cruz, F.; Narisma, G.; et al. Projected Future Changes in Rainfall in Southeast Asia Based on CORDEX–SEA Multi-Model Simulations. Clim. Dyn. 2020, 55, 1247–1267. [Google Scholar] [CrossRef]
  11. Kurniadi, A.; Weller, E.; Kim, Y.-H.; Min, S.-K. Evaluation of Coupled Model Intercomparison Project Phase 6 Model-Simulated Extreme Precipitation over Indonesia. Int. J. Climatol. 2023, 43, 174–196. [Google Scholar] [CrossRef]
  12. Aldrian, E.; Dwi Susanto, R. Identification of Three Dominant Rainfall Regions within Indonesia and Their Relationship to Sea Surface Temperature. Int. J. Climatol. 2003, 23, 1435–1452. [Google Scholar] [CrossRef]
  13. Eguchi, T. Rainfall Distribution and Air Streams over Indonesia. Geogr. Rev. Jpn. 1983, 56, 151–170. [Google Scholar] [CrossRef]
  14. Xu, Z.; Fu, C.; Qian, Y. A New Index to Describe the Tropical Asian Summer Monsoon. Sci. China Ser. D Earth Sci. 2009, 52, 843–854. [Google Scholar] [CrossRef]
  15. Kajikawa, Y.; Wang, B.; Yang, J. A Multi-Time Scale Australian Monsoon Index. Int. J. Climatol. 2010, 30, 1114–1120. [Google Scholar] [CrossRef]
  16. Mulsandi, A.; Sopaheluwakan, A.; Faqih, A.; Hidayat, R.; Koesmaryono, Y. Evaluation of WNPMI and AUSMI Monsoon Index Performance Over Indonesian Region. J. Sains Teknol. Modif. Cuaca 2021, 22, 61–70. [Google Scholar] [CrossRef]
  17. Wang, P.X.; Wang, B.; Cheng, H.; Fasullo, J.; Guo, Z.; Kiefer, T.; Liu, Z. The Global Monsoon across Time Scales: Mechanisms and Outstanding Issues. Earth-Sci. Rev. 2017, 174, 84–121. [Google Scholar] [CrossRef]
  18. Xu, Q.; Guan, Z.; Jin, D.; Hu, D. Regional Characteristics of Interannual Variability of Summer Rainfall in the Maritime Continent and Their Related Anomalous Circulation Patterns. J. Clim. 2019, 32, 4179–4192. [Google Scholar] [CrossRef]
  19. Vera, C.; Higgins, W.; Amador, J.; Ambrizzi, T.; Garreaud, R.; Gochis, D.; Gutzler, D.; Lettenmaier, D.; Marengo, J.; Mechoso, C.R.; et al. Toward a Unified View of the American Monsoon Systems. J. Clim. 2006, 19, 4977–5000. [Google Scholar] [CrossRef]
  20. Kim, K.-Y.; Kullgren, K.; Lim, G.-H.; Boo, K.-O.; Kim, B.-M. Physical Mechanisms of the Australian Summer Monsoon: 2. Variability of Strength and Onset and Termination Times. J. Geophys. Res. Atmos. 2006, 111, 1–17. [Google Scholar] [CrossRef]
  21. Ramage, C.S. Monsoon Meteorology; Experimental Botany V. 10; Academic Press: Honolulu, HI, USA, 1971; ISBN 978-0-12-576650-0. [Google Scholar]
  22. Alapaty, K.; Raman, S.; Mohanty, U.C.; Madala, R.V. Sensitivity of Monsoon Circulations to Changes in Sea Surface Temperatures. Atmos. Environ. 1995, 29, 2139–2156. [Google Scholar] [CrossRef]
  23. Hamada, J.I.; Yamanaka, M.D.; Matsumoto, J.; Fukao, S.; Winarso, P.A.; Sribimawati, T. Spatial and Temporal Variations of the Rainy Season over Indonesia and Their Link to ENSO. J. Meteorol. Soc. Jpn. Ser. II 2002, 80, 285–310. [Google Scholar] [CrossRef]
  24. Haylock, M.; McBride, J. Spatial Coherence and Predictability of Indonesian Wet Season Rainfall. J. Clim. 2001, 14, 3882–3887. [Google Scholar] [CrossRef]
  25. Hendon, H.H. Indonesian Rainfall Variability: Impacts of ENSO and Local Air–Sea Interaction. J. Clim. 2003, 16, 1775–1790. [Google Scholar] [CrossRef]
  26. Setiawan, A.M.; Lee, W.-S.; Rhee, J. Spatio-Temporal Characteristics of Indonesian Drought Related to El Niño Events and Its Predictability Using the Multi-Model Ensemble. Int. J. Climatol. 2017, 37, 4700–4719. [Google Scholar] [CrossRef]
  27. Amirudin, A.A.; Salimun, E.; Tangang, F.; Juneng, L.; Zuhairi, M. Differential Influences of Teleconnections from the Indian and Pacific Oceans on Rainfall Variability in Southeast Asia. Atmosphere 2020, 11, 886. [Google Scholar] [CrossRef]
  28. Lestari, D.O.; Sutriyono, E.; Sabaruddin, S.; Iskandar, I. Respective Influences of Indian Ocean Dipole and El Niño-Southern Oscillation on Indonesian Precipitation. J. Math. Fundam. Sci. 2018, 50, 257–272. [Google Scholar] [CrossRef]
  29. Nur’utami, M.N.; Hidayat, R. Influences of IOD and ENSO to Indonesian Rainfall Variability: Role of Atmosphere-Ocean Interaction in the Indo-Pacific Sector. Procedia Environ. Sci. 2016, 33, 196–203. [Google Scholar] [CrossRef]
  30. Bretherton, C.S.; Smith, C.; Wallace, J.M. An Intercomparison of Methods for Finding Coupled Patterns in Climate Data. J. Clim. 1992, 5, 541–560. [Google Scholar] [CrossRef]
  31. Funk, C.; Peterson, P.; Landsfeld, M.; Pedreros, D.; Verdin, J.; Shukla, S.; Husak, G.; Rowland, J.; Harrison, L.; Hoell, A.; et al. The Climate Hazards Infrared Precipitation with Stations—A New Environmental Record for Monitoring Extremes. Sci. Data 2015, 2, 150066. [Google Scholar] [CrossRef]
  32. Firmansyah, A.J.; Nurjani, E.; Sekaranom, A.B. Effects of the El Niño-Southern Oscillation (ENSO) on Rainfall Anomalies in Central Java, Indonesia. Arab. J. Geosci. 2022, 15, 24. [Google Scholar] [CrossRef]
  33. Faisol, A.; Indarto, I.; Novita, E.; Budiyono, B. Assessment of Agricultural Drought Based on CHIRPS Data and SPI Method over West Papua–Indonesia. J. Water Land Dev. 2022, 52, 44–52. [Google Scholar] [CrossRef]
  34. Wiwoho, B.S.; Astuti, I.S.; Alfarizi, I.A.G.; Sucahyo, H.R. Validation of Three Daily Satellite Rainfall Products in a Humid Tropic Watershed, Brantas, Indonesia: Implications to Land Characteristics and Hydrological Modelling. Hydrology 2021, 8, 154. [Google Scholar] [CrossRef]
  35. Saragih, N.F.; Sitepu, S.; Simanungkalit, G.T.; Sinambela, M.; Rajagukguk, E.; Larosa, F.G.; Jaya, I.K. Validation of CHIRPS Estimation Rainfall Data Using Numerical Accuracy Test with Precitipation Observation Data. IOP Conf. Ser. Earth Environ. Sci. 2022, 1083, 012095. [Google Scholar] [CrossRef]
  36. Narulita, I.; Fajary, F.R.; Syahputra, M.R.; Kusratmoko, E.; Djuwansah, M.R. Spatio-Temporal Rainfall Variability of Equatorial Small Island: Case Study Bintan Island, Indonesia. Theor. Appl. Climatol. 2021, 144, 625–641. [Google Scholar] [CrossRef]
  37. Huang, B.; Liu, C.; Banzon, V.; Freeman, E.; Graham, G.; Hankins, B.; Smith, T.; Zhang, H.-M. Improvements of the Daily Optimum Interpolation Sea Surface Temperature (DOISST) Version 2.1. J. Clim. 2021, 34, 2923–2939. [Google Scholar] [CrossRef]
  38. Kanamitsu, M.; Ebisuzaki, W.; Woollen, J.; Yang, S.-K.; Hnilo, J.J.; Fiorino, M.; Potter, G.L. NCEP–DOE AMIP-II Reanalysis (R-2). Bull. Am. Meteorol. Soc. 2002, 83, 1631–1644. [Google Scholar] [CrossRef]
  39. Bjornsson, H.; Venegas, S.A. A Manual for EOF and SVD Analyses of Climate Data. CGCR Rep. 1997, 97, 112–134. Available online: https://www.geog.mcgill.ca/gec3/wp-content/uploads/2009/03/Report-no.-1997-1.pdf (accessed on 1 January 2023).
  40. Cochran, W.T.; Cooley, J.W.; Favin, D.L.; Helms, H.D.; Kaenel, R.A.; Lang, W.W.; Maling, G.C.; Nelson, D.E.; Rader, C.M.; Welch, P.D. What Is the Fast Fourier Transform? Proc. IEEE 1967, 55, 1664–1674. [Google Scholar] [CrossRef]
  41. Ferrett, S.; Yang, G.-Y.; Woolnough, S.J.; Methven, J.; Hodges, K.; Holloway, C.E. Linking Extreme Precipitation in Southeast Asia to Equatorial Waves. Q. J. R. Meteorol. Soc. 2020, 146, 665–684. [Google Scholar] [CrossRef]
  42. Latos, B.; Lefort, T.; Flatau, M.K.; Flatau, P.J.; Permana, D.S.; Baranowski, D.B.; Paski, J.A.I.; Makmur, E.; Sulystyo, E.; Peyrillé, P.; et al. Equatorial Waves Triggering Extreme Rainfall and Floods in Southwest Sulawesi, Indonesia. Mon. Weather Rev. 2021, 149, 1381–1401. [Google Scholar] [CrossRef]
  43. Robertson, A.W.; Moron, V.; Qian, J.-H.; Chang, C.-P.; Tangang, F.T.; Aldrian, E.; Koh, T.Y.; Liew, J. The Maritime Continent Monsoon. In The Global Monsoon System Research and Forecast; World Scientific Publication Company: New York, NY, USA, 2011; pp. 85–98. ISBN 978-981-4343-40-4. [Google Scholar]
  44. Xavier, P.; Lim, S.Y.; Ammar Bin Abdullah, M.F.; Bala, M.; Chenoli, S.N.; Handayani, A.S.; Marzin, C.; Permana, D.; Tangang, F.; Williams, K.D.; et al. Seasonal Dependence of Cold Surges and Their Interaction with the Madden–Julian Oscillation over Southeast Asia. J. Clim. 2020, 33, 2467–2482. [Google Scholar] [CrossRef]
  45. Zhang, T.; Yang, S.; Jiang, X.; Zhao, P. Seasonal–Interannual Variation and Prediction of Wet and Dry Season Rainfall over the Maritime Continent: Roles of ENSO and Monsoon Circulation. J. Clim. 2016, 29, 3675–3695. [Google Scholar] [CrossRef]
  46. Zhang, T.; Yang, S.; Jiang, X.; Huang, B. Roles of Remote and Local Forcings in the Variation and Prediction of Regional Maritime Continent Rainfall in Wet and Dry Seasons. J. Clim. 2016, 29, 8871–8879. [Google Scholar] [CrossRef]
  47. Chang, C.-P.; Harr, P.A.; McBride, J.L.; Hsu, H.H. Maritime Continent Monsoon: Annual Cycle and Boreal Winter. In East Asian Monsoon; World Scientific Series on Asia-Pacific Weather and Climate; World Scientific: New York, NY, USA, 2004; Volume 2, pp. 107–150. ISBN 978-981-238-769-1. [Google Scholar]
  48. Hung, C.; Liu, X.; Yanai, M. Symmetry and Asymmetry of the Asian and Australian Summer Monsoons. J. Clim. 2004, 17, 2413–2426. [Google Scholar] [CrossRef]
  49. Jo, S.; Ahn, J.-B. Improvement of CGCM Prediction for Wet Season Precipitation over Maritime Continent Using a Bias Correction Method. Int. J. Climatol. 2015, 35, 3721–3732. [Google Scholar] [CrossRef]
  50. McBride, J.L.; Haylock, M.R.; Nicholls, N. Relationships between the Maritime Continent Heat Source and the El Niño–Southern Oscillation Phenomenon. J. Clim. 2003, 16, 2905–2914. [Google Scholar] [CrossRef]
  51. Qian, W.; Deng, Y.; Zhu, Y.; Dong, W. Demarcating the Worldwide Monsoon. Theor. Appl. Climatol. 2002, 71, 1–16. [Google Scholar] [CrossRef]
  52. Wang, B.; Ding, Q. Changes in Global Monsoon Precipitation over the Past 56 Years. Geophys. Res. Lett. 2006, 33, L06711. [Google Scholar] [CrossRef]
  53. Ratri, D.N.; Whan, K.; Schmeits, M. Calibration of ECMWF Seasonal Ensemble Precipitation Reforecasts in Java (Indonesia) Using Bias-Corrected Precipitation and Climate Indices. Weather Forecast. 2021, 36, 1375–1386. [Google Scholar] [CrossRef]
  54. Li, S.; Robertson, A.W. Evaluation of Submonthly Precipitation Forecast Skill from Global Ensemble Prediction Systems. Mon. Weather Rev. 2015, 143, 2871–2889. [Google Scholar] [CrossRef]
  55. Gordon, A.L.; Susanto, R.D.; Vranes, K. Cool Indonesian Throughflow as a Consequence of Restricted Surface Layer Flow. Nature 2003, 425, 824–828. [Google Scholar] [CrossRef] [PubMed]
  56. Ding, X.; Bassinot, F.; Guichard, F.; Fang, N.Q. Indonesian Throughflow and Monsoon Activity Records in the Timor Sea since the Last Glacial Maximum. Mar. Micropaleontol. 2013, 101, 115–126. [Google Scholar] [CrossRef]
Figure 1. Spatial patterns of the first PC mode of Indonesian rainfall accounts for 33% of the total variance. Presented as homogeneous correlation map, with the color representing the correlation coefficient between the field’s time series of expansion coefficients and the same field at each grid point.
Atmosphere 15 00187 g001
Figure 2. Power spectrum of PC1 time series of single-field SVD analysis of Indonesian rainfall.
Atmosphere 15 00187 g002
Figure 3. The fan chart represents the time-varying distribution of data depicted as shaded bands around a central (mean) line of the long-term monthly mean of the first PC time series. Thick black lines denote the mean, while the red line represents the linear interpolation between the percentiles of each month.
Atmosphere 15 00187 g003
Figure 4. Long-term monthly means of the rainfall distribution of Indonesian monsoon regimes. The yellow (blue) bar denotes dry (wet) monsoon season.
Atmosphere 15 00187 g004
Figure 5. Indonesian monsoon regimes from PC1 of the SVD are represented by the areas with values of homogeneous correlation maps above 0.55 (shaded cyan). The blue contour lines depict the isolines of the correlation value of 0.55. The place names used in this paper are also available.
Atmosphere 15 00187 g005
Figure 6. The spatial patterns of the first SVD coupled mode of rainfall (a) and SST (b) are presented as homogeneous correlation maps, with the color representing the correlation coefficient between the field’s time series of expansion coefficients and the same field at each grid point. The first PC explains 70% of the total covariance, whereas between the PCs time series exhibit a correlation of 0.86 (correlations are significant at the 99% confidence level).
Atmosphere 15 00187 g006
Figure 7. The spectrum of the temporal amplitude of the first coupled mode (PC1).
Atmosphere 15 00187 g007
Figure 8. The heterogenous correlation vector maps between the PC time series of the first coupled mode of rainfall fields and the u and v component of 850 hPa wind. The orientation of the arrows indicates the direction of the wind, and their length is proportional to the magnitude of the correlation. Correlations are significant at the 99% confidence level.
Atmosphere 15 00187 g008
Figure 9. The December–January rainy season peak in the Indonesian area is a season of comparatively low pressure (L) and pronounced convergence (red dashed line) and cloudiness or rainfall (gray shading). H indicated a location of high pressure. The arrow represents the movement of the Asian winter monsoon over the Equator.
Atmosphere 15 00187 g009
Table 1. Percentage of singular values of the ten PCs of Indonesian rainfall variability single-field SVD analysis.
PCThe Square Covariance Fractions (SCFs)
IndividualCumulative
PC133.1%33.1%
PC212.9%46%
PC311.2%57.2%
PC44.7%61.9%
PC52.9%64.8%
PC62.6%67.4%
PC72.4%69.8%
PC81.8%71.6%
PC91.8%73.4%
PC101.4%74.8%
Table 2. Square covariance fraction (SCF) and coupling correlation coefficient between the PC time series of both variables, corresponding to the three leading SVD modes. Correlations are significant at the 99% confidence level.
PCSCFr
IndividualCumulative
PC170.4%70.4%0.86
PC27.9%78.3%0.78
PC35.0%83.3%0.63
Disclaimer/Publisher’s Note: The statements, opinions and data contained in all publications are solely those of the individual author(s) and contributor(s) and not of MDPI and/or the editor(s). MDPI and/or the editor(s) disclaim responsibility for any injury to people or property resulting from any ideas, methods, instructions or products referred to in the content.

