Article

Time Series Analysis of the Impact of Meteorological Conditions and Air Quality on the Number of Medical Visits for Hypertension in Haikou City, China

1
Climate Center of Hainan Province, Haikou 570203, China
2
South China Sea Meteorology and Disaster Mitigation Research Key Laboratory of Hainan Province, Haikou 570203, China
*
Authors to whom correspondence should be addressed.
Atmosphere 2024, 15(3), 370; https://doi.org/10.3390/atmos15030370
Submission received: 22 February 2024 / Revised: 10 March 2024 / Accepted: 15 March 2024 / Published: 18 March 2024
(This article belongs to the Section Biometeorology)

Abstract

:
Meteorological conditions and air quality are important environmental factors in the occurrence and development of cardiovascular diseases (CVDs) such as hypertension. The aim of this study was to take Haikou City, located on the tropical edge, as the research area and to analyze the exposure–response relationship and lag effect between its meteorological conditions, air quality, and the number of hypertensive patients. Using the data from the hypertension outpatient department of Hainan Provincial People’s Hospital from 2016 to 2018, together with meteorological data and air quality data, a distributed lag nonlinear model based on the nested generalized addition model of meteorological element base variables was established. The results showed that the impact of temperature on the risk of hypertension was mainly due to the cold effect, which was associated with high risk, with a lag of 1–10 days. When the temperature dropped to 10 °C, the cumulative effect on the risk of hypertension of relative risk (RR) reached its highest value on the day the low temperature occurred (RR was 2.30 and the 95% confidence interval was 1.723~3.061), passing the test with a significance level of 0.05. This result indicated that efforts should be made to strengthen the prevention of hypertension under low-temperature conditions and the prediction and early warning of disease risks. The impact of the air-quality effect (the environmental Air Quality Index was selected as an indicator) on the risk of hypertension was mainly characterized by a low air-quality effect, with a lag effect of 0–8 days. When the risk reached approximately 124, the RR was highest (RR was 1.63 and the 95% confidence interval was 1.104~2.408), passing the test with a significance level of 0.05. The research results can provide technical support for conducting medical meteorological forecasting, early warning, and services for hypertension. A joint work and research mechanism among multiple departments such as meteorology and medical health should be established to improve the level of medical and health care, optimize the allocation of social resources, and develop targeted prevention and control strategies to reduce the health and economic burden of hypertension.

1. Introduction

There are currently 290 million patients with cardiovascular diseases (CVDs) in China, and approximately 4 million people die from the disease every year, ranking it first in terms of mortality [1]. Hypertension is one of the most common CVDs. Under external and internal adverse stimulation, it caused dysfunction in the central nervous system, increased cardiac blood output and blood volume, and increased blood pressure [2]. Scholars in China and around the world have used techniques such as correlation analysis, time series methods, and case crossover methods to study the relationships among meteorological conditions, air quality, and the onset of hypertension. It has been shown that meteorological conditions and air quality are important factors that induce the occurrence and development of CVDs such as hypertension, and the impact on the disease is long-term and extensive [3,4,5,6,7,8,9,10,11,12,13]. The 24, 48, and 72 h cold waves all had effects on the hospital admissions for hypertension on single-lag 5 d, and the effects of the 24 and 48 h cold wave were stronger (OR = 1.218, 95% CI: 1.072–1.385) in Jinchang, Gansu Province [14]. A 10 µg/m3 increase in PM2.5 (lag 1 d) resulted in a 0.7% increase in the daily admission of patients with hypertension (95% CI: 0.1–1.3%), and a 10 µg/m3 increase of O3 (lag 3 d) also caused a 3.5% increase (95% CI: 0.1~4.1%) [15].The exposure response curve of the daily average temperature in Nanchang City in relation to the total population of cardiovascular and cerebrovascular mortality lagged by 21 days and was “V” shaped. And the risk of death from cardiovascular and cerebrovascular diseases is greatest in the short (0–5 d) lag period and with a high temperature (>30.0 °C) [16]. Each one-degree increase in temperature above the threshold of the temperature–health-effect curve (29~36 °C) was associated with an increase of 1.4–3.6% in lagged hospitalizations, due to cardiovascular diseases [17]. When the maximum temperature reached 36.7 °C and the lowest temperature reached 25.3 °C, the relative risk of CVD death increased significantly; during the course of the high temperature there were important environmental factors that increased the risk of CVD deaths, and the relative risks were 1.14 (95% CI: 1.11~1.17), 1.11 (95% CI: 1.08~1.15), and 1.06 (95% CI: 1.02~1.09), respectively [18]. Some studies have explored the mechanisms by which meteorological conditions and air quality affect the incidence of cardiovascular and cerebrovascular diseases and have found that when the temperature drops the level of adrenaline in the human body rises, and the surface blood vessels contract to reduce heat dissipation. At the same time, adrenaline accelerates the heart rhythm, increases cardiac output and leads to an increase in blood pressure [19]. PM2.5 deposited in the blood vessels can enter the bloodstream and cause damage to the cardiovascular and cerebrovascular systems [20]; O3 has strong oxidizing ability and is highly irritating and corrosive to biological mucosa [21], even leading to changes in hemodynamics, thereby inducing and exacerbating cardiovascular and cerebrovascular diseases [22]. Previous studies have shown that the main influencing factors and the degree of impact of these diseases vary in different regions and at different times. Moreover, most related research has been carried out in temperate regions at mid-to-high latitudes, and there is a lack of research on CVDs in tropical regions. Hainan Province is located at the northern edge of the tropics and has a tropical maritime monsoon climate. It is the only tropical island in China, but the effects of this unique climate on CVD in residents have yet to be studied, and as the population of Hainan Province grows and ages, the incidence of CVDs is also increasing. Moreover, in addition to local CVD cases, as the development of international tourist islands like Hainan Province and global free-trade ports accelerates, the large influx of holiday tourists and short-term residents has also intensified the pressure on local medical and health work. Therefore, it is necessary to carry out a time series analysis of meteorological conditions, air quality and the number of hypertension outpatient clinics using Haikou city as the research area. This includes constructing a distributed lag nonlinear model of a nested generalized additive model and analyzing the relationships between hypertension and meteorological factors and between the exposure response and air quality factors. The findings will enable the construction of a meteorological-risk-level index for the occurrence of hypertension and provide technical support for carrying out medical meteorological forecasts and services and hypertension prevention and treatment, reducing pressure on medical and health workers.

2. Materials and Methods

2.1. Data Sources

Disease data: Daily outpatient case information on hypertension was obtained from Hainan Provincial People’s Hospital, a tertiary hospital from September 2016 to April 2018. The data were screened according to the following criteria: (1) the place of residence was Haikou city; (2) the information was complete, and there were no clear missing data; and (3) patients who visited the hospital again within 1 week after the initial visit were excluded (visiting again may be mainly due to the disease itself).
Meteorological data: For the same period, the daily average temperature, maximum temperature, minimum temperature, relative humidity, precipitation, average wind speed, air pressure and other meteorological data of the Haikou National Weather Station were obtained from the Hainan Provincial Meteorological Information Center.
Air quality data: For the same period, Haikou city’s daily PM2.5, PM10, SO2, NO2, O3, CO, AQI and other air quality monitoring data were obtained from the China Environmental Monitoring Station and Ecological Environment Bulletin.
In order to identify key meteorological environmental factors, all relevant elements were collected as comprehensively as possible based on previous research.

2.2. Research Methods

2.2.1. Descriptive Analysis

Descriptive analysis methods, including the analysis of statistical indicators such as averages and standard deviations, were used to assess the prevalence characteristics of hypertension outpatient data, meteorological data, and air quality data in Haikou city. The correlations among each meteorological factor, air quality, and number of hypertension hospital visits was analyzed by Spearman rank correlation, and the Spearman correlation coefficient was used to express the degree of correlation between the variables. A positive correlation indicates that an increase in one feature’s value increases the value of the target variable, whereas a negative correlation means that an increase in one feature’s value reduces the value of the target variable. The closer the absolute value of the correlation coefficient is to 1, the stronger the correlation is. The correlation analysis is based on the p-value, and significance was tested at the test level a = 0.01 and a = 0.05 (2-tailed). The descriptive results are expressed as the mean values, standard deviations, and percentile values. The Spearman rank correlation should be performed to assess whether variables can be included as key variables in the model.

2.2.2. Generalized Additive Model

The generalized additive model can effectively handle complex nonlinear relationships between explanatory and effect variables [14]. This model has been widely used to investigate the acute damaging effects of meteorological factors or air pollution on population health events. It is important to consider that, for the total population of interest, the number of daily disease visits represent a low-probability event. The actual distribution of time series data is an approximately Poisson distribution [23,24], and the logarithmic function is usually used to analyze the connection function between the independent variable and the dependent variable. Therefore, it was assumed in the present study that the number of disease visits on day t approximately obeys the quasi-Poisson distribution, and its mean (or expected value) is recorded as μ t . Meteorological environmental factors such as temperature, air pressure, humidity, precipitation, air quality and disease incidence trends have an impact on μ t , and these correlations may be nonlinear [25]; therefore, a generalized additive model was used for fitting. The connection function used is the natural logarithm function, and its basic form is:
Y t ~ Poisson μ t
ln μ t = α + f 1 x 1 t + N S x 2 t , d f 2 + + N S x k t , d f k + N S t i m e , d f 1 + γ 1 D O W t + γ 2 h o l i d a y t
where Y t is the number of disease visits on day t and time is the time variable (1, 2,…, n). There is a certain autocorrelation in the daily number of disease visits, so it needs to be eliminated by using the spline function of the time variable, as N S t i m e is the natural cubic spline basis function of the time variable; x 1 t is the value on the tth day of a certain meteorological environment index to be studied x 2 t , , x k t  is the value on the tth day of other meteorological environment indicators except x 1 t ; df is a degree of freedom parameter that the best parameters are determined by modified Akaike information criteria, Q-AIC [26]; D O W t represents “day of the week”; and h o l i d a y t   represents “holidays” and appears as a dummy variable in the model.

2.2.3. Distributed Lag Nonlinear Model

Distributed lag nonlinear models (DLNMs) can simultaneously consider the lag effects of exposure factors such as meteorology and air quality [27,28] and the nonlinear relationship between exposure and response [29,30], so this technique has broad application prospects in epidemiology. Therefore, based on the basic model (1), the basis function is added, and the time dimension (0, 1…, L) is added to the independent variable to generate a sequence q t x t , , x t L to reflect the lag effect of the meteorological factor. Using the idea of a cross basis, the nonlinear relationships between environmental factors and the number of daily disease visits and the lag of the effect are simultaneously analyzed through the natural cubic spline two-dimensional function [31]. The basis function form is as follows:
f x 1 t ; η = i = 1 N S x 1 j = 1 N S l r t i · T c · j η i j = w t · T η
where r t i · is the lag vector at time t obtained by the transformation of basis function i; c · j is the conversion of the lag vector by basis function j; w t · is the natural cubic spline cross-basis function ( N S x 1 · N S l ) transformation of the independent variable; and η is the corresponding parameter matrix [31].

2.2.4. Relative Risk

The relative risk (RR) represents the ratio of the incidence of a group of patients with a certain disease when they are exposed to a certain condition to the incidence when they are not exposed to a certain disease [32]. An RR equal to 1, greater than 1 and less than 1 indicates that exposure has nothing to do with the occurrence of the event, that exposure increases the risk of the event, and that it reduces the risk of the event, respectively [33].
Taking the selection of temperature indicators as an example, during the research process, on the basis of correlation analysis, a sensitivity analysis was conducted by selecting daily minimum temperature, daily maximum temperature, and daily average temperature, respectively, to compare and best capture the effects of temperature on hypertension hospital visits. Based on this, it was decided that daily mean temperature was the ambient temperature metric of choice because it was a better predictor than daily minimum and maximum temperatures. Considering that the number of daily medical visits is a small probability event, to avoid possible over-discretization, an accurate method was adopted. The Poisson distribution (quasi-Poisson) is used for model fitting, and a DLNM model based on a nested GAM of basic meteorological variables is established. As part of the sensitivity analysis, we also varied the degree between 1 and 4, the df between 2 and 9, and maximum lag days of 1 to 50 d. Quasi-Akaike information criterion (QAIC) were conducted to evaluate the goodness of fit of the model. All statistical analyses were conducted using R software (version 4.1.2), mainly using the “pastecs” package for descriptive statistical analysis, the “cor ()” function for Spearman correlation analysis, and the “mgcv” and “dlnm” packages for nonlinear and hysteresis effect analysis and for determining the influencing factors. The statistical significance level of 0.05 was adopted for the analyses.

3. Results

3.1. Descriptive Statistical Analysis

A statistical analysis of meteorological factors, air quality, and the number of patients with hypertension in Haikou city from September 2016 to April 2018 revealed that Haikou city’s daily average air pressure, maximum pressure, minimum pressure, average temperature, maximum temperature, minimum temperature, water vapor pressure, relative humidity, precipitation, average wind speed, and temperature change range were the following: 1005 hPa, 1007.4 hPa, 1003.1 hPa, 23.9 °C, 27.2 °C, 21.6 °C, 24.7 hPa, 81.5%, 4.6 mm, 3.0 m/s, and 0.0, respectively. Additionally, the daily average AQI, PM2.5, PM10, SO2, NO2, CO, and O3 were 44 μg/m3, 21.5 μg/m3, 38.8 μg/m3, 6.2 μg/m3, 12.4 μg/m3, 0.6 μg/m3, and 75 μg/m3, respectively. A total of 32,254 people visited hypertension outpatient clinics, and the average daily number of people visiting these clinics was 53, with the number of adults (aged 15–64) being 30.75. The number of medical visits during holidays was obviously lower than that during working days, which shows that the number of hypertension visits was strongly affected by the holiday factor, which should be the focus of further research (Figure 1). The monthly average number of patients exhibited three peaks: in January, March, and December, the monthly averages were 1956, 1929, and 1724, respectively. The number of medical visits in February was lower than that in the previous two months; the main reason may be the impact of the Spring Festival holiday. The average number of visits in spring (from March to May), summer (from June to August), autumn (from September to November), and winter (from December to January of the following year) was 5139.5, 4658, 4194.5, and 5243.5, respectively, accounting for 26.7%, 24.2%, 21.8% and 27.3% of the total number of visits for hypertension. It could be seen that winter and spring are the peak seasons for hypertension visits.
The Spearman correlation coefficient table (Table 1) showing data among the number of hospital visits, meteorological parameters, and air quality indicators shows that the number of daily visits for hypertension had an significant positive correlation with the average air pressure, maximum air pressure, and minimum air pressure, and had an extremely significant negative correlation with the average temperature, maximum air temperature, minimum air temperature, and water pressure. The AQI, PM2.5 and PM10 were significantly negatively correlated. There was a significant positive correlation with the NO2 and CO, but the other indicators had no statistical significance. These results may indicate that, under high pressure, controlled weather conditions (Hainan Island has the highest winter pressure, followed by spring and autumn, and the lowest in summer) and low-temperature weather conditions, the risk of hypertension increased, which was consistent with the results of the high incidence of hypertension in winter and spring according to the above statistics. Meanwhile, PM2.5 and PM10, which characterized the concentration of particulate matter in the air, and AQI calculated based on the concentration of different pollutants in the air, could indicate the impact of environmental air quality on the incidence of hypertension.

3.2. The Impact of Meteorological Conditions and Air Quality on the Number of Medical Visits for Hypertension

Based on the above analysis results, temperature and air-quality indicators significantly correlated with the number of hypertensive patients who were selected as the main variables to analyze their impact on the exposure–response relationship of the number of hypertensive patients. Meanwhile, due to the correlation coefficient of the daily average temperature, the daily maximum temperature, and the daily minimum temperature reaching 0.9 and passing the test with a significance level of 0.05, and considering the collinearity between these factors, the daily average temperature was selected as the main variable in the temperature index. The Environmental Air Quality Index (AQI) is a comprehensive index calculated based on the concentration of different pollutants in the air, used to reflect the health effects of pollutant concentration and response. It is usually represented by a value of 0–500, with higher values indicating poorer air quality. Similarly, due to the correlation coefficient of air quality indicators AQI, PM2.5, and PM10 reaching 0.8 and passing the test with a significance level of 0.05, AQI is selected as the main variable in the air quality indicators. At the same time, due to the significant correlation between air pressure and the number of hypertensive patients, with a correlation coefficient of 0.9 between average air pressure, maximum air pressure, and minimum air pressure, passing the test with a significance level of 0.05, average air pressure was used as a covariate.
The number of daily visits for hypertension was used as a dependent variable, the daily average temperature was put into the DLNM model to establish a cross-basis matrix of daily average temperature and lag time. The AQI and daily average air pressure are used as covariates to control for the confounding effects of holidays, weekends and long-term trends. To influence weather conditions, a DLNM model based on the basic meteorological variables nested in the generalized additive model (GAM) was established. Then, in the same way, AQI was put into the DLNM model to establish a DLNM model based on the basic air-quality variables nested in the generalized additive model (GAM). Meanwhile, the median was used as the benchmark to analyze the exposure–response relationship between meteorological parameters and the number of hypertension visits, and the RR was calculated as the main characterization quantity.
The median daily average temperature (24.7 °C) was selected as the reference value and used as the dividing point to discuss the cold and heat effects when the temperature was less than or equal to the median daily average temperature and to study the exposure–response relationship between temperature and the number of patients with hypertension (Figure 2a), while calculating the cumulative effect of continuous exposure to a low temperature (high temperature) environment. The influence of temperature on the risk of hypertension was mainly through the cold effect, and had an obvious lag effect. The risk was greater at lags of 1 to 10 days, and the overall thermal effect had a positive effect on reducing the number of hypertension visits, but extremely high temperatures during these days had some effects on the risk of hypertension.
An AQI value reaching the upper limit of level 2 (good) of 100 was selected as the reference value, and the analysis showed that the influence of the air quality effect on the risk of hypertension was mainly related to the high concentration factor, with a lag period of 0 to 8 days. Overall, the low concentration factor had no impact on the risk of hypertension (Figure 2b).
Judging from the cumulative effects of meteorological factors, air quality, and relative risk of hypertension (Figure 3a), the overall daily average temperature and the number of hypertension consultations showed an overall trend of first decreasing, then slightly increasing, then decreasing and then increasing. When the daily average temperature was less than 24.7 °C, the risk of hypertension increased slowly as the temperature dropped, and rose rapidly when it dropped to approximately 15 °C. When it dropped to 10 °C, the cumulative effect on the RR of hypertension on the day the low temperature occurred reached the highest level (RR was 2.30 and the 95% confidence interval was 1.723~3.061); the RR increased by 1.30 times and was statistically significant. When the daily average temperature was greater than 24.7 °C, the risk of hypertension gradually decreased with increasing temperature, reaching 29.4. The RR was lowest at 29.4 °C (RR was 0.882 and the 95% confidence interval was 0.744–1.0), was reduced by 13.8%, and failed to pass the test for significance. When the daily average temperature rose to 32.3 °C, the cumulative effect on the RR of hypertension on that day increased by 4.9% (RR was 1.049 and the 95% confidence interval was 0.745–1.478), and failed to pass the test for significance.
The number of hypertension visits exhibited a trend of first increasing and then decreasing as AQI increased, then gradually rising and then declining again (Figure 3b). When the AQI was lower than 100, the effect of AQI on the risk of hypertension did not pass the significance test; the risk of hypertension first increased, then decreased and then gradually increased with increasing AQI, but did not pass the test for significance; and when the AQI was higher than 100, the overall risk of hypertension increased with increasing AQI. The AQI increased gradually. When the risk increased to approximately 124, the RR was the highest (RR was 1.63 and the 95% confidence interval was 1.104–2.408). When the RR increased by 63%, the difference was statistically significant, and when the AQI was higher than 124 the risk of hypertension gradually decreased, but the difference was not statistically significant (Figure 4b).
The analysis of the relative risk diagram of the impact of meteorological factors, air quality, and daily average temperature on the number of hypertension visits on different lag days showed that, regarding the cold effect of low temperature, the average temperature on the day the low temperature occurred and the daily average temperature lag of 1 to 10 days had an obvious impact on the incidence of hypertension. The test with a significance level of 0.05 was passed from lag 1 to 6 days, and the thermal effect of high temperature lagged by 0 days on the same day. Moreover, 6 to 8 days both showed a risk for the onset of hypertension, among which the lag of 7 days and the lag of 8 days passed the test with a significance level of 0.05 (Figure 4a). These results may be due to the fact that when the temperature drops the level of adrenaline in the human body rises, and the surface blood vessels contract to reduce heat dissipation; at the same time, adrenaline accelerates the heart rhythm, increases cardiac output and leads to an increase in blood pressure. When the ambient temperature is high, due to the need for heat dissipation, skin blood vessels dilate, blood is redistributed, and cardiac output increases, leading to increased cardiac load and elevated blood pressure. The impact of the AQI on the onset of hypertension had a certain hysteresis effect, which lasted up to 8 days. The hysteretic effect of an excellent air quality (AQI less than 50) was noted, but did not pass the significance test; it had a certain impact on the incidence of hypertension at lags of 0, 6, and 7 days, but did not pass the test for significance. Excellent air quality had a certain protective effect on the onset of hypertension at a lag of 1–6 days. However, the results did not pass the test for significance. The impact of a good level (51–100) of air quality on the onset of hypertension with a lag of 0–5 days did not pass the test for significance; under mild pollution conditions, the impact of a lag on hypertension on the 8th day was greatest, and passed the test with a significance level of 0.05 (Figure 4b). This may be due to air pollutants entering the bloodstream after a period of time, damaging blood vessels and leading to an increase in blood pressure.

4. Discussion

Based on outpatient-clinic data from 2016 to 2018, this study analyzed the impact of meteorological conditions and air quality on the number of hypertension consultations in Haikou city, providing a scientific basis for the prevention and treatment of hypertension and the allocation of medical resources in tropical areas. Our research has found that low temperature and high temperature had significant impact on the risk of hypertension, both with a lagging effect, which was consistent with the research findings of Wu H [16] and Chen Y Y [18]. On the other hand, previous studies have mainly discussed the impact of temperature changes on the incidence of hypertension [14], which may be related to the differences in the study area. Haikou City is located in a tropical region, and the temperature change is not significant, so the impact of temperature change on the number of hypertension patients is not significantly related. In addition, previous studies have mostly discussed the impact of specific pollutants on hypertension [13,19], but this study used the comprehensive indicator AQI, calculated based on pollutants, as an indicator to analyze the impact of air quality on hypertension, which could reflect the impact of comprehensive air quality on the incidence of hypertension. The results indicated that it is necessary to conduct research on areas with similar climate conditions to Haikou City, and that, based on the research results, efforts should be made to strengthen the prevention of hypertension under low-temperature conditions and the prediction and early warning of disease risks. A joint work and research mechanism among multiple departments such as meteorology and medical health should be established to improve the level of medical and health care, optimize the allocation of social resources, and develop targeted prevention and control strategies based on the actual local situation, to reduce the health and economic burden of hypertension. Considering that atmospheric environmental factors such as meteorological conditions and air quality have a comprehensive impact on the human body, it will be necessary to analyze the synergistic effects of meteorological factors and air quality on the incidence of hypertension on the basis of more long-term disease data, and refine the impact of meteorological conditions and air quality on hypertension groups of different gender and age.

5. Conclusions

This study established a DLNM model based on nested GAM of basic meteorological element variables which combined the flexibility of GAM and DLNM and could capture the complex relationships between predictive variables and response variables, including nonlinear and lag effects, to analyze the exposure–response relationship and lag effect on the number of hypertensive patients. It used meteorological conditions and air quality data from Haikou City to provide technical support for conducting medical meteorological forecasting, early warning, and services for hypertension. The main conclusions are as follows:
(1)
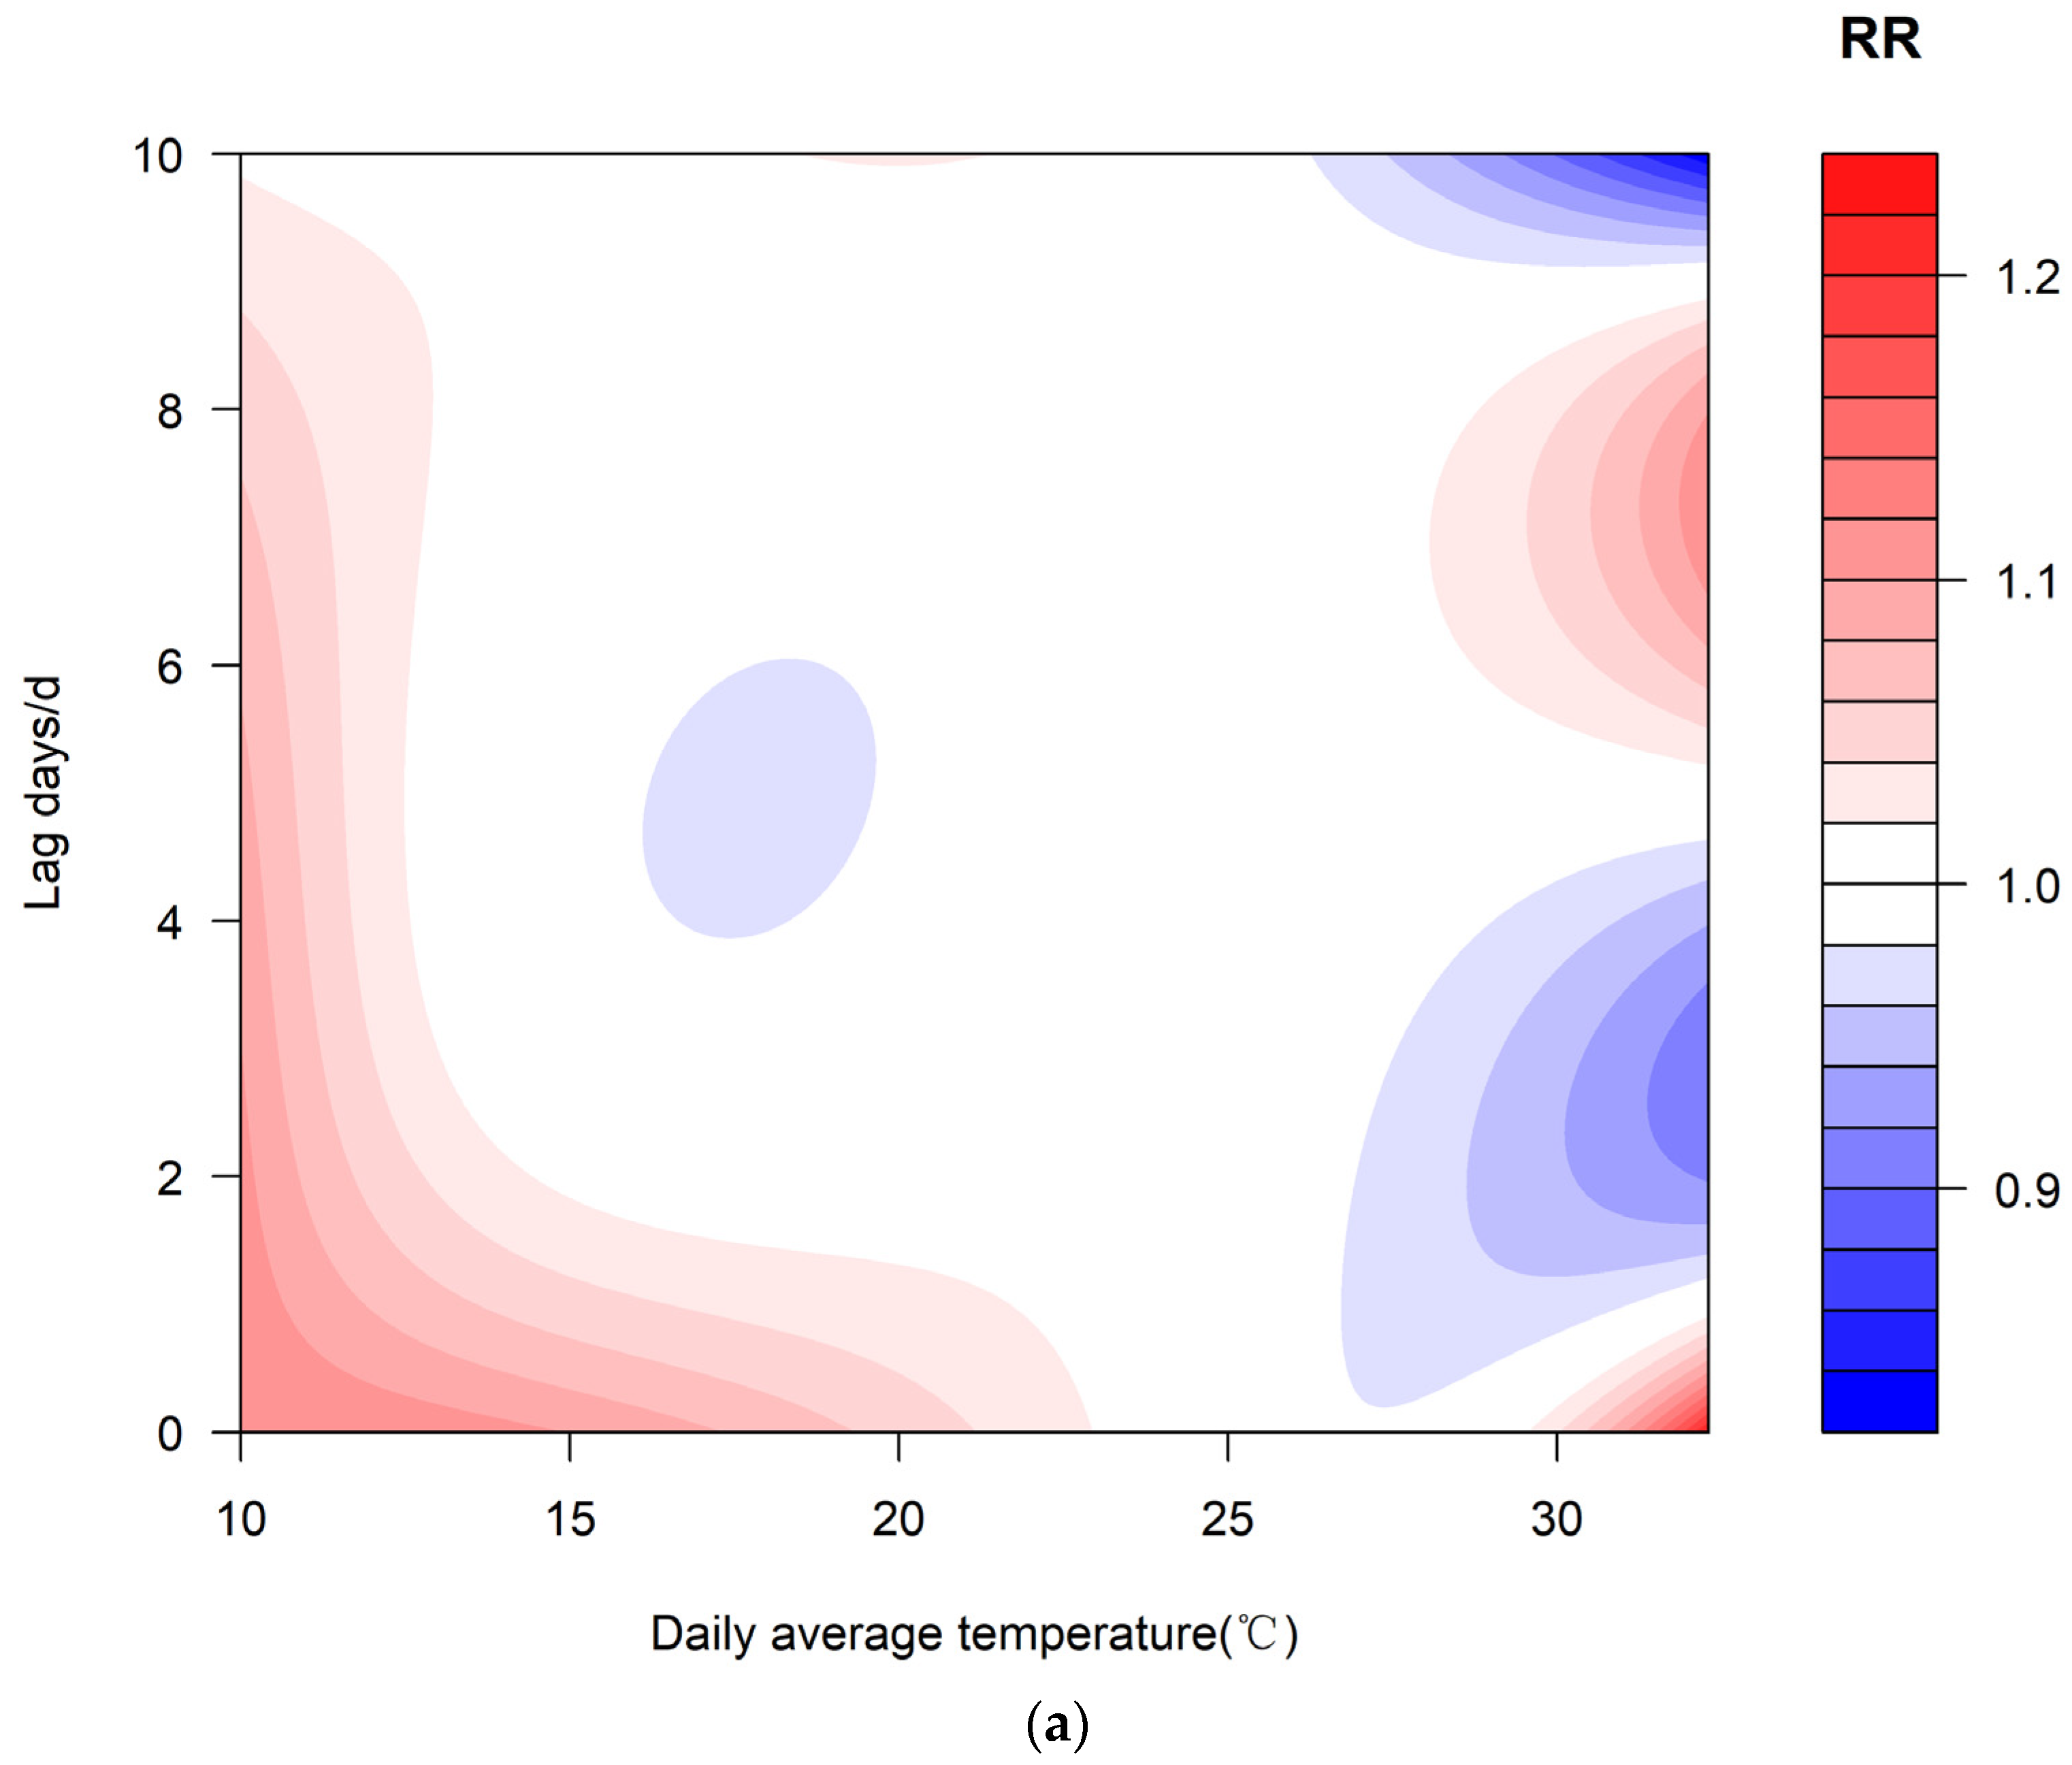
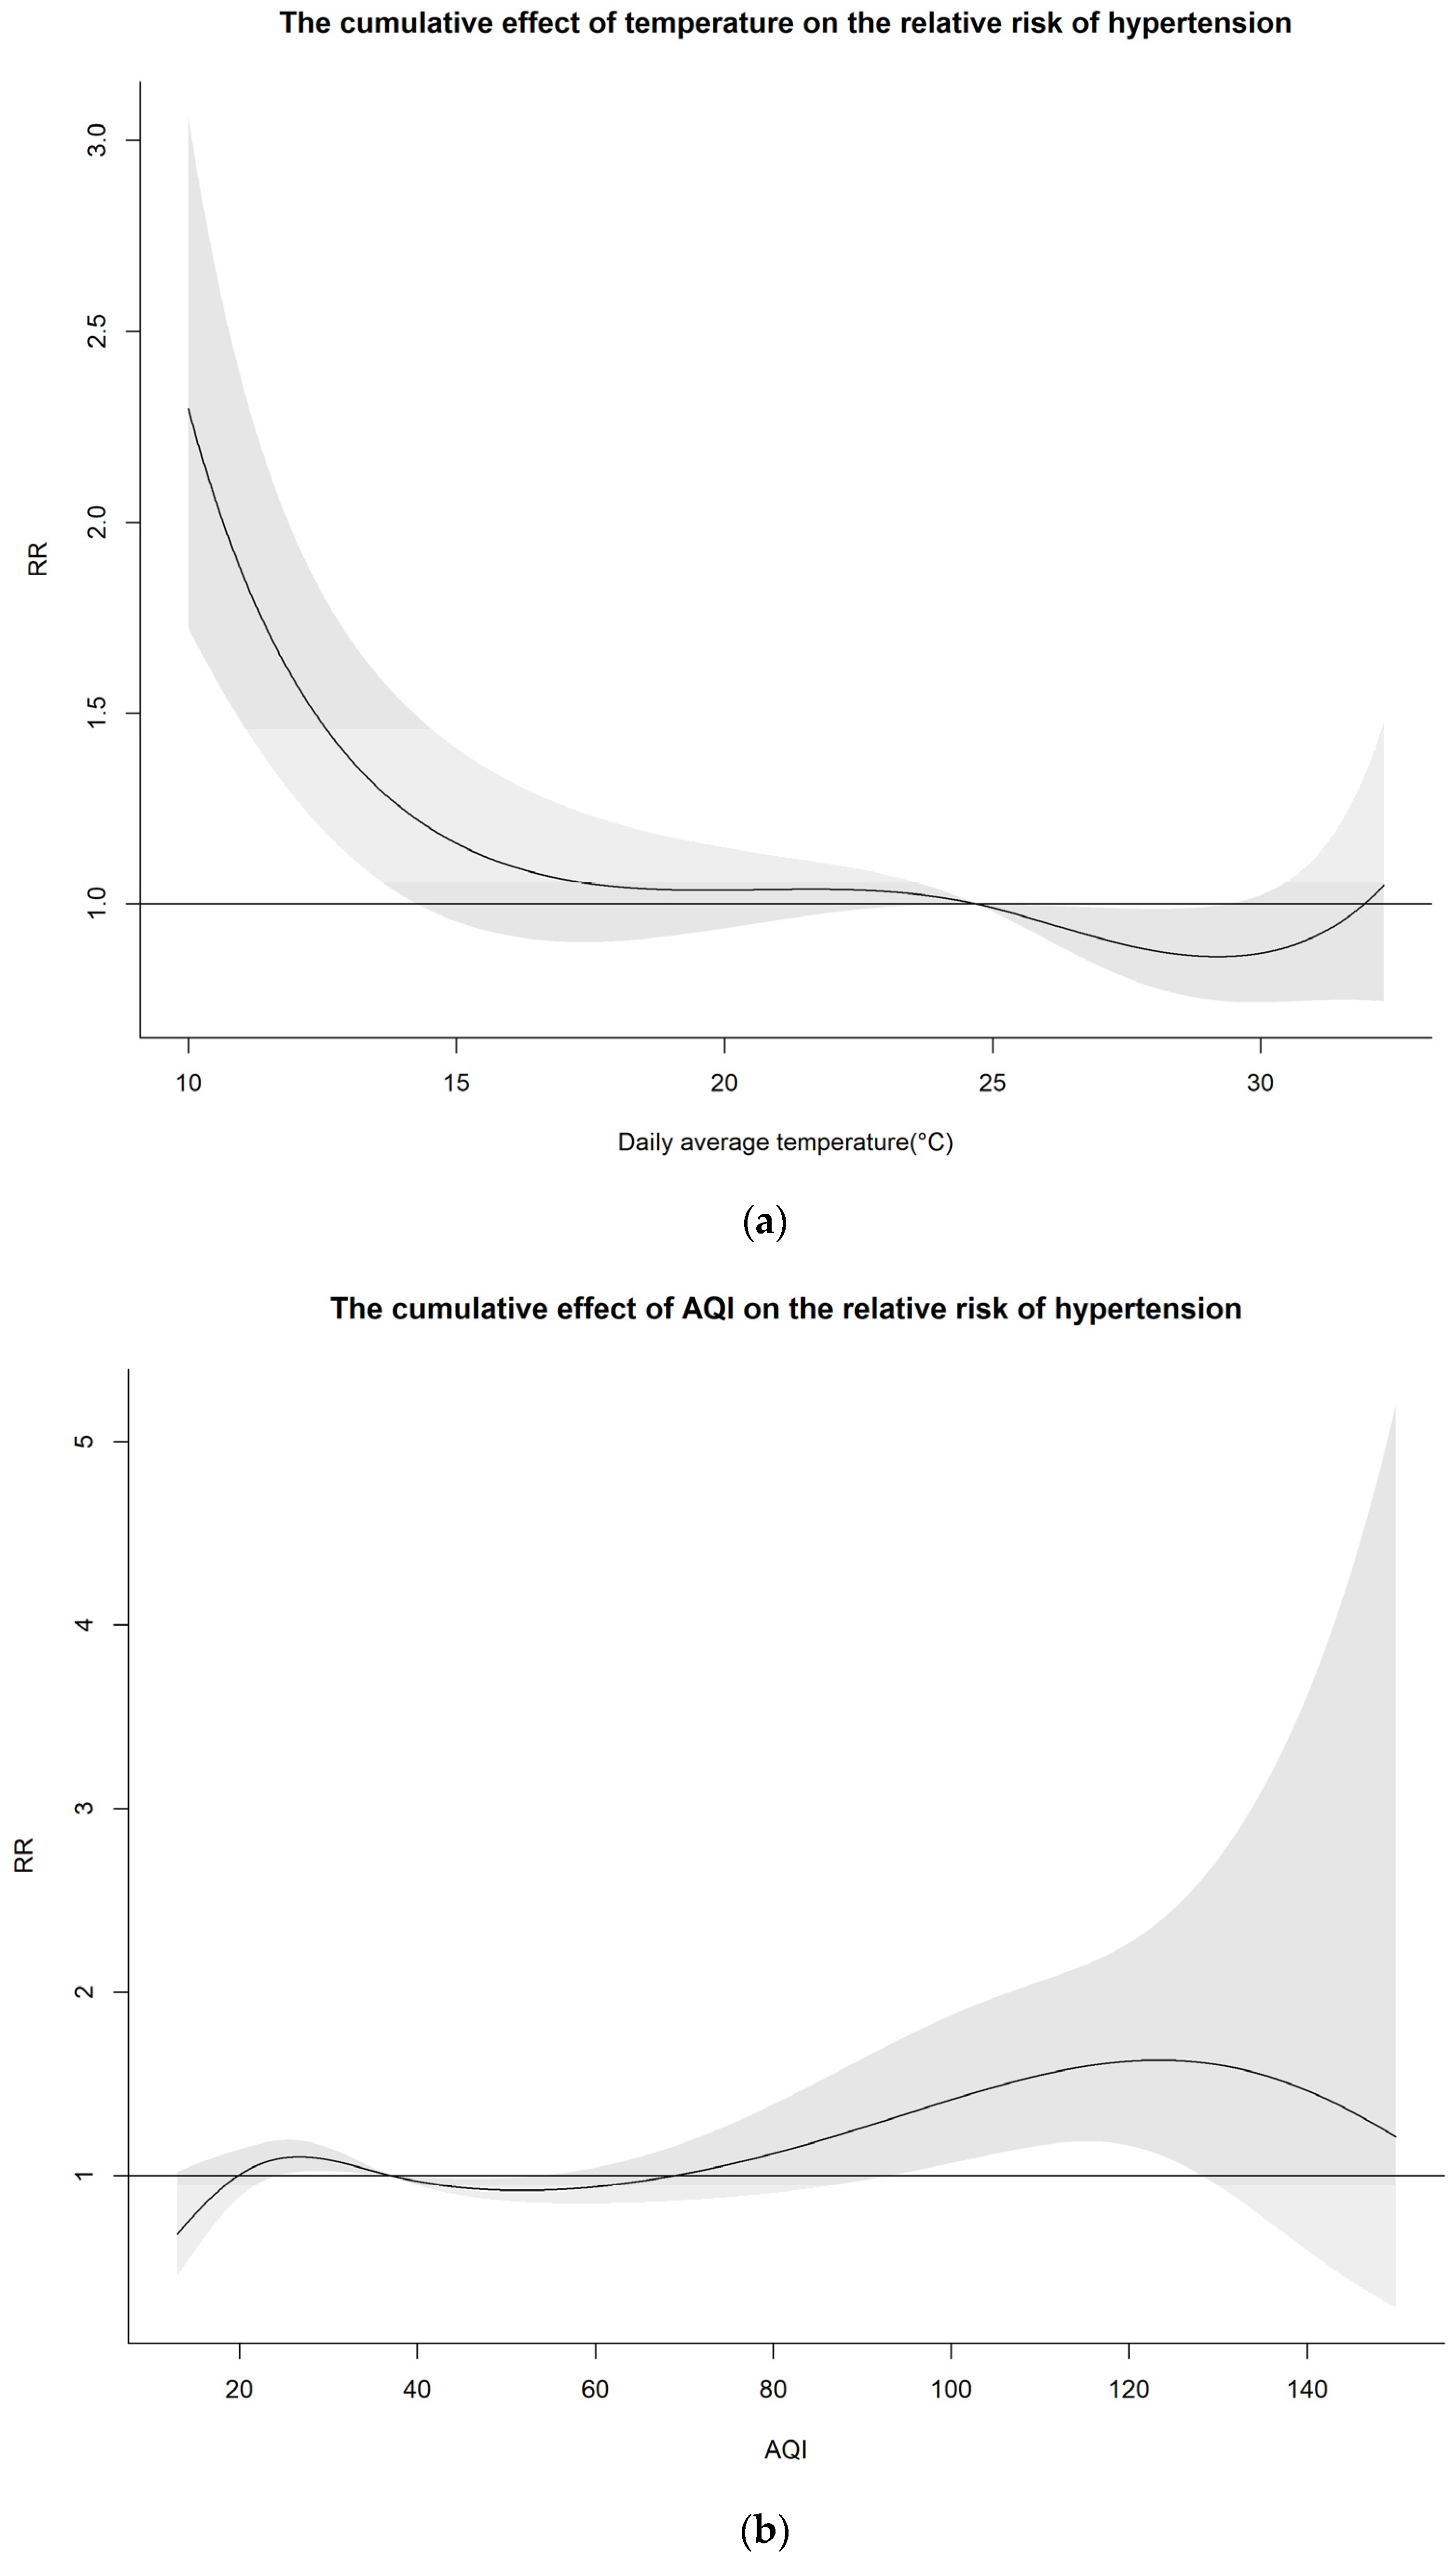
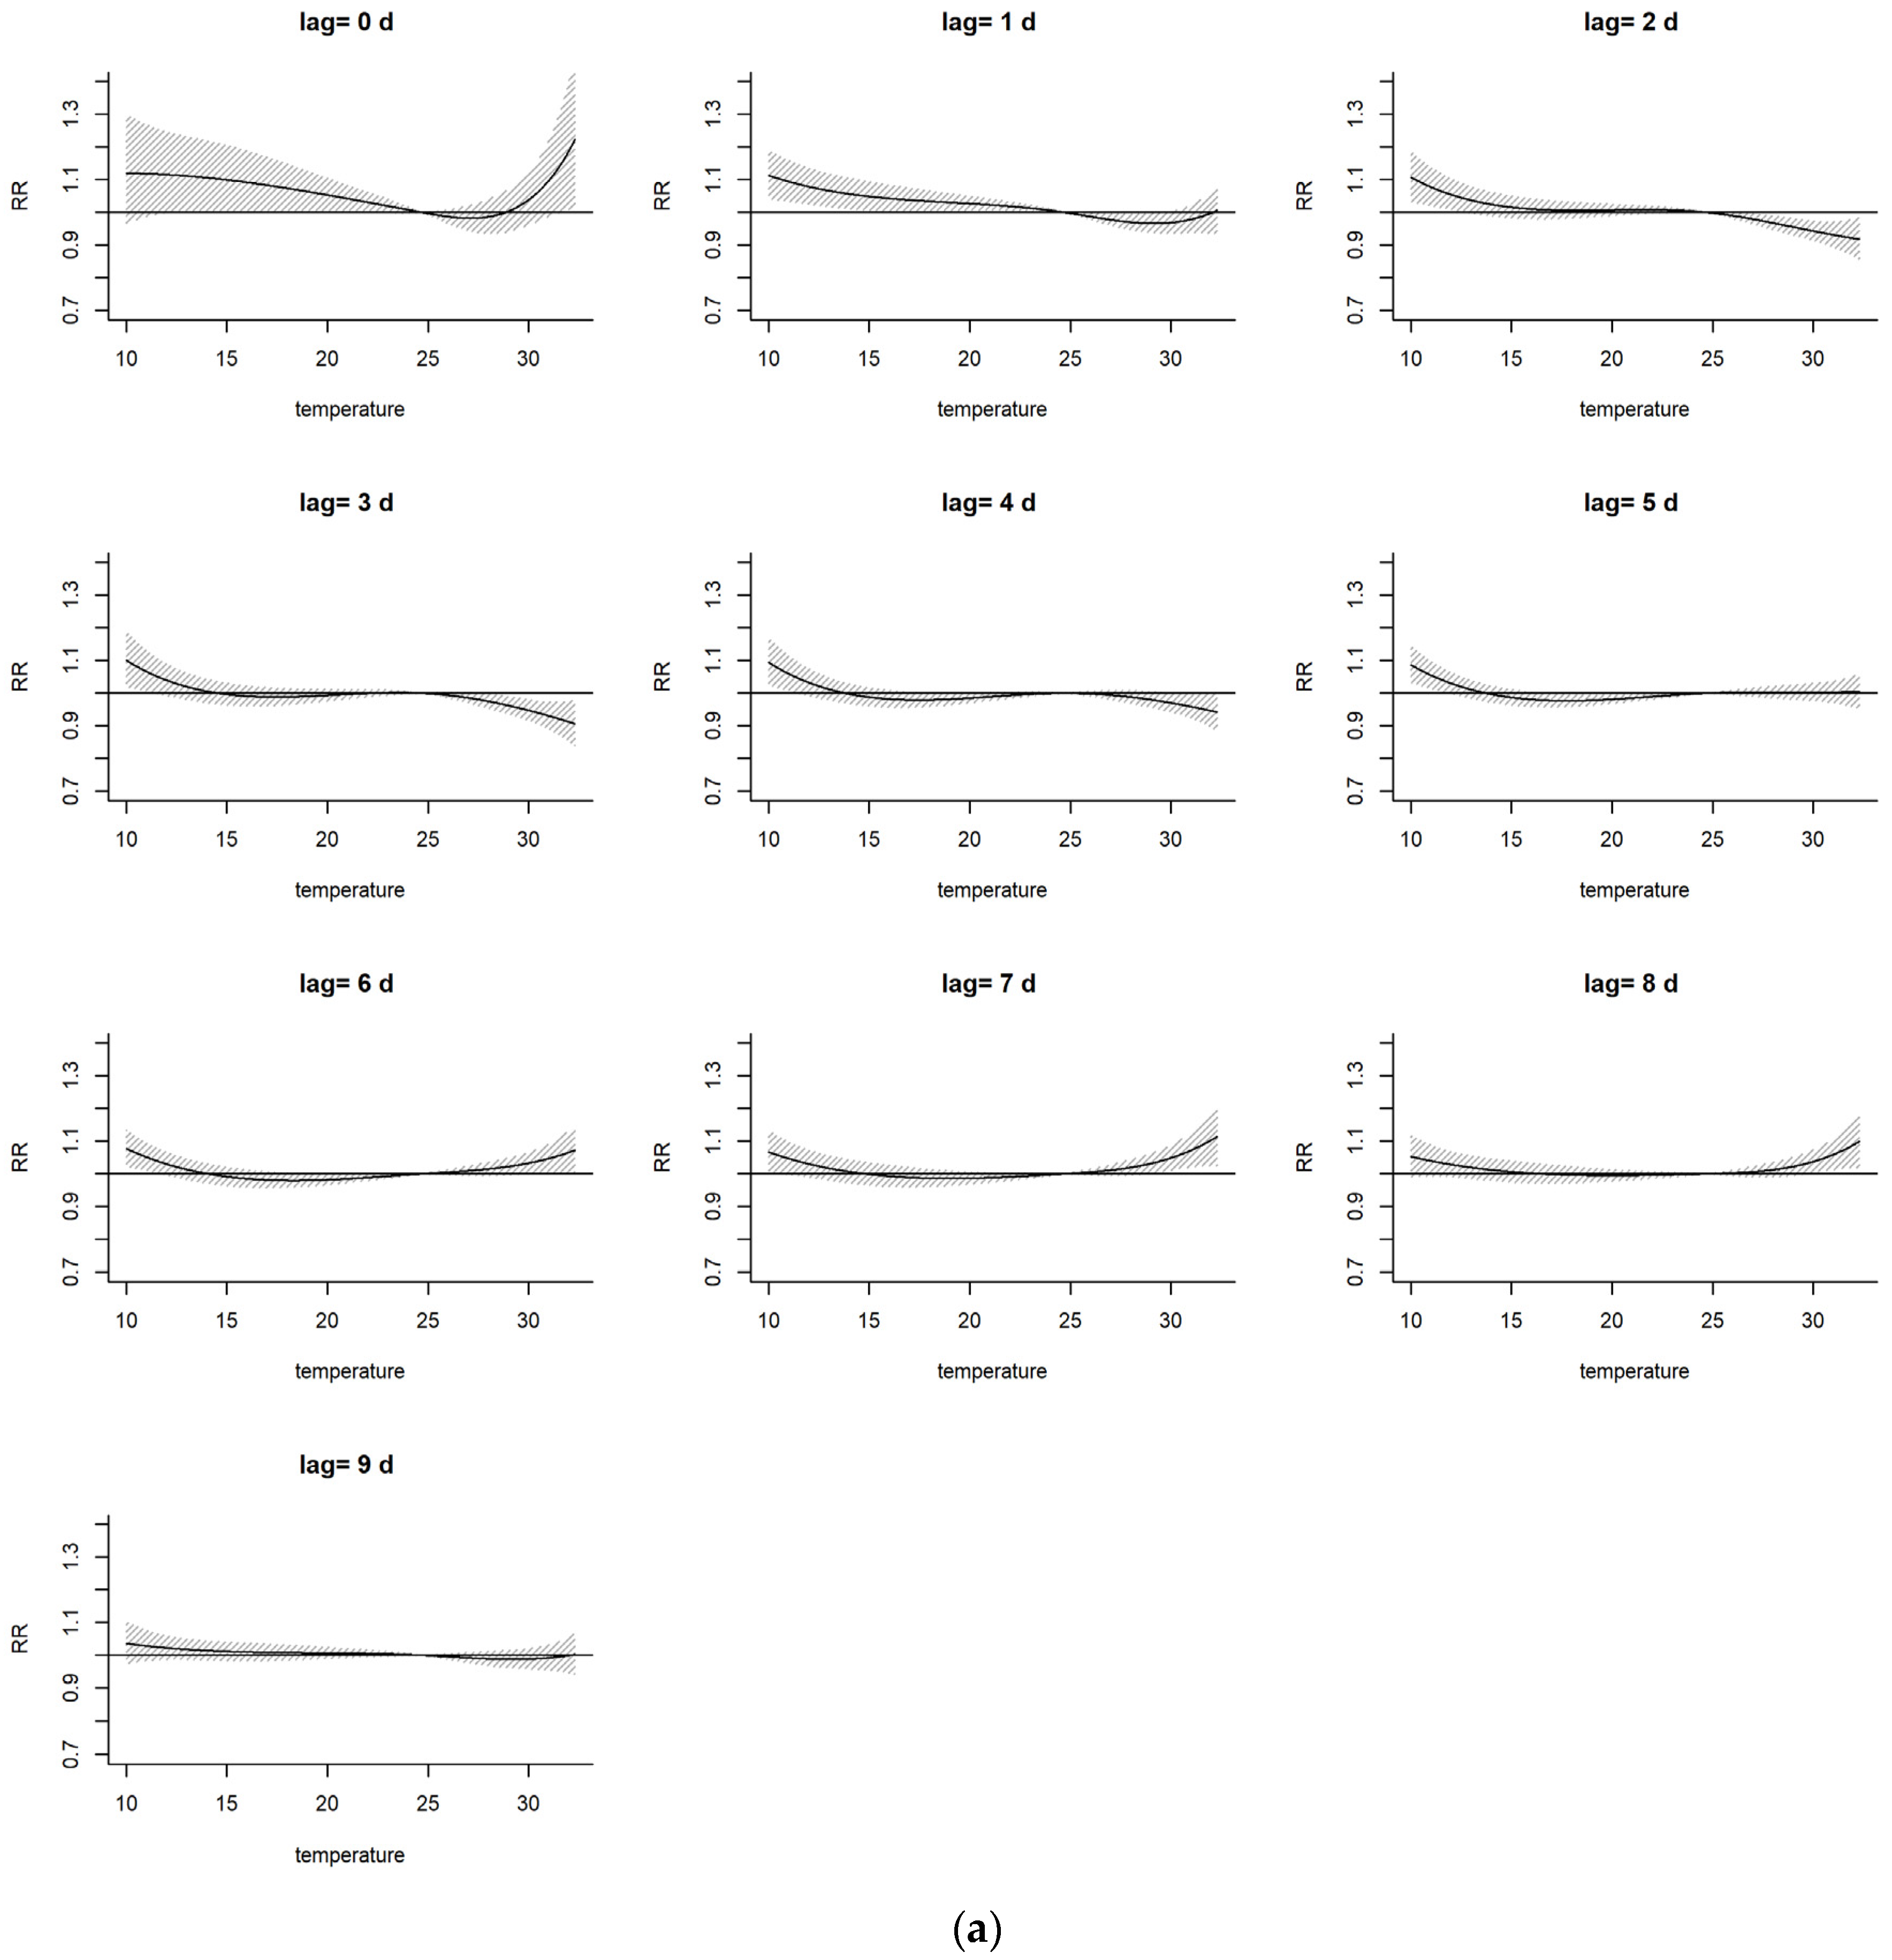
The effect of temperature on the risk of hypertension was dominated by the cold effect, which was associated with a greater risk of hypertension, with a lag of 1 to 10 days from September 2016 to April 2018. When the temperature decreased to 10 °C, the cumulative effect on the RR of hypertension reached its highest value on the day when the low temperature occurred (RR = 2.30 and the 95% confidence interval = 1.723~3.061). Additionally, the RR increased by 1.30 times and passed the test for significance.
(2)
The impact of the air-quality effect on the risk of hypertension is mainly dominated by the low-quality-air effect (AQI less than 100), with a lag period of 0 to 8 days. When the AQI increased to approximately 124, the RR was the highest (RR was 1.63 and the 95% confidence interval was 1.104–2.408), and the RR increased by 63% and passed the test for significance.

Author Contributions

Conceptualization, methodology, and data collection: M.Z. and S.L.; data analysis, M.Z.; writing—original draft, M.Z.; supervision, J.Z.; project administration, M.Z.; writing—review and editing, M.Z. and Y.Z. All authors have read and agreed to the published version of the manuscript.

Funding

The work was supported by Hainan Provincial Natural Science Foundation of China (NO.420QN370) and Hainan Provincial Science and Technology Special Projects of China (NO. ZDYF2022SHFZ036).

Institutional Review Board Statement

Not applicable.

Informed Consent Statement

Not applicable.

Data Availability Statement

The original contributions presented in the study are included in the article, further inquiries can be directed to the corresponding authors.

Acknowledgments

We would like to thank all the participants in this study. We truly appreciate their time.

Conflicts of Interest

The authors declares no conflicts of interest.

References

  1. Hu, S.T.; Gao, R.L.; Liu, L.S.; Zhu, M.L.; Wang, W. Summary of the 2018 Report on Cardiovascular Diseases in China. Chin. Circ. J. 2019, 34, 209–220. [Google Scholar]
  2. Dai, Y.T.; Yu, F.Y.; Chang, P.; Zhang, L.; Yang, X. Weather conditions of hypertension incidence and its forecast model in Dezhou, Shandong province. J. Meteorol. Environ. 2012, 28, 79–82. [Google Scholar]
  3. Ma, S.C. Research on Effect of Cold Air from Northwest China on Hypertension Diseases and Its Mechanism. Master’s Thesis, Nanjing University of Information Science & Technology, Nanjing, China, 2012. [Google Scholar]
  4. Zhang, Y.; Xin, J.Y.; Ma, P.; Feng, X.Y.; Zhang, X.L.; Wang, S.G.; Zhang, J.X.; Wang, H.M.; Zheng, C.J. Interaction effects between ambient temperature and PM2.5 and O3 on mortality in Chengdu. China Environ. Sci. 2021, 41, 3887–3895. [Google Scholar] [CrossRef]
  5. Kotecki, P.; Więckowska, B.; Stawińska-Witoszyńska, B. The Impact of Meteorological Parameters and Seasonal Changes on Reporting Patients with Selected Cardiovascular Diseases to Hospital Emergency Departments: A Pilot Study. Int. J. Environ. Res. Public Health 2023, 20, 4838. [Google Scholar] [CrossRef] [PubMed]
  6. Ho, J.Y. Early-Life Environmental Exposures and Height, Hypertension, and Cardiovascular Risk Factors Among Older Adults in India. Biodemography Soc. Biol. 2015, 61, 121–146. [Google Scholar] [CrossRef]
  7. Di Pilla, M.; Bruno, R.M.; Stea, F.; Massetti, L.; Taddei, S.; Ghiadoni, L.; Modesti, P.A. Impact of seasonality and air pollutants on carotid-femoral pulse wave velocity and wave reflection in hypertensive patients. PLoS ONE 2017, 12, e0172550. [Google Scholar] [CrossRef]
  8. Yackerson, N.S.; Bromberg, L.; Adler, B.; Aizenberg, A. Possible effects of changes in the meteorological state over semi-arid areas on the general well-being of weather-sensitive patients. Environ. Health 2012, 11, 26. [Google Scholar] [CrossRef]
  9. Liu, Y.; Dong, J.; Zhai, G. Association between air pollution and hospital admissions for hypertension in Lanzhou, China. Environ. Sci. Pollut. Res. Int. 2022, 29, 11976–11989. [Google Scholar] [CrossRef]
  10. Wu, G.; Cai, M.; Wang, C.; Zou, H.; Wang, X.; Hua, J.; Lin, H. Ambient air pollution and incidence, progression to multimorbidity and death of hypertension, diabetes, and chronic kidney disease: A national prospective cohort. Sci. Total Environ. 2023, 881, 163406. [Google Scholar] [CrossRef]
  11. Hou, J.; Gu, J.; Liu, X.; Tu, R.; Dong, X.; Li, R.; Mao, Z.; Huo, W.; Chen, G.; Pan, M.; et al. Long-term exposure to air pollutants enhanced associations of obesity with blood pressure and hypertension. Clin. Nutr. 2021, 40, 1442–1450. [Google Scholar] [CrossRef]
  12. Fuks, K.B.; Weinmayr, G.; Basagaña, X.; Gruzieva, O.; Hampel, R.; Oftedal, B.; Sørensen, M.; Wolf, K.; Aamodt, G.; Aasvang, G.M.; et al. Long-term exposure to ambient air pollution and traffic noise and incident hypertension in seven cohorts of the European study of cohorts for air pollution effects (ESCAPE). Eur. Heart J. 2017, 38, 983–990. [Google Scholar] [CrossRef]
  13. Zhang, J.; Zhang, F.; Xin, C.; Duan, Z.; Wei, J.; Zhang, X.; Han, S.; Niu, Z. Associations of long-term exposure to air pollution, physical activity with blood pressure and prevalence of hypertension: The China Health and Retirement Longitudinal Study. Front. Public Health 2023, 11, 1137118. [Google Scholar] [CrossRef]
  14. Meng, X.Y.; Zheng, S.; Wei, X.F.; Nie, Y.H.; Wang, M.Z.; Mi, X.Y.; Li, H.Y.; Bai, Y.N. Effects of cold waves on hospital admissions for hypertension in Jinchang, Gansu Province: A case-crossover study. J. Environ. Occup. Med. 2020, 37, 36–43. [Google Scholar] [CrossRef]
  15. Wei, J.N.; Xue, S.L.; Lu, D.Y.; Qiao, X.F.; Shang, J. Association between daily admission of patients with hypertension and air pollutants. Chin. Prev. Med. 2018, 19, 101–105. [Google Scholar] [CrossRef]
  16. Wu, H. Risk Assessment of Ozone and Meteorological Factors on Cardiovascular and Cerebrovascular Mortality in the Population: A Time Series Study Based on 7-Year Cause of Death Registration Data in Nanchang City, Jiangxi Province. Master’s Thesis, Nanchang University, Nanchang, China, 2023. [Google Scholar] [CrossRef]
  17. Lin, S.; Luo, M.; Walker, R.J.; Liu, X.; Hwang, S.A.; Chinery, R. Extreme high temperatures and hospital admissions for respiratory and cardiovascular diseases. Epidemiology 2009, 20, 738–746. [Google Scholar] [CrossRef] [PubMed]
  18. Chen, Y.Y. The impact of environmental factors, meteorology and air pollution factors on the number of deaths from cardiovascular and cerebrovascular diseases during the high temperature in Wuhan from 2014 to 2019. Public Health Prev. Med. 2023, 6, 40–43. [Google Scholar] [CrossRef]
  19. Zhang, S.Y.; Wang, B.J.; Xie, J.F.; Qin, Y.M. Study and analysis of relationship between CVD and weather conditions and the establishment of medical forecast in Jilin province. Med. Mon. 2010, 36, 106–110. [Google Scholar]
  20. World Health Organization. Air Quality Guidelines: Global Update 2005:Particulate Matter, Ozone, Nitrogen Dioxide, and Sulfur Dioxide; World Health Organization: Geneva, Switzerland, 2006. [Google Scholar]
  21. Nuvolone, D.; Balzi, D.; Pepe, P.; Chini, M.; Scala, D.; Giovannini, F.; Cipriani, F.; Barchielli, A. Ozone short-term exposure and acute coronary events: A multicities study in Tuscany (Italy). Environ. Res. 2013, 126, 17–23. [Google Scholar] [CrossRef]
  22. Goodman, J.E.; Prueitt, R.L.; Sax, S.N.; Lynch, H.N.; Zu, K.; Lemay, J.C.; King, J.M.; Venditti, F.J. Weight-of-evidence evaluation of short-term ozone exposure and cardiovascular effects. Crit. Rev. Toxicol. 2014, 44, 725–790. [Google Scholar] [CrossRef]
  23. Guo, R.N.; Zheng, H.Z.; Ou, C.Q.; Huang, L.Q.; Zhou, Y.; Zhang, X.; Liang, C.K.; Lin, J.Y.; Zhong, H.J.; Song, T.; et al. Impact of Influenza on Outpatient Visits, Hospitalizations, and Deaths by Using a Time Series Poisson Generalized Additive Model. PLoS ONE 2016, 11, e0149468. [Google Scholar] [CrossRef]
  24. Luo, P.; Wang, D.; Luo, J.; Li, S.; Li, M.M.; Chen, H.; Duan, Y.; Fan, J.; Cheng, Z.; Zhao, M.M.; et al. Relationship between air pollution and childhood atopic dermatitis in Chongqing, China: A time-series analysis. Front. Public Health 2022, 10, 990464. [Google Scholar] [CrossRef]
  25. Li, Y.; Wang, B.; Wang, S.; Xu, S.; Li, S.; He, H.; Niu, J.; Luo, B. Ambient temperature, humidity, and urinary system diseases: A population-based study in Western China. Environ. Sci. Pollut. Res. Int. 2022, 29, 28637–28646. [Google Scholar] [CrossRef]
  26. Luo, L.; He, K.; Wu, W.; Taylor, J.M. Using information criteria to select smoothing parameters when analyzing survival data with time-varying coefficient hazard models. Stat. Methods Med. Res. 2023, 32, 1664–1679. [Google Scholar] [CrossRef]
  27. Gasparrini, A.; Armstrong, B.; Kenward, M.G. Distributed lag non-linear models. Stat. Med. 2010, 29, 2224–2234. [Google Scholar] [CrossRef] [PubMed]
  28. Kriit, H.K.; Andersson, E.M.; Carlsen, H.K.; Andersson, N.; Ljungman, P.L.S.; Pershagen, G.; Segersson, D.; Eneroth, K.; Gidhagen, L.; Spanne, M.; et al. Using Distributed Lag Non-Linear Models to Estimate Exposure Lag-Response Associations between Long-Term Air Pollution Exposure and Incidence of Cardiovascular Disease. Int. J. Environ. Res. Public Health 2022, 19, 2630. [Google Scholar] [CrossRef]
  29. Wu, Y.; Liang, M.; Liang, Q.; Yang, X.; Sun, Y. A distributed lag non-linear time-series study of ambient temperature and healthcare-associated infections in Hefei, China. Int. J. Environ. Health Res. 2023, 33, 258–267. [Google Scholar] [CrossRef]
  30. Schwartz, J. The distributed lag between air pollution and daily deaths. Epidemiology 2000, 11, 320–326. [Google Scholar] [CrossRef] [PubMed]
  31. Zhao, J.; Zhang, Y.; Ni, Y.; He, J.; Wang, J.; Li, X.; Guo, Y.; Li, C.; Zhang, W.; Cui, Z. Effect of ambient temperature and other environmental factors on stroke emergency department visits in Beijing: A distributed lag non-linear model. Front. Public Health 2022, 10, 1034534. [Google Scholar] [CrossRef] [PubMed]
  32. Noordzij, M.; van Diepen, M.; Caskey, F.C.; Jager, K.J. Relative risk versus absolute risk: One cannot be interpreted without the other. Nephrol. Dial. Transplant. 2017, 32 (Suppl. S2), ii13–ii18. [Google Scholar] [CrossRef]
  33. Huang, S.L. Study on the Correlation between Gaseous Pollutants and Death of Cardiovascular and Cerebrovascular Diseases in Shenyang from 2014 to 2018. Master Thesis, China Medical University, Shenyang, China, 2023. [Google Scholar] [CrossRef]
Figure 1. Daily number of medical visits for hypertension from September 2016 to April 2018.
Atmosphere 15 00370 g001
Figure 2. Graph of the exposure–response relationship between meteorological factors, air quality and the number of hypertension visits. (a) Daily average temperature, (b) daily AQI.
Atmosphere 15 00370 g002aAtmosphere 15 00370 g002b
Figure 3. Cumulative effects of meteorological factors, air quality, and relative risk of hypertension. (a) daily average temperature. (b) Daily AQI.
Atmosphere 15 00370 g003
Figure 4. Relative-risk diagram of the impact of meteorological factors and air quality on the number of hypertension visits on different lag days. (a) Daily average temperature. (b) Daily AQI.
Atmosphere 15 00370 g004aAtmosphere 15 00370 g004b
Table 1. Spearman correlation coefficients between the number of medical visits for hypertension and meteorological and air quality indicators.
Meteorological
Elements
Average Air PressureMaximum Air PressureLowest Air PressureAverage TemperatureMaximum TemperatureMinimum TemperatureVapor PressureRelative HumidityPrecipitationAverage Wind SpeedTemperature Change Range
Number of visits0.15 *0.15 *0.14 *−0.18 **−0.16 **−0.19 **−0.19 *−0.05−0.070.04−0.01
Air quality indicatorsAQIPM2.5PM10SO2NO2COO3
Number of doctors0.10 **0.11 **0.13 **0.020.09 *0.08 *0.04
Note: * means passing the test with a significance level of 0.05, ** means passing the test with a significance level of 0.01.
Disclaimer/Publisher’s Note: The statements, opinions and data contained in all publications are solely those of the individual author(s) and contributor(s) and not of MDPI and/or the editor(s). MDPI and/or the editor(s) disclaim responsibility for any injury to people or property resulting from any ideas, methods, instructions or products referred to in the content.

