Article

The Synergistic Effect of the Filtration Area Controlled by the Electromagnetic Valve and Injection Pressure on Pulse-Jet Dust Cleaning Performance

1
School of Environment and Resource, Southwest University of Science and Technology, Mianyang 621010, China
2
Guangyuan Emergency Management Bureau, Guangyuan 628000, China
*
Author to whom correspondence should be addressed.
Atmosphere 2024, 15(4), 510; https://doi.org/10.3390/atmos15040510
Submission received: 13 March 2024 / Revised: 8 April 2024 / Accepted: 16 April 2024 / Published: 22 April 2024
(This article belongs to the Section Air Quality)

Abstract

:
In engineering pulse-jet dust collector applications, the filtration area and injection pressure are chosen mostly based on experience. The peak pressure is tested under different injection pressures and filtration areas controlled by an electromagnetic valve, and then comprehensively analyzes the effects of dust intensity, uniformity, and air consumption on dust cleaning to obtain a better filtration area controlled by an electromagnetic valve and injection pressure. The results show that considering the uniformity and intensity of dust cleaning, the filtration area of 33 m2 under the injection pressure of 0.4 MPa should be preferentially selected, with a standard deviation of 0.246 and a variance of 0.061. The filtration area of 27 m2 under the injection pressure of 0.3 MPa should be preferentially selected considering the unit air consumption, uniformity, and intensity of dust cleaning, the standard deviation of 0.252, and the variance of 0.064. The paper presents a theoretical foundation for selecting the optimal injection pressure and filter area regulated by an electromagnetic valve in pulse-jet dust collector systems.

1. Introduction

In the process of industrial production of dust collectors, in order to improve the cleaning effect of the dust collector, the general method is to increase the pulse injection pressure [1,2,3]. Meinke et al. [4] indicated that by improving the pulse cleaning energy output by 30%, a unique computer-modeled pulse cleaning technology would more easily “pulse off” dust from the surface of the filter, improving filtration efficiency and prolonging filter life. Yan et al. [5] used peak pressure and its arrival time as an index and showed that the pulse filter’s dust removal performance can be significantly improved by increasing the injection pressure. Moreover, the operating resistance of the pulse filter barrel can be reduced, and the dust removal efficiency of the pulse filter barrel can be improved. Ren et al. [6] examined the static pressure distribution along the surface of the filter during the pulse-jet cleaning process, reduced incomplete cleaning, and realized a more stable operation of the dust collector by using high pressure. Chen et al. [7,8] found that if the injection pressure was too low, the force entering the filter bag would be insufficient, the pressure difference between the inner surface and the outer surface of the filter bag would be large, and the ash removal efficiency would be poor. However, if the injection pressure was too high, it could easily cause excessive ash removal from the filter bag, reducing the service life of the filter bag and increasing the input cost of equipment.
There have been many experimental studies on electromagnetic pulse valves, which are an important component of pulse filter cartridge dust collectors and the executive mechanism for implementing pulse dust cleaning. Lin et al. [9] conducted in-depth comparative experiments on different electromagnetic valves with different diameters and found the injection volume of a large electromagnetic valve was higher than that of a smaller one, and the resistance of pulse valves was lower. Litchwark et al. [10] designed a test system to measure the pressure change characteristics of the pulse valve and obtained the mathematical equation of pressure change during the injection process by mathematical fitting. Many methods [11,12] investigated the effect of injection performance parameters on electromagnetic pulse valves and concluded that the higher the injection pressure, the higher the air consumption of one injection of an electromagnetic valve. Under the same air consumption, the higher injection pressure provided the top-drawer effect for the ash removal of an electromagnetic pulse valve.
Humphries and Madden [13] established that about 60% of the dust on the bag filter can be removed at a peak pressure of about 300 Pa and that when the pulse pressure exceeds the minimum value, the amount of dust falling off increases slightly. Lu et al. [14] showed that for fly ash, the average pressure of cleaning is 500–600 Pa. In order to guarantee ash removal, a pressure peak of 600 Pa meets the minimum requirements for cleaning performance. Wang et al. [15] obtained that once the pressure of the filter reaches 5282 Pa, the bag filter will be damaged. Based on the research and analysis above, our team selected the peak pressures of 600–5000 Pa for the effective cleaning performance of the filter bag in this experiment.
In the pulse jet process, as the air consumption of the electromagnetic pulse valve varies greatly under different injection pressures, the range of filtration area controlled by the electromagnetic valve is extremely wide. The manufacturer can only give a wider range based on the application experience, while it does not give a specific basis for selection (combined with the results given by the manufacturer, the filtration area controlled by the electromagnetic valve is about 14–36 m2 controlled by a 2″ electromagnetic valve). This paper investigates the influence of injection pressure and filtration area controlled by the electromagnetic valve on pulsating dust-cleaning in the jetting process of a long filter bag (Φ160 × 6000 mm). The peak pressure variation along the bag filter direction is tested under different injection pressures and different filtration areas, and finally, the effects of dust cleaning intensity, uniformity, and air consumption on dust cleaning are comprehensively analyzed; in this case, the better filtration area controlled by an electromagnetic valve and injection pressure are obtained. These experimental results provide powerful guidance for the application of the long bag filter in industrial uses.

2. Experimental Equipment and Methods

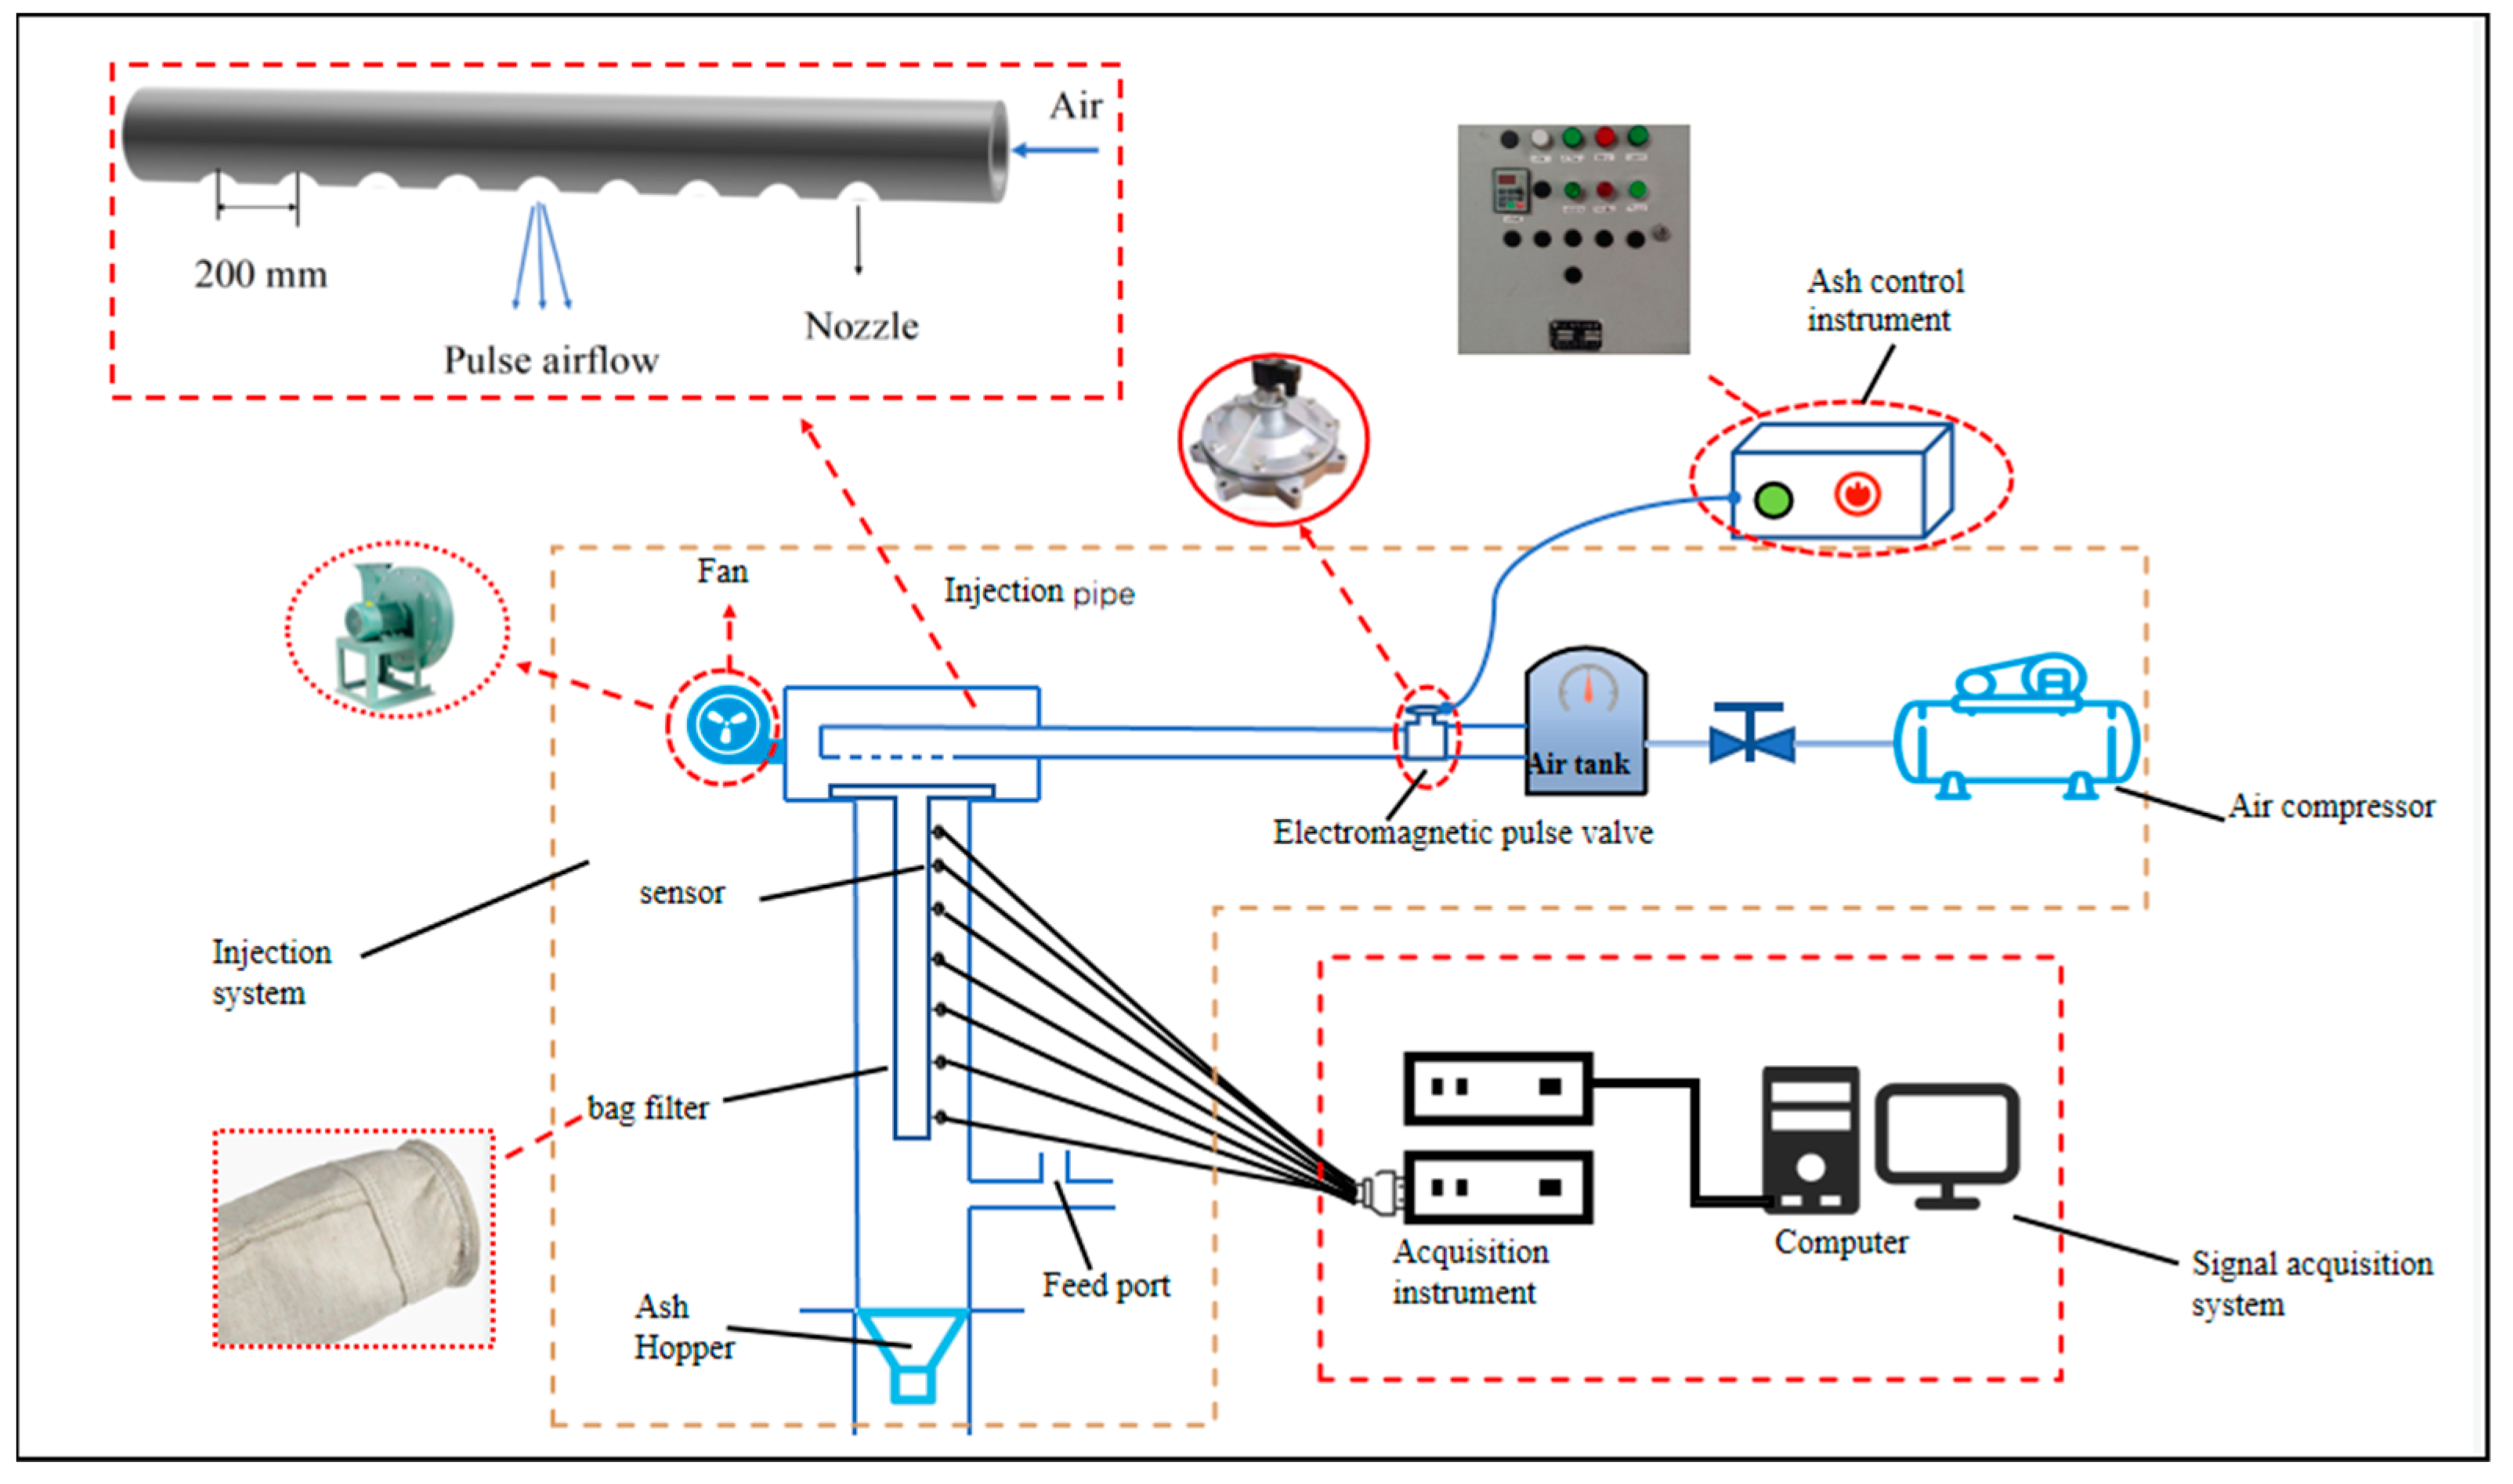
2.1. Experimental Apparatus

Figure 1 shows a schematic of the experimental system (Mianyang Liuneng Powder Equipment Co., Ltd., Mianyang, Sichuan Province, China). The experimental system consisted of an air-source system, injection system, filtration system, and data acquisition system. Air source system containing air compressor (GA 5/13, Atlas Copco, Nacka, Sweden), electrical control cabinet (power is 5 kW, Schneider Electric Co., Ltd. Rueil-Malmaison, France), and pressure reducing valve (DBR-4000, Schneider Electric Co., Ltd.). The injection system included a pulse valve (DMF-Y-50S, Shanghai Bag Filtration Equipment Co., Ltd., Shanghai, China), seamless steel injection pipe (40 mm inner diameter, 50 mm outer diameter, 3.0 m length, 16 mm nozzle diameters, and the distance between each injection hole was 200 mm) and Air tank (Sweden Co., Ltd., Sweden). The filtration system consisted of an induced fan (XFC-7500), Box (400 × 400 × 12,000 mm), bag filter (Φ160 × 6000 mm, polyester needle punched felt material, permeability 25 m3·m−2·min−1, weight 500 g·m−2) and steel frame cage, etc. The data acquisition system included a pressure transducer (QSY8135, Mianyang Qishiyuan Science and Technology Co., Ltd., Mianyang, China), an acquisition instrument (USB-8512E, Mianyang Qishiyuan Science and Technology Co., Ltd.), and a computer.

2.2. Experimental Preparation

The air consumption of one injection of an electromagnetic valve can be used to evaluate the energy consumption of the injection [16,17]. In engineering applications, increasing the pressure of compressed air requires increasing the cost. In addition, when the starting times of solenoid valves are the same, the greater the injection pressure, the greater the consumption of air, and the higher the operating cost of equipment [18,19]. The air consumption of one injection of an electromagnetic valve Qp can be calculated according to the equation below:
Q p = P 0 V P a 1 P 1 P 0 1 K
where P0 and P1 denote the absolute pressure before and after the pulse injection in the air tank, MPa. Pa is the normal atmospheric pressure, which is 0.10325 MPa. V is the gas volume, which is 13.2 × 10⁻³ m3. K is the adiabatic exponent, which is 1.4.
Absolute pressures before and after the pulse injection in the air tank were recorded, and the data were the simple mean of the 75 times; then, the air consumption of one injection of an electromagnetic valve in each experiment was calculated by Formula (1), and the energy consumption of the injection was estimated, results was provided in Figure 2. Comparing the air consumption at an injection pressure of 0.1–0.4 MPa indicates that the air consumption of an electromagnetic valve under an injection pressure of 0.2 MPa was 1.23 times greater than at 0.1 MPa, 0.3 MPa was 1.48 times higher than at 0.1 MPa, and 0.4 MPa was 1.83 times more than at 0.1 MPa. This trend is generally the same as found in previous studies [20].
The air consumption of a pulse valve increases with the increase of injection pressure, and the energy consumption of the whole injection system is mainly from electric energy for the compressed air. As shown in Figure 2, the inclination of the air consumption curve, which can be concluded that when the injection pressure increases from 0.3 MPa to 0.4 MPa, the increase in air consumption is the largest, i.e., the increase in energy consumption is the largest [3,7,21,22,23]. The lower the injection pressure, the more energy is saved, but in actual production, it is necessary to employ a certain injection pressure in order to achieve the established ash removal effect. At the same time, the more pressure the filter bag bears, the shorter its use cycle. Therefore, to meet the requirements of ash cleaning strength, a lower injection pressure should be chosen (the injection pressure is less than 0.3 MPa in this study as long as feasible).

2.3. Experimental Designs

In order to measure the peak pressures of the sidewalls of the bag filter, seven high-precision pressure sensors were used to monitor the peak pressures inside the bag filter, located 400, 1000, 2100, 3500, 4300, 5100, and 5900 mm away from the top of the bag filter, named as points P1–P7, respectively. The detail is in Figure 3. Export signals from the pressure transducer were connected to the import signal from the charge amplifier, and the outlet of the charge amplifier was then linked to the inlet of the data acquisition instrument. Finally, the export signal from the data acquisition instrument was linked to the computer. The sampling rate of data acquisition is 1 kHz. All the tests were repeated six times, and the average was calculated as the final peak pressure of the bag filter.
According to our previous study [14], the jet distance, nozzle diameter, time of the pulse, the electromagnetic valve, filtration area, and injection pressures were 200 mm, 16 mm, 100 ms, 2″, 12–39 m2, and 0.1–0.4 MPa, respectively.

3. Results and Discussion

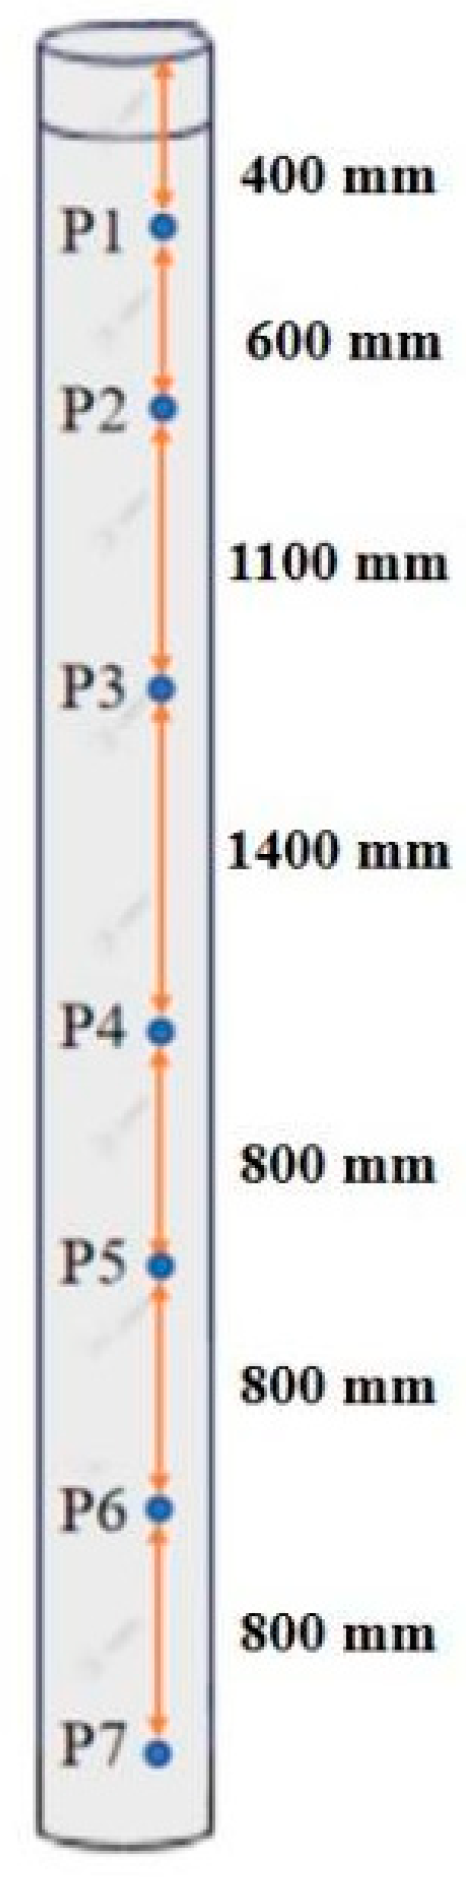
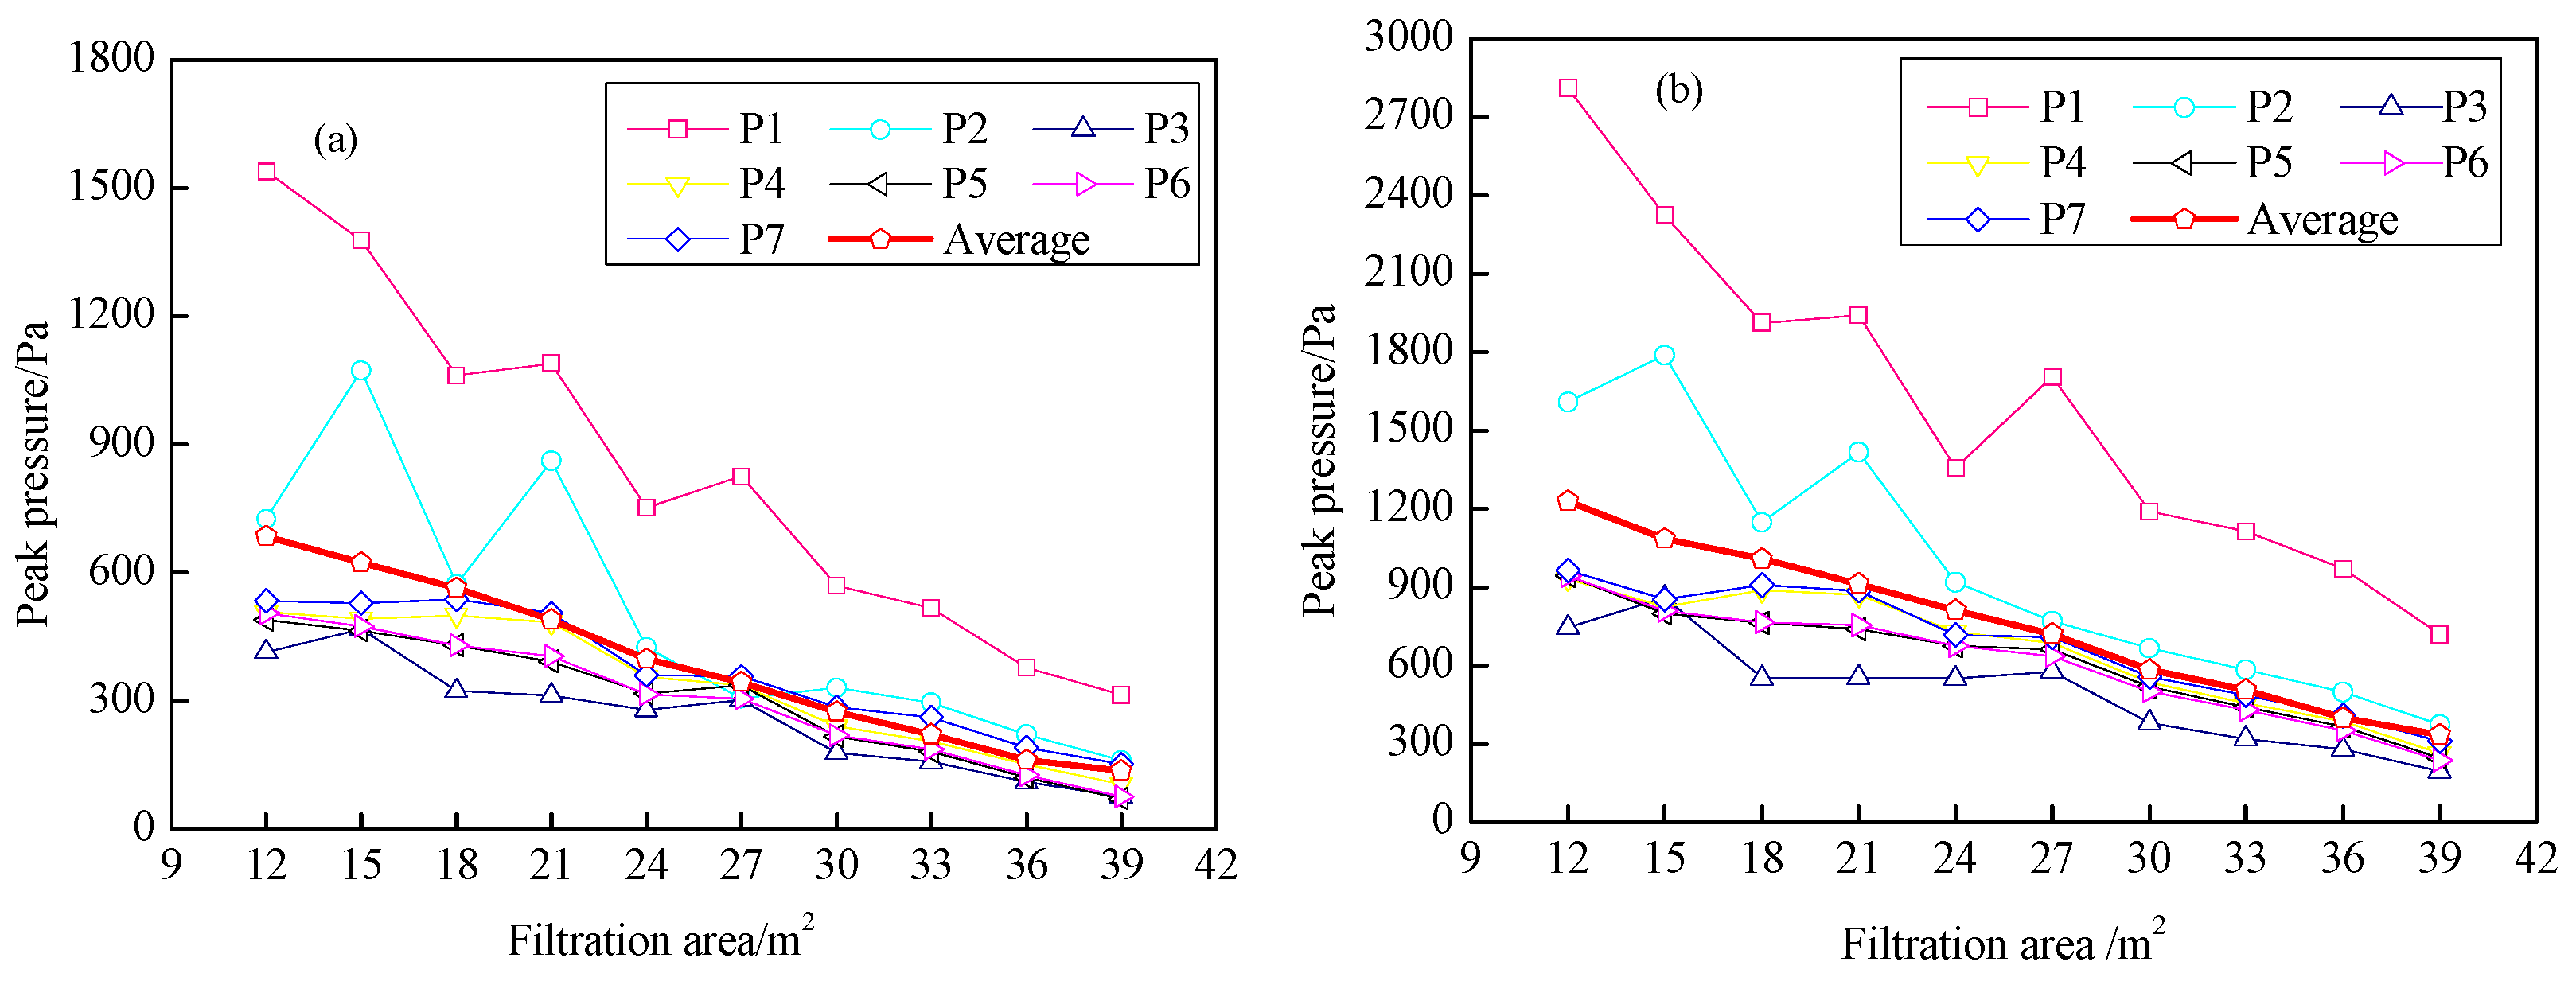
3.1. Research on the Peak Pressure Law

The peak pressures were obtained at a jet distance of 200 mm, nozzle diameter of 16 mm, with different injection pressures (0.1–0.4 MPa) and different filtration areas (12–39 m2) shown in Figure 4.
According to Figure 4a–d, for all the pulse pressures, the filtration areas from 12 to 24 m2, the peak pressures in the bag filter outside walls decreased with filtration area (all points), the filtration areas from 24 to 27 m2, the peak pressures of different points increased briefly and then decreased with the increase of filtration areas to 39 m2.
As shown in Figure 4e, the average values of the pressure peaks of different points under different injection pressures and filtration areas were extracted separately and reflected the influence of the filtration area controlled by an electromagnetic valve on the peak pressure of the sidewall. First, the peak pressures increased with injection pressures; this trend agrees with the results obtained by Lin et al. [9] and Döring et al. [20]. Second, in filtration areas from 12 to 39 m2, the peak pressure declined gradually. From the inclination of the line in Figure 4e, in the filtration areas from 27 to 30 m2, the change was larger than other changes, and for the filtration areas from 24 to 27 m2, the peak pressure was increased. Finally, the pressure peaks obtained by increasing injection pressures can also be achieved by reducing the filtration area controlled by the electromagnetic valve. When the injection pressure was 0.4 MPa and the filtration area was 39 m2, the average peak pressure along the bag filter was about 900 Pa. Therefore, for an average peak pressure of 900 Pa, we can choose an injection pressure of 0.3 Mpa and a filtration area controlled by an electromagnetic valve of 33 m2 or an injection pressure of 0.2 Mpa and a filtration area controlled by an electromagnetic valve of 21 m2. When the injection pressure was 0.3 Mpa and the filtration area was 39 m2, the average peak pressure along the bag filter was about 600 Pa. Thus, for an average peak pressure of 600 Pa, we can choose an injection pressure of 0.2 MPa and a filtration area controlled by an electromagnetic valve of 30 m2 or an injection pressure of 0.1 MPa and a filtration area of 15 m2. When the injection pressure was 0.2 MPa and the filtration area was 39 m2, the average peak pressure along the bag filter was about 375 Pa. Hence, for an average peak pressure of 375 Pa, we can choose an injection pressure of 0.1 MPa and a filtration area of 27 m2.
These results show that in order to reduce energy consumption, the filtration area controlled by an electromagnetic valve can be reduced while maintaining adequate dust cleaning performance.

3.2. Dust-Cleaning Intensity

As shown in Figure 5, two straight lines parallel to the abscissa axis indicate that the peak pressures were 600 Pa and 5000 Pa. The peak pressure in this range can not only achieve adequate cleaning performance but also ensure the bag filter will not be damaged. The other two broken lines represent the maximum and minimum values of the peak pressure of the side wall under different filtration areas. The area between the two lines is the range of the peak pressure of the side wall and represents a filtration area controlled by an electromagnetic valve that can meet the requirements of effective cleaning performance under different injection pressures, while the other area indicates the filtration area controlled by an electromagnetic valve which cannot meet the ash removal requirements.
As can be seen from Figure 5a, when the injection pressure was 0.1 MPa, the filtration areas controlled by a 2″ electromagnetic valve were 12–39 m2, and the minimum peak pressures were all below 600 Pa. Even when the filtration area was larger than 30 m2, the maximum peak pressures could not reach 600 Pa, i.e., under the condition of injection pressure of 0.1 MPa, the filtration areas between 12–39 m2, the system could not meet the cleaning performance requirements. Therefore, the filtration area controlled by a 2″ electromagnetic valve cannot be used with a 0.1 MPa injection pressure for the dust cleaning experiment.
In Figure 5b, when the injection pressure was 0.2 MPa, the filtration area controlled by a 2″ electromagnetic valve was 12–15 m2, all the minimum peak pressures were over 600 Pa, and the maximum peak pressure was less than 5000 Pa, which can meet the cleaning requirements. When the filtration area controlled by an electromagnetic valve exceeds 15 m2, although the maximum peak pressure was less than 5000 Pa, the minimum peak pressure was less than 600 Pa, which cannot achieve the required effect of cleaning.
As seen in Figure 5c, when the injection pressure was 0.3 MPa, the filtration area controlled by a 2″ electromagnetic valve were 12–27 m2 and could meet the cleaning requirements. When the filtration area controlled by an electromagnetic valve exceeds 27 m2, the minimum peak pressure was less than 600 Pa, which would lead to failure of achieving the cleaning requirements.
As shown in Figure 5d, when the injection pressure was 0.4 MPa, the filtration areas controlled by a 2″ electromagnetic valve were 12–15 m2, although the minimum peak pressures were all more than 600 Pa, and the maximum peak pressure exceeded 5000 Pa. Therefore, in practical applications, the bag filter will be severely damaged in this condition. When the filtration areas controlled by a 2″ electromagnetic valve were 15–33 m2, the cleaning requirements could be met. When the filtration area controlled by an electromagnetic valve exceeds 33 m2, the minimum peak pressure is less than 600 Pa, which would cause ineffective cleaning.

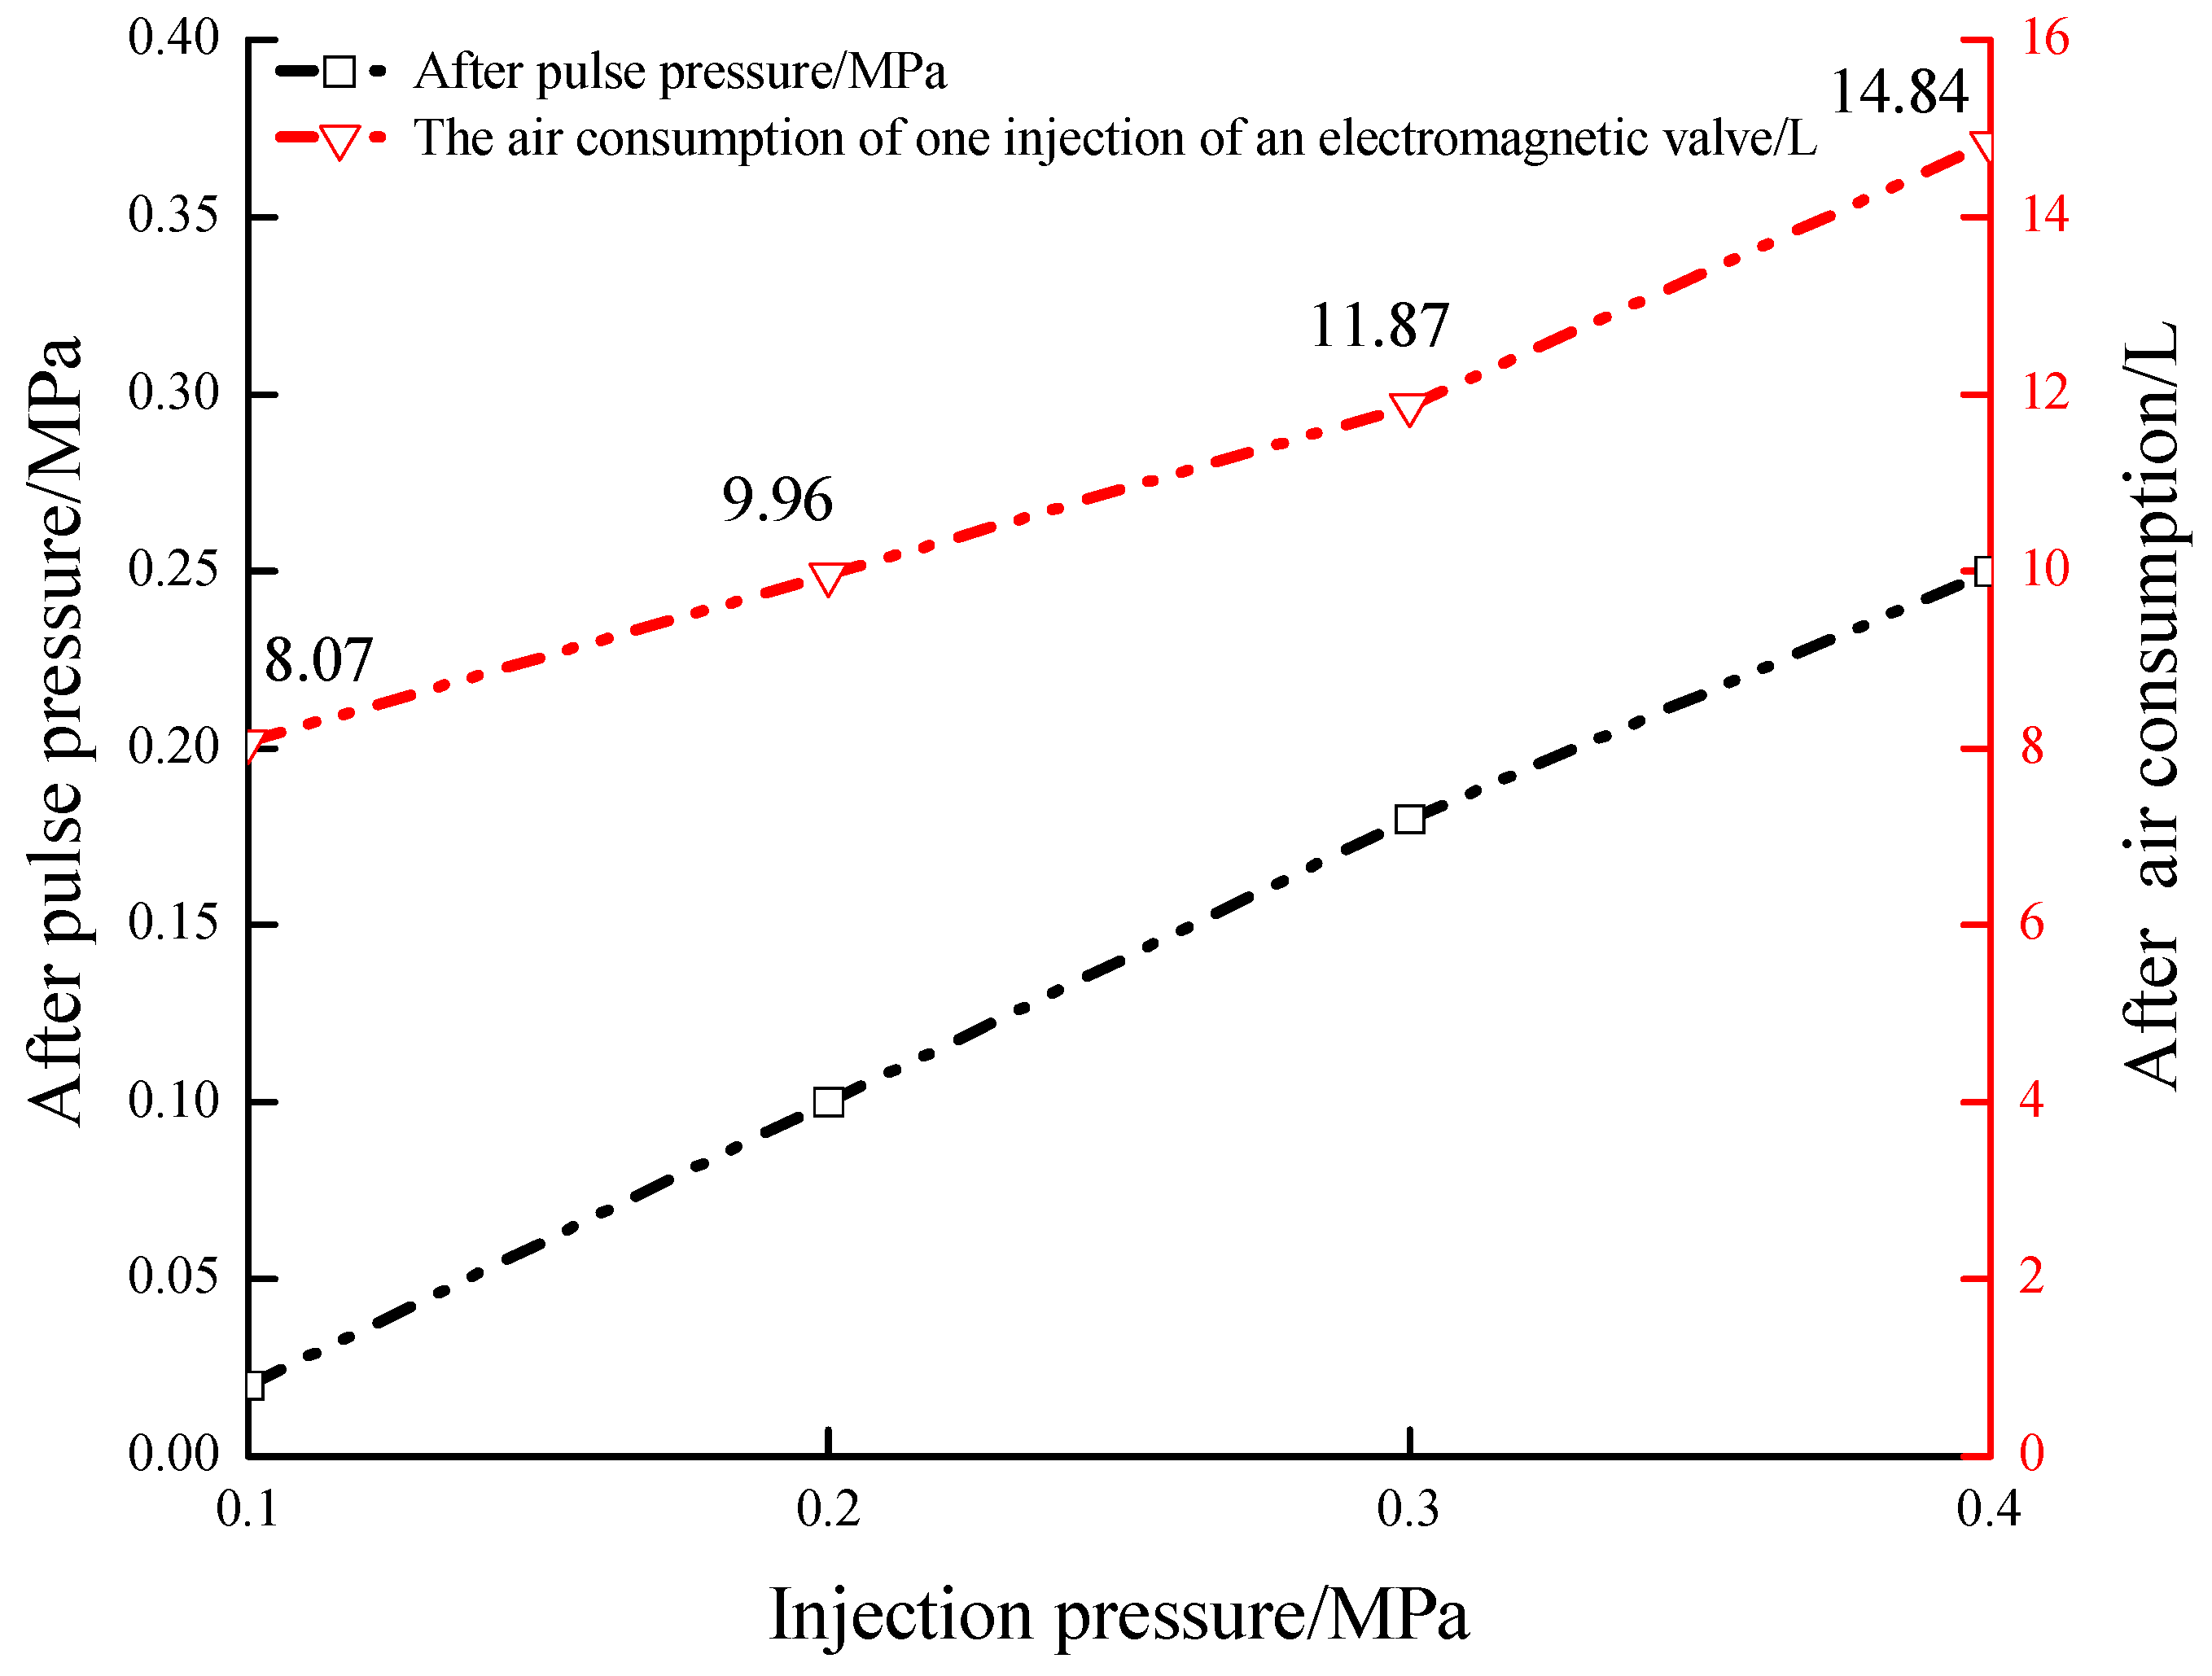
3.3. Ash Removal Uniformity and One Injection of the Electromagnetic Valve

Another factor that determines the effect of cleaning performance is the uniformity of ash removal. Variance and standard deviation are the indexes to be used to measure the deviation of a set of data from the average; they can measure the stability and uniformity of the data. The larger the variance and standard deviation are, the more unstable and the greater the fluctuation of the data will be, which means the worse the uniformity will be. In this paper, variance and standard deviation are used to indicate the uniformity of dust cleaning; there is no standard value, so it can be considered that the smaller the value, the better the uniformity. For injection pressures from 0.1 to 0.4 MPa, the standard deviation and variance of peak pressures under different filtration areas controlled by electromagnetic valves are shown in Table 1 and Table 2.
As described in Table 1 and Table 2, when the injection pressure is kept constant, the standard deviation and variance decrease with an increase in the filtration area. At a certain filtration area, the standard deviation and variance increase with an increase in injection pressure. Thus, in this experiment, when the injection pressure is 0.2 MPa, the filtration area controlled by the electromagnetic valve should be selected as 15 m2; when the injection pressure is 0.3 MPa, the filtration area controlled by the electromagnetic valve should be chosen as 27 m2, and when the injection pressure is 0.4 MPa, the filtration area controlled by electromagnetic valve should be chosen 33 m2.
As observed from Figure 2, when the injection pressures were 0.2, 0.3, and 0.4 MPa, the air consumptions of one injection of an electromagnetic valve were 9.96 × 10⁻³, 11.87 × 10⁻³, and 14.84 × 10⁻³ m3. The calculated air consumption per unit filtration area controlled by the electromagnetic valve was as follows: 6.64 × 10⁻⁴, 4.40 × 10⁻⁴, and 4.50 × 10⁻⁴ m3∙m−2. Therefore, from the perspective of energy consumption, a filtration area controlled by an electromagnetic valve of 27 m2 at an injection pressure of 0.3 MPa should be preferentially selected. The second choice is a filtration area controlled by an electromagnetic valve of 33 m2 under an injection pressure of 0.4 MPa, and the last one is a filtration area controlled by the electromagnetic valve of 15 m2 under an injection pressure of 0.2 MPa.
The ash removal uniformity of a filtration area controlled by an electromagnetic valve of 33 m2 under an injection pressure of 0.4 MPa was compared with a 27 m2 filtration area controlled by an electromagnetic valve and injection pressure of 0.3 MPa. It was found that the injection pressure of 0.4 MPa (the filtration area controlled by the electromagnetic valve was 33 m2) produced more uniform ash removal than the injection pressure of 0.3 MPa (the filtration area controlled by the electromagnetic valve was 33 m2). Therefore, when controlling a dust collector with a larger filtration area, the injection pressure should be 0.4 MPa, and when the filtration area is relatively smaller, the injection pressure should be 0.3 MPa.

4. Conclusions

In this study, we investigated the synergistic effect of the filtration area and injection pressure on pulse-jet dust-cleaning performance. The conclusions drawn from this experimental study are summarized as follows:
(1) When the injection pressure was constant, for filtration areas from 12 to 39 m2, the peak pressures in the outside walls of the bag filter decreased with the filtration area increasing (all points) and exhibited degradation of ash removal uniformity. When the filtration area is kept constant, the higher the injection pressure, the greater the peak pressure, and the poorer the uniformity in the process of pulse cleaning. In order to reduce energy consumption, the filtration area controlled by an electromagnetic valve can be reduced while maintaining adequate dust cleaning performance.
(2) The injection pressure of 0.1 MPa cannot meet the cleaning performance requirements. Considering the uniformity of ash cleaning, the filtration area of 33 m2 under the injection pressure of 0.4 MPa should be preferentially selected. In consideration of the air consumption per unit filter area, the filtration area of 27 m2 under the injection pressure of 0.3 MPa should be preferentially selected.

Author Contributions

Conceptualization, J.L. and H.C.; methodology, Y.F.; software, S.H.; formal analysis, Y.F.; investigation, Y.F. and J.L.; resources, L.L.; data curation, Y.F.; writing—original draft preparation, Y.F.; writing—review and editing, Y.F. and J.L.; visualization, L.L.; supervision, J.L.; project administration, J.L.; funding acquisition, J.L. and H.C. All authors have read and agreed to the published version of the manuscript.

Funding

This work was supported by the Southwest University of Science and Technology (22zx7168) and the Sichuan Science and Technology Program (No. 2023YFS0362).

Institutional Review Board Statement

Not applicable.

Informed Consent Statement

Not applicable.

Data Availability Statement

Data are contained within the article.

Acknowledgments

The authors are grateful to the reviewers who helped them improve the paper with many pertinent comments and suggestions.

Conflicts of Interest

The authors declare that they have no known competing financial interests or personal relationships that could have appeared to influence the work reported in this paper.

References

  1. Pang, L.; Cao, J.; Xiao, Q.; Yang, K.; Shi, L. Explosion propagation in a dust removal pipeline under dust collector explosion. J. Loss Preven. Proc. 2021, 74, 104662. [Google Scholar] [CrossRef]
  2. Furumoto, K.; Narita, T.; Fukasawa, T.; Ishigami, T.; Kuo, H.P.; Huang, A.N.; Fukui, K. Influence of pulse-jet cleaning interval on performance of compact dust collector with pleated filter. Sep. Purif. Technol. 2021, 279, 119688. [Google Scholar] [CrossRef]
  3. Li, S.; Zhou, F.; Xie, B.; Wang, F. Influence of injection pipe characteristics on pulse-jet cleaning uniformity in a pleated cartridge filter. Powder Technol. 2018, 328, 264–274. [Google Scholar] [CrossRef]
  4. Meinke, P.; Raether, T. Evolution of cartridge dust collecting technology. Sep. Purif. Technol. 2002, 39, 24–26. [Google Scholar]
  5. Yan, C.P.; Zhang, M.X.; Lin, L.Y.; Chen, H. An analysis of a reverse pulse cleaning process using high-flow pleated fabric filter cartridges. Process Saf. Environ. 2018, 113, 264–274. [Google Scholar]
  6. Ren, L.; Yuan, N.; Lin, L.; He, C.; Tang, C.; Xu, Z. Effect of jet airfow defection on cleaning performance of flter cartridge. Environ. Sci. Pollut. R. 2022, 29, 27510–27520. [Google Scholar] [CrossRef] [PubMed]
  7. Chen, S.W.; Chen, D.R. Annular-slit nozzles for reverse flow cleaning of pleated filter cartridges. Sep. Purif. Technol. 2017, 177, 182–191. [Google Scholar] [CrossRef]
  8. Zhang, Q.; Liu, D.; Hu, A.J.; Xu, H.L.; Chen, H.Y. Flow field and pressure characteristics in pulse-jet dust cleaning. Int. J. Environ. Sci. Technol. 2022, 20, 6735–6746. [Google Scholar] [CrossRef]
  9. Lin, L.; Liu, T.; Yuan, N.; Xu, Z.; Chen, H. Study on the influence of venturi on the cleaning performance of elliptical filter cartridge. Powder Technol. 2021, 377, 139–148. [Google Scholar] [CrossRef]
  10. Litchwark, J.O.; Winchester, J.; Nijdam, J.J. Design of pulse-jet systems for milk powder baghouses. Powder Technol. 2015, 284, 379–386. [Google Scholar] [CrossRef]
  11. Yuan, N.; Ren, L.; Wang, B.; Teng, D.; Li, P.; Xu, Z.; Li, Y.; Chen, H.; Lin, L. Experimental study on the effects of diversion device on pulse-jet cleaning of horizontal filter cartridge. Process Saf. Environ. 2021, 145, 247–254. [Google Scholar] [CrossRef]
  12. Tanabe, H.; Barros, P.M.; Rodrigues, K.B. Experimental investigation of deposition and removal of particles during gas filtration with various fabric filters. Sep. Purif. Technol. 2011, 80, 187–195. [Google Scholar] [CrossRef]
  13. Humphries, W.; Madden, J.J. Fabric filtration for coal-fired boilers: Dust disparagement in pulse jet filters. Filtr. Sep. 1983, 20, 40–44. [Google Scholar]
  14. Lǖ, J.; Yan, C.P.; Fu, Y.; Chen, H. Influence of injection pipe on dust-cleaning performance of bag filter. Chin. J. Environ. Eng. 2017, 3, 1667–1671. (In Chinese) [Google Scholar]
  15. Wang, Q.; Zhang, M.; Lai, X.; Chen, H.; Qian, Y. Effective dust cleaning intensity of high temperature filter bag. Chin. J. Environ. Eng. 2015, 9, 1318–1322. (In Chinese) [Google Scholar]
  16. Li, J.; Wu, D.; Wu, Q.; Luo, M.; Li, J. Design and performance evaluation of novel colliding pulse jet for dust filter cleaning. Sep. Purif. Technol. 2019, 213, 101–113. [Google Scholar] [CrossRef]
  17. Kavouras, A.; Krammer, G. A model analysis on the reasons for unstable operation of jet-pulsed filters. Powder Technol. 2005, 154, 24–32. [Google Scholar] [CrossRef]
  18. Tsai, C.J.; Lu, H.C. Numerical and experimental study of cleaning process in pulse-jet fabric filtration systems. J. Aerosol Sci. 1996, 30, 3243–3249. [Google Scholar] [CrossRef]
  19. Amano, H.; Watanabe, H.; Ikeno, H.; Suzuki, T.; Sintokogio Ltd. Apparatus for Collecting Dust and a Pleated-Type Filter Therefor. U.S. Patent No. 8,062,396, 22 November 2011. [Google Scholar]
  20. Döring, N.; Meyer, J.; Kasper, G. The influence of cake residence time on the stable operation of a high-temperature gas filter. Chem. Eng. Sci. 2009, 64, 2483–2490. [Google Scholar] [CrossRef]
  21. Yan, C.P.; Liu, G.J.; Chen, H.C. Effect of induced airflow on the surface static pressure of pleated fabric filter cartridges during pulse jet cleaning. Powder Technol. 2013, 249, 424–430. [Google Scholar] [CrossRef]
  22. Lu, H.C.; Tsai, C.J. A Pilot-Scale Study of the Design and Operation Parameters of a Pulse-Jet Baghouse. Aerosol. Sci. Technol. 1998, 29, 510–524. [Google Scholar] [CrossRef]
  23. Park, S.; Joe, Y.H.; Shim, J.; Park, H.; Shin, W.G. Non-uniform filtration velocity of process gas passing through a long bag filter. J. Hazard. Mater. 2019, 365, 440–447. [Google Scholar] [CrossRef] [PubMed]
Figure 1. Schematic diagram of the experiment system.
Atmosphere 15 00510 g001
Figure 2. Air consumption of one injection of electromagnetic valve with different injection pressures.
Atmosphere 15 00510 g002
Figure 3. Sensor location in a bag filter.
Atmosphere 15 00510 g003
Figure 4. The relationship between the peak pressure and the different filtration area, (a) 0.1 MPa, (b) 0.2 MPa, (c) 0.3 MPa, (d) 0.4 MPa of injection pressure. (e) the average values of the pressure peaks of different points under different injection pressures and different filtration areas were extracted separately and reflected the influence of the filtration area controlled by an electromagnetic valve on the peak pressure of the sidewall.
Atmosphere 15 00510 g004aAtmosphere 15 00510 g004b
Figure 5. The relationship between the peak pressures and the different filtration areas, (a) 0.1 MPa, (b) 0.2 MPa, (c) 0.3 MPa, and (d) 0.4 MPa of injection pressure.
Atmosphere 15 00510 g005
Table 1. Standard deviation under different filtration areas.
Injection Pressures/(MPa)Standard Deviation under Different Filtration Areas
12 m215 m218 m221 m224 m227 m230 m233 m236 m239 m2
0.1----------
0.20.3380.311--------
0.30.3580.3120.3020.2740.2640.252----
0.4-0.3980.3720.3510.3360.3250.260.246--
Table 2. A variance under different filtration areas.
Injection Pressures/(MPa)A Variance under Different Filtration Areas
12 m215 m218 m221 m224 m227 m230 m233 m236 m239 m2
0.1----------
0.20.1140.096 -------
0.30.1280.0970.0910.0750.0700.064----
0.4-0.1580.1380.1230.1130.1060.0680.061--
Disclaimer/Publisher’s Note: The statements, opinions and data contained in all publications are solely those of the individual author(s) and contributor(s) and not of MDPI and/or the editor(s). MDPI and/or the editor(s) disclaim responsibility for any injury to people or property resulting from any ideas, methods, instructions or products referred to in the content.

