Article

Inactivation Mechanisms of Escherichia coli in Simulants of Respiratory and Environmental Aerosol Droplets

1
School of Chemistry, University of Bristol, Bristol BS8 1TS, UK
2
Defence Science Technology Laboratory (DSTL), Porton Down, Salisbury SP4 0JQ, UK
3
School of Earth and Atmospheric Sciences, Queensland University of Technology, Brisbane 4067, Australia
*
Author to whom correspondence should be addressed.
Atmosphere 2024, 15(4), 511; https://doi.org/10.3390/atmos15040511
Submission received: 4 March 2024 / Revised: 3 April 2024 / Accepted: 16 April 2024 / Published: 22 April 2024
(This article belongs to the Special Issue Atmospheric Bioaerosols: Detection, Characterization and Modelling)

Abstract

:
The airborne transmission of disease relies on the ability of microbes to survive aerosol transport and, subsequently, cause infection when interacting with a host. The length of time airborne microorganisms remain infectious in aerosol droplets is a function of numerous variables. We present measurements of mass and heat transfer from liquid aerosol droplets combined with airborne survival data for Escherichia coli MRE162, an ACDP category 1 microorganism used as a model system, under a wide range of environmental conditions, droplet compositions and microbiological conditions. In tandem, these companion measurements demonstrate the importance of understanding the complex relationship between aerosol microphysics and microbe survival. Specifically, our data consist of the correlation of a wide range of physicochemical properties (e.g., evaporation rates, equilibrium water content, droplet morphology, compositional changes in droplet solute and gas phase, etc.), with airborne viability decay to infer the impact of aerosol microphysics on airborne bacterial survival. Thus, a mechanistic approach to support prediction of the survival of microorganisms in the aerosol phase as a function of biological, microphysical, environmental, and experimental (aerosol-generation and sampling) processes is presented. Specific findings include the following: surfactants do not increase bacteria stability in aerosol, while both the bacteria growth phase and bacteria concentration may affect the rate at which bacteria decay in aerosol.

1. Introduction

The development of mitigation strategies, designed to reduce the airborne transmission of disease, requires the use of epidemiological models to predict the outcome of various approaches. However, as the complex, dynamic, and highly variable nature of disease transmission through respiratory particles has gradually come to light [1], it has become increasingly clear that such models are severely limited. A particular issue comes from the emergence of new pathogens, which cannot be accurately parameterised within transmission models until laborious and time-consuming laboratory work has been carried out evaluating the airborne response of a pathogen to a long list of different parameters (as was recently the case for SARS-CoV-2 [2]). The ability to expedite this process would be valuable, but doing so requires a more fundamental understanding of the processes that occur within airborne respiratory particles, the interconnectivity of these processes, and how these processes can be expected to impact different pathogens. Developing this deeper understanding is challenging and requires novel approaches [3].
Solute concentration [4], droplet size [5], temperature, oxidative stress, microbial concentration, particle phase and morphology, and surface-to-volume ratio have all been hypothesised to affect bacterial viability in aerosols. Previous studies have found rapid changes in particle phase with sudden reductions in the airborne bacteria survival [3]. Although the impact of particle phase and surface properties on the survivability of airborne microbes has not yet been completely explored, it has been demonstrated to play an important role in the optical properties of aerosols which in turn affects radiative forcing and climate [6,7], and the rates of atmospheric chemistry at the surface of aerosol particles [8]. The optical properties and surface chemistry of respiratory particles could be expected to impact the viability of microbes within the particle and so these properties should be explored.
Recent studies indicate that the enrichment of bacteria on droplet surface is detrimental to bacterial airborne viability, with oxidative stress appearing to be at least partly responsible for the loss of viability of E. coli in droplets of bacterial growth media [9]. Conversely, the high pH of respiratory aerosol (due to the evaporation of bicarbonate in the form of CO2) can drive the loss of viral (SARS-CoV-2) infectivity in the aerosol phase, while oxidative stress has no effect [10,11]. Both high pH and surface enrichment effects play a role in the airborne stability of the bacterial pathogen Streptococcus pyogenes [12]. Further complexities, such as the effect that air pollution (e.g., secondary organic aerosol) altering the droplet composition has on bacteria decay in aerosol, remain an area with limited reporting.
In this study, a comprehensive and robust in vitro approach is used to expand upon these general observations through measurements of the culturability of bacteria (E. coli) in simulants of aerosolised respiratory and environmental fluids. The approach taken in this study combines two technologies that allow for both the independent measurement of the physicochemical properties of droplets [13], and the quantification of the loss of microbe viability in comparable droplets (in both size and composition) on the same time scales (from <5 s to 10 s of minutes) [3]. Through this combined approach, predictions of longevity are possible through a better understanding of the underlying mechanisms of bacterial inactivation. Here, E. coli (specifically MRE-162 [14]) was selected as a bacterial model to support the mechanistic understanding of bacterial survival in the aerosol phase.

2. Materials and Methods

2.1. Bacterial Strain and Culture Method

Escherichia coli MRE162 was obtained as a kind donation from Defence Science & Technology Laboratories (Dstl, Porton Down, Salisbury, UK).
Stock cultures of E. coli MRE-162 with a microbial concentration of 1.4 ± 0.2 × 10⁹ (mean ± standard deviation) colony forming units (CFU) mL−1 were maintained at −20 °C in LB broth containing 20% (w/w) glycerol. Routinely, 200 µL of LB broth was inoculated with 2 μL of E. coli MRE-162 stock and cultured at 180 rpm and 37 °C for ~24 h until reaching the stationary phase, producing a concentration of 2.7 ± 1.7 × 10⁹ CFU mL−1. In this work, the average CFUs per droplet obtained in levitation periods under 7 s was used as the control measurement for data normalisation.

2.2. Microbial Media

The Luria–Bertani (LB) broth was prepared by dissolving 5 g of yeast extract (Sigma-Aldrich Ltd., Irvine, UK), 10 g of NaCl (Fisher Scientific, Leicestershire, UK), and 10 g of tryptone (VWR International Ltd., Leicestershire, UK) in 1000 mL of sterilised deionised (DI) water, followed by sterilisation in an autoclave (Classic, Prestige Medical, Blackburn, UK). Luria agar was prepared by adding 20 g L−1 of granulated agar (BD DifcoTM Dehydrated Culture Media, Fisher Scientific, Leicestershire, UK) prior to sterilisation.
The Luria–Bertani agar was prepared by adding 20 g L−1 of granulated agar (BD DifcoTM Dehydrated Culture Media, Fisher Scientific, Leicestershire, UK) to the LB broth solution before autoclaving.
Phosphate-buffered saline (PBS) was prepared by dissolving 1 tablet of PBS (Dulbecco A, Thermo Scientific Oxoid, Basingstoke, UK) in 100 mL of distilled water. The formula contains 8 g L−1 of sodium chloride, 0.2 g L−1 of potassium chloride, 1.15 g L−1 of di-sodium hydrogen phosphate, and 0.2 g L−1 of potassium dihydrogen phosphate. Thus, the mass of solute for PBS is 9.506 g.
Artificial saliva and artificial sputum media were prepared from powdered chemicals. The compositions are presented in Tables S1 and S2, respectively. Both artificial secretions have been reported in the literature as surrogates for in vitro simulation studies [15,16]. Specifically, 5.98 g of the artificial saliva powder and 2.21 g of the artificial sputum powder were dissolved in 100 mL of deionised water. From these neat solutions, 1:10 dilutions for both artificial sputum and saliva were prepared in distilled water.

2.3. Sample Preparation for Studies of Bioaerosol Survival and Aerosol Dynamics

For hygroscopicity measurements, non-metabolised LB broth (i.e., broth that has not had bacterial growth) and PBS solutions with concentrations of 25 and 9.506 g L−1 were diluted to 1% w/w solute in water for evaporation measurements. In the case of artificial respiratory secretions, dilutions of 1 and 5% w/w solute and 1 and 2% w/w solute in water were prepared for the hygroscopicity measurements for artificial saliva and artificial sputum, respectively.
For survival measurements, the original LB broth stationary phase cultures were used to prepare ten-fold serial dilutions in LB broth and PBS, giving a bacterial concentration of (2.32 ± 0.6) × 108 CFU mL−1 (28 ± 11 CFU droplet−1). In the case of PBS bacteria suspensions, 1 mL of the original LB broth bacterial culture was centrifuged and resuspended in 1 mL of PBS, then 100 μL were transferred into 900 μL of sterile PBS. For survival measurements in artificial respiratory secretions, 1 mL of the original culture was resuspended in the specific artificial fluid (artificial saliva, diluted saliva, artificial sputum, and diluted sputum), and finally, a 10-fold dilution was prepared in fresh artificial fluid. All samples were vortexed for 10 s before being introduced in the droplet-on-demand (DoD) to ensure homogenisation.
For the studies with LB broth bacteria solutions containing surfactants, LB broth solutions were saturated by adding 0.0203 g of heptadecanol (Acros Organics, Fisher Scientific, UK), 0.0100 g of 1,2-dypalmitoyl-rac-glycero-3-phosphocholine (DPPC) (Insight Biotechnology, UK), and 1.5363 g of Tween80 (Acros Organics, Fisher Scientific, UK) to 10 mL, 3 mL, and 10 mL of sterile LB broth, respectively. Then, the maximum amount of surfactant was dissolved by vortexing the samples for 2 min, sonicating for 15 min, and filtering by using 0.22 μm-pore-size sterilised filters (JET Biofil/Appleton Woods Ltd., Birmingham, UK). For measurements of evaporation kinetics and survival, 1 mL of the original LB broth-grown bacterial culture was centrifuged and resuspended in 1 mL of the corresponding LB broth surfactant solution. For the dynamic measurements with the water solutions saturated with surfactants, samples were prepared by saturating 5 mL of DI water samples with the different surfactants followed by vertexing, sonicating, and filtering, as previously described for the saturated LB broth solutions.

2.4. Complementary Aerosol Analysis Technique to Investigate the Interplay between Aerosol Microphysics and Bioaerosol Survival

A transformative approach to investigate the fundamental mechanisms that drive survival within aerosol droplets through equilibration and decay in the aerosol phase [3]. Briefly, two different technologies were combined to independently resolve the complex inter-dependence of the physicochemical and biological processes taking place during a droplet lifetime, from the production through to the inhalation:
  • The comparative kinetic electrodynamic balance (CK-EDB) is used to study thermodynamically and kinetically driven changes in the properties of a single levitated aerosol particle [13]. Changes in the size, composition, hygroscopicity, morphology, and droplet formation process of aqueous aerosol droplets containing mixtures of organic and inorganic solutes can be measured with great accuracy over a short timescale at a high time resolution (~100 Hz) with this technique. A comprehensive description of the experimental setup and operation of the CK-EDB has been discussed previously [13].
  • The determination of survival fractions for populations of airborne microorganisms as a function of environmental conditions, bioaerosol composition and other biological factors (e.g., microbe age) is performed with a novel instrument described as controlled electrodynamic levitation and extraction of bioaerosol onto a substrate (CELEBS). This instrument is also utilised in these studies as a particle preparation technique for SEM off-line microscopy, where particles are levitated and subsequently deposited into an empty petri dish containing a polycarbonate filter paper. Details on the set-up, operation and data analysis of CELEBS have been previously reported [3,10,11].
The complementarity of the two aerosol analysis techniques when replicating conditions in both instruments enables the correlation of aerosol microphysics measurements with their downstream biological impacts, aiming to explore the potential inactivation mechanisms of microorganisms in the aerosol phase. This innovative approach to study bioaerosol survival enables a detailed understanding of the synergistic interaction between the physicochemical and biological processes that occur within a droplet from generation through to equilibrium with the surrounding atmosphere. Improving the understanding of how the dynamics of real respiratory fluids can affect a range of respiratory pathogens such as SARS-CoV-2, Neisseria meningitidis, Streptococcus pneumoniae, and Mycobacterium tuberculosis, will aid in the improvement of effective prevention policies.
Here, only a brief overview of each step of the methodology is presented. Information about media, culture, sample preparation, and data analysis are provided in the Supplementary Information material (SI).

2.5. Bioaerosol Generation with Droplet-on-Demand Dispensers

Both the CK-EDB and CELEBS instruments use MicroFab (MJ-APB-01, Plano, TX, USA) micro-dispensers for the generation of aerosol particles that has no impact on the viability of the microorganisms within. A small volume (<11 µL) of solution of known composition is transferred into the reservoir of the droplet dispenser. Droplets with an initial radius of 20–25 µm are formed by applying a square pulse voltage to the piezoelectric crystal of the device. To enable the controlled trapping of the particles, a small net charge (less than 5 fC) is imparted in each droplet during formation by the presence of a high-voltage induction electrode. The electrodynamic fields contained in the CK-EDB and CELEBS chambers allows for the confinement and conditioning of the charged aerosol droplets during levitation.

2.6. Bioaerosol Microphysics

The CK-EDB chamber is composed of two pairs of concentric cylindrical electrodes aligned vertically one above the other. The relative humidity (RH) inside the chamber is controlled by altering the ratio of humidified and dry-nitrogen airflows, and the temperature is set to 20 °C by recirculating fluid from a thermostatic water bath. An AC voltage (1 kV) is applied to the inner electrodes, creating an oscillating electrodynamic field where single particles with a net charge are held against lateral displacements. Trapped single particles are illuminated with a laser beam (λ = 532 nm) in the horizontal plane and the resulting elastic light scatter over an angular range of 32° to 58° near the forward scattering direction is recorded every 10 ms with a CCD camera. From the light scattering fringes, referred to as the phase function, it is possible to retrieve a wide range of the particles’ physicochemical properties, including evaporating kinetics, hygroscopicity properties, evolving particle morphology [13], and surface properties. Significant portions of the aerosol microphysics data are presented largely in the Supplemental Information section.

2.6.1. Determination of Aerosol Evaporation Kinetics

During the timescale that the droplet remains spherical and homogeneous, the angular separation between the bright and dark fringes of the phase function produce a regular pattern which is used to estimate the radius of the droplet, R, by using the previously described geometrical optics approximation (Equation (1)) [13,17,18]:
R = λ Δ φ c o s φ 2 + n s i n φ 2 1 + n 2 2 n c o s φ 2
where λ is the incident laser wavelength, φ is the central viewing angle, Δφ is the angular separation between the fringes (in radians), and n is the droplet refractive index (RI). The droplet radius is calculated with an accuracy of ±100 nm following this approach.
The RI is initially set at a constant of 1.335, and the value for a droplet of pure water composition at 532 nm. As the water evaporates from the droplet, the solute concentration increases, producing a variation in the droplet RI. The change in solute concentration as a function of time can be determined using the initial concentration loaded in the DoD and the droplet volume calculated from the radius measurements. By using the molar refraction mixing rule [19], the change in RI due to the increase in solute concentration can be calculated and the radius data can be corrected in a post-analysis step [20]. The molar refraction mixing rule assumes homogeneity in the composition of the droplet; however, surface enrichment occurring during rapid evaporation processes can lead to inhomogeneities in the droplet composition. The error in the radius data associated with the estimation of the refractive index increases due to surface enrichment. However, this uncertainty remains less than 5% and only affects the 0.1 last seconds of the droplet lifetime before crystallisation occurs [18].

2.6.2. Determination of Hygroscopicity Properties

The hygroscopic growth curve for each aerosol droplet composition was retrieved from comparative kinetics measurements of probe and sample droplets by using an experimental methodology previously described [17,21]. Briefly, two different DoD micro-dispensers generate a sequence of 10 pairs of probe and sample droplets with different chemical compositions at various set RHs. The evaporation profiles of the probe droplets (composed of either water or NaCl solution) are fitted with simulated evaporation profiles generated by using the mass transfer kinetic model developed by Kulmala et al. [21] in order to accurately determine the RH in the gas phase of the CK-EDB chamber.
The error associated with the retrieval of the gas-phase RH following this approach has been previously discussed [22]. Once the RH is determined, the radius data of the sample droplet is converted into particle mass by using a density parameterisation. Thus, the mass flux of water from the sample droplet can be calculated and the mass and heat transport equation from Kulmala [21] can be rearranged to solve for the water activity at the surface of the sample droplet. Finally, the whole hygroscopic curve provides the mass fraction of solute (mfs) dependence against the water activity of the droplet. In addition, the hygroscopic curves can be represented by the variation in GFr (ratio between wet and dry radius) and GFm (ratio between wet and dry mass) with the droplet water activity.

2.6.3. Simulations of Evaporation Kinetics

In order to predict the evaporation dynamics for a specific droplet solution at any initial solute concentrations, droplet radius, gas-phase RH, and temperature, a hygroscopicity parametrisation is developed by fitting the retrieved hygroscopicity properties from the comparative kinetics approach with the Kreindenweis equation [23]. Both the density and hygroscopicity parametrisations are then introduced in the mass transfer kinetics model of Kulmala, which enables the generation of thermodynamic simulations under a wide range of conditions which are in excellent agreement with the experimental data. Uncertainties associated with this approach have been previously discussed in the literature [22]. The interconnection between bioaerosol longevity and the changes in physicochemical parameters taking place during evaporation enables greater detail to be portrayed of the environment microorganisms experience within an aerosol droplet.

2.6.4. Determination of Particle Morphology

The method employed to estimate the particle morphology from the light scattering patterns of an individual aerosol droplet has been previously described [13]. The same phase function data used to estimate the particle size of an evaporating droplet were used to determine the particle/droplet morphology as a function of time. The developed algorithm, based on over one million phase function analyses, allows for differentiating among four main structures: homogenous droplet, droplet with inclusions, core-shell droplet, and crystal or inhomogeneous droplet, with an accuracy of >90% for droplets between ~3 and ~30 μm in radius. Briefly, the analysis of cumulative phase functions over time produces characteristic patterns that enable the determination of changes in the particle morphology as the droplet evaporates. Thus, homogeneous droplets present a regular and smooth evolution in the collective phase function peaks; a droplet with a core-shell structure differs from a homogeneous droplet in the presence of periodic fluctuations in the scattered light intensity of the phase function over time. The cumulative structure of droplets with inclusions shows a regular light scattering pattern characterised by the noise due to the variation in the location of the inclusions within the droplet and, finally, inhomogeneous droplets lack of any significant regular structure of the phase functions over time. These qualitative features in the time-dependent phase function patterns allow for the algorithm to identify changes in the particle morphology of evaporating individual droplets.

2.6.5. Measurements of Surface Enrichment

The Peclet number (Pe) provides an estimation of surface enrichment developing different final particle morphologies [24]. When the drying rate surpasses the diffusional solute mixing rate (Pe >> 1), the homogenous composition through the evaporation process is lost leading to a surface enrichment of the particles with bacteria cells. The value of the diffusion coefficient, D, of E. coli bacteria cells was reported in the literature as 1.2 × 10⁻¹² m2 s−1 [25]. Calculations of the corresponding Peclet numbers for each evaporation rate were obtained using Equation (2).
Pe = k8D
The evaporation rates, k, were calculated using Equation (3) as the variation in surface area over time [24] determined from the droplets’ diameters which were estimated using the model predictions from E-AIM as a function of RH [26]:
k = −d(d2)dt
Thus, combining the information from the drying rates with the diffusion coefficient of E. coli cells, it is possible to determine the Peclet number and the subsequent surface enrichment of E. coli on the particles as a function of the RH. Surface enrichment was verified experimentally through SEM analysis of evaporated and collected particles.

2.7. Bioaerosol Suspension, Sampling, and Survival Studies with the CELEBS System

The electrodynamic trap (EDT) used to levitate the aerosol when containing bacteria has a double-ring configuration where an AC potential (1000–2700 V) is applied to hold the charged droplets at the null point in the horizontal plane of the EDT between the two electrodes. The trapping region is isolated in a chamber containing a gas inlet to control the atmospheric conditions (i.e., RH, temperature, gas, etc.), while an LED light enables the enumeration of the levitated particles. After the desired suspension time, the sampling area is opened to access from the trapping region and the bioaerosol droplets are collected in a substrate holder. The CELEBS sampling process collects every droplet trapped in the EDT, while simultaneously reducing the impact on cell viability. Finally, the viability of the airborne microorganisms is measured offline, enumerated using growth on agar plates. Details on the determination of biological decay rates have been previously reported in the literature [3,9] and are included in the SI.
Bioaerosol sampling is performed in a petri dish containing a thin layer (>3 mm) of agar and 300 µL of an LB broth positioned in the centre of the plate. The substrate holder is then removed from the EDT chamber and the 300 μL of LB broth containing the bioaerosol particles is gently spread along the agar surface by using an L-shaped spreader. The Petri dishes are then incubated at 37 °C for 24 h in a static incubator before the enumeration of CFUs.
The determination of bioaerosol survival (BS) with the CELEBS system has been reported in our previous work [3,27]. The loss of culturability (the ability to form colonies in plating media) has been extensively used to represent bioaerosol survival as a function of time in aerobiology studies. The following equation was used to measure the viability loss due to the exposure to the aerosol phase:
% BS = Culturable(TEST)/Culturable(CONTROL) × 100
where Culturable(TEST) and Culturable(CONTROL) are the number of CFUs per droplet cultured after the set time interval and the control measurement used to normalise the survivability data. The normalisation can be carried out either by using the cell concentration per droplet obtained from the correlation with the cell concentration of the suspension loaded in the DoD dispenser or the CFUs per droplet reported after short levitation periods which did not impact the ability of bacteria to form CFUs after incubation. In this study, the average of CFUs per droplet in levitation periods under 7 s performed for a particular set of experiments in a day was used as the control measurement for data normalisation. Note that the new longevity data presented in this work were normalised using the number of CFUs per droplet after a suspension time under 5 s as the control measurement. For all droplet compositions, the impact of this short suspension period was negligible for bacterial viability; therefore, it is used as a non-exposure measurement for normalisation. This is a different comparison to our previous publication (ref) which used the absolute number of bacterial cells contained in the droplets, obtained from a correlation with the bacterial concentration introduced in the micro-dispenser as the control for normalisation [3,27].

2.8. Scanning Electron Microscopy (SEM) Analysis

Bioaerosol droplets containing E. coli MRE162 cells in water, LB broth and phosphate-buffered saline (PBS), and in artificial saliva were levitated for 120 s under different RHs in the CELEBS apparatus and subsequently sampled on an empty Petri dish containing one polycarbonate filter paper (Whatman® Nucleopore™, 25 mm, Sigma-Aldrich, UK) in the centre of the plate for particle collection. The filters containing the bioaerosol particles were coated with high-purity silver (High-Resolution Sputter Coater, Agar Scientific, UK) to a thickness of approximately 15 nm. A scanning electron microscope (SEM, JSM-IT-300 from JEOL, Akishima, Japan), with an acceleration voltage of 15 kV, and 10 and 15 mm working distances used to determine the different morphologies of the bioaerosol particles.

2.9. Statistical Analysis

To check if the differences between the two sample sets were significant, a two-tailed Students t-test was used throughout. If the p-value was found to be less than 0.05, then the difference was deemed significant.

3. Results

3.1. Measurements of Bacterial Longevity in Artificial Respiratory Droplets

E. coli MRE-162 (2.32 ± 0.6 × 10⁸ CFU ml−1) was aerosolised in different artificial respiratory and environmental fluids, and levitated at 20 °C and 30, 50, and 90% RHs for upwards of 10 min (Figure 1a–c). The residual survival percentages are compared to previously reported E. coli MRE-162 survival in PBS and LB broth droplets for reference [3]. After 20 s, the droplets can be assumed to have reached an equilibrium state. When the RH was set to 30%, the particles containing salts effloresced, resulting in the formation of solid/highly viscous particles (examples of which are shown in Figure 1d–g).
Under the driest conditions (30% RH), at 120 s the viability of E. coli MRE-162 was significantly lower in artificial saliva than in diluted artificial sputum (p < 0.01). It was not until 600 s that the any decay in the viability of E. coli occurs in diluted artificial sputum becomes significant (p < 0.05). At RHs of 50% and 90%, viability in diluted artificial sputum was significantly decreased after all the suspension times performed in this study (p values < 0.001 and <0.00001 for 120 s and 600 s, respectively, at 50% RH and <0.001 for 120 s and 600 s respectively at 90% RH). Only the longest levitation periods significantly impacted the survivability of airborne E. coli MRE162 in artificial saliva droplets (p values < 0.0001 and <0.05 at 600 s for 50 and 90% RH, respectively).
At 90% RH, the decay profile of E. coli in the LB broth, PBS, artificial saliva, and sputum were similar (Figure 1c). Droplets produced from artificial saliva and sputum will rapidly lose their initial bicarbonate, resulting in an increase in droplet pH from neutral (pH~7) to alkaline (pH > 10) in the first few minutes after droplet generation [10,11]. It is notable that this rapid increase in droplet pH does not result in a significant loss of E. coli MRE162 viability over 10 min. A similar trend was not observed for group A streptococcus [12]. This may reflect E. coli’s greater capacity to survive through stomach and intestine via an acid/alkaline shock response.
To compare the particle morphology of dried bioaerosol particles resulting from droplets with different starting compositions, we generated populations of bioaerosol particles and levitated them for one minute in different gas-phase RHs in the CELEBS system. Figure 1d–g shows the SEM and backscattered micrographs of different bioaerosol particle compositions obtained after evaporation under 10 and 30% RHs. On the right-hand column of Figure 1d–g, backscattered electron images highlight the elements with high (appear light) and low (appear dark) atomic weights which is useful to interconnect morphology with composition [28].
In the absence of a solute, the structure of agglomerated E. coli cells is clearly visible as a result of levitating the bacteria at a concentration of ~108 cells mL−1 (~10 CFUs per droplet) in water droplets at 30% RH (Figure 1d). Under 10% RH, the PBS solution droplets containing bacteria at a concentration of 109 cells mL−1 (~100 CFUs per droplet) show the formation of multiple crystals (Figure 1f). The backscattered images show that many of the bacterial cells are locked at the salt crystals’ surface, suggesting that they were at the droplet surface when the crystallisation event occurs; the exact percentage of the bacteria locked at the surface is unclear. This “locking at the surface” that is driven by the rapid efflorescence of PBS, coupled with bacterial surface enrichment during evaporation (Peclet number of 68.3), could be what drives the large difference in bacteria viability observed between 30% and 50% RH (Figure 1a vs. Figure 1b). The changes in particle structure of PBS droplets containing E. coli MRE162 between 10, 30, and 50% RH are presented in the SI (Figure S1). A clear diffusion of the bacteria from the crystal particle surface is observed with an increasing RH due to the longer crystallisation times, increasing the time period for bacteria to diffuse towards the centre of the droplets. This is consistent with the changes in longevity reported in our previous work [3].
Under 10% RH, the evaporation of LB broth solution droplets containing ~109 cells mL−1 leads to a more complex structure. Spherical microparticles with dendritic salt (NaCl) inclusions are formed and are more noticeable in the backscattered images (Figure 1e). LB broth consists of a complex mixture of salts and nutrients (40% and 60% by mass, respectively), wherein the organic fraction will maintain some water below the NaCl efflorescence point. Indeed, the resultant droplet can be expected to be a viscous liquid with suspended solids. Thus, unlike the PBS particles, there is no evidence that the bacteria are immobilised at the surface and the bacteria within the LB broth droplet at a low RH will maintain some degree of mobility [3]. The result of this mobility is that the bacteria are no longer observable at the surface, and this is consistent with a slight increase in bacterial viability.
The droplets composed of artificial saliva and E. coli cells at a concentration of 109 cells mL−1 (~100 CFU per droplet) show clear surface deformations resembling crumpled paper when dried at 30% RH (Figure 1g). The sharp contrast in equilibrated morphologies, when comparing with the rest of droplet compositions, could be the result of the presence of organics such as mucins [29].
The hygroscopic properties (e.g., rate of evaporation, equilibrium solute concentration, etc.) of a range of starting formulations (PBS, LB broth, NaCl, artificial saliva, and artificial sputum) were measured (Supplemental Figure S2). From these parameters, the rate of droplet evaporation across a broad range of environmental conditions for each of the starting formulations could be estimated (Supplemental Figures S3–S6). The biological decay outputs reported in Figure 1 were then correlated with various physicochemical properties of the different aerosol types (Supplemental Figure S7). In short, processes that appear to affect the likelihood that the bacteria are on the surface (droplet volume, surface-to-volume ratio, and droplet cooling due to rapid evaporation) correlate most with bacteria viability across all fluid compositions tested.

3.2. The Presence of Surfactants in LB Broth Droplets Has No Effect on Evaporation Kinetics or Airborne Bacterial Survival

Previous studies have explored the effect of monolayers of surface-active species on the mass transfer of water in aerosols, limiting the rate of water transport from and to the droplet, and impacting atmospheric processes [25,30,31]. Indeed, we have shown that the evaporation kinetics of droplets in the size regime studied (i.e., in the continuum regime at atmospheric pressure) here are only limited by the kinetics of water transport across the surface when a condensed and coherent monolayer film is able to form at the droplet surface; otherwise, evaporation is limited by the rate of gas phase diffusion of water away from the droplet.
To investigate the potential influence of surfactants on evaporation kinetics, three commercially available surfactants (Tween80, dipalmitoylphosphatidylcholine and heptadecanol, chemical structures shown in Figure S8) were saturated in the LB broth containing E. coli MRE-162 (~108 CFU mL−1). These solutions were then aerosolized into different gas-phase RHs (30, 50 or 70%; Figure 2a–c) where the evaporation kinetics were measured using the CK-EDB. Dipalmitoylphosphatidylcholine (DPPC) was included as an example of a component naturally occurring in lung epithelial lining fluid [32]. Tween80 is a common surfactant used in biological studies, while heptadecanol is a more well understood aerosol surfactant. The preparation of LB broth solutions containing surfactants and E. coli MRE-162 is described in the Sample Preparation for Bioaerosol Studies in the SI.
The data indicate that the mass transfer of water from the droplet is not limited by the addition of surfactants, as a similar evaporation rate to that observed for pure LB broth droplets is observed (black and magenta lines in Figure 2a–c). The data are presented in the form of a normalised change in the radius-squared at normalised time, t, relative to the initial droplet radius. The data are normalised to remove the effect of slight variations in the initial size of the droplets at generation and are consistent with the use of the often-applied radius-squared rule for steady droplet evaporation. Due to their insolubility in water, the starting (saturated) concentrations of surfactants in LB broth are far too low to affect the evaporation kinetics of the droplets. The presence of Tween80, which has the highest water solubility (5–10 g per 100 mL), shows a larger size once equilibration has been achieved due to the higher solute concentration present in the droplet, but, critically, does not kinetically limit the mass transfer of water at the surface. This is consistent with earlier work on long-chain alcohols which suggests that limitations to mass transfer rates only occur for droplets larger than 1 μm in diameter once a solid condensed film forms at the droplet surface. Tween80 is a water-soluble surfactant and as such appears to not limit the mass transfer of water across the surface of the droplet during evaporation.
The impact of the presence of surfactants on the viability of E. coli MRE-162 at a concentration of (2.6 ± 0.6) × 108 CFU mL−1 after being suspended at 50% RH for 300 s in surfactant saturated LB broth droplets is reported in Figure 2d. No significant difference in E. coli MRE-162 survival among bioaerosols containing saturated levels of surfactants and non-metabolised LB broth droplets was observed. This is consistent with the hypothesis that aerosol dynamics are affecting survival; the concentration of the surfactants is too low due to their solubility limit to affect aspects such as evaporation, phase morphology, and location of E. coli within the aerosol particle, and, thus, also survival.
To confirm the role of surfactants, the effect of the presence of different types of surfactants (Tween80, DPPC, heptanol, heptadecanol, decanol, octadecanol, pentadecanol, and tetradecanol) on the evaporation dynamics of saturated pure water solution droplets is reported in Figure S9. No impact on the mass transfer rates due to their low solubility was observed; insufficient surfactant molecules are contained in the droplet at the point of generation to coat the droplet surface and reduce evaporation. A comparison with droplets containing heptanol in a 1:1 water–ethanol mixture is included to show the discernible effect that a surfactant can have on the evaporation rate when at a sufficiently high concentration to form a complete and coherent solid film on the surface of the evaporating droplet. Here, the ethanol is added as a solubilising component that aids the dissolution of sufficient surfactant to generate a condensed organic film that impedes the kinetics of water transport through the surface layer.
Thus, it can be concluded that the concentrations of many surfactants in aerosolized droplets of 10s of micrometres in size are insufficient to impact on the mass transfer rates and consequently E. coli viability. This is a consequence of their often-low-solubility in water (Figure S8) and the continuum-dominated gas-diffusion-limited kinetics for mass transport. Alongside that, it is highly unlikely in the natural environment to have a starting solute concentration low enough such that the droplet can be reduced in size to the point that the surfactant will be able to form a monolayer on the droplet surface. Based on this evidence, surfactants will probably not affect the decay rate of bacteria or viruses in the aerosol phase through altering particle evaporation kinetics.

3.3. The Effect of Microbial Load on Airborne Bacterial Viability

While surfactants may not reach a sufficiently high concentration to hinder the bacteria from reaching the surface, it is possible for bacteria themselves to reach concentrations high enough to form a cellular monolayer. The effect of microbial load in bioaerosol droplets on survival has not yet been fully addressed in the literature. Lighthart and Shaffer reported survival in bacteria-containing particles that was three times higher when loaded with higher concentrations of microorganisms (note that in this study, Gram-negative bacteria were mixed with spores as a tracer; this may have impacted the result but was not controlled out in the study) [33]. The hypothesised reason for this survival increase is associated with the slower evaporation rates of the larger and more loaded bioaerosol droplets, which will eventually acquire a monolayer of microorganisms on the evaporative surface of the droplet. Consequently, the surface monolayer will protect the bacteria located in the deepest interior of the particle from the inactivation processes undergone at the air–particle interface [34]. Notably, for droplets of typical size in previous study and this study, i.e., in the continuum regime where evaporation is limited by the gas diffusion rate, it is unlikely that the evaporation rate is altered, although an exclusion of some bacteria from the surface due to a highly populated surface by bacteria is possible at a high bacterial load.
The evaporation dynamics of LB broth droplets containing different bacterial concentrations ranging over five orders of magnitude (from 105 to 1010 cells mL−1) into a gas-phase RH of 30% are shown in Figure 3a. Each evaporation curve represents the average of 6, 15, 4, 2, 4, and 11 droplets for 105, 106, 107, 108, 109, and 1010 cells mL−1, respectively. Increased E. coli MRE-162 concentrations showed no impact on the evaporation rates of the aerosol droplets, reporting only a subtle effect on the kinetics for the droplets generated with a cell suspension containing the highest bacterial concentration (1010 cells mL−1). The faster reported evaporation of this droplet composition is possibly due to the elevated number of bacteria cells on the surface of the droplets affecting the surface tension. Under low RH, the rate of evaporation can surpass the diffusion rate of the E. coli cells through the droplet bulk, leading to the enrichment of the droplet surface (Figure 3b) at even 3 s after generation, preventing other cells from reaching the droplet surface. Although the formation of a fully enriched surface is not achieved for droplets with a lower microbial load, a percentage of the droplet surface will also be occupied with the bacteria cells after complete evaporation (28% and 3% for droplets containing 109 and 108 cells mL−1, respectively, assuming a bacteria surface area of 0. 5 µm2). Even though the enrichment of bacteria at the droplet surface has no relevant impact on the evaporation dynamics (Figure 3a), it can be expected to inhibit a significant percentage of the bacteria cells from reaching the surface of the droplet which in turn appears to increase the overall airborne bacterial survival (Figure 3c). The inactivation of E. coli MRE-162 due to surface processes shows a time lag effect, reporting a pronounced decay after 600 s and not immediately after evaporation at 120 s.
The data presented in Figure 3 show the importance of not only the microbial content of aerosol particles, but the general location (e.g., surface, near surface or core) of the microorganisms after the evaporation process is complete, which will determine their disposition to a variety of phenomena at the air–droplet interface. These results support the interpretation of data shown in previous work where the effect of surface enrichment on airborne bacterial survival was studied [9]. The importance of surface processes driving the inactivation of pathogens at the air–droplet interface is critical to understand airborne survival and should be explored further with regards to the solute composition of both microbiological media and natural spray fluids encasing the microorganisms (i.e., respiratory secretions, lake, or sewage water).
Having explored the aerosol parameters that may affect how long the bacteria may be on the droplet surface and how these impact viability, the effect of broader changes in particle composition are now explored.

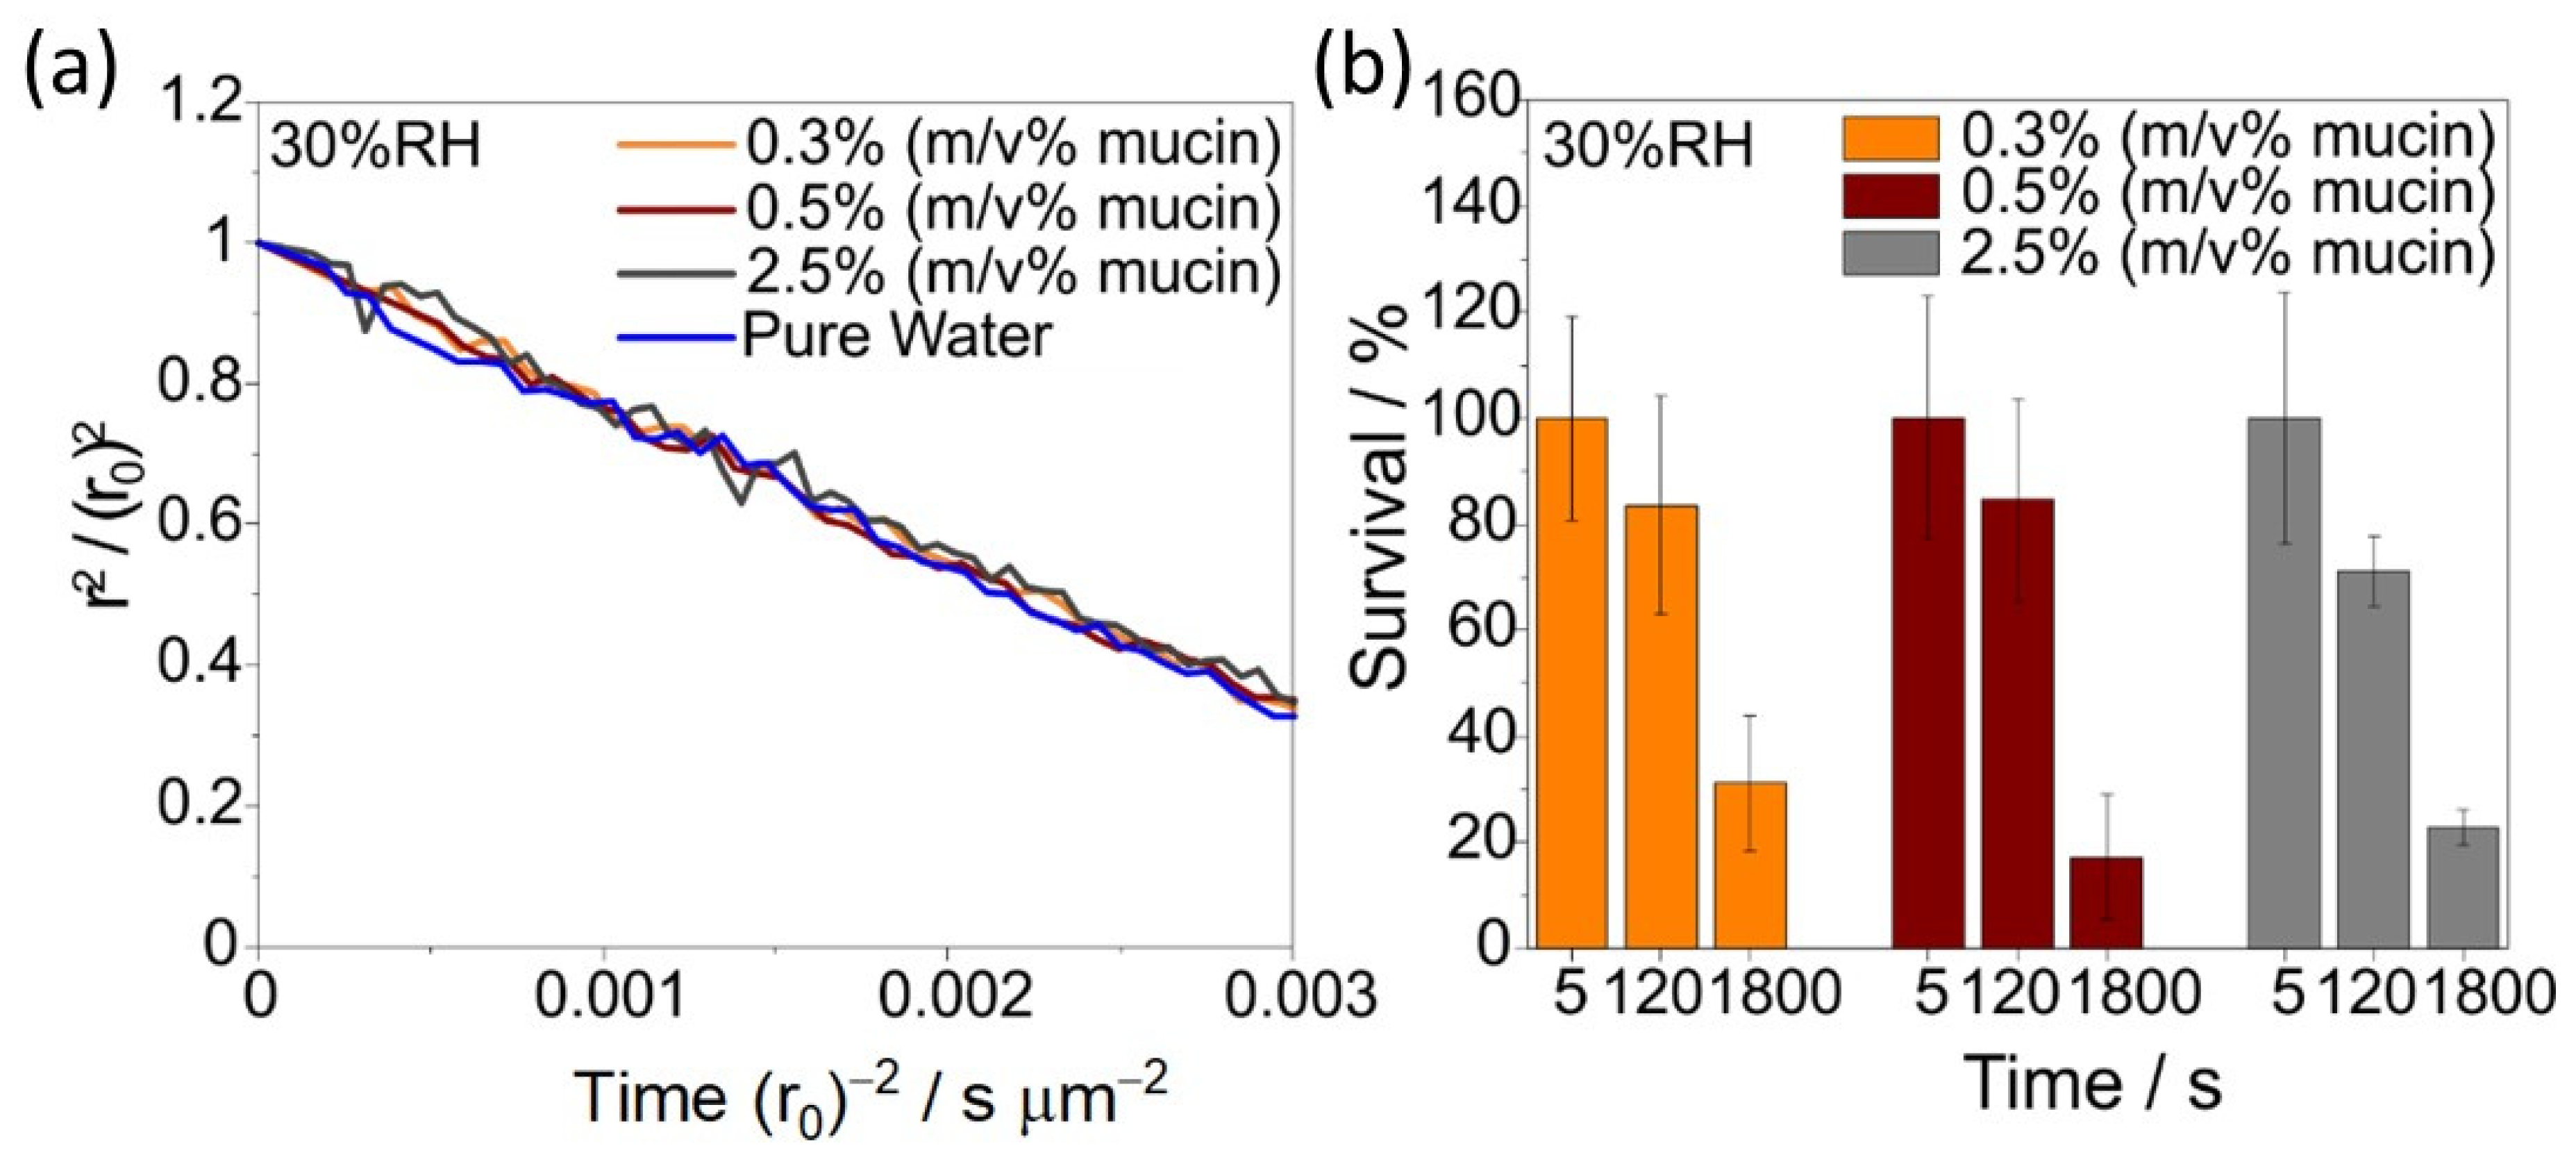
3.4. Mucin Concentration Has No Significant Effect on Bacteria Viability

The presence of components such as proteins, mucin, glucose, nutrients, growth conditions, and surface-active compounds in aerosol droplets can influence the viability of microbes, providing some protection against desiccation at a low RH, UV light, oxygen toxicity, high salt concentrations and even the droplet surface forces at the air–particle interface [33,35,36,37]. Mucin glycoproteins are the main constituents of respiratory mucus, a viscous biological compound that protects and lubricates portions of the human respiratory airways [38]. The biophysical properties of respiratory secretions depend on the concentration of mucus, which itself is a function of the disease state (e.g., healthy, asymptomatic, and infected individuals), type of disease (e.g., sinusitis, pneumonia), and the anatomical location (e.g., nasal, bronchial) in the respiratory airways [39,40]. Different viscoelastic properties of respiratory mucin [41] have been reported to affect the size distribution and concentration of droplets generated during coughing or breathing. These varied rheological properties may affect the exhaled droplet evaporation rates, settling velocities and even the biological processes, dictating the airborne survival of microorganisms enclosed in these droplets.
The initial evaporation profiles of artificial saliva droplets with different mucin (porcine stomach) concentrations (0.3, 0.5, and 2.5% mass-to-volume ratio (m/v)) and a gas-phase RH of 30% are shown in Figure 4a. Despite the potentially different physical properties among droplet compositions, the changes in mucin concentrations do not significantly affect initial (first ~3 s) droplet evaporation rates, with similar gradients in the radius-squared to pure water droplets (blue line in Figure 4a).
The same artificial saliva droplet compositions were used to resuspend an E. coli MRE-162 culture at a concentration of (2.3 ± 0.3) × 108 CFU mL−1. The bacterial suspension was aerosolized and levitated for 120 and 1800 s at 30% RH. The impact of different simulant mucin concentrations on the survival of E. coli MRE-162 is reported in Figure 4b, showing no significant change in decay. The relationship between airborne bacterial viability and mucin concentrations in aerosol droplets has not yet been investigated in detail in the literature and needs to be further explored, but our results here suggest that mucin does not play a significant role in the evaporation rate of water from aerosol droplets nor in the viability of airborne E. coli within droplets of the size, and over the humidity and timescale, investigated here. This is in contrast to viruses, where mucin was found to have a significant protective effect, although transient and persistent for only a few 10′s of seconds, under similar conditions [29].
It should be noted that the results presented here are for porcine stomach mucin. Further study is necessary to confirm that the reported trend occurs for other mucin types (or indeed has effects on other bacterial species).

3.5. The Effect of Gas-to-Particle Partitioning of Pyruvic Acid on Airborne Bacterial Viability

Little is known about the reactivity of airborne bacteria with trace gases present in the atmosphere, such as atmospheric oxidants (e.g., OH, NO3, and O3) or semi-volatile organic compounds. This relationship is further complicated by both the oxidants and the microbes potentially modifying the composition and physicochemical properties of the droplet itself through heterogeneous and multiphase reactions [42], and biological processing. Incorporating this information to improve our quantitative understanding at the process level of how bioaerosols interact with atmospherically relevant species within secondary aerosols and how these reactions impact their survival, lifetime, and physicochemical properties is crucial to develop a complete understanding of the mechanisms involved in the airborne transmission of disease and whether these should ultimately be considered when building infection models.
Pyruvic acid was used in this study as a surrogate for secondary organic aerosol (SOA) components to investigate the effect of gas/aqueous phase partitioning and reactions on airborne bacterial survival. In the atmosphere, pyruvic acid is produced by isoprene oxidation, and is characterised by its high solubility and strong dissociation constant (pKa); combined, these properties enhance its partitioning potential into the aqueous aerosol phase. In this study, a bubbler containing aqueous solutions with different volume fractions of pyruvic acid was connected to the gas inlet to the CELEBS to vary the pyruvic acid vapor pressure to which the droplet is exposed; this sets the gas-phase RH to 30% while simultaneously introducing pyruvic acid to the levitated droplets (Figure 5, experimental setup in Figure S10).
The estimated saturation concentrations of pyruvic acid in aqueous solution as a function of its gas phase partial pressures are shown in Table S3; these estimates assume a gas/aqueous phase equilibria within the dilute limit (i.e., assuming Raoult’s law), avoiding the dependence at low RHs in the particle phase, which may have large uncertainties arising from various non-idealities. For these calculations, a Henry constant value of (3.1 ± 0.8) × 105 mol kg−1 atm−1 was used to estimate the concentration of pyruvate in the aqueous phase [43]. Both the partial pressures and concentrations of condensed pyruvic acid in the droplet were found to be increased by the addition of pyruvic acid into the bubbler (Table S2).
The survival of E. coli MRE162 in the aerosol phase is only affected when pure pyruvic acid is added to the bubbler (not representative of real atmospheric conditions), which increases the concentrations of condensed pyruvate compounds by 1000 times compared to 0.1% v/v of pyruvic acid in the bubbler. Under these conditions, there is an immediate lethal effect on airborne E. coli (Figure 5). At lower gas phase concentrations, there is no effect. This is not to assert that the concentration of pyruvic acid used in this study is representative of what is found in the environment. Rather, this demonstrates that the decay rate of bacteria in the SOA can be different from that of biological-based aerosol (e.g., broth, saliva).
One potential explanation for the reduction in viability is that the high concentration of pyruvic acid produces a change in the pH of the droplet decreasing the bacterial survival after 120 s of levitation. Pyruvic acid exists as its keto and diol forms when dissolved, maintaining a naturally acidic pH (~2.3) in diluted solutions. However, the extent of hydration to the diol form is pH-dependent, which is also likely to vary as the droplet evaporates and the solute concentrations and ionic strength change. Note that the gas particle equilibration time for the pyruvic acid partitioning is likely to be shorter than the drying time/loss of water to achieve equilibrium. Given that E. coli is a pH-insensitive microbe [44], it is somewhat unsurprising that a significant shift in aerosol pH may be required to drive a significant change in decay; this pH insensitivity may in part explain the similarity in viability decay in saliva (high pH following exhalation [10]) and LB broth (neutral pH following generation) droplets.

3.6. The Effect of Bacterial Physiology on Airborne Survival

Microbiological properties used in aerobiology studies, including growth phase, the strain/species, microbial concentration, and culture conditions (growth temperature, water activity, aeration, growth media as well as the incubation time) may also impact the capability of microorganisms to survive in the aerosol phase alongside environmental factors (temperature, humidity, solar irradiation, etc.) [3,45,46,47]. These parameters have the potential to affect the particle size, droplet composition, dynamics, cell phenotype, and, generally, the quality of the sample to be aerosolized which would ultimately impact their survival. Alongside that, the biological component in aerosol survival studies can introduce variability through altering microbial physiology, and requires careful experimental design to support comparison between studies. Therefore, the detailed characterisation of these parameters is key for an effective comparison among in vitro studies and minimises variability in bioaerosol data.
Previous studies that compared the impact of microbial physiology, as a function of its phase of growth, on survival during aerosol transport under the same experimental conditions concluded that E. coli reaches its stationary phase after ~18 h incubation. In this phase, E. coli has been reported to be more aerosol-stable in comparison with the log phase (~4 h incubation) [48]. These results are largely in agreement with subsequent studies performed in the liquid phase where different adaptation mechanisms to osmotic and temperature stresses, through changes in the gene expression pattern, were observed in stationary-phase E. coli which were not present during exponential growth [49,50,51].
To investigate the effect of cell physiology on the survival of E. coli MRE-162 suspended in LB broth droplets after 5, 120, and 600 s at 30% RH, the bacteria were cultured for 6, 12, 24, and 48 h in LB broth before aerosolization (Figure 6). Interestingly, a significant biological decay after 120 s suspension was observed for all the aerosolized bacterial cultures (p values < 0.05, <0.005 and <0.05 for 6, 24, and 48 h, respectively), except for the bacterial suspension incubated for 12 h (p > 0.5) which had a loss of viability after 120 s. For longer suspension times (600 s), the highest survival was also reported for the culture incubated for 12 h, and no significant decay in survival was observed (p > 0.05) in comparison with the survival at 120 s. The present studies were performed solely at 30% RH where a phase change has occurred; in comparison, studies reported in the literature were performed at higher RHs and this may account for observations in this study where the differences in survival between log- and stationary-phase cells were not as pronounced. Further research should explore humidity ranges.
Generally, in a nutrient-rich medium, E. coli will double every 20 min. In this case, the 12 h incubation period corresponds to the early stationary phase for this particular strain. It has been reported that the bacterial response to starvation when cells enter into the stationary phase can trigger different adaptation mechanisms, altering gene expression through alternative RpoS sigma factors and regulators which prepare the cells to survive under adverse conditions, in some cases protecting against osmotic and temperature stress [52]. In addition, the cell wall (peptidoglycan layer) thickens upon entry in the stationary phase, providing a greater tolerance to stresses.

4. Discussion

The strategy described combines viability assessments in the aerosol phase along with detailed aerosol microphysics analysis, allowing for details to be added to the mechanisms of inactivation of aerosolised E. coli MRE-162, here used as a model system for testing different parameters. This approach enables prediction of bioaerosol viability loss as a function of the physicochemical properties of the aerosol. Thus, a mechanistic model to quantify bioaerosol survival could be formulated, as the sum of the effect of predictable processes based on experimental measurements may now be possible. The degree to which each parameter drives microbial inactivation (Figure S7) is linked to the environmental conditions, the strain, compositional parameters of the aerosol particles (e.g., SOA), etc. It should be noted that aerosol experiments are complex and processes such as the generation of the aerosol and subsequent sampling can damage microorganisms. These stresses have been minimised in the CELEBS technique [3]. A further complicating aspect of microbial enumeration is a growth-based assay and can add measurement bias due to differences in bacterial response and recovery from stress [53,54].
With this approach, it could be possible to some degree of certainty to predict the longevity one would expect for E. coli MRE-162 in a solution droplet with a known starting formulation (e.g., very diluted solution droplets), and it is injected into a known gas-phase RH. For example, considering saliva as a solute, the combination of the initial saliva concentration needed to equilibrate in a specific RH to produce a significant biological decay in the microorganisms should be predictable. One could start to understand and inform risk in a mechanistic manner. For example, why particular microbes may be more associated with transmission from the aerosolization of water sources such as cooling towers [55], showers, humidifiers, wastewater treatment plants [56], and flushing toilets [57] (e.g., Legionella pneumophila, Mycobacterium avium, and faecal Enterobacteriaceae) compared to others that are transmitted by respiratory secretions (e.g., Bordetella pertussis, Streptococcus pneumoniae). Mechanistically, the relative concentration of suspended solids may influence surface enrichment. For example, the longevity of a microbe that is sensitive to conditions present at the surface of the droplet will be dependent on the difference in water activity between the starting droplet solution and the gas phase instead of the gas-phase RH itself. These types of detailed extrapolations (e.g., predict the evaporation dynamics for different concentrations of the starting solute compositions) are challenging using standard longevity curves (e.g., time-dependent bioaerosol survival as a function of environmental conditions) due to the production of polydisperse droplets where the residing microorganisms will experience different histories.
A broad study into a myriad of properties of aerosol that may affect the longevity of E. coli MRE-162 in the aerosol phase is reported. Collectively, the findings support the hypothesis that droplet parameters that affect the time during which bacteria remain on the surface of the droplet tend to affect bacterial viability, where oxidative stress plays a critical role [9]. These include solute starting concentrations, particle phase, and bacterial load. While being on the surface appears to be significant for bacterial decay, the presence of surfactants has no effect on limiting this decay, as their concentrations cannot reach values high enough under natural (e.g., ethanol-free) conditions.

Supplementary Materials

The following supporting information can be downloaded at: https://www.mdpi.com/article/10.3390/atmos15040511/s1, Table S1: List of components for the artificial saliva media, Table S2: List of components for the artificial sputum media, Figure S1: SEM images of E. coli MRE-162 cells at a concentration of ~109 CFU mL−1 levitated in PBS droplets, Figure S2: Hygroscopic response of various droplet solutions as a function of droplet water activity (ɑw), equivalent to the gas-phase RH, Figure S3: Modelled dynamics for artificial saliva droplets (neat concentration), Figure S4: Modelled time-dependent dynamics for diluted artificial saliva droplets (1:10), Figure S5: Modelled time-dependent dynamics for artificial sputum droplets, Figure S6: Modelled dynamics for diluted artificial sputum droplets (1:10), Figure S7: Correlations between bacterial survival and physicochemical changes, Figure S8: Chemical formulas, structures and molar masses of surfactants, Figure S9: Physicochemical changes of water droplets containing various surfactants, Figure S10: Diagram of the gas flow set-up for pyruvic acid studies on bacterial viability, Table S3: Equilibrium saturation concentrations of pyruvic acid in the aqueous phase as a function of the volume fraction of pyruvic acid introduced in the gas inlet at 30% RH.

Author Contributions

A.H. and M.O.-F. developed the approach with support from J.P.R., R.J.T., H.O., A.H. and J.P.R. conceived and designed the project. M.O.-F. carried out the data analysis and performed the laboratory work with support from R.A., A.H., R.J.T., H.O., M.O.-F. and A.H. wrote the paper. A.H. and J.P.R. are joint corresponding authors, who supervised and coordinated the research, and edited the manuscript for publication. J.P.R. acquired funding and administered the project. All authors have read and agreed to the published version of the manuscript.

Funding

This work was supported by the Natural Environment Research (NCAS-NERC) council and the Defence Science & Technology Laboratories (Dstl). R.J.T. acknowledge the UK Ministry of Defence for its funding contribution. The EPSRC Centre for Doctoral Training in Aerosol Science EP/S023593/1 which supported R.A.is acknowledged. SEM studies carried out in the Chemical Imaging Facility at the University of Bristol, with equipment funded by EPSRC under Grant “Atoms to Applications” Grant ref. “(EP/K035746/1).

Institutional Review Board Statement

Not applicable.

Informed Consent Statement

Not applicable.

Data Availability Statement

Data are available at the University of Bristol data repository, data.bris, at https://doi.org/10.5523/bris.1owupsp2o39en2b8tyguhzql74 (accessed on 15 April 2024).

Acknowledgments

The authors gratefully acknowledge support from Jean-Charles Eloi, Electron Microscopy Technician in the School of Chemistry at the University of Bristol.

Conflicts of Interest

The authors declare no conflict of interest.

References

  1. Duval, D.; Palmer, J.C.; Tudge, I.; Pearce-Smith, N.; O’Connell, E.; Bennett, A.; Clark, R. Long distance airborne transmission of SARS-CoV-2: Rapid systematic review. BMJ 2022, 377, e068743. [Google Scholar] [CrossRef] [PubMed]
  2. van Doremalen, N.; Bushmaker, T.; Morris, D.H.; Holbrook, M.G.; Gamble, A.; Williamson, B.N.; Tamin, A.; Harcourt, J.L.; Thornburg, N.J.; Gerber, S.I.; et al. Aerosol and Surface Stability of SARS-CoV-2 as Compared with SARS-CoV-1. N. Engl. J. Med. 2020, 382, 1564–1567. [Google Scholar] [CrossRef] [PubMed]
  3. Fernandez, M.O.; Thomas, R.J.; Oswin, H.; Haddrell, A.E.; Reid, J.P. Transformative Approach to Investigate the Microphysical Factors Influencing Airborne Transmission of Pathogens. Appl. Environ. Microbiol. 2020, 86, e01543-20. [Google Scholar] [CrossRef] [PubMed]
  4. Alsved, M.; Holm, S.; Christiansen, S.; Smidt, M.; Rosati, B.; Ling, M.; Boesen, T.; Finster, K.; Bilde, M.; Löndahl, J.; et al. Effect of Aerosolization and Drying on the Viability of Pseudomonas syringae Cells. Front. Microbiol. 2018, 9, 3086. [Google Scholar] [CrossRef] [PubMed]
  5. Gralton, J.; Tovey, E.; McLaws, M.L.; Rawlinson, W.D. The role of particle size in aerosolised pathogen transmission: A review. J. Infect. 2011, 62, 1–13. [Google Scholar] [CrossRef] [PubMed]
  6. Chakrabarty, R.K.; Heinson, W.R. Scaling Laws for Light Absorption Enhancement Due to Nonrefractory Coating of Atmospheric Black Carbon Aerosol. Phys. Rev. Lett. 2018, 121, 218701. [Google Scholar] [CrossRef]
  7. Service, R.F. Climate change. Study fingers soot as a major player in global warming. Science 2008, 319, 1745. [Google Scholar] [CrossRef]
  8. Lee, A.K.; Zhao, R.; Li, R.; Liggio, J.; Li, S.M.; Abbatt, J.P. Formation of light absorbing organo-nitrogen species from evaporation of droplets containing glyoxal and ammonium sulfate. Environ. Sci. Technol. 2013, 47, 12819–12826. [Google Scholar] [CrossRef] [PubMed]
  9. Oswin, H.P.; Haddrell, A.E.; Hughes, C.; Otero-Fernandez, M.; Thomas, R.J.; Reid, J.P. Oxidative Stress Contributes to Bacterial Airborne Loss of Viability. Microbiol. Spectr. 2023, 11, e0334722. [Google Scholar] [CrossRef]
  10. Haddrell, A.; Otero-Fernandez, M.; Oswin, H.; Cogan, T.; Bazire, J.; Tian, J.; Alexander, R.; Mann, J.F.S.; Hill, D.; Finn, A.; et al. Differences in airborne stability of SARS-CoV-2 variants of concern is impacted by alkalinity of surrogates of respiratory aerosol. J. R. Soc. Interface 2023, 20, 20230062. [Google Scholar] [CrossRef]
  11. Oswin, H.P.; Haddrell, A.E.; Otero-Fernandez, M.; Mann, J.F.S.; Cogan, T.A.; Hilditch, T.G.; Tian, J.; Hardy, D.A.; Hill, D.J.; Finn, A.; et al. The dynamics of SARS-CoV-2 infectivity with changes in aerosol microenvironment. Proc. Natl. Acad. Sci. USA 2022, 119, e2200109119. [Google Scholar] [CrossRef] [PubMed]
  12. Oswin, H.P.; Blake, E.; Haddrell, A.E.; Finn, A.; Sriskandan, S.; Reid, J.P.; Halliday, A.; Goenka, A. An assessment of the airborne longevity of group A Streptococcus. Microbiology 2024, 170, 001421. [Google Scholar] [CrossRef]
  13. Haddrell, A.; Rovelli, G.; Lewis, D.; Church, T.; Reid, J. Identifying time-dependent changes in the morphology of an individual aerosol particle from its light scattering pattern. Aerosol Sci. Technol. 2019, 53, 1334–1351. [Google Scholar] [CrossRef]
  14. Orr, R.J.S.; Littner, E.; Larigauderie, G.; Lonsdale, C.L.; Dybwad, M. Complete reference genome assemblies and annotations of three Escherichia coli MRE162 clones. Microbiol. Resour. Announc. 2023, 12, e0049023. [Google Scholar] [CrossRef] [PubMed]
  15. Kirchner, S.; Fothergill, J.L.; Wright, E.A.; James, C.E.; Mowat, E.; Winstanley, C. Use of artificial sputum medium to test antibiotic efficacy against Pseudomonas aeruginosa in conditions more relevant to the cystic fibrosis lung. J. Vis. Exp. 2012, 64, e3857. [Google Scholar] [CrossRef]
  16. Woo, M.H.; Hsu, Y.M.; Wu, C.Y.; Heimbuch, B.; Wander, J. Method for contamination of filtering facepiece respirators by deposition of MS2 viral aerosols. J. Aerosol Sci. 2010, 41, 944–952. [Google Scholar] [CrossRef]
  17. Rovelli, G.; Miles, R.E.H.; Reid, J.P.; Clegg, S.L. Accurate Measurements of Aerosol Hygroscopic Growth over a Wide Range in Relative Humidity. J. Phys. Chem. A 2016, 120, 4376–4388. [Google Scholar] [CrossRef]
  18. Gregson, F.K.A.; Robinson, J.F.; Miles, R.E.H.; Royall, C.P.; Reid, J.P. Drying Kinetics of Salt Solution Droplets: Water Evaporation Rates and Crystallization. J. Phys. Chem. B 2019, 123, 266–276. [Google Scholar] [CrossRef]
  19. Cai, C.; Miles, R.E.; Cotterell, M.I.; Marsh, A.; Rovelli, G.; Rickards, A.M.; Zhang, Y.H.; Reid, J.P. Comparison of Methods for Predicting the Compositional Dependence of the Density and Refractive Index of Organic-Aqueous Aerosols. J. Phys. Chem. A 2016, 120, 6604–6617. [Google Scholar] [CrossRef]
  20. Davies, J.F.; Haddrell, A.E.; Reid, J.P. Time-Resolved Measurements of the Evaporation of Volatile Components from Single Aerosol Droplets. Aerosol Sci. Technol. 2012, 46, 666–677. [Google Scholar] [CrossRef]
  21. Kulmala, M.; Vesala, T.; Wagner, P.E. An analytical expression for the rate of binary condensational particle growth. Proc. R. Soc. London. Ser. A Math. Phys. Sci. 1993, 441, 589–605. [Google Scholar] [CrossRef]
  22. Davies, J.F.; Haddrell, A.E.; Rickards, A.M.; Reid, J.P. Simultaneous analysis of the equilibrium hygroscopicity and water transport kinetics of liquid aerosol. Anal. Chem. 2013, 85, 5819–5826. [Google Scholar] [CrossRef] [PubMed]
  23. Kreidenweis, S.M.; Koehler, K.; DeMott, P.J.; Prenni, A.J.; Carrico, C.; Ervens, B. Water activity and activation diameters from hygroscopicity data-Part I: Theory and application to inorganic salts. Atmos. Chem. Phys. 2005, 5, 1357–1370. [Google Scholar] [CrossRef]
  24. Baldelli, A.; Boraey, M.A.; Nobes, D.S.; Vehring, R. Analysis of the Particle Formation Process of Structured Microparticles. Mol. Pharm. 2015, 12, 2562–2573. [Google Scholar] [CrossRef] [PubMed]
  25. Nenninger, A.; Mastroianni, G.; Robson, A.; Lenn, T.; Xue, Q.; Leake, M.C.; Mullineaux, C.W. Independent mobility of proteins and lipids in the plasma membrane of Escherichia coli. Mol. Microbiol. 2014, 92, 1142–1153. [Google Scholar] [CrossRef] [PubMed]
  26. Clegg, S.L.; Brimblecombe, P.; Wexler, A.S. Thermodynamic Model of the System H+−NH4+−Na+−SO42−−NO3−Cl−H2O at 298.15 K. J. Phys. Chem. A 1998, 102, 2155–2171. [Google Scholar] [CrossRef]
  27. Fernandez, M.O.; Thomas, R.J.; Garton, N.J.; Hudson, A.; Haddrell, A.; Reid, J.P. Assessing the airborne survival of bacteria in populations of aerosol droplets with a novel technology. J. R. Soc. Interface 2019, 16, 20180779. [Google Scholar] [CrossRef]
  28. Keune, K.; van Loon, A.; Boon, J.J. SEM backscattered-electron images of paint cross sections as information source for the presence of the lead white pigment and lead-related degradation and migration phenomena in oil paintings. Microsc. Microanal. 2011, 17, 696–701. [Google Scholar] [CrossRef] [PubMed]
  29. Alexander, R.W.; Tian, J.; Haddrell, A.E.; Oswin, H.P.; Neal, E.; Hardy, D.A.; Otero-Fernandez, M.; Mann, J.F.S.; Cogan, T.A.; Finn, A.; et al. Mucin Transiently Sustains Coronavirus Infectivity through Heterogenous Changes in Phase Morphology of Evaporating Aerosol. Viruses 2022, 14, 1856. [Google Scholar] [CrossRef]
  30. Bourouiba, L.; Dehandschoewercker, E.; Bush, J.W. Violent expiratory events: On coughing and sneezing. J. Fluid Mech. 2014, 745, 537–563. [Google Scholar] [CrossRef]
  31. Bourouiba, L. Turbulent Gas Clouds and Respiratory Pathogen Emissions: Potential Implications for Reducing Transmission of COVID-19. Jama 2020, 323, 1837–1838. [Google Scholar] [CrossRef] [PubMed]
  32. Pérez-Gil, J.; Keough, K.M.W. Interfacial properties of surfactant proteins. Biochim. Biophys. Acta (BBA)-Mol. Basis Dis. 1998, 1408, 203–217. [Google Scholar] [CrossRef]
  33. Lighthart, B.; Shaffer, B.T. Increased Airborne Bacterial Survival as a Function of Particle Content and Size. Aerosol Sci. Technol. 1997, 27, 439–446. [Google Scholar] [CrossRef]
  34. Lou, M.; Liu, S.; Gu, C.; Hu, H.; Tang, Z.; Zhang, Y.; Xu, C.; Li, F. The bioaerosols emitted from toilet and wastewater treatment plant: A literature review. Environ. Sci. Pollut. Res. Int. 2021, 28, 2509–2521. [Google Scholar] [CrossRef] [PubMed]
  35. Nicas, M.; Nazaroff, W.W.; Hubbard, A. Toward understanding the risk of secondary airborne infection: Emission of respirable pathogens. J. Occup. Environ. Hyg. 2005, 2, 143–154. [Google Scholar] [CrossRef]
  36. Johnson, G.R.; Morawska, L.; Ristovski, Z.D.; Hargreaves, M.; Mengersen, K.; Chao, C.Y.H.; Wan, M.P.; Li, Y.; Xie, X.; Katoshevski, D.; et al. Modality of human expired aerosol size distributions. J. Aerosol Sci. 2011, 42, 839–851. [Google Scholar] [CrossRef]
  37. de Mik, G.; de Groot, I. The germicidal effect of the open air in different parts of The Netherlands. J. Hyg. 1977, 78, 175–187. [Google Scholar] [CrossRef]
  38. Cheng, Y.S. Mechanisms of pharmaceutical aerosol deposition in the respiratory tract. AAPS PharmSciTech 2014, 15, 630–640. [Google Scholar] [CrossRef] [PubMed]
  39. Meldrum, O.W.; Chotirmall, S.H. Mucus, Microbiomes and Pulmonary Disease. Biomedicines 2021, 9, 675. [Google Scholar] [CrossRef]
  40. Lillehoj, E.P.; Kato, K.; Lu, W.; Kim, K.C. Cellular and molecular biology of airway mucins. Int. Rev. Cell Mol. Biol. 2013, 303, 139–202. [Google Scholar] [CrossRef]
  41. King, M. Viscoelastic properties of airway mucus. Fed. Proc. 1980, 39, 3080–3085. [Google Scholar] [PubMed]
  42. Small, P.; Blankenhorn, D.; Welty, D.; Zinser, E.; Slonczewski, J.L. Acid and base resistance in Escherichia coli and Shigella flexneri: Role of rpoS and growth pH. J. Bacteriol. 1994, 176, 1729–1737. [Google Scholar] [CrossRef] [PubMed]
  43. Khan, I.; Brmblecombe, P.; Clegg, S.L. The henry’s law constants of pyruvic and methacrylic acids. Environ. Technol. 1992, 13, 587–593. [Google Scholar] [CrossRef]
  44. Xu, Y.; Zhao, Z.; Tong, W.; Ding, Y.; Liu, B.; Shi, Y.; Wang, J.; Sun, S.; Liu, M.; Wang, Y.; et al. An acid-tolerance response system protecting exponentially growing Escherichia coli. Nat. Commun. 2020, 11, 1496. [Google Scholar] [CrossRef]
  45. Handley, B.A.; Webster, A.J.F. Some factors affecting the airborne survival of bacteria outdoors. J. Appl. Bacteriol. 1995, 79, 368–378. [Google Scholar] [CrossRef] [PubMed]
  46. Brown, W.F.; Damon, E.B.; Ferry, R.M. Studies of the loss of viability of bacterial aerosols: III. Factors affecting death rates of certain non-pathogens. J. Hyg. 1958, 56, 389–403. [Google Scholar] [CrossRef]
  47. Chan, W.L.; Chung, W.T.; Ng, T.W. Airborne Survival of Escherichia coli under Different Culture Conditions in Synthetic Wastewater. Int. J. Environ. Res. Public Health 2019, 16, 4745. [Google Scholar] [CrossRef] [PubMed]
  48. Griffiths, W.D.; Stewart, I.W.; Reading, A.R.; Futter, S.J. Effect of aerosolisation, growth phase and residence time in spray and collection fluids on the culturability of cells and spores. J. Aerosol Sci. 1996, 27, 803–820. [Google Scholar] [CrossRef]
  49. Jenkins, D.E.; Chaisson, S.A.; Matin, A. Starvation-induced cross protection against osmotic challenge in Escherichia coli. J. Bacteriol. 1990, 172, 2779–2781. [Google Scholar] [CrossRef]
  50. Navarro Llorens, J.M.; Tormo, A.; Martínez-García, E. Stationary phase in gram-negative bacteria. FEMS Microbiol. Rev. 2010, 34, 476–495. [Google Scholar] [CrossRef]
  51. Lacour, S.; Landini, P. SigmaS-dependent gene expression at the onset of stationary phase in Escherichia coli: Function of sigmaS-dependent genes and identification of their promoter sequences. J. Bacteriol. 2004, 186, 7186–7195. [Google Scholar] [CrossRef] [PubMed]
  52. Battesti, A.; Majdalani, N.; Gottesman, S. The RpoS-mediated general stress response in Escherichia coli. Annu. Rev. Microbiol. 2011, 65, 189–213. [Google Scholar] [CrossRef] [PubMed]
  53. Barer, M.R.; Harwood, C.R. Bacterial viability and culturability. Adv. Microb. Physiol. 1999, 41, 93–137. [Google Scholar] [CrossRef] [PubMed]
  54. Chang, C.-W.; Grinshpun, S.A.; Willeke, K.; Macher, J.M.; Donnelly, J.; Clark, S.; Juozaitis, A. Factors Affecting Microbiological Colony Count Accuracy for Bioaerosol Sampling and Analysis. Am. Ind. Hyg. Assoc. J. 1995, 56, 979–986. [Google Scholar] [CrossRef] [PubMed]
  55. Girolamini, L.; Brattich, E.; Marino, F.; Pascale, M.R.; Mazzotta, M.; Spiteri, S.; Derelitto, C.; Tositti, L.; Cristino, S. Cooling towers influence in an urban environment: A predictive model to control and prevent Legionella risk and Legionellosis events. Build. Environ. 2023, 228, 109891. [Google Scholar] [CrossRef]
  56. Kataki, S.; Patowary, R.; Chatterjee, S.; Vairale, M.G.; Sharma, S.; Dwivedi, S.K.; Kamboj, D.V. Bioaerosolization and pathogen transmission in wastewater treatment plants: Microbial composition, emission rate, factors affecting and control measures. Chemosphere 2022, 287, 132180. [Google Scholar] [CrossRef]
  57. Knowlton, S.D.; Boles, C.L.; Perencevich, E.N.; Diekema, D.J.; Nonnenmann, M.W.; Program, C.D.C.E. Bioaerosol concentrations generated from toilet flushing in a hospital-based patient care setting. Antimicrob. Resist. Infect. Control 2018, 7, 16. [Google Scholar] [CrossRef]
Figure 1. Survival percentages for E. coli MRE-162 over 10 min in artificial saliva (light blue), LB broth (dark blue), diluted artificial sputum (brown), and PBS (black) droplets compositions at (a) 30, (b) 50, and (c) 90% RH. Each data point is expressed as the average and standard deviation of at least three replicates. Right: Microscopy images showing the particle morphology reported in different droplet compositions containing E. coli MRE162 cells. Specifically, (d) both SEM images of bacteria at a concentration of ~108 CFU mL−1 sprayed in water at 30% RH; (e) SEM and backscattered images of bacteria at a concentration of ~109 CFU mL−1 in LB broth droplets at 10% RH, (f) SEM and backscattered images of bacteria at a concentration of ~109 CFU mL−1 in PBS droplets at 10% RH, and (g) SEM and backscattered images of bacteria at a concentration of ~108 CFU mL−1 in saliva droplets at 30% RH. Scales bars represent 5 µm.
Atmosphere 15 00511 g001
Figure 2. Effect of surfactants on aerosol dynamics and bacterial survival. (a) Comparison of evaporation kinetics among droplets composed of autoclaved LB broth (magenta), LB broth saturated with DPPC and containing (4.5 ± 2.4) × 108 CFU mL−1 E. coli MRE-162 bacteria mL−1 (orange), LB broth saturated with heptadecanol and containing (3.6 ± 2.1) × 108 CFU mL−1 E. coli MRE-162 bacteria mL−1 (grey), and LB broth saturated with Tween80 and containing (3.0 ± 0.8) × 108 CFU mL−1 E. coli MRE-162 bacteria mL−1 (violet) into a gas-phase RH of a) 30%, (b) 50%, and (c) 70%. Experimental measurements are compared with simulations for pure LB broth droplets obtained using the evaporation/condensation kinetics model (black lines). Model predictions agree with the experimental measurements of LB broth particles without surfactants for all gas-phase RHs. Small variations on the evaporation profiles are due to minor fluctuation in the gas-phase RH. (d) For the same particles, a comparison of E. coli MRE-162 survival to evaluate the impact of the presence of surfactants on airborne bacteria viability at 50% RH. Coloured squares indicate the surfactant present in the starting formulation.
Atmosphere 15 00511 g002
Figure 3. Impact of microbial load on aerosol dynamics and bacterial survival. (a) Evaporation dynamics for droplets composed of LB broth with different bacterial cell concentrations ranging from 105 cells mL−1 to 1010 cells mL−1. (b) Percentage of droplet surface covered by bacteria cells as a function of the microbial concentration in the starting formulation. Note that these calculations assume that the surface area for a bacteria cell is 0.5 µm2, considering 1 µm length and 0.5 µm width as the section of the surface area of bacteria covering the droplet surface. A surface coverage of >100% indicates that the droplet is coated with more than a single layer of bacteria. (c) Effect of the microbial cell concentration in the droplets on the survival of E. coli MRE-162, all at a gas-phase RH of 30%. Colours: grey (1010 cells mL−1), brown (109 cells mL−1), orange (108 cells mL−1), magenta (107 cells mL−1), turquoise (106 cells mL−1), and blue (105 cells mL−1) (indicated by the coloured squares).
Atmosphere 15 00511 g003
Figure 4. Effect of mucin concentration on the evaporation and survival of E. coli MRE-162 in artificial saliva. (a) Normalised evaporation rates of artificial saliva droplet composition containing three different mucin concentrations and pure water droplets. (b) Survival of E. coli MRE-162 in artificial saliva droplets containing the three different mucin concentrations at 30% RH. The relative evaporation profile in (a) accounts for the first ~3 s of droplet evaporation. The mass fractions of mucin in artificial saliva represent the mucin concentrations in standard artificial saliva (0.3%), artificial sputum (0.5%) and artificial sputum with higher mucin concentration representative of infection (2.5%). The colours indicate the percent mucin in the starting formulations.
Atmosphere 15 00511 g004
Figure 5. Effect of different volume fractions of pyruvic acid on the survival of E. coli MRE-162 at a concentration of (2.8 ± 0.3) × 108 CFU mL−1 in droplets composed of artificial saliva at 30% RH. Survival obtained by introducing pure water in the bubbler are shown for reference purposes. Colours indicate the composition of the solution in the bubbler (squares, top).
Atmosphere 15 00511 g005
Figure 6. The effect of incubation times on airborne bacterial survival at 30% RH. The colours represent the cell age being 6 h (grey), 12 h (cyan), 24 h (light blue), and 48 h (dark blue) (indicated by the squares). Each data point represents the mean and standard deviation of at least three replicates.
Atmosphere 15 00511 g006
Disclaimer/Publisher’s Note: The statements, opinions and data contained in all publications are solely those of the individual author(s) and contributor(s) and not of MDPI and/or the editor(s). MDPI and/or the editor(s) disclaim responsibility for any injury to people or property resulting from any ideas, methods, instructions or products referred to in the content.

