
Study of the Spatiotemporal Distribution Characteristics of Rainfall Using Hybrid Dimensionality Reduction-Clustering Model: A Case Study of Kunming City, China

 ,
,
Abstract
:1. Introduction
2. Materials and Methods
2.1. Materials
- Records are considered unreasonable if a single station reports more than 10 mm of rainfall in 5 min without any rainfall 30 min before and after the event;
- Records are deemed unreasonable if a rainfall station within a 5 km × 5 km area reports 0 data, yet records more than 10 mm of rainfall in 5 min;
- For abnormal records at individual stations, rainfall isohyet maps for the period must be compared to verify the data’s reasonableness. If found unreasonable, interpolation results from other stations within a 5 km × 5 km area of the station are used to replace its rainfall record.
- Eliminate all periods in the annual time series of the study’s rainfall stations where rainfall is consistently 0, considering discontinuities in the time series as the start of a new rainfall event;
- Temporally, eliminate rainfall events lasting less than one hour; volumetrically, exclude events where the average cumulative rainfall is less than 2 mm;
- Each rainfall event is downscaled to fit within a one-hour period (divided into twelve 5 min intervals), and the total volume is normalized to standardize the events.
2.2. Methods
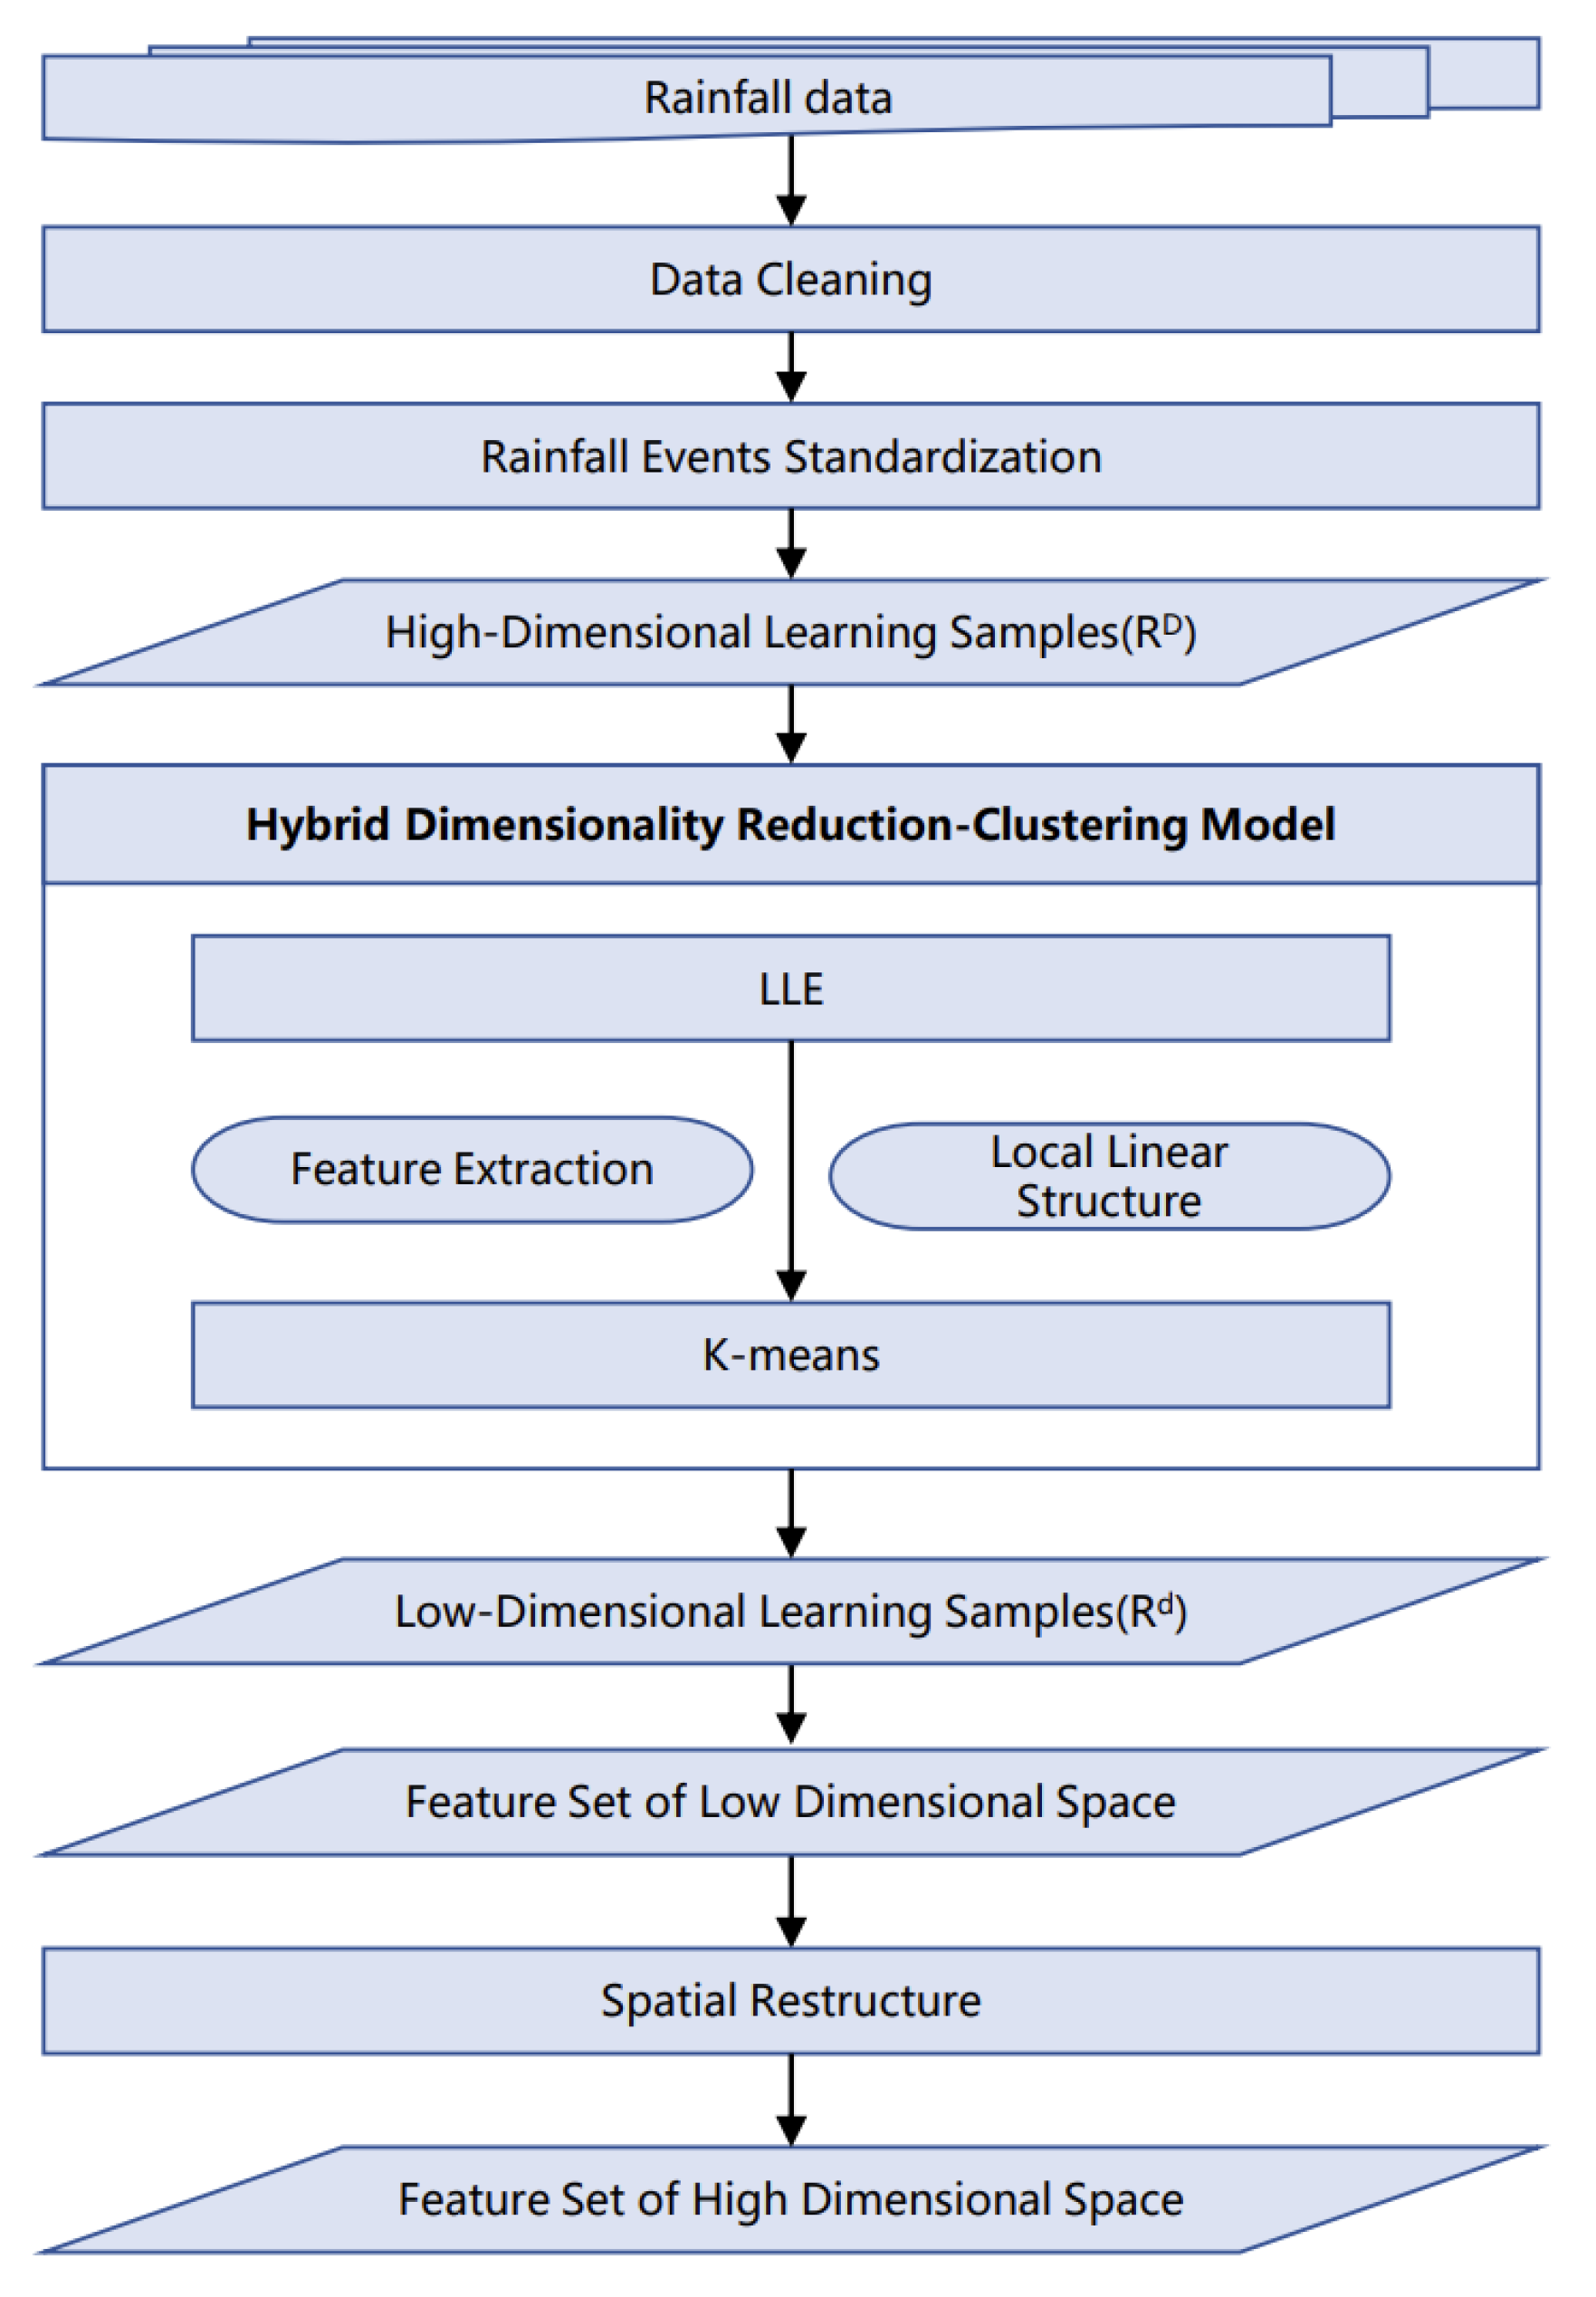
2.2.1. Constructing High-Dimensional Data Samples
2.2.2. Unsupervised HDRC Models
- LLE
- In high-dimensional space, the LLE algorithm identifies the nearest neighbors of a sample using the Euclidean distance metric.
- 2.
- For each sample , find the linear relationship of the nearest neighbors in its neighborhood to obtain the linear relationship weight coefficients, as shown in Equation (6):
- 3.
- Assuming the linear relationship weight coefficients Wi within the K neighborhood remain constant between high-dimensional and low-dimensional spaces, the sample data are reconstructed in the lower dimension using the weight coefficients , and the following are implemented: .
- K-Means
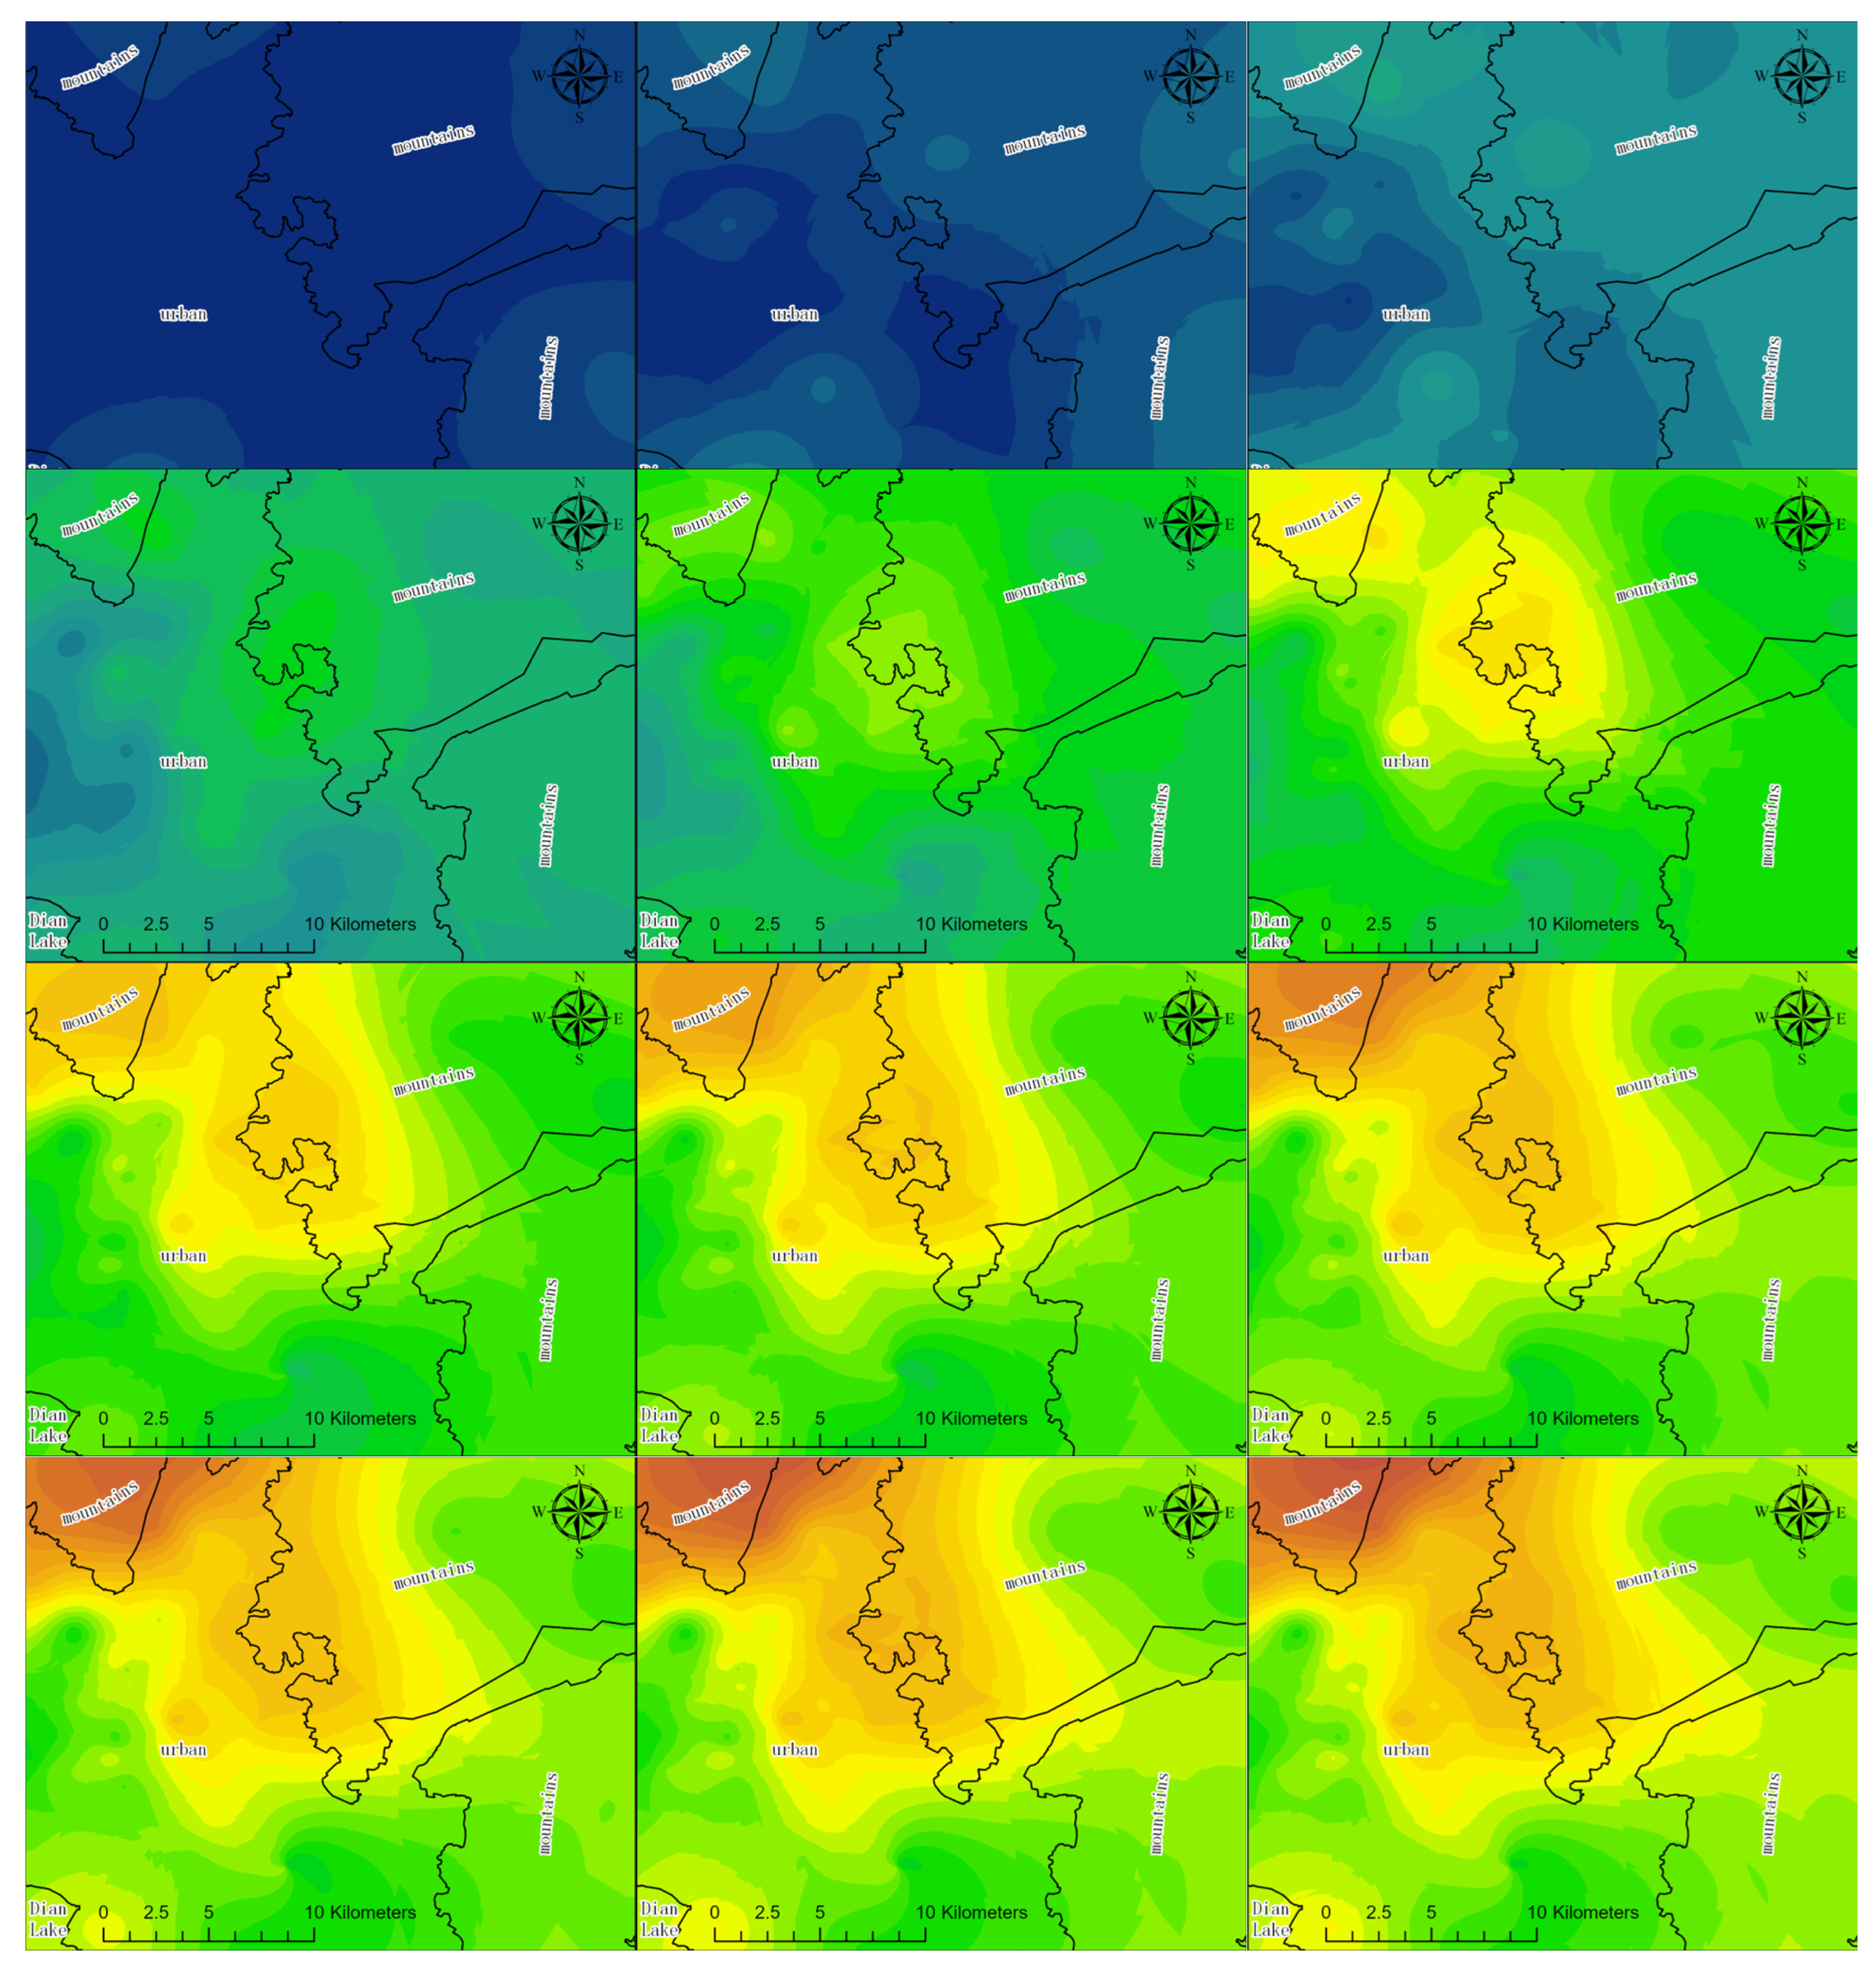
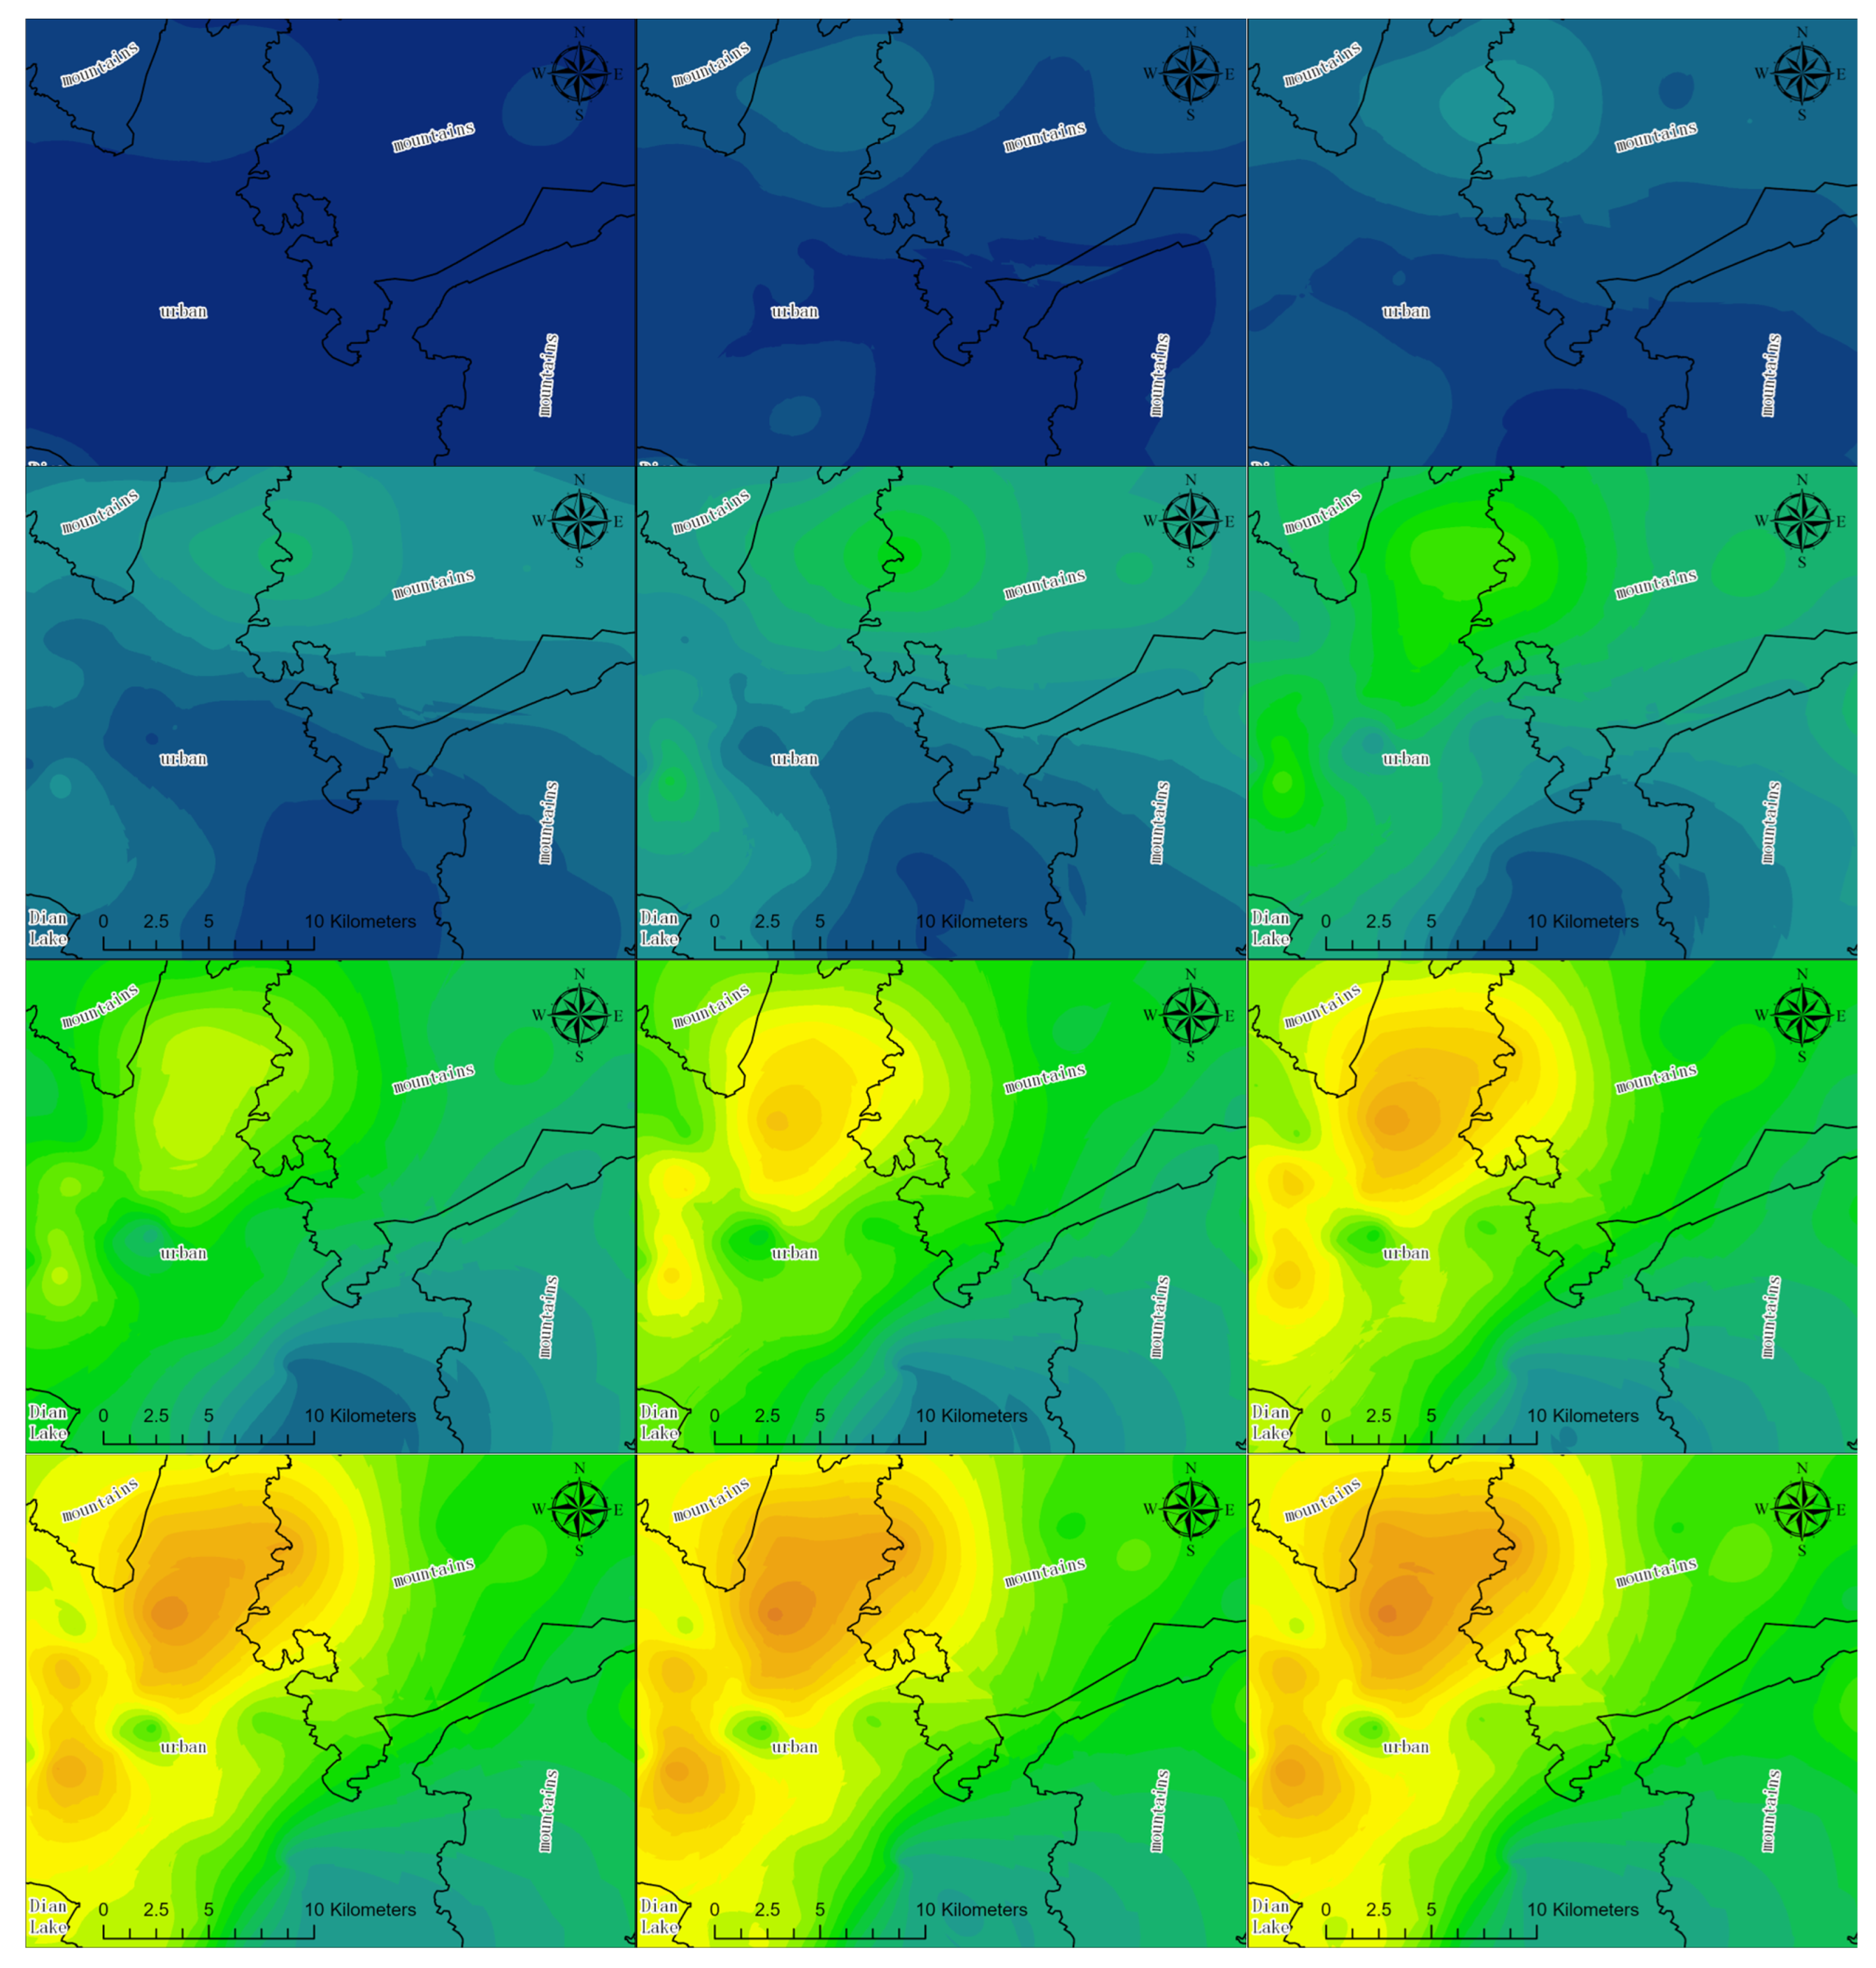
3. Results
4. Discussion
5. Conclusions
Author Contributions
Funding
Institutional Review Board Statement
Informed Consent Statement
Data Availability Statement
Conflicts of Interest
References
- Meehl, G.A.; Zwiers, F.; Evans, J.; Knutson, T.; Mearns, L.; Whetton, P. Trends in Extreme Weather and Climate Events: Issues Related to Modeling Extremes in Projections of Future Climate Change. Bull. Am. Meteorol. Soc. 2000, 81, 427–436. [Google Scholar] [CrossRef]
- Tabari, H. Climate Change Impact on Flood and Extreme Precipitation Increases with Water Availability. Sci. Rep. 2020, 10, 13768. [Google Scholar] [CrossRef] [PubMed]
- Huong, H.T.L.; Pathirana, A. Urbanization and Climate Change Impacts on Future Urban Flooding in Can Tho City, Vietnam. Hydrol. Earth Syst. Sci. 2013, 17, 379–394. [Google Scholar] [CrossRef]
- Alcamo, J.; Flörke, M.; Märker, M. Future Long-Term Changes in Global Water Resources Driven by Socio-Economic and Climatic Changes. Hydrol. Sci. J. 2007, 52, 247–275. [Google Scholar] [CrossRef]
- Lobell, D.B.; Gourdji, S.M. The Influence of Climate Change on Global Crop Productivity. Plant Physiol. 2012, 160, 1686–1697. [Google Scholar] [CrossRef] [PubMed]
- Leal Filho, W.; Totin, E.; Franke, J.A.; Andrew, S.M.; Abubakar, I.R.; Azadi, H.; Nunn, P.D.; Ouweneel, B.; Williams, P.A.; Simpson, N.P. Understanding Responses to Climate-Related Water Scarcity in Africa. Sci. Total Environ. 2022, 806, 150420. [Google Scholar] [CrossRef] [PubMed]
- Brunner, M.I.; Slater, L.; Tallaksen, L.M.; Clark, M. Challenges in Modeling and Predicting Floods and Droughts: A Review. Wiley Interdiscip. Rev. Water 2021, 8, e1520. [Google Scholar] [CrossRef]
- Trenberth, K.E.; Dai, A.; Rasmussen, R.M.; Parsons, D.B. The Changing Character of Precipitation. Bull. Am. Meteorol. Soc. 2003, 84, 1205–1218. [Google Scholar] [CrossRef]
- Bales, R.C.; Molotch, N.P.; Painter, T.H.; Dettinger, M.D.; Rice, R.; Dozier, J. Mountain Hydrology of the Western United States. Water Resour. Res. 2006, 42, W08432. [Google Scholar] [CrossRef]
- Paschalis, A.; Fatichi, S.; Molnar, P.; Rimkus, S.; Burlando, P. On the Effects of Small Scale Space–Time Variability of Rainfall on Basin Flood Response. J. Hydrol. 2014, 514, 313–327. [Google Scholar] [CrossRef]
- Wheater, H.S.; Chandler, R.E.; Onof, C.J.; Isham, V.S.; Bellone, E.; Yang, C.; Lekkas, D.; Lourmas, G.; Segond, M.-L. Spatial-Temporal Rainfall Modelling for Flood Risk Estimation. Stoch. Environ. Res. Risk Assess. 2005, 19, 403–416. [Google Scholar] [CrossRef]
- Fatichi, S.; Vivoni, E.R.; Ogden, F.L.; Ivanov, V.Y.; Mirus, B.; Gochis, D.; Downer, C.W.; Camporese, M.; Davison, J.H.; Ebel, B. An Overview of Current Applications, Challenges, and Future Trends in Distributed Process-Based Models in Hydrology. J. Hydrol. 2016, 537, 45–60. [Google Scholar] [CrossRef]
- Panagoulia, D.; Bárdossy, A.; Lourmas, G. Diagnostic Statistics of Daily Rainfall Variability in an Evolving Climate. Adv. Geosci. 2006, 7, 349–354. [Google Scholar] [CrossRef]
- Trenberth, K.E. The Impact of Climate Change and Variability on Heavy Precipitation, Floods, and Droughts. Encycl. Hydrol. Sci. 2005, 17, 1–11. [Google Scholar]
- Ramírez, J.A. Prediction and Modeling of Flood Hydrology and Hydraulics. In Inland Flood Hazards: Human, Riparian and Aquatic Communities; Cambridge University Press: Cambridge, UK, 2000; p. 498. [Google Scholar]
- Tapiador, F.J.; Turk, F.J.; Petersen, W.; Hou, A.Y.; García-Ortega, E.; Machado, L.A.; Angelis, C.F.; Salio, P.; Kidd, C.; Huffman, G.J. Global Precipitation Measurement: Methods, Datasets and Applications. Atmos. Res. 2012, 104, 70–97. [Google Scholar] [CrossRef]
- Rahman, M.A.; Yunsheng, L.; Sultana, N. Analysis and Prediction of Rainfall Trends over Bangladesh Using Mann–Kendall, Spearman’s Rho Tests and ARIMA Model. Meteorol. Atmos. Phys. 2017, 129, 409–424. [Google Scholar] [CrossRef]
- Borges, P.d.A.; Franke, J.; da Anunciação, Y.M.T.; Weiss, H.; Bernhofer, C. Comparison of Spatial Interpolation Methods for the Estimation of Precipitation Distribution in Distrito Federal, Brazil. Theor. Appl. Climatol. 2016, 123, 335–348. [Google Scholar] [CrossRef]
- Lima, A.O.; Lyra, G.B.; Abreu, M.C.; Oliveira-Júnior, J.F.; Zeri, M.; Cunha-Zeri, G. Extreme Rainfall Events over Rio de Janeiro State, Brazil: Characterization Using Probability Distribution Functions and Clustering Analysis. Atmos. Res. 2021, 247, 105221. [Google Scholar] [CrossRef]
- Marquínez, J.; Lastra, J.; García, P. Estimation Models for Precipitation in Mountainous Regions: The Use of GIS and Multivariate Analysis. J. Hydrol. 2003, 270, 1–11. [Google Scholar] [CrossRef]
- Atluri, G.; Karpatne, A.; Kumar, V. Spatio-Temporal Data Mining: A Survey of Problems and Methods. ACM Comput. Surv. 2018, 51, 1–41. [Google Scholar] [CrossRef]
- Cressie, N.; Wikle, C.K. Statistics for Spatio-Temporal Data; John Wiley & Sons: Hoboken, NJ, USA, 2015; ISBN 1-119-24304-1. [Google Scholar]
- Karpatne, A.; Ebert-Uphoff, I.; Ravela, S.; Babaie, H.A.; Kumar, V. Machine Learning for the Geosciences: Challenges and Opportunities. IEEE Trans. Knowl. Data Eng. 2018, 31, 1544–1554. [Google Scholar] [CrossRef]
- Pulukool, F.; Li, L.; Liu, C. Using Deep Learning and Machine Learning Methods to Diagnose Hailstorms in Large-Scale Thermodynamic Environments. Sustainability 2020, 12, 10499. [Google Scholar] [CrossRef]
- Schultz, M.G.; Betancourt, C.; Gong, B.; Kleinert, F.; Langguth, M.; Leufen, L.H.; Mozaffari, A.; Stadtler, S. Can Deep Learning Beat Numerical Weather Prediction? Philos. Trans. R. Soc. A 2021, 379, 20200097. [Google Scholar] [CrossRef]
- Salcedo-Sanz, S.; Ghamisi, P.; Piles, M.; Werner, M.; Cuadra, L.; Moreno-Martínez, A.; Izquierdo-Verdiguier, E.; Muñoz-Marí, J.; Mosavi, A.; Camps-Valls, G. Machine Learning Information Fusion in Earth Observation: A Comprehensive Review of Methods, Applications and Data Sources. Inf. Fusion 2020, 63, 256–272. [Google Scholar] [CrossRef]
- Dhall, D.; Kaur, R.; Juneja, M. Machine Learning: A Review of the Algorithms and Its Applications. In Proceedings of ICRIC 2019: Recent Innovations in Computing; Springer: Cham, Switzerland, 2020; pp. 47–63. [Google Scholar]
- Hiran, K.K.; Jain, R.K.; Lakhwani, K.; Doshi, R. Machine Learning: Master Supervised and Unsupervised Learning Algorithms with Real Examples (English Edition); BPB Publications: Noida, India, 2021; ISBN 93-91392-35-0. [Google Scholar]
- Nanga, S.; Bawah, A.T.; Acquaye, B.A.; Billa, M.-I.; Baeta, F.D.; Odai, N.A.; Obeng, S.K.; Nsiah, A.D. Review of Dimension Reduction Methods. J. Data Anal. Inf. Process. 2021, 9, 189–231. [Google Scholar] [CrossRef]
- Anowar, F.; Sadaoui, S.; Selim, B. Conceptual and Empirical Comparison of Dimensionality Reduction Algorithms (Pca, Kpca, Lda, Mds, Svd, Lle, Isomap, Le, Ica, t-Sne). Comput. Sci. Rev. 2021, 40, 100378. [Google Scholar] [CrossRef]
- Sisodia, D.; Singh, L.; Sisodia, S.; Saxena, K. Clustering Techniques: A Brief Survey of Different Clustering Algorithms. Int. J. Latest Trends Eng. Technol. (IJLTET) 2012, 1, 82–87. [Google Scholar]
- Celebi, M.E.; Aydin, K. Unsupervised Learning Algorithms; Springer: Cham, Switzerland, 2016; Volume 9. [Google Scholar]
- Xu, R.; Wunsch, D. Survey of Clustering Algorithms. IEEE Trans. Neural Netw. 2005, 16, 645–678. [Google Scholar] [CrossRef]
- Liu, Y.-Y.; Li, L.; Liu, Y.-S.; Chan, P.W.; Zhang, W.-H. Dynamic Spatial-Temporal Precipitation Distribution Models for Short-Duration Rainstorms in Shenzhen, China Based on Machine Learning. Atmos. Res. 2020, 237, 104861. [Google Scholar] [CrossRef]
- Oppel, H.; Fischer, S. A New Unsupervised Learning Method to Assess Clusters of Temporal Distribution of Rainfall and Their Coherence with Flood Types. Water Resour. Res. 2020, 56, e2019WR026511. [Google Scholar] [CrossRef]
- Mercer, A.; Dyer, J. A Southeastern United States Warm Season Precipitation Climatology Using Unsupervised Learning. Climate 2022, 11, 2. [Google Scholar] [CrossRef]
- Wang, L.; Shi, Z.; Ye, L.; Su, B. Analysis on the Characteristics of Extreme Weather Events in Kunming City during Recent 20 Years. IOP Conf. Ser. Earth Environ. Sci. 2019, 252, 042124. [Google Scholar] [CrossRef]
- Zhang, Y.; Luo, Y.; Su, H. Study on Land Use and Precipitation Changes in the Main Urban Area of Kunming in the Past 40 Years. IOP Conf. Ser. Earth Environ. Sci. 2021, 658, 012008. [Google Scholar] [CrossRef]
- Roweis, S.T.; Saul, L.K. Nonlinear Dimensionality Reduction by Locally Linear Embedding. Science 2000, 290, 2323–2326. [Google Scholar] [CrossRef]
- Chang, H.; Yeung, D.-Y. Robust Locally Linear Embedding. Pattern Recognit. 2006, 39, 1053–1065. [Google Scholar] [CrossRef]
- Shi, N.; Liu, X.; Guan, Y. Research on K-Means Clustering Algorithm: An Improved k-Means Clustering Algorithm. In Proceedings of the 2010 Third International Symposium on Intelligent Information Technology and Security Informatics, Jian, China, 2–4 April 2010; IEEE: Piscataway, NJ, USA, 2010; pp. 63–67. [Google Scholar]
- Žalik, K.R. An Efficient K′-Means Clustering Algorithm. Pattern Recognit. Lett. 2008, 29, 1385–1391. [Google Scholar] [CrossRef]
- Hamerly, G.; Elkan, C. Learning the k in K-Means. In Advances in Neural Information Processing Systems; MIT Press: Cambridge, MA, USA, 2003; Volume 16. [Google Scholar]
- Krishna, K.; Murty, M.N. Genetic K-Means Algorithm. IEEE Trans. Syst. Man Cybern. Part B (Cybern.) 1999, 29, 433–439. [Google Scholar] [CrossRef]


| Type | Month | Number of Rainfall Events | Duration | Average Surface Rainfall [mm] | Maximum Hourly Rainfall Intensity at the Center of the Rainfall [mm/h] |
|---|---|---|---|---|---|
| 1 | 5 | 8 | 3.45 | 6.21 | 18.45 |
| 6 | 15 | 4.95 | 14.46 | 30.00 | |
| 7 | 21 | 6.78 | 16.81 | 31.50 | |
| 8 | 19 | 4.28 | 9.28 | 26.67 | |
| 9 | 16 | 4.61 | 11.13 | 23.54 | |
| 2 | 5 | 1 | 1.33 | 4.57 | 11.00 |
| 6 | 6 | 4.59 | 13.17 | 29.67 | |
| 7 | 7 | 3.58 | 6.17 | 16.24 | |
| 8 | 12 | 5.12 | 15.31 | 33.14 | |
| 9 | 4 | 3.65 | 5.50 | 17.28 | |
| 3 | 5 | 3 | 4.14 | 10.15 | 19.73 |
| 6 | 14 | 4.47 | 14.55 | 28.89 | |
| 7 | 14 | 4.79 | 11.06 | 19.89 | |
| 8 | 11 | 3.78 | 7.60 | 23.53 | |
| 9 | 10 | 2.92 | 6.01 | 19.53 |
Disclaimer/Publisher’s Note: The statements, opinions and data contained in all publications are solely those of the individual author(s) and contributor(s) and not of MDPI and/or the editor(s). MDPI and/or the editor(s) disclaim responsibility for any injury to people or property resulting from any ideas, methods, instructions or products referred to in the content. |
© 2024 by the authors. Licensee MDPI, Basel, Switzerland. This article is an open access article distributed under the terms and conditions of the Creative Commons Attribution (CC BY) license (https://creativecommons.org/licenses/by/4.0/).
Share and Cite
Lin, W.; Liu, Y.; Li, N.; Wang, J.; Zhang, N.; Wang, Y.; Wang, M.; Ren, H.; Li, M. Study of the Spatiotemporal Distribution Characteristics of Rainfall Using Hybrid Dimensionality Reduction-Clustering Model: A Case Study of Kunming City, China. Atmosphere 2024, 15, 534. https://doi.org/10.3390/atmos15050534
Lin W, Liu Y, Li N, Wang J, Zhang N, Wang Y, Wang M, Ren H, Li M. Study of the Spatiotemporal Distribution Characteristics of Rainfall Using Hybrid Dimensionality Reduction-Clustering Model: A Case Study of Kunming City, China. Atmosphere. 2024; 15(5):534. https://doi.org/10.3390/atmos15050534
Chicago/Turabian StyleLin, Weijie, Yuanyuan Liu, Na Li, Jing Wang, Nianqiang Zhang, Yanyan Wang, Mingyang Wang, Hancheng Ren, and Min Li. 2024. "Study of the Spatiotemporal Distribution Characteristics of Rainfall Using Hybrid Dimensionality Reduction-Clustering Model: A Case Study of Kunming City, China" Atmosphere 15, no. 5: 534. https://doi.org/10.3390/atmos15050534