Article

Aerosol Optical Properties Based on Ground and Satellite Retrievals during a Serious Haze Episode in December 2015 over Beijing

1
Plateau Atmospheric and Environment Laboratory of Sichuan Province, College of Atmospheric Science, Chengdu University of Information Technology, Chengdu 610225, China
2
State Key Laboratory of Severe Weather (LASW), Institute of Atmospheric Composition, Chinese Academy of Meteorological Sciences, Beijing 100081, China
3
National Meteorological Center, CMA, Beijing 100081, China
4
School of Architectural and Surveying & Mapping Engineering, Jiangxi University of Science and Technology, Ganzhou 34100, China
5
Key Laboratory for Aerosol-Cloud-Precipitation of China Meteorological Administration, Nanjing University of Information Science and Technology, Nanjing 210044, China
*
Authors to whom correspondence should be addressed.
Atmosphere 2016, 7(5), 70; https://doi.org/10.3390/atmos7050070
Submission received: 29 April 2016 / Revised: 18 May 2016 / Accepted: 18 May 2016 / Published: 20 May 2016
(This article belongs to the Special Issue Atmospheric Aerosols and Their Radiative Effects)

Abstract

:
An extreme haze event occurred in the Beijing area from 17 to 23 December 2015. Ground-based measurements and satellite observations during this event were used to further our understanding of the formation process of haze pollution and aerosol optical properties. The results suggest that high relative humidity, poor diffusion conditions (low wind speed and stable stratification) and favorable secondary transformation conditions under the hygroscopic growth of aerosol and high emissions led to this serious haze episode. During the haze period, the daily average value was 1.15 and 0.42 for aerosol optical depth (AOD500nm) and columnar water-vapor (CWV, in cm), respectively. On 19 December, the correlation coefficient between CWV and AOD500nm was 0.91, indicating the effect of hygroscopic growth of fine-mode articles. The daily average values for Ångström exponent, fine-mode fraction, aerosol absorption optical depth, and Ångström absorption exponent were 1.19, 0.81, 0.11 and 1.47, respectively, which suggests that fine aerosol particles were dominant in the atmosphere and fine-mode particles were the dominant contributor to atmospheric extinction during the haze period. Moreover, it also reflects that there were more absorbing aerosol particles during the haze period. Compared with other polluted periods with a bimodal distribution, there was an obvious trimodal distribution on 19 December. There were three peaks at radii of about 0.1 μm, 0.5–0.8 μm and 4 μm. Satellite observations show that there was an obvious aerosol layer in the Beijing area during the haze period, concentrated at ground level to within 2 km in the upper layers. The types of aerosol were mainly composed of mixed pollution aerosols.

1. Introduction

Aerosol particles have a substantial influence on global and regional climate change by absorbing and scattering solar radiation [1,2]. Furthermore, aerosol particles not only contribute to global and regional visibility change, but also cause other environmental and public health problems [3,4,5]. Despite extensive efforts having been made to analyze the properties, processes and sources of aerosol particles, their concentrations and optical properties remain one of the largest sources of uncertainty in current assessments and interpretations of Earth’s changing energy budget [6,7].
In the past two decades, Beijing has experienced serious haze pollution characterized by high levels of particle matter (PM), which has become a key pollutant [8]; the concentrations of PM2.5 (PM with diameters ≤ 2.5 μm) often exceed the new national ambient air quality standards of China (75 μg/m3 for a 24-h average) [9]. By using air trajectories, numerical simulations and other methods to study the formation mechanism of regional haze, it has been shown that an increase in emission sources (e.g., biomass burning and dust) and poor diffusion conditions (such as stable stratification and low wind speed) are particularly important factors [10,11,12,13]. The effect on atmospheric visibility will then be further increased by the hygroscopic growth of aerosol particles [14]. Therefore, haze episodes occur frequently in Beijing, especially under high relative humidity (RH). Numerous studies have investigated the aerosol optical properties of haze pollution in megacities in China, leading to a comprehensive understanding of haze pollution [15,16,17]. Satellite remote sensing and ground-based observation are the two most important ways for monitoring aerosol properties in the long-term [18]. There are several well-known ground-based networks that use sunphotometers, such as AERONET (Aerosol Robotic Network) [19], PHOTONS (PHOtométrie pour le Traitement Opérationnel de Normalisation Satellitaire) [20], CARSNET (China Aerosol Remote Sensing Network) [21,22], and SKYNET [23]. These networks have been used to measure direct and diffuse solar radiation, and so derive aerosol optical, microphysical and radiative properties for aerosol research and the characterization and validation of satellite retrievals. The formation mechanisms and chemical characteristics of aerosol in haze events in Beijing have been investigated [11,24]. However, studies on the optical properties of haze aerosol in Beijing are rather limited.
In the present work, a comprehensive study was carried out during a haze event over the Beijing area from 17 to 23 December 2015, by using a combination of ground-based and satellite observations. The results will help not only to uncover the mechanism of haze event formation, but also improve knowledge on aerosol optical properties during haze events in the Beijing area.

2. Data and Analysis Method

2.1. Site Description and Instrumentation

A Cimel CE-318 sunphotometer (No. 746) was installed on the roof of the Chinese Academy of Meteorological Sciences (CAMS) building ((39.933°N, 116.317°E); 106 m). The measurements of aerosol optical properties at this site can be considered representative of the urban areas of Beijing [21]. The sunphotometer is operational within both CARSNET and AERONET [19], and is calibrated using the PHOTONS calibration facility in Lille (LOA/USTL, France) and the Izaña Observatory (Tenerife, Spain) [25]. CAMS is the main site of CARSNET, but measurements are also uploaded to the AERONET data archive [15]. Recently, Zheng et al. analyzed aerosol optical properties over Beijing during the world athletics championships and victory day military parade based on the data from CAMS site [26]. The CE-318 sunphotometer is an automatic tracking sun and sky scanning radiometer [19]. The particular instrument used in this study makes direct spectral solar radiation measurements within a 1.2° full field-of-view in the eight normal bands between 340 and 1640 nm (340, 380, 440, 500, 675, 870, 1020, and 1640 nm), and one water vapor band (940 nm). Measurements in these eight normal bands are used to retrieve aerosol optical depth (AOD), and measurements at 940 nm are used to calculate columnar water-vapor (CWV, in cm). The raw AOD is cloud-screened based on the work of Smirnov [27]. The total uncertainty in AOD is approximately 0.01–0.02 [28]. The sky radiance for solar almucantar and principal plane scenario measurements in the four bands of 440 nm, 670 nm, 870 nm and 1020 nm can be used for aerosol optical property retrievals such as single scattering albedo (SSA), aerosol size distribution, refractive index, asymmetry factor, and sphericity [29,30]. In this study, we used the aerosol optical properties observational data of level 1.5, which can be downloaded from the AERONET website [19]. Level 2.0 data are not available on the AERONET website over this site for both sun and inversion products.

2.2. Meteorological Data and Ground Measurements

In this study, the surface meteorological data from 17 to 23 December 2015 were obtained from the China Meteorological Administration. We used ERA-Interim data [31] to analyze the regional variations of wind fields at the surface and at 850 hPa. The radiosonde data of Beijing meteorological site (54,511) were used to analyze the vertical variations by temperature. The 3-day backward trajectories from NOAA’s HYSPLIT (HYbrid Single-Particle Lagrangian Integrated Trajectory) model [32] were used to track the transport paths of air masses that arrived in Beijing during the haze event. The hourly PM2.5 and PM10 data for the same period in Beijing were obtained from the China National Environmental Monitoring Centre. These data were measured by TEOM 1405; the uncertainty was ±2.0 μg/m3.

2.3. Satellite Datasets

Dust storms, heavy smog and cirrus clouds can be easily identified by MODIS true color images. In this study, 1 km MODIS true color images were used to provide an overview of the general atmospheric conditions. The CALIOP (Cloud-Aerosol LiDAR with Orthogonal Polarization) instrument on board the CALIPSO satellite can provide vertical profiles of optical properties of aerosol and cloud layers [33,34]. The aerosol subtype can be determined by using optical properties of the aerosols integrated with layer altitude and surface type. The CALIPSO models define six aerosol types including dust, smoke, polluted dust, clean continental, polluted continental, and clean marine [34]. The daytime data can be influenced by the noise of strong solar radiation, so the daytime data were only used for reference. In this study, we mainly analyzed the nighttime CALIPSO V3.30 data.

3. Results and Discussion

3.1. Meteorological Conditions and Pollutant Concentrations

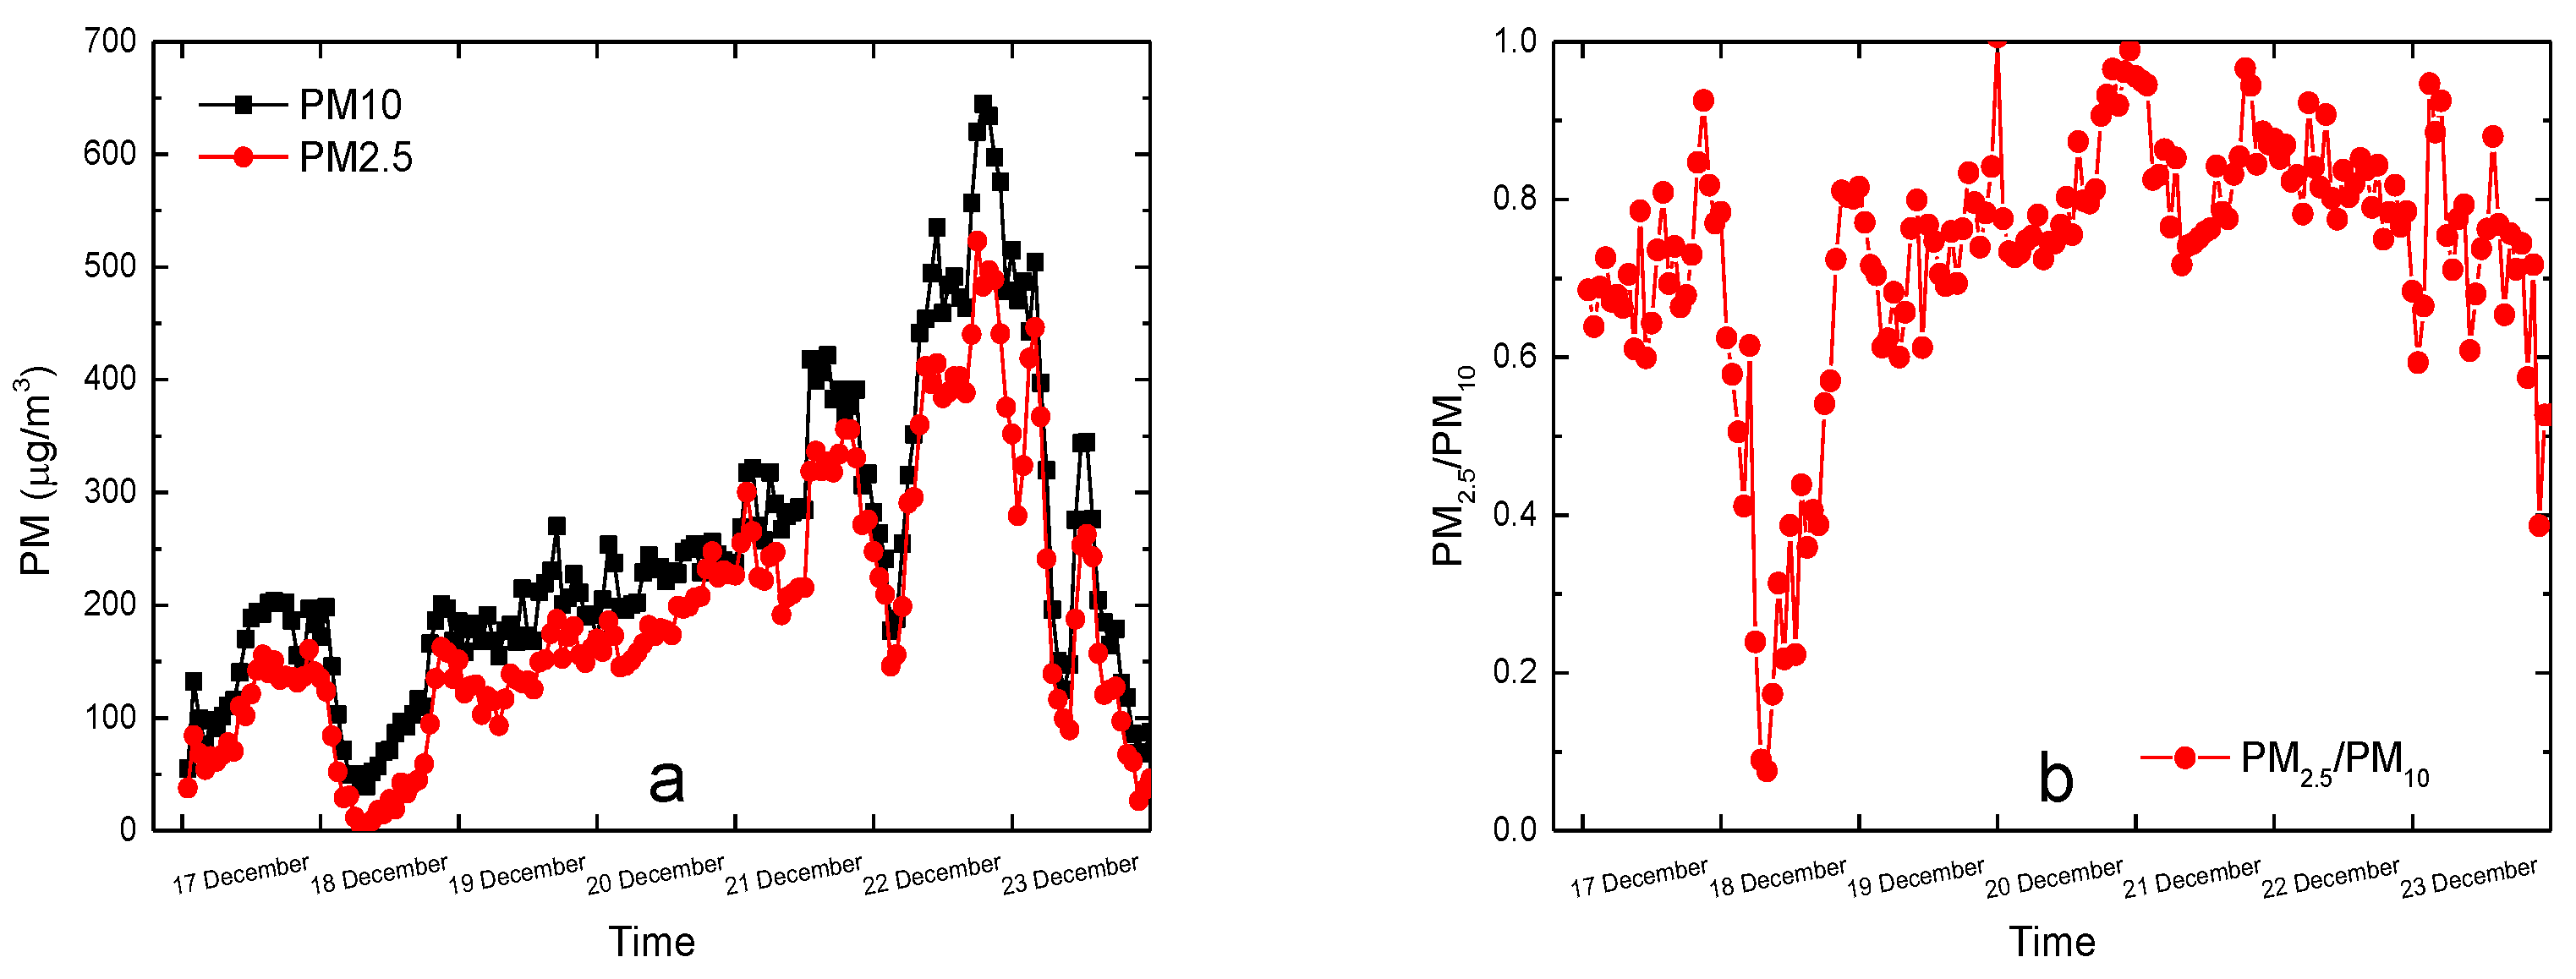
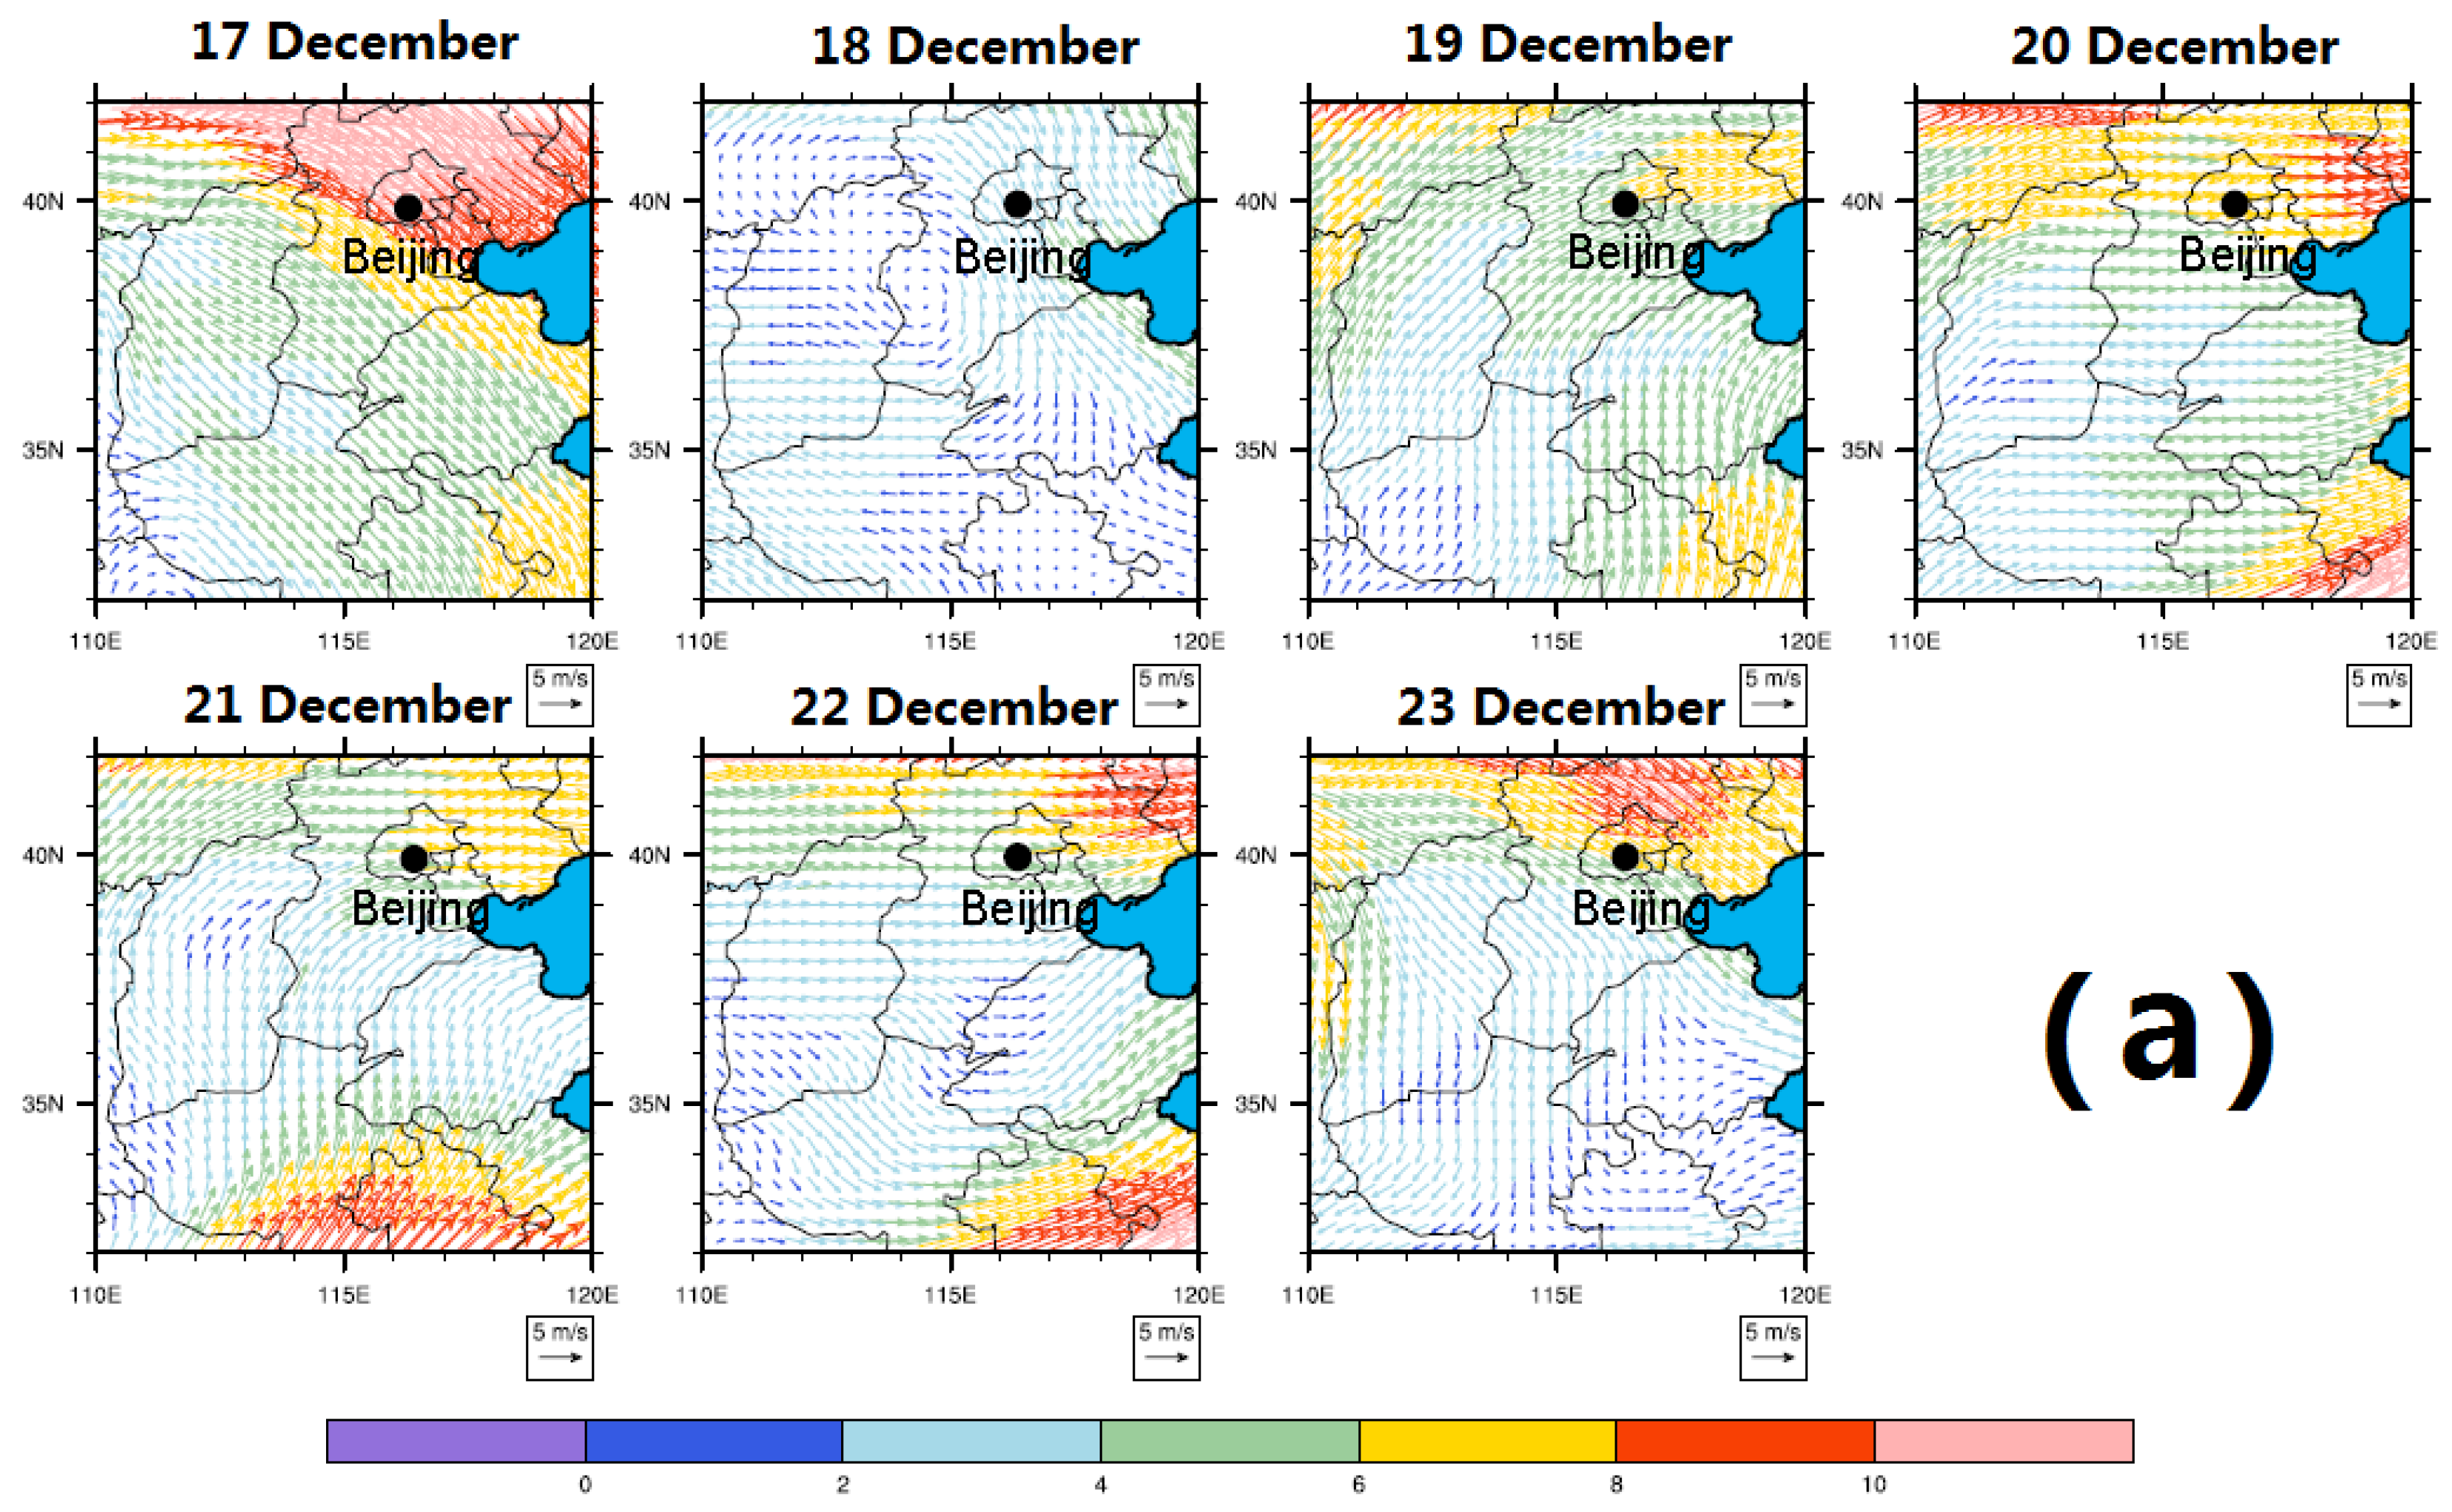
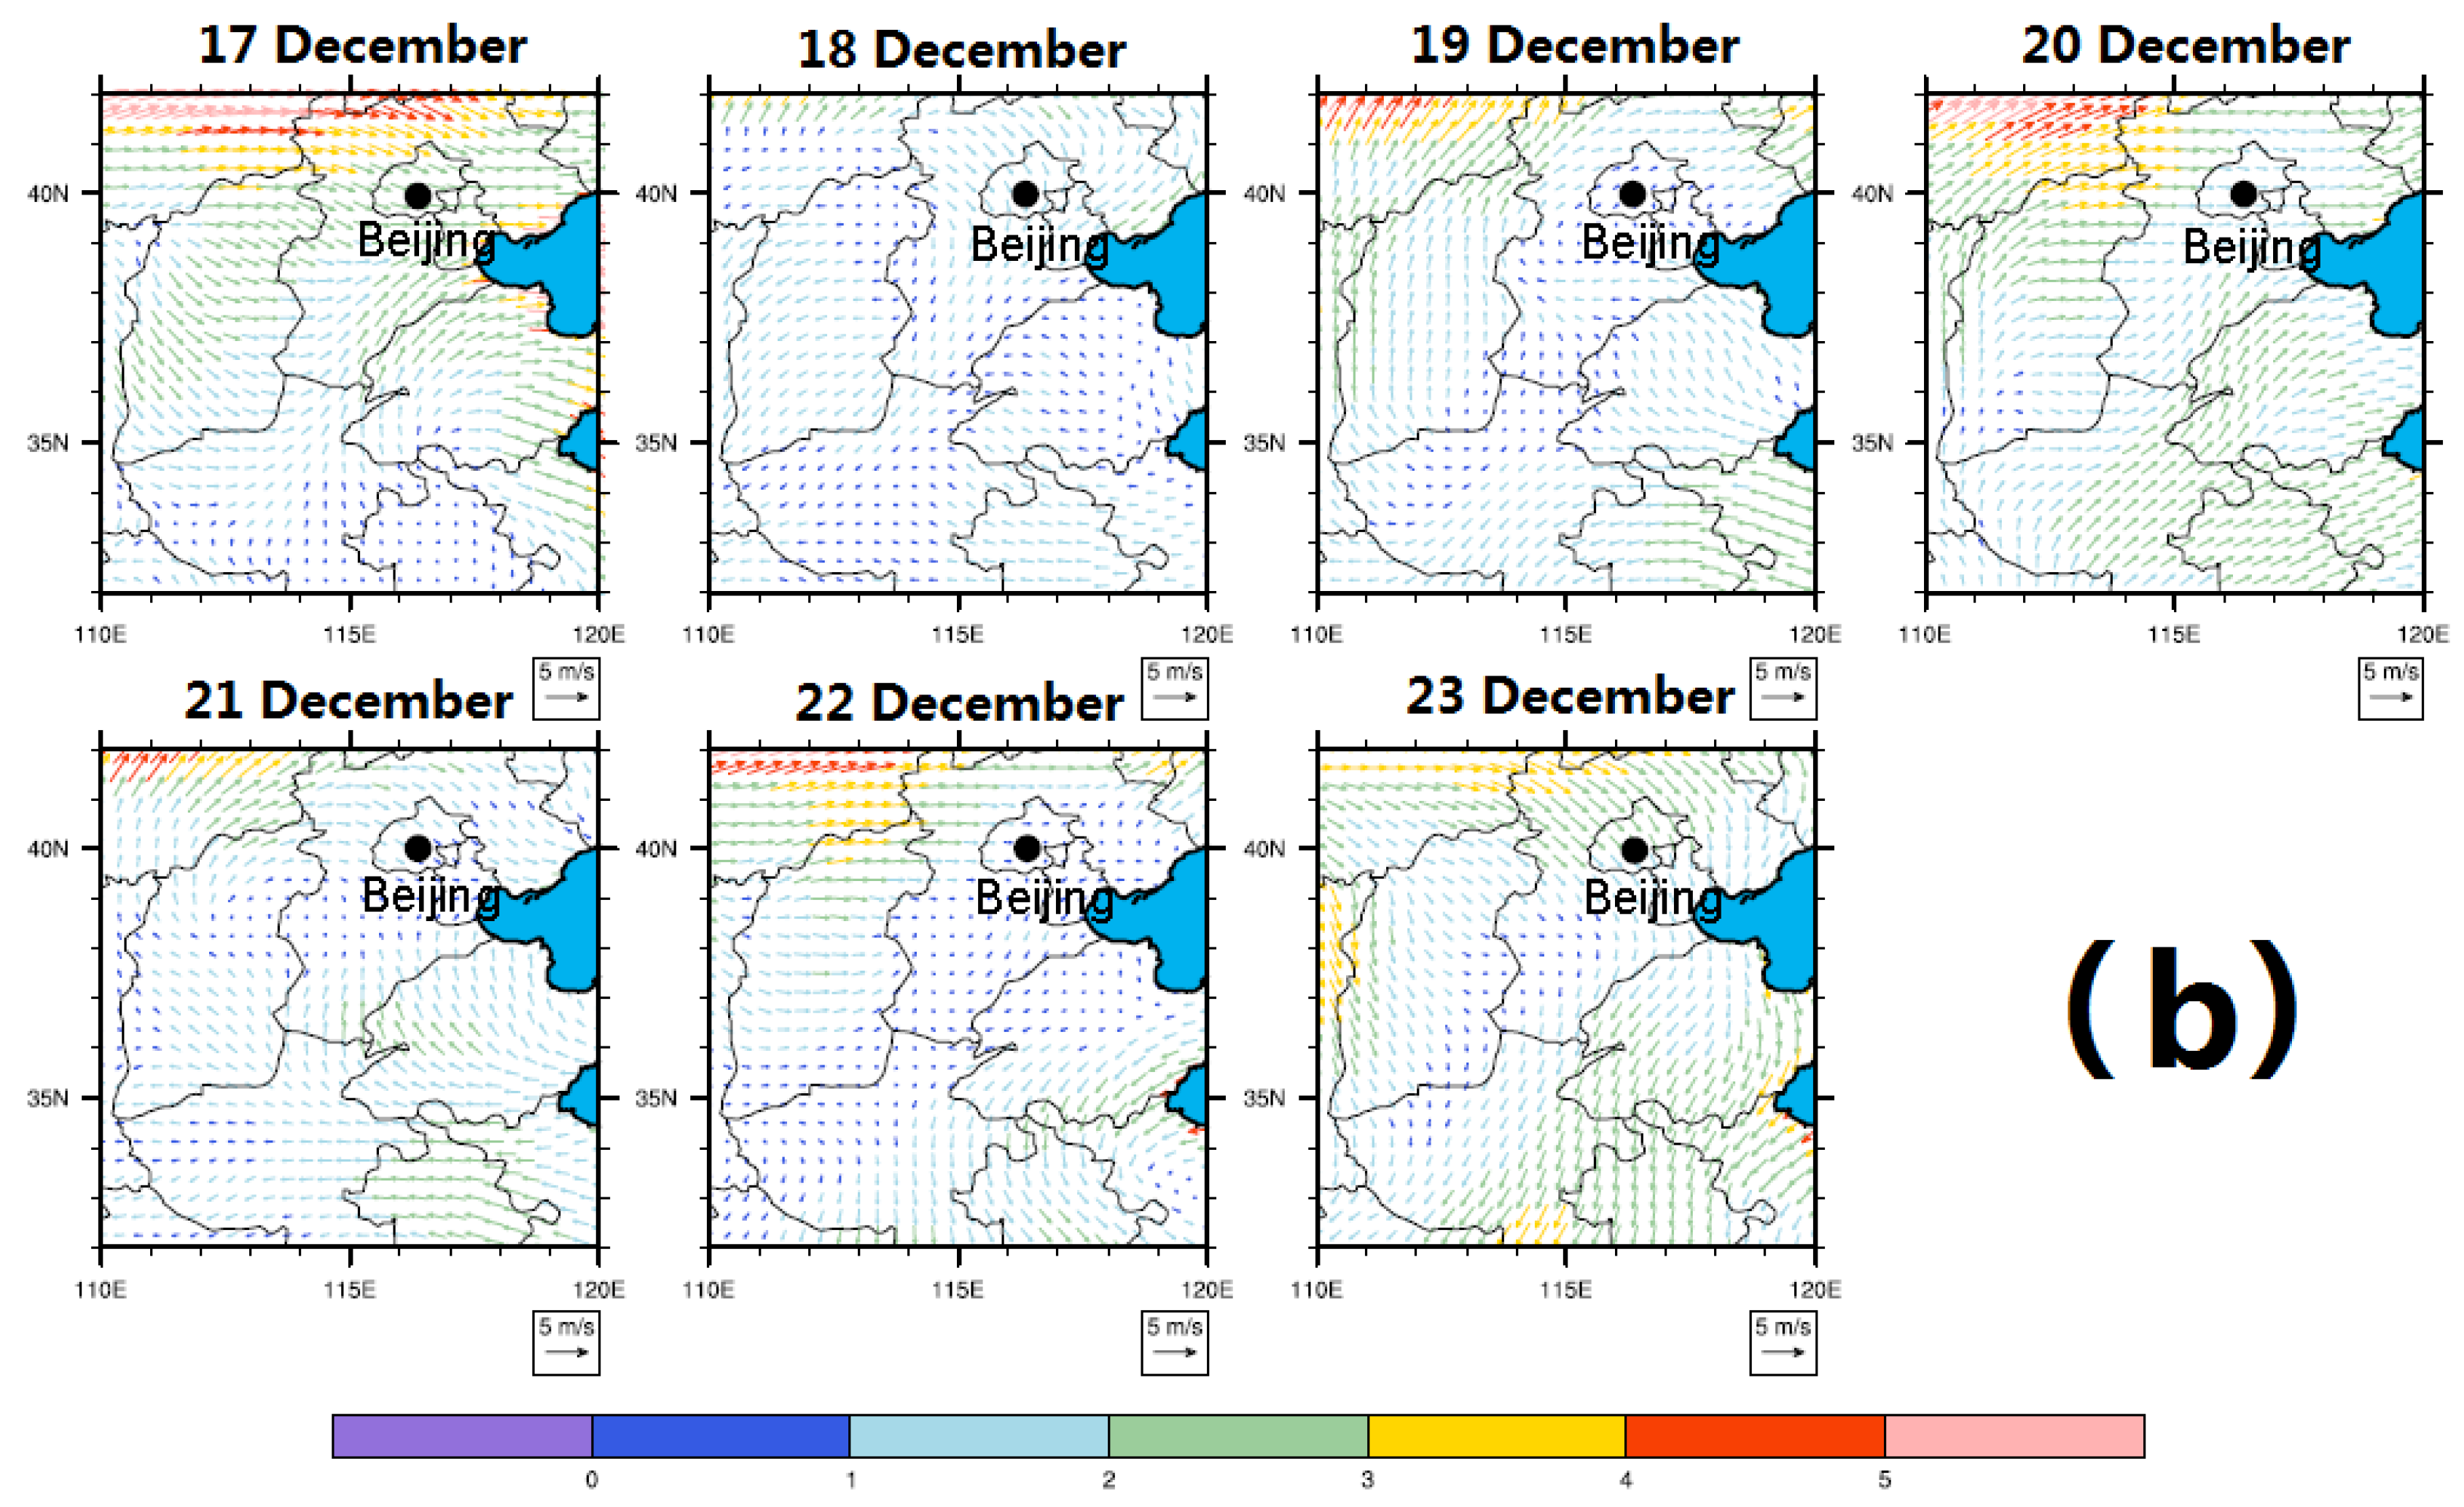
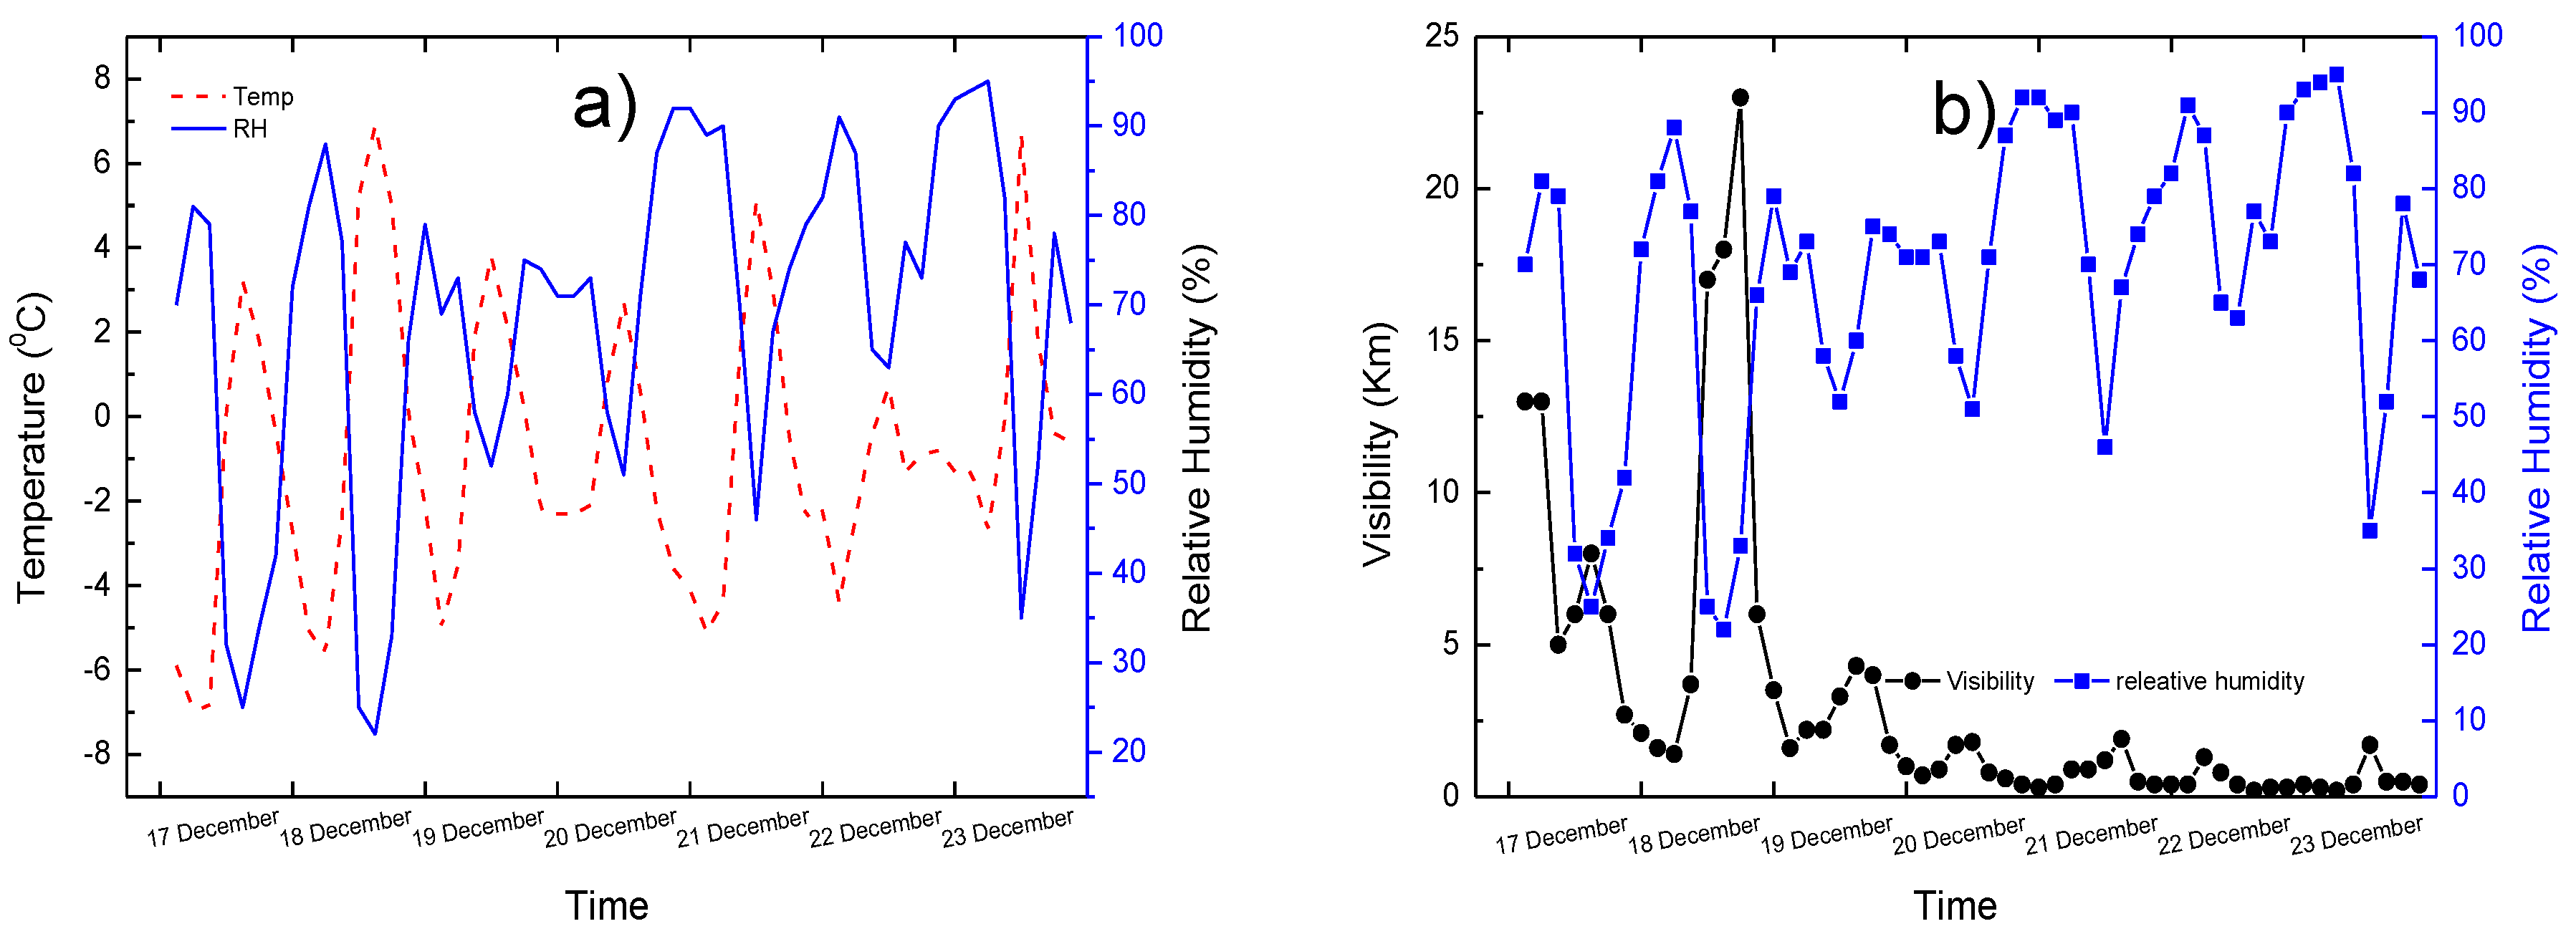
3.1.1. Analysis of PM and Meteorological Data

Figure 1 and Figure 2 show the daily mean variation of PM2.5 and wind fields in the Beijing area, respectively. Fu [35] pointed out that the temporal trends of low visibility, haze and fog are mainly affected by the emissions of pollutants, aerosol compositions and meteorological conditions. A complete haze process was selected to analyze the causes of the formation of haze and the aerosol optical properties during the most intense haze period from 17 to 23 December 2015. According to the results of Fu [35], the direction of the wind can affect the transport of pollutants, and can determine the spatial distribution of visibility. The wind speed is also an important factor of influence for PM2.5, and can affect the accumulation and diffusion of aerosol particles [15]. According to Figure 1 and Figure 2, it is clear that the direction of the wind at the surface and at 850 hPa was similar (northwesterly), and there was high wind speed (>2 m/s at surface, >8 m/s at 850 hPa) during the development of the haze period on 17 December, which was conducive to the spread of haze. This is one of the reasons for the reduction in the concentration of PM in the latter part of the day on 17 December. Compared with 17 December, on 18 December, the wind speed decreased significantly and the concentration of PM began to rise. From 19 to 21 December, the concentration of PM continued to rise, and it reached a maximum on 22 December, with values of 520 μg/m3 and 645 μg/m3 for PM2.5 and PM10, respectively. Compared with 18 December, on 19 December, the wind direction at 850 hPa changed from northwesterly to southwesterly, suggesting that the air pollutants in the Beijing area were not only from local emissions but also from transport from other places (such as Hebei Province). Thereafter, the wind speed at the surface and at 850 hPa gradually decreased, and finally reached relatively calm wind conditions (wind speed < 1 m/s) on 22 December. In addition, due to the continuous existence of an inversion layer (discussed in the following section), the wind speed and wind direction were not conducive to the spread of pollutants; surface contaminants accumulated gradually, which explains why the concentration of pollutants reached a maximum on 22 December. On 23 December, the direction of wind turned northwesterly and the wind speed increased (>2 m/s at the surface, >6 m/s at 850 hPa). The wind speed and direction were conducive to the spread of pollutants; the concentration of PM2.5 gradually reduced to 25 μg/m3. Figure 1b shows the daily variation in the proportion of PM2.5/PM10 during the haze period. It is clear that the proportion of PM2.5/PM10 was larger than 60%, except on 18 December; and the 7-day average of PM2.5/PM10 was 72.0%, suggesting that the proportion of fine PM was higher, and the accumulation of a large number of fine particles was an important reason for the formation of the haze event. The average of PM2.5/PM10 was 35% in the non-pollution episode on December 2015.
Figure 3 shows the temporal variation of meteorological parameters and pollutants during the haze event in the Beijing area. As shown in Figure 3a, both temperature and RH possessed obvious diurnal variation and a strong negative correlation. During the haze event, RH remained high, indicating that high RH is a crucial factor in haze formation. Hennigan [36] pointed out that high RH is conducive to the formation of secondary aerosol species such as NO3, SO42−, and other secondary organic compounds. Fu [35] indicated that RH has an effect on the hygroscopic growth and scattering ability of aerosol PM, thereby influencing visibility. As shown in Figure 3b, from 19 to 23 December, visibility decreased gradually, reaching its lowest level with an average visibility of 0.51 km on 22 December. There was a negative correlation (correlation coefficient of −0.45) between visibility and RH, indicating RH was a crucial factor affecting visibility. As shown in Figure 3c, similar to the results in Figure 3b, there was also a negative correlation (correlation coefficient of −0.46) between PM2.5 and RH, demonstrating that visibility was to some extent affected by the concentration of PM2.5, and may also have been related to the abilities of absorption and scattering, which are controlled by microphysical properties as size, shape and refractive index. Thus, there are different direct and indirect relationships between particle quantities and visibility.

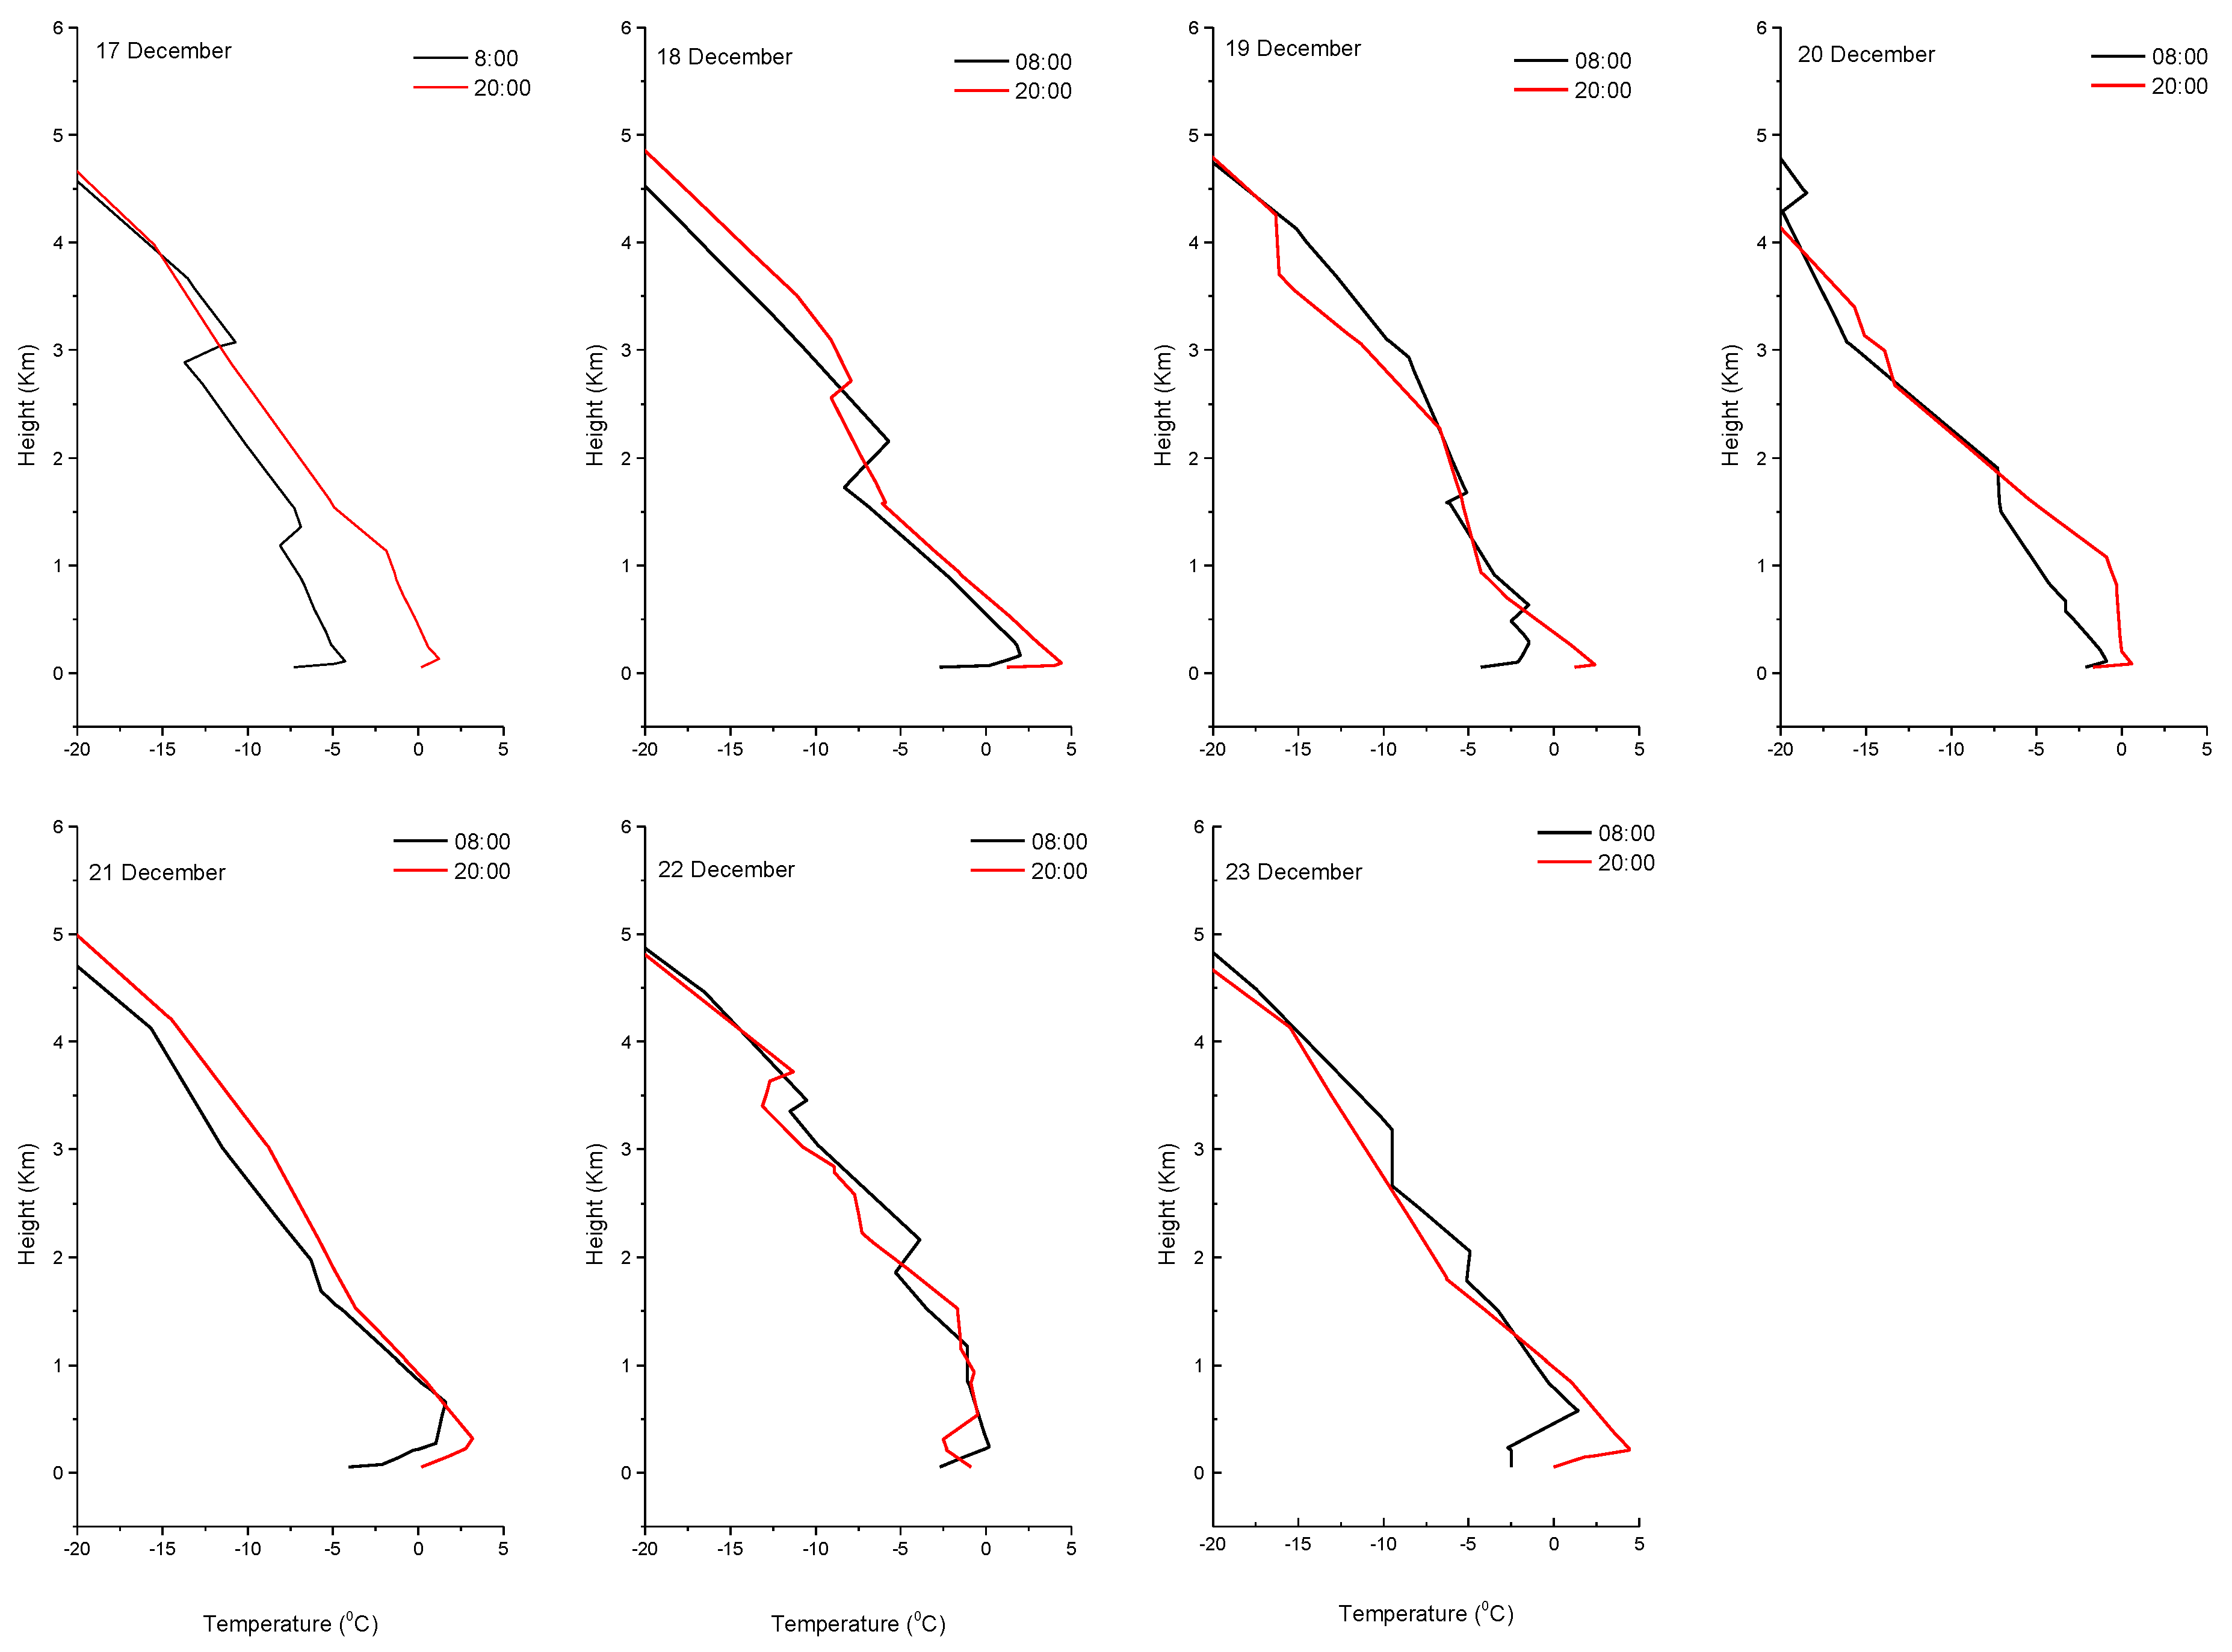
3.1.2. Analysis of Atmospheric Temperature Stratification

Wang [37] pointed out that a continuous temperature inversion occurring in the vertical direction at the near-surface is conducive to haze weather. The upper air temperature is higher than that at low altitude, causing limited motion of low-altitude air in the vertical direction, which restricts pollutants from diffusing to higher altitudes, eventually leading to pollution being blocked near the ground. Figure 4 shows the vertical distribution of temperature in the Beijing area from 17 to 23 December 2015. It is clear that there were continuous temperature inversions in the ground layer, and that they sometimes even presented at higher altitudes. On 17 December, the temperature inversion at 0800 LT (local time) was stronger than that at 2000 LT. Combined with Figure 1a, it can be used as one reason to explain why the haze reduced on 17 December. On 18 December, the temperature inversion at 0800 LT and at 2000 LT was strong; and not only was there a near-ground inversion, but also one at 1.5–2.5 km. Thus, it can be seen that, at these moments, pollutants would have accumulated near the ground, which could be one reason why haze gradually increased on that day. After 18 December, the inversion layer still existed, and it corresponded to the concentration rise of PM2.5 and PM10 shown in Figure 1a. Interestingly, in analyzing the vertical distribution of temperature on 22 December, the temperature inversion was not only present near the ground, but was also obvious at 1.5–2.4 km, where its strength was even greater than at ground level. Thus, it can be seen that vertical movement of air near the ground was minimal, and the temperature inversion of the upper layer prevented the diffusion of surface pollution, so contributing to the accumulation of pollutants. It also explains why the pollutants accumulated to reach a peak on 22 December. The temperature inversion continued on 23 December and, on that day, after 2000 LT, its intensity decreased and gradually disappeared. At the same time, the haze also gradually dissipated.
To summarize, temperature inversion near the ground limits the diffusion of pollutants produced by human activity. The emergence of temperature inversion above 1.5 km prevents pollutant diffusion below 1.5 km, thus causing accumulation into a thicker aerosol layer, and ultimately leading to continuous pollution weather.

3.2. Aerosol Optical Properties

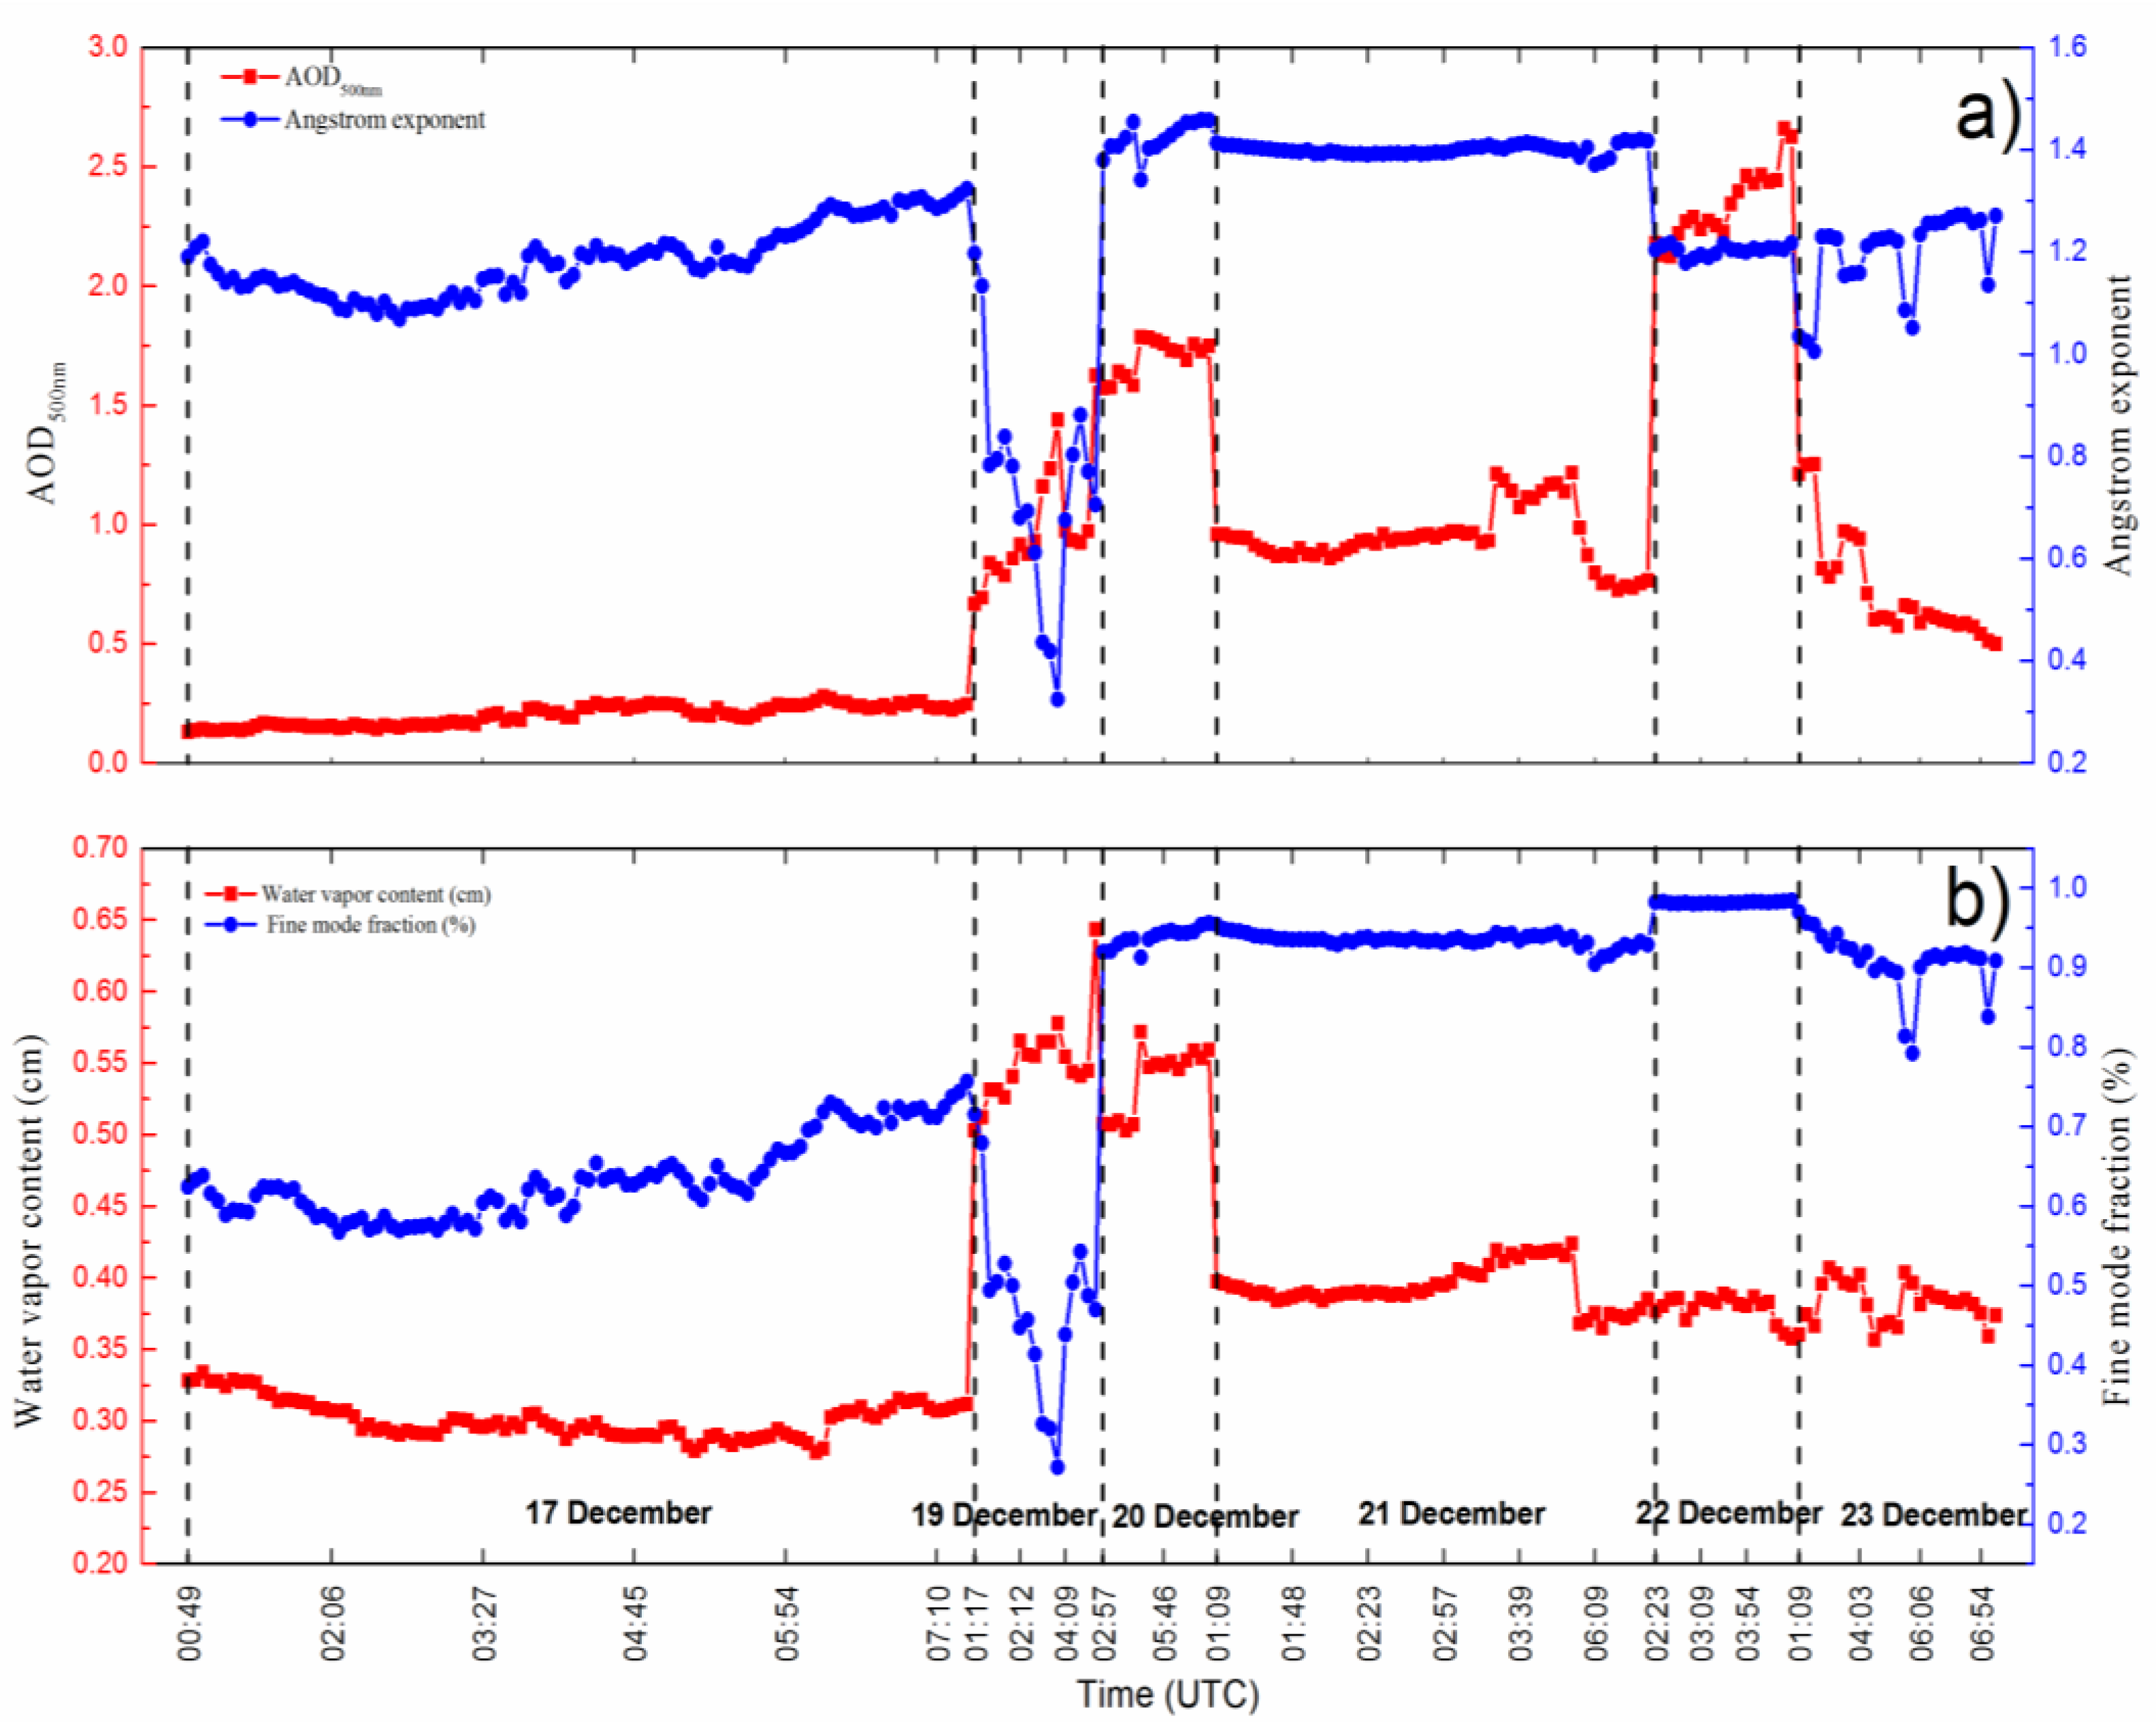
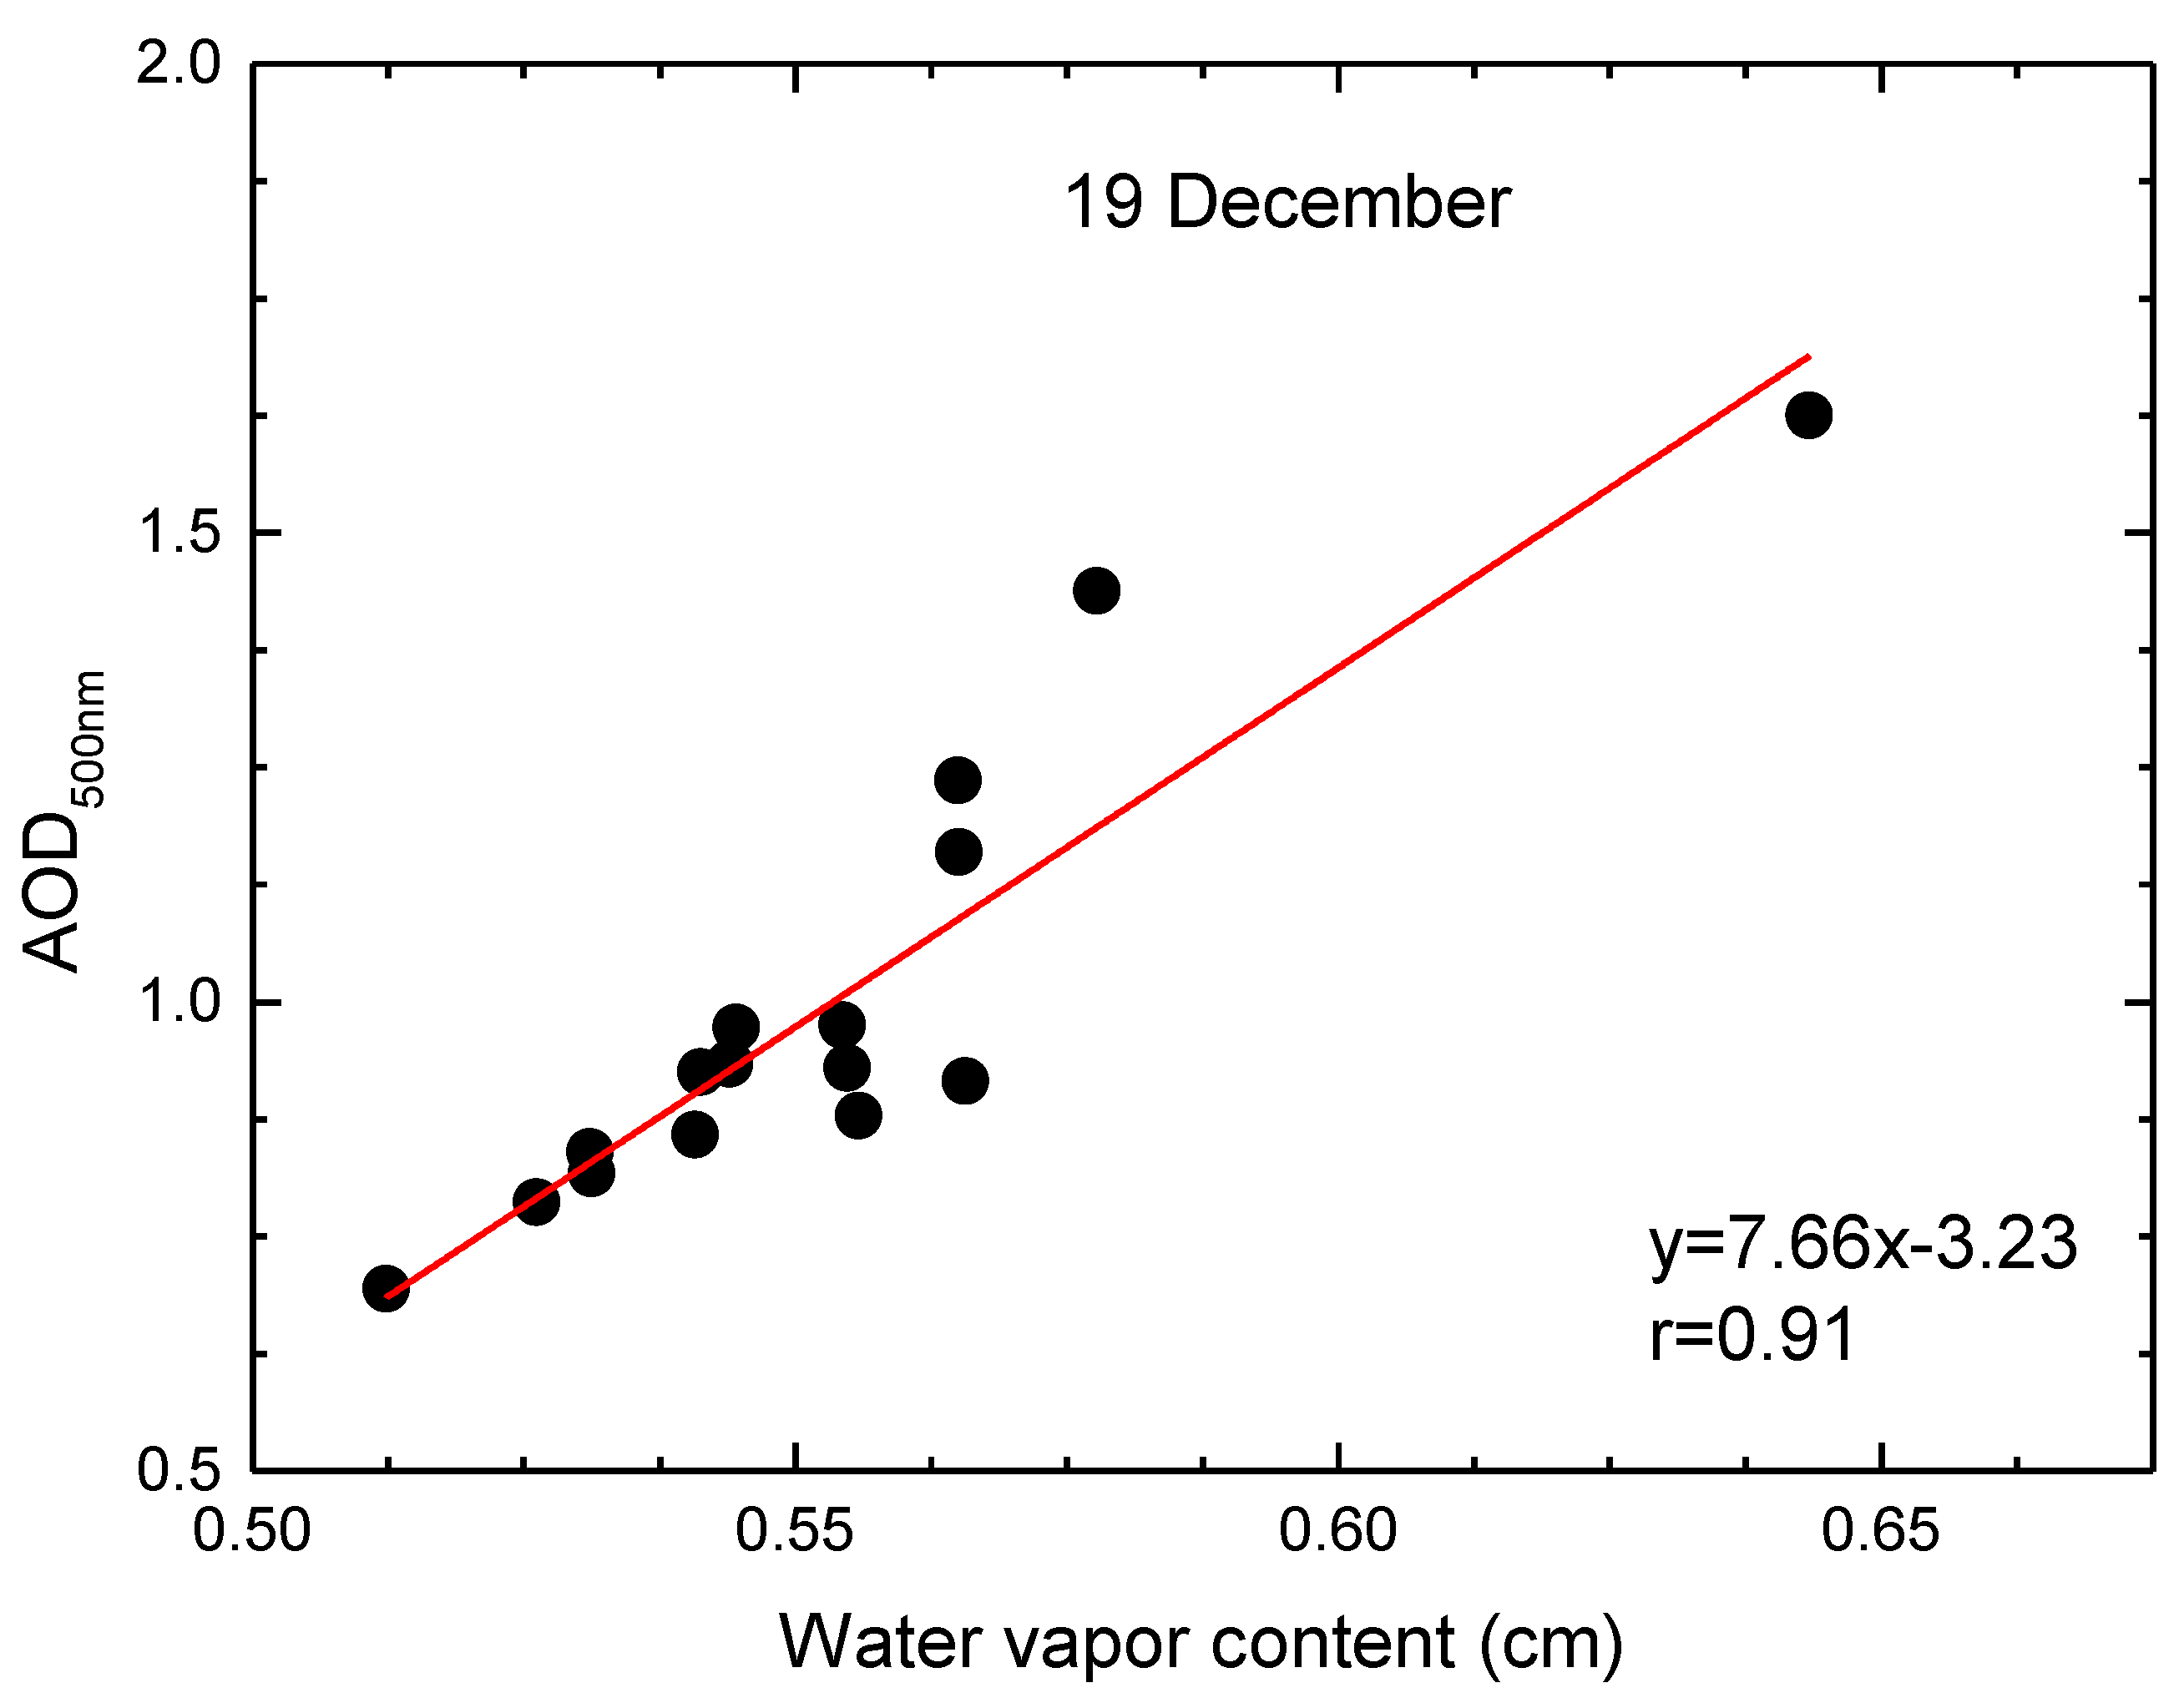
3.2.1. AOD, Ångström Exponent, CWV, and Fine-Mode Fraction

Fu [35] pointed out that haze events are caused by either high aerosol loadings or the strong hygroscopic growth of aerosols. Figure 5a shows the daily variation of AOD500nm and Ångström exponent (AE) (the missing AOD data are due to cloud accumulation on 18 December). As shown in Figure 5a, AOD500nm maintained a low level on 17 December; the daily average value was 0.20 and 1.18 for AOD and AE, respectively, which suggests that small aerosol particles were dominant. On 19 December, AOD values were mostly higher than 0.80. AE showed a decreasing trend during the first half of 19 December, showing that the particle size increased constantly, considering the wind speed was low, and so it mainly reflected the hygroscopic growth characteristics of fine particles. AE then gradually increased, indicating that the particle size decreased gradually, which may have been due to the increase in temperature in the afternoon; gas-to-particle conversion would have resulted in fine particles increasing, and there would also have been an effect of residual aerosols after droplet evaporation. Compared with 19 December, on 20 December, AOD increased significantly; AOD values were mostly higher than 1.50, peaking at noon with a value of 1.78, and then presented a fluctuating declining trend. Compared with the coarse-particle characteristics on 19 December, AE on 20 December was significantly different, caused by the hygroscopic growth of a large number of fine particles; AE was between 1.30 and 1.50, showing that the atmosphere was mainly composed of fine particles. Compared with the AE value on 20 December, the AE on 21 December varied by about 0.70–1.30 (maximum: 1.22), with a significant decreasing trend followed by a fluctuating declining trend. AE was greater than 1.3 on 21 December, indicating that particles were basically made up of fine particles. On 22 December, with the aggravation of haze, the AOD increased significantly. AOD was greater than 2.0 throughout the day, and the average daily AOD was 2.34, with a maximum value of 2.62. The AE on 22 December was around 1.20, indicating that particles were basically composed of fine particles, and the particle size changed little. Combined with the variations in the wind field, the haze (affected by northwesterly wind after 23 December) began to weaken, and the daily average values of AOD and AE were 0.73 and 1.19, respectively, suggesting that fine aerosol particles were dominant.
Figure 5b shows the daily variation of CWV and fine-mode fraction (FMF). It is clear that, on 17 December, CWV was lower than 0.35 cm throughout the day. On 19 December, it was higher than 0.50 cm throughout the day, and the higher CWV was advantageous to the hygroscopic growth of aerosols. It is also clear that the peak value of CWV corresponded to the AOD peak value around high noon. Combined with Figure 6, there was a positive correlation (correlation coefficient of 0.91) between CWV and AOD, suggesting CWV played a vital role during the haze formation. However, the mechanism of how CWV affect the AOD still needs to be studied. According to the FMF on 19 December, it can be seen that it was lower than 50% in the first half of the day; and taking the influence of CWV into consideration, this suggests that there may have been a substantial part of PM2.5 that grew hygroscopically to become coarse particles with radii > 2.5 μm, or that activated to cloud and fog droplets. On 20 December, the CWV reduced slightly compared with 19 December, but still remained at a level above 0.50. CWV increased gradually around high noon and, at the same time, the corresponding AE presented a decreasing trend with particle size increasing gradually, mainly a reflection of the effect of the hygroscopic growth of aerosols. Compared with the FMF being greater than 50% on 19 December, the FMF on 20 December was greater than 90%, indicating that fine-mode particles were the dominant contributor to the atmospheric extinction. It also showed that despite PM2.5 hygroscopic growth, it was insufficient to create coarse particles with radii >2.5 μm, or to activate to cloud and fog droplets. Compared with 20 December, the CWV and hygroscopic growth of aerosols on 21 December had significantly decreased, with the CWV concentrated between 0.35 and 0.40. The FMF distribution on 21 December was similar to that on 20 December; the FMF was greater than 90%, indicating that the atmosphere was mainly composed of fine particles. On 22 December, CWV reduced to 0.35 cm with a smooth trend of change, hygroscopic growth of aerosols was not significant, and the AE concentrated at around 1.2. It can be seen from Figure 5b that the FMF on 22 December was larger than 98%, indicating that fine-mode particles were the dominant contributor to the atmospheric extinction that day. Eck [38] and Xia [39] pointed out that FMF can reach around 93% during most pollution events mainly dominated by fine-mode particles. On 23 December, due to the increase in wind speed, most of the fine particles were blown away, so the FMF reduced gradually.

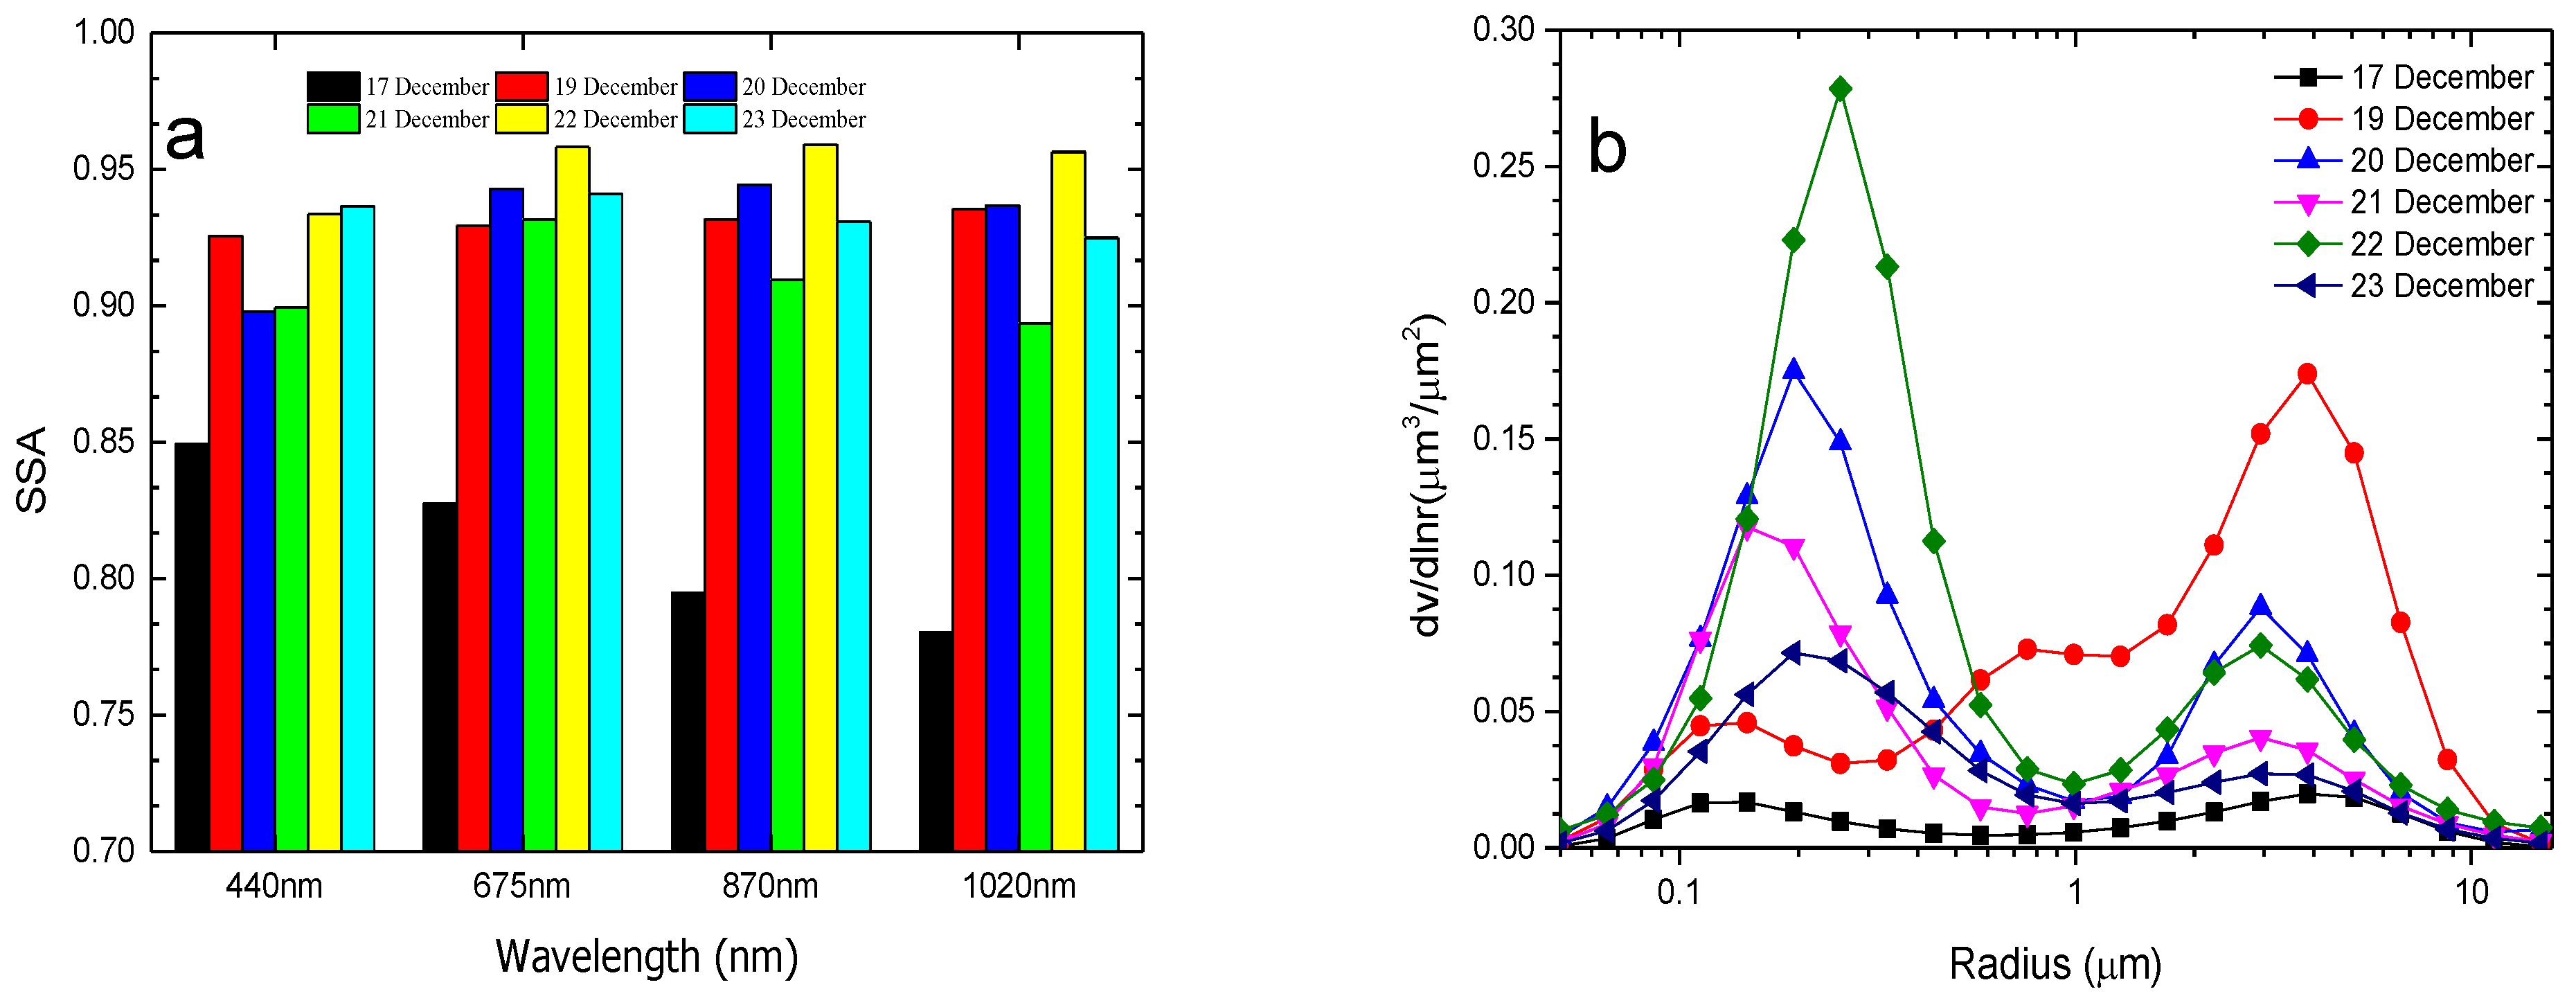
3.2.2. SSA and Size Distribution

SSA represents the proportion of aerosol particle scattering in total extinction; it is an important optical parameter for reflecting the scattering ability of aerosol particles, and one of the key variables in assessing the climate effects of aerosol. As shown in Figure 7a, the daily average SSA at 1020 nm exceeded 0.93 on 19–20 December, which suggests typical scattering characteristics, manifested in stronger scattering abilities of coarse particles. The daily average SSA at 440 nm was about 0.89 on 20–21 December, significantly lower than on 19 December, reflecting an increase in the light absorption of fine particles. Figure 7b shows the aerosol volume size distribution in Beijing on 17–22 December. In contrast to other polluted periods with a bimodal distribution, the size distribution was obviously trimodal on 19 December. There were three peaks at radii of approximately 0.1 μm, 0.5–0.8 μm and 4 μm. Moreover, the volume of coarse-mode particles was four times that of fine-mode particles. With the CWV greater than 0.50 cm throughout the day on 19 December, the 0.5–0.8 μm peak value mainly embodied the effect of the hygroscopic growth of fine-mode particles and the droplet dissipation residual. Zhang [40] pointed out that the mean measured non-refractory submicron particle mass concentration in Beijing was made up of organics (49.8%), sulfate (21.4%), nitrate (14.6%), ammonium (10.4%), and chloride (3.8%). The trimodal distribution on 19 December may have been mainly due to these hygroscopic compositions in the atmosphere. Another possible reason for a bimodal distribution of submicron size could be associated with the processes of fog-haze and cloud [41,42,43]. On the other days, the particle distribution was typically bimodal, with the peak value being around 0.2 and 3.0 μm for the fine- and coarse-mode particles, respectively. The volume of fine-mode particles was two times that of coarse-mode particles, showing aerosol particle distribution characteristics typical of urban pollution. When the haze enhanced on 22 December, the volume of fine-mode particles was 1.4 and 2.1 times that on 20 December and 21 December, respectively. The huge increase in fine particles led to a considerable enhancement in optical depth.
Table 1 lists the daily mean parameters of aerosol volume size distribution. As can be seen, for fine-mode particles during the haze, Rv, Reff, and Cf/Cc reached minimum and maximum values on 19 December and 22 December, respectively, which reflects the hygroscopic growth characteristics of fine particles on 19 December. The atmosphere was mainly composed of fine particles on 22 December, and mainly related to a large number of accumulated fine particles on 22 December. As for the coarse mode, Cv reached a maximum, with a value of 0.295, on 19 December, showing that the atmosphere was mainly composed of coarse particles that day.

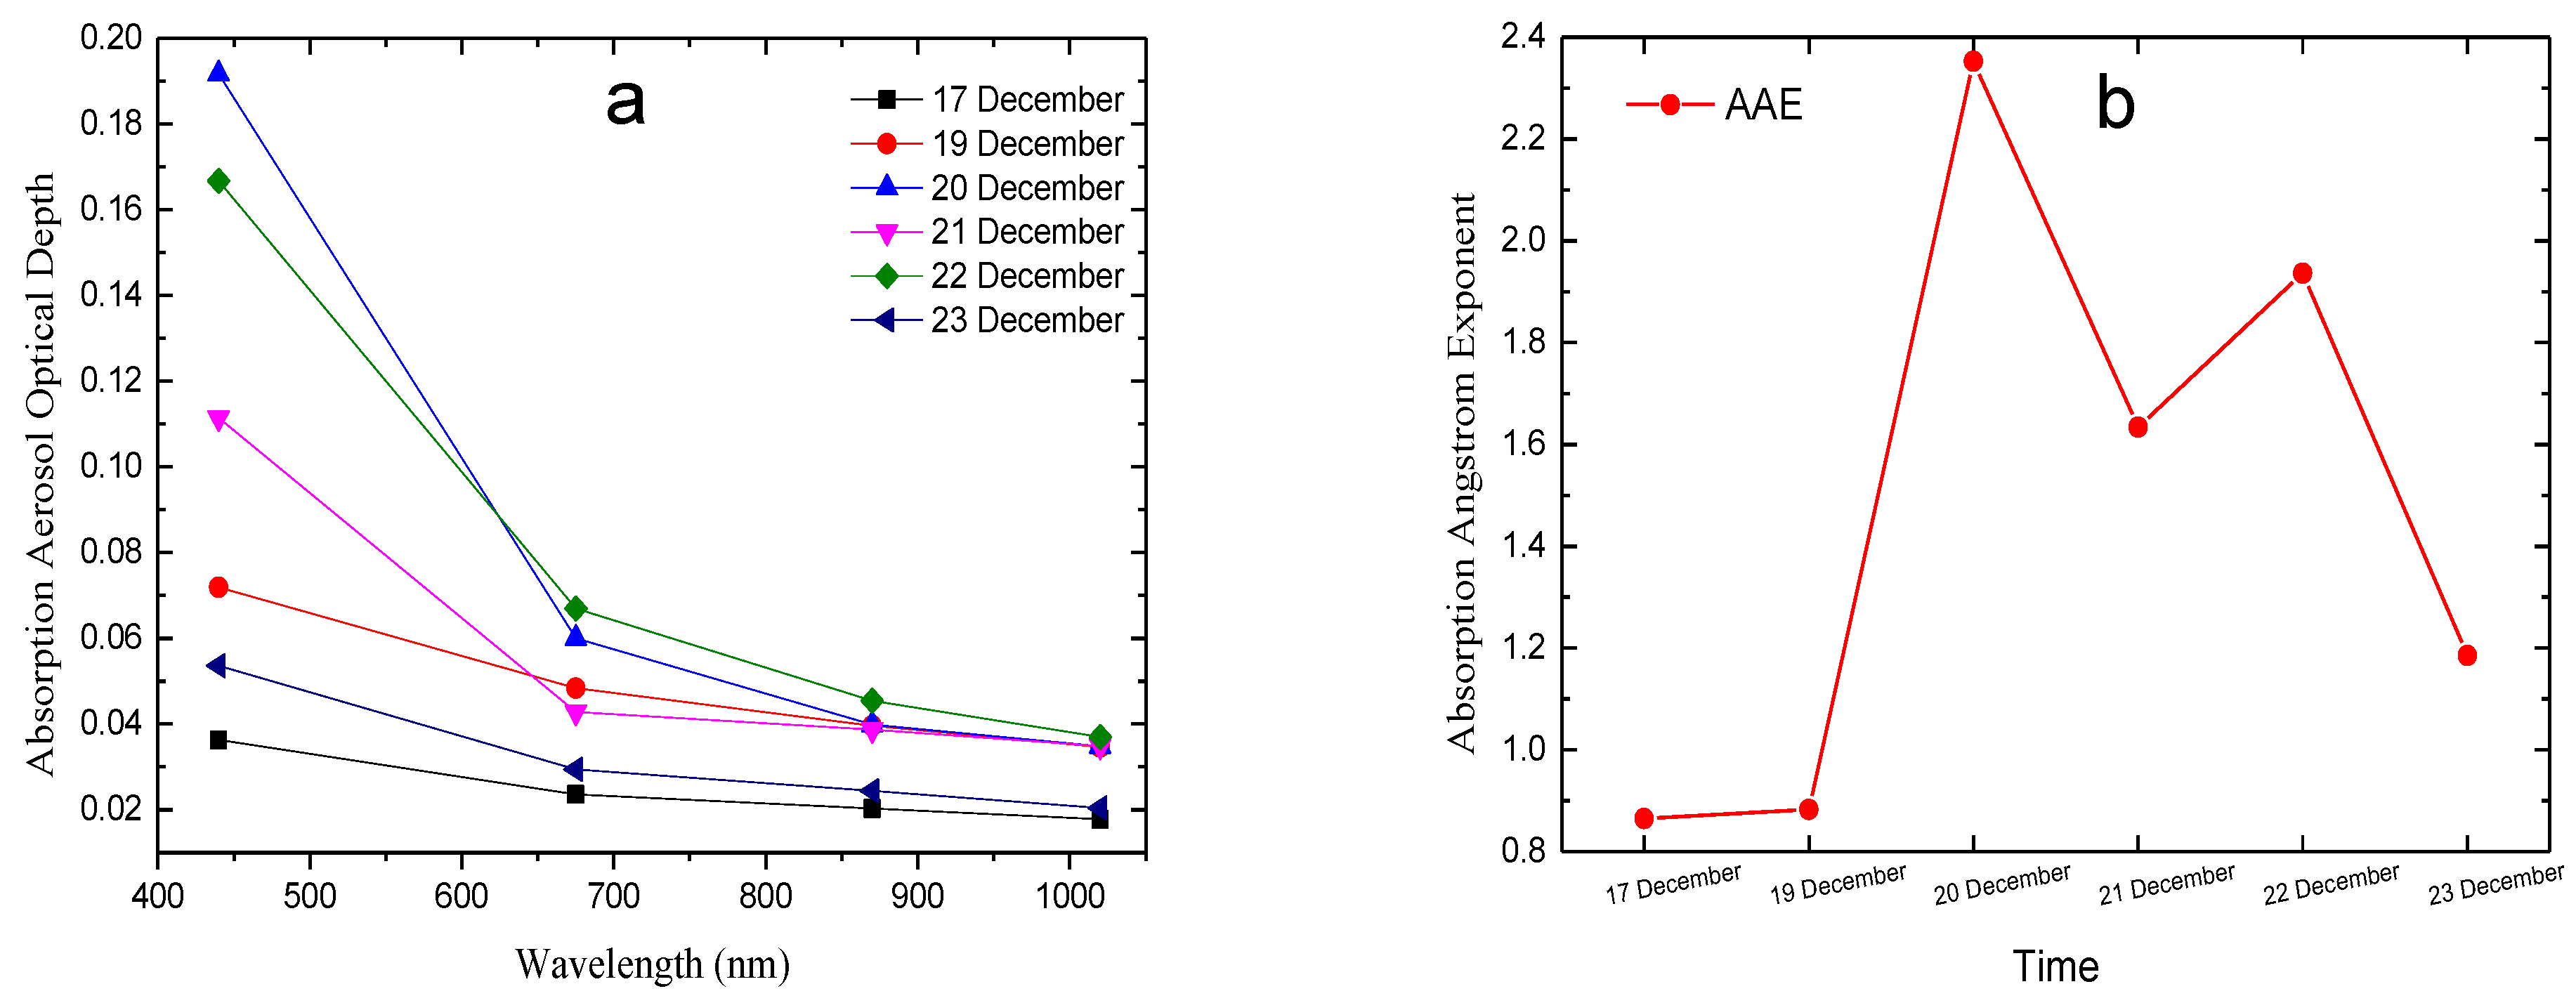
3.2.3. Aerosol Absorption Optical Depth and Ångström Absorption Exponent

Absorption aerosol optical depth (AAOD) reflects the proportion of aerosol particles absorption in total extinction, and is calculated by the equation AAOD (λ) = AOD × (1 − SSA (λ)). As shown in Figure 8a, AAOD decreased with increasing wavelength, which was similar to the trend between AOD and wavelength. Compared with the AAOD on both 17 December and 23 December, it was obviously higher during the haze in the most serious stage (19–22 December), suggesting that a greater quantity of absorptive aerosols existed in the atmosphere during the haze, and those absorptive aerosols may have been produced by the composition of black carbon and brown carbon emitted by coal fires and vehicle exhaust [40,44]. Compared with the other periods, AAODs were at a maximum (except for the wavelength of 440 nm) on 22 December, indicating a large quantity of absorptive aerosols accumulated that day. The Ångström absorption exponent (AAE) can be used to differentiate the types of aerosol particles (such as black carbon aerosol, organic aerosol, dust aerosol etc.) [45], and is defined as the negative of the slope of a log-log plot of the AAOD versus wavelength, calculated by the equation AAE = −dln (AAOD (λ))/dln (λ). Bergstrom [46] and Bohren [47] pointed out that AAE values are close to 1 for black carbon. The higher AAEs between 1.0 and 2.0 can indicate a significant increase in organic aerosol; and when it increases to approximately 2.5, an increase in dust aerosol is likely. Furthermore, black carbon, which is coated with absorptive or non-absorptive materials, may also play a role in causing an AAE value far lower than 1 [48,49]. As shown in Figure 8b, the aerosol particles were mainly composed of mixed aerosols (the following section reports on the use of the CALIPSO satellite to further discuss the vertical aerosol optical properties during the haze period) during the total haze period. On 17 and 19 December, the AAEs were lower than 1, which may have been related to the black carbon aerosol being coated with absorptive or non-absorptive materials. The higher AAEs between 1.0 and 2.0 from 21 to 23 December may indicate there was a significant increase in organic aerosol. On 20 December, the AAE was approximately 2.5, indicating there was a higher concentration of fugitive dust from local emissions.

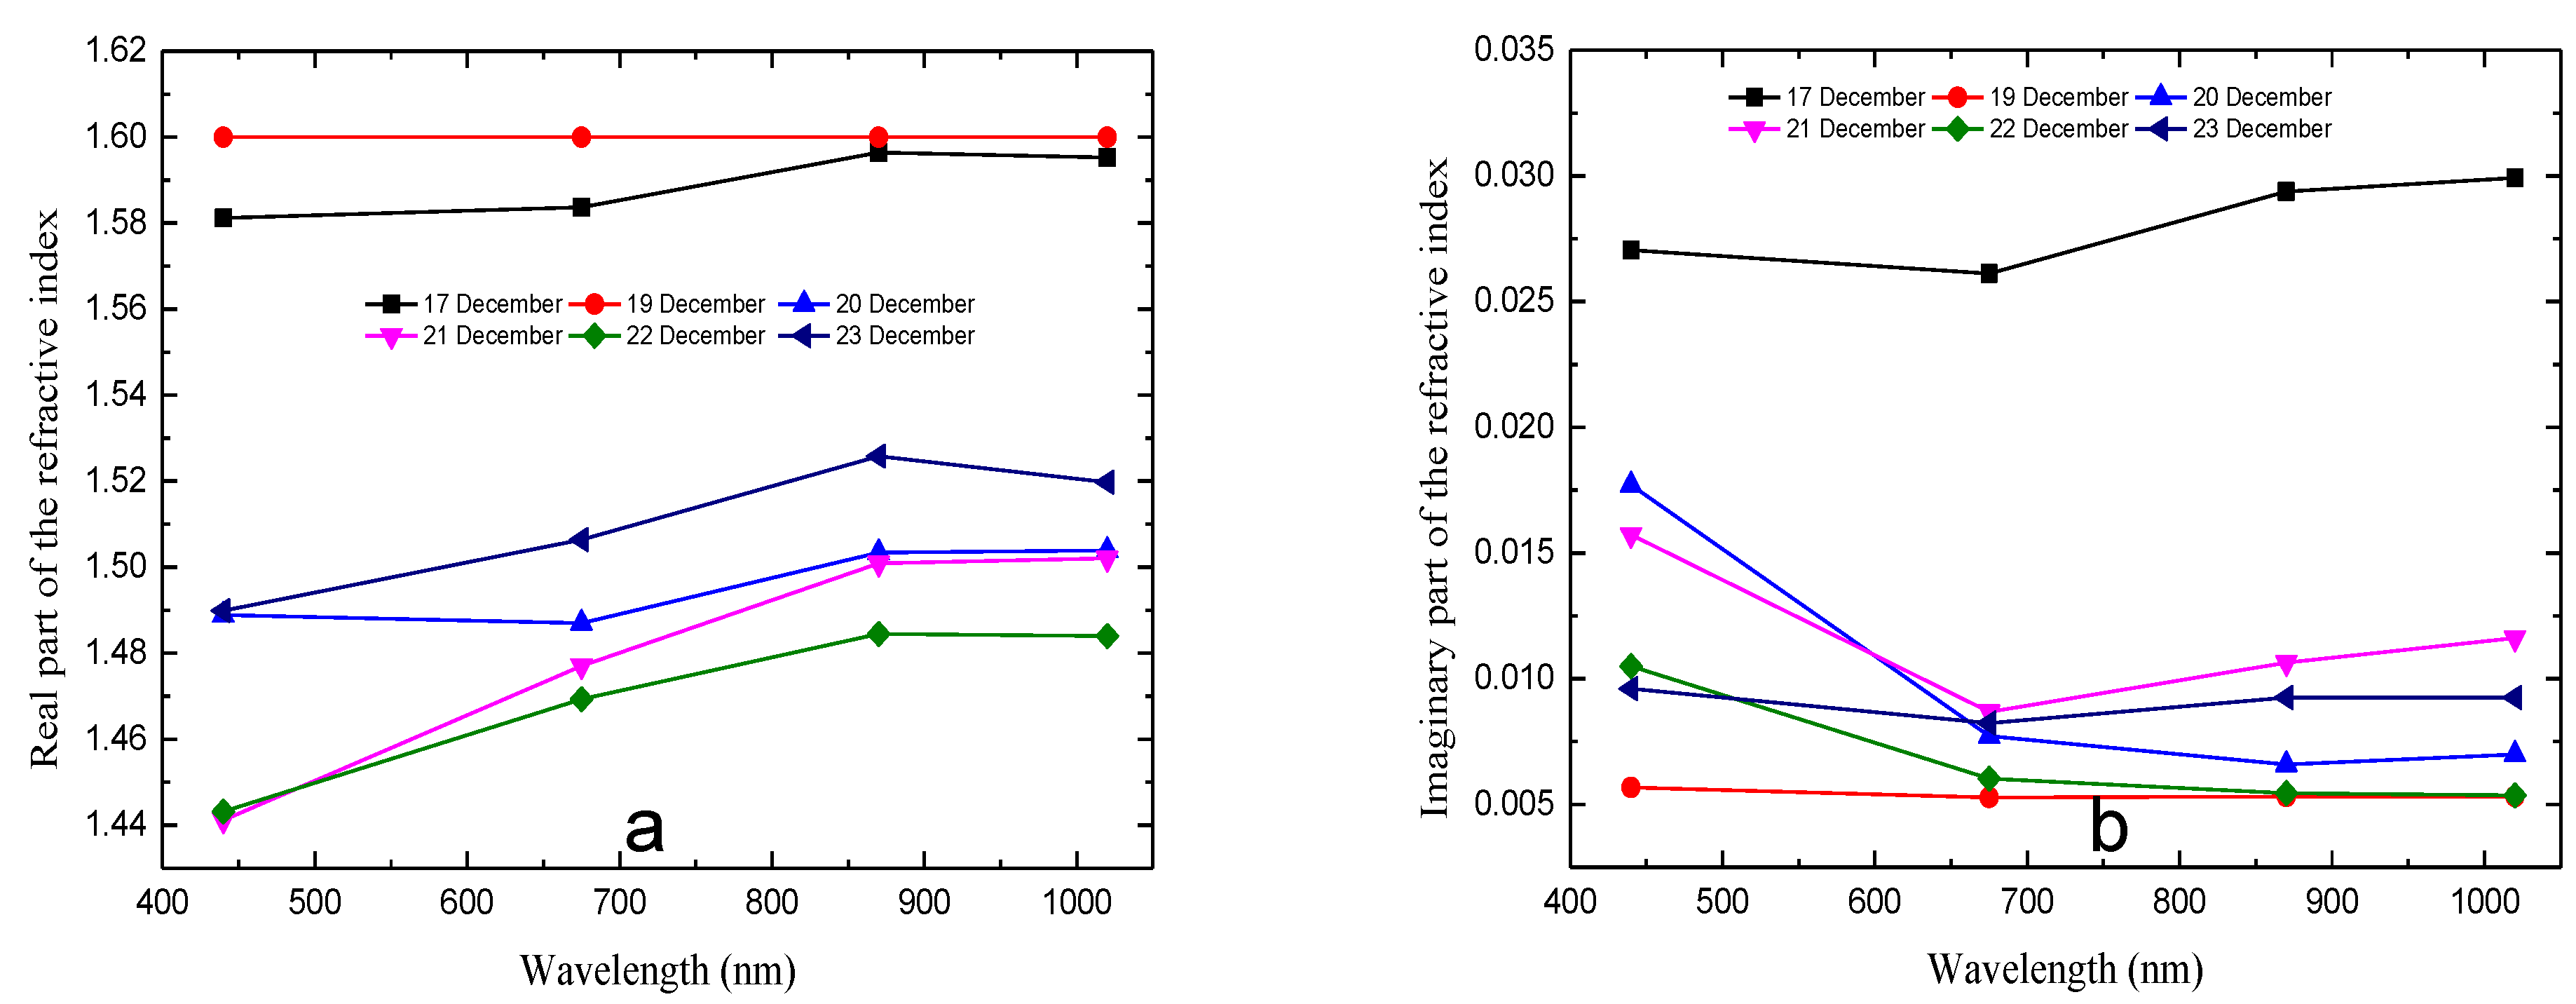
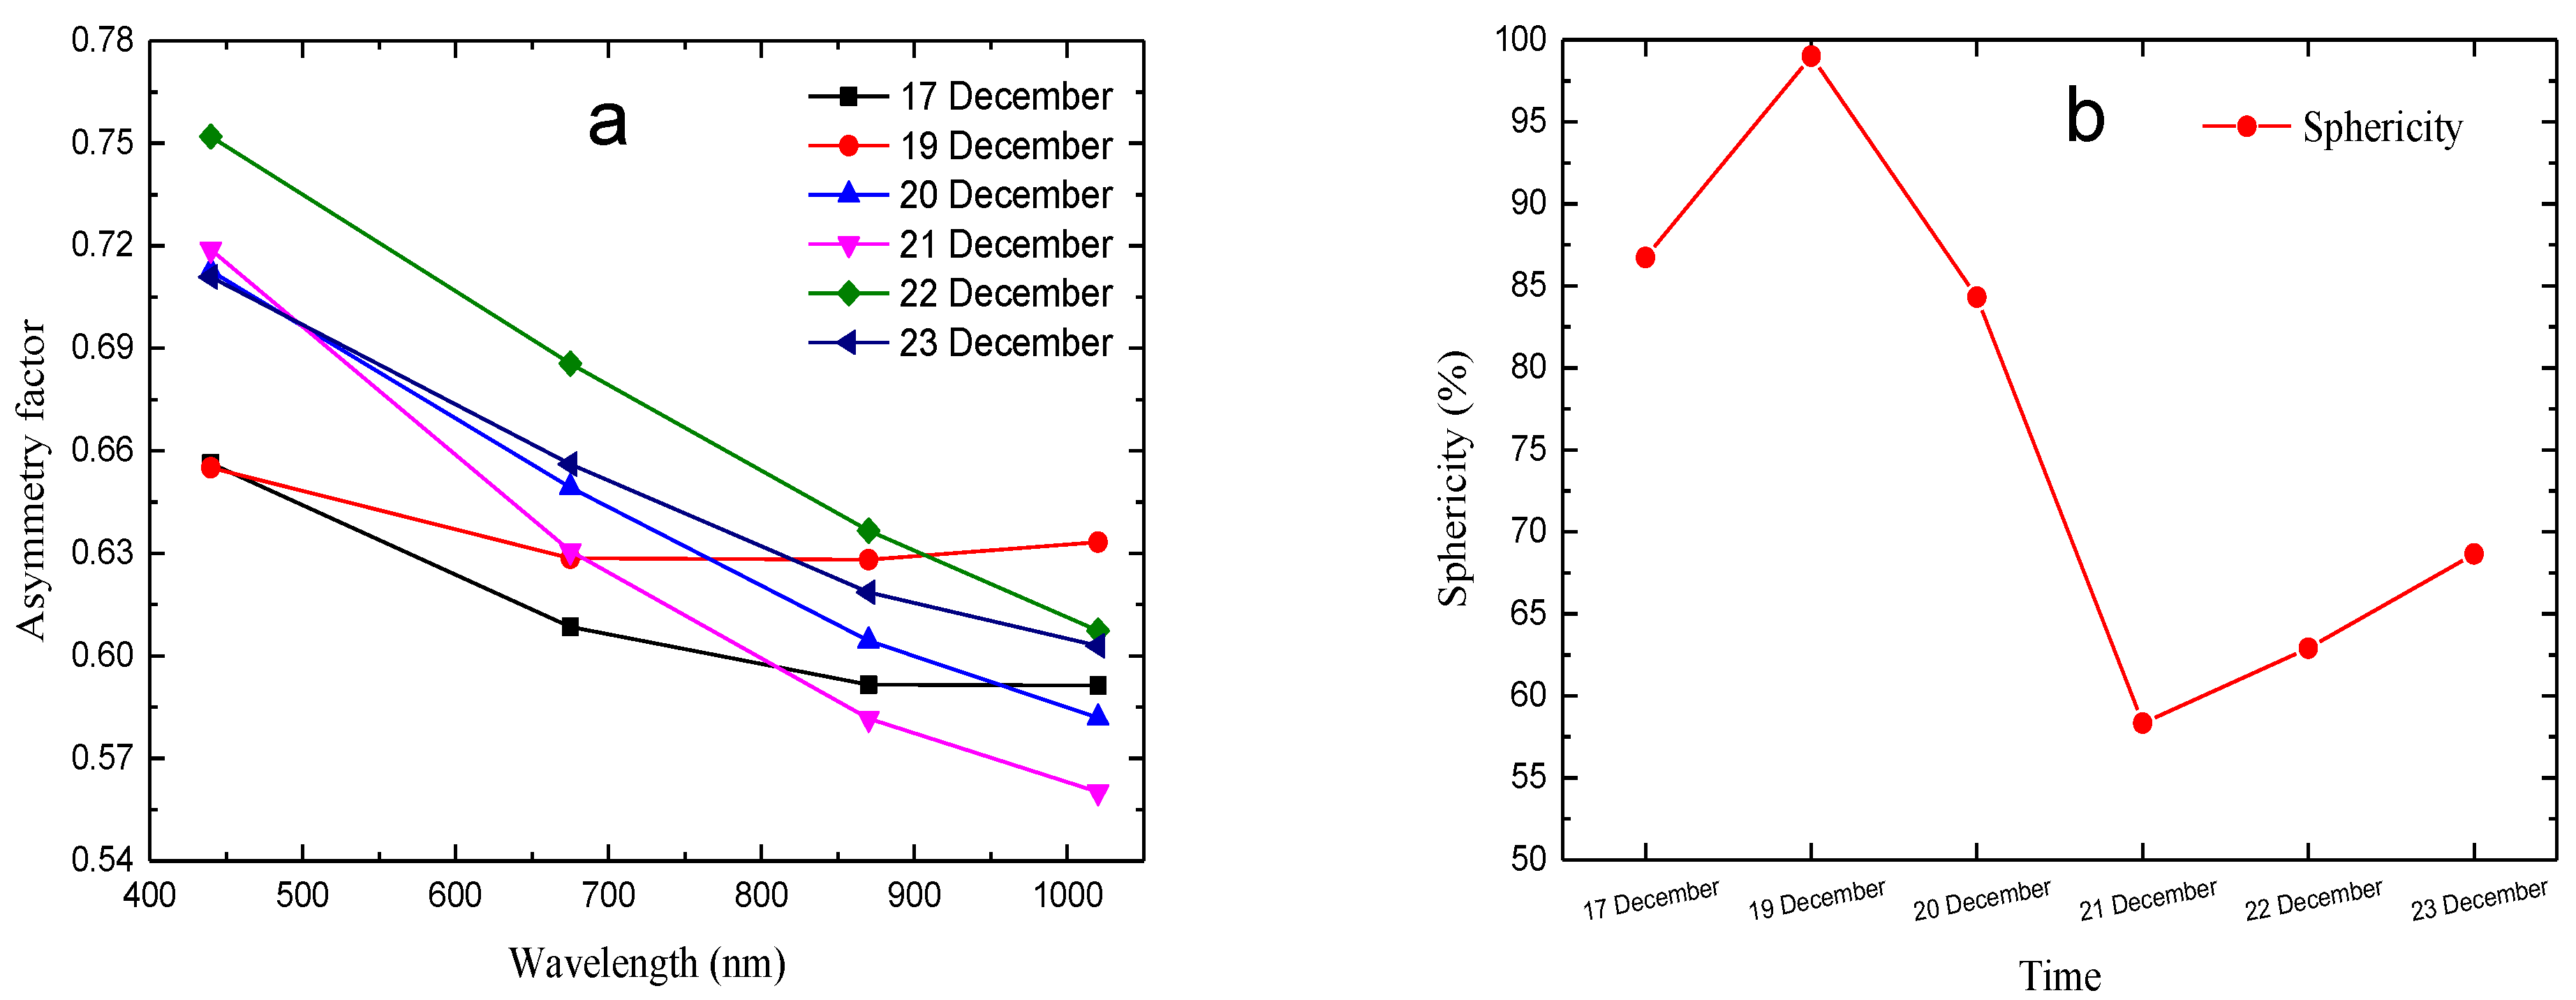
3.2.4. Refraction Index, Asymmetry Factor and Sphericity

The refractive index is a basic parameter that reflects the scattering and absorption ability of aerosol particles. Its values closely relate to the scale parameters, mineral composition and shape of particles. Figure 9 shows the daily variation of refractive index over Beijing at 440, 675, 870 and 1020 nm, during 17–23 December 2015. The real part of the refractive index represents scattering, as a higher real part indicates higher scattering; and the imaginary part represents absorption. As shown in Figure 9a, the real part of the refractive index ranging from wavelengths of 440 to 870 nm presented a rising trend, compared with a decreasing trend from 870 to 1020 nm. The real part of the refractive index on 19 December was significantly higher than on other days, indicating the existence of a large quantity of scattering aerosols that day. As shown in Figure 9b, the imaginary part of the refractive index ranging from wavelengths of 440 to 670 nm decreased rapidly, while from 670 to 1020 nm, there were no significant changes.
The asymmetry parameter (ASY) represents an estimation of the asymmetry distribution of the dispersed radiation. As shown in Figure 10a, ASY decreased with increasing wavelength. Compared with other wavelengths, aerosol particles possessed stronger backward and forward scattering abilities at the wavelengths of 1020 nm and 440 nm, respectively. As shown in Figure 10b, the sphericity fraction was greater than 80% during 17–20 December, indicating the aerosol particles approached to sphericity particles. The sphericity fraction was lower than 70% during 21–23 December, indicating the sphericity fraction reduced and approached to non-sphericity particles. The sphericity fraction was close to 100% on 19 December, which may have been related to the hygroscopic growth of fine particles form water droplets and cloud droplets, or the droplet dissipation residual.

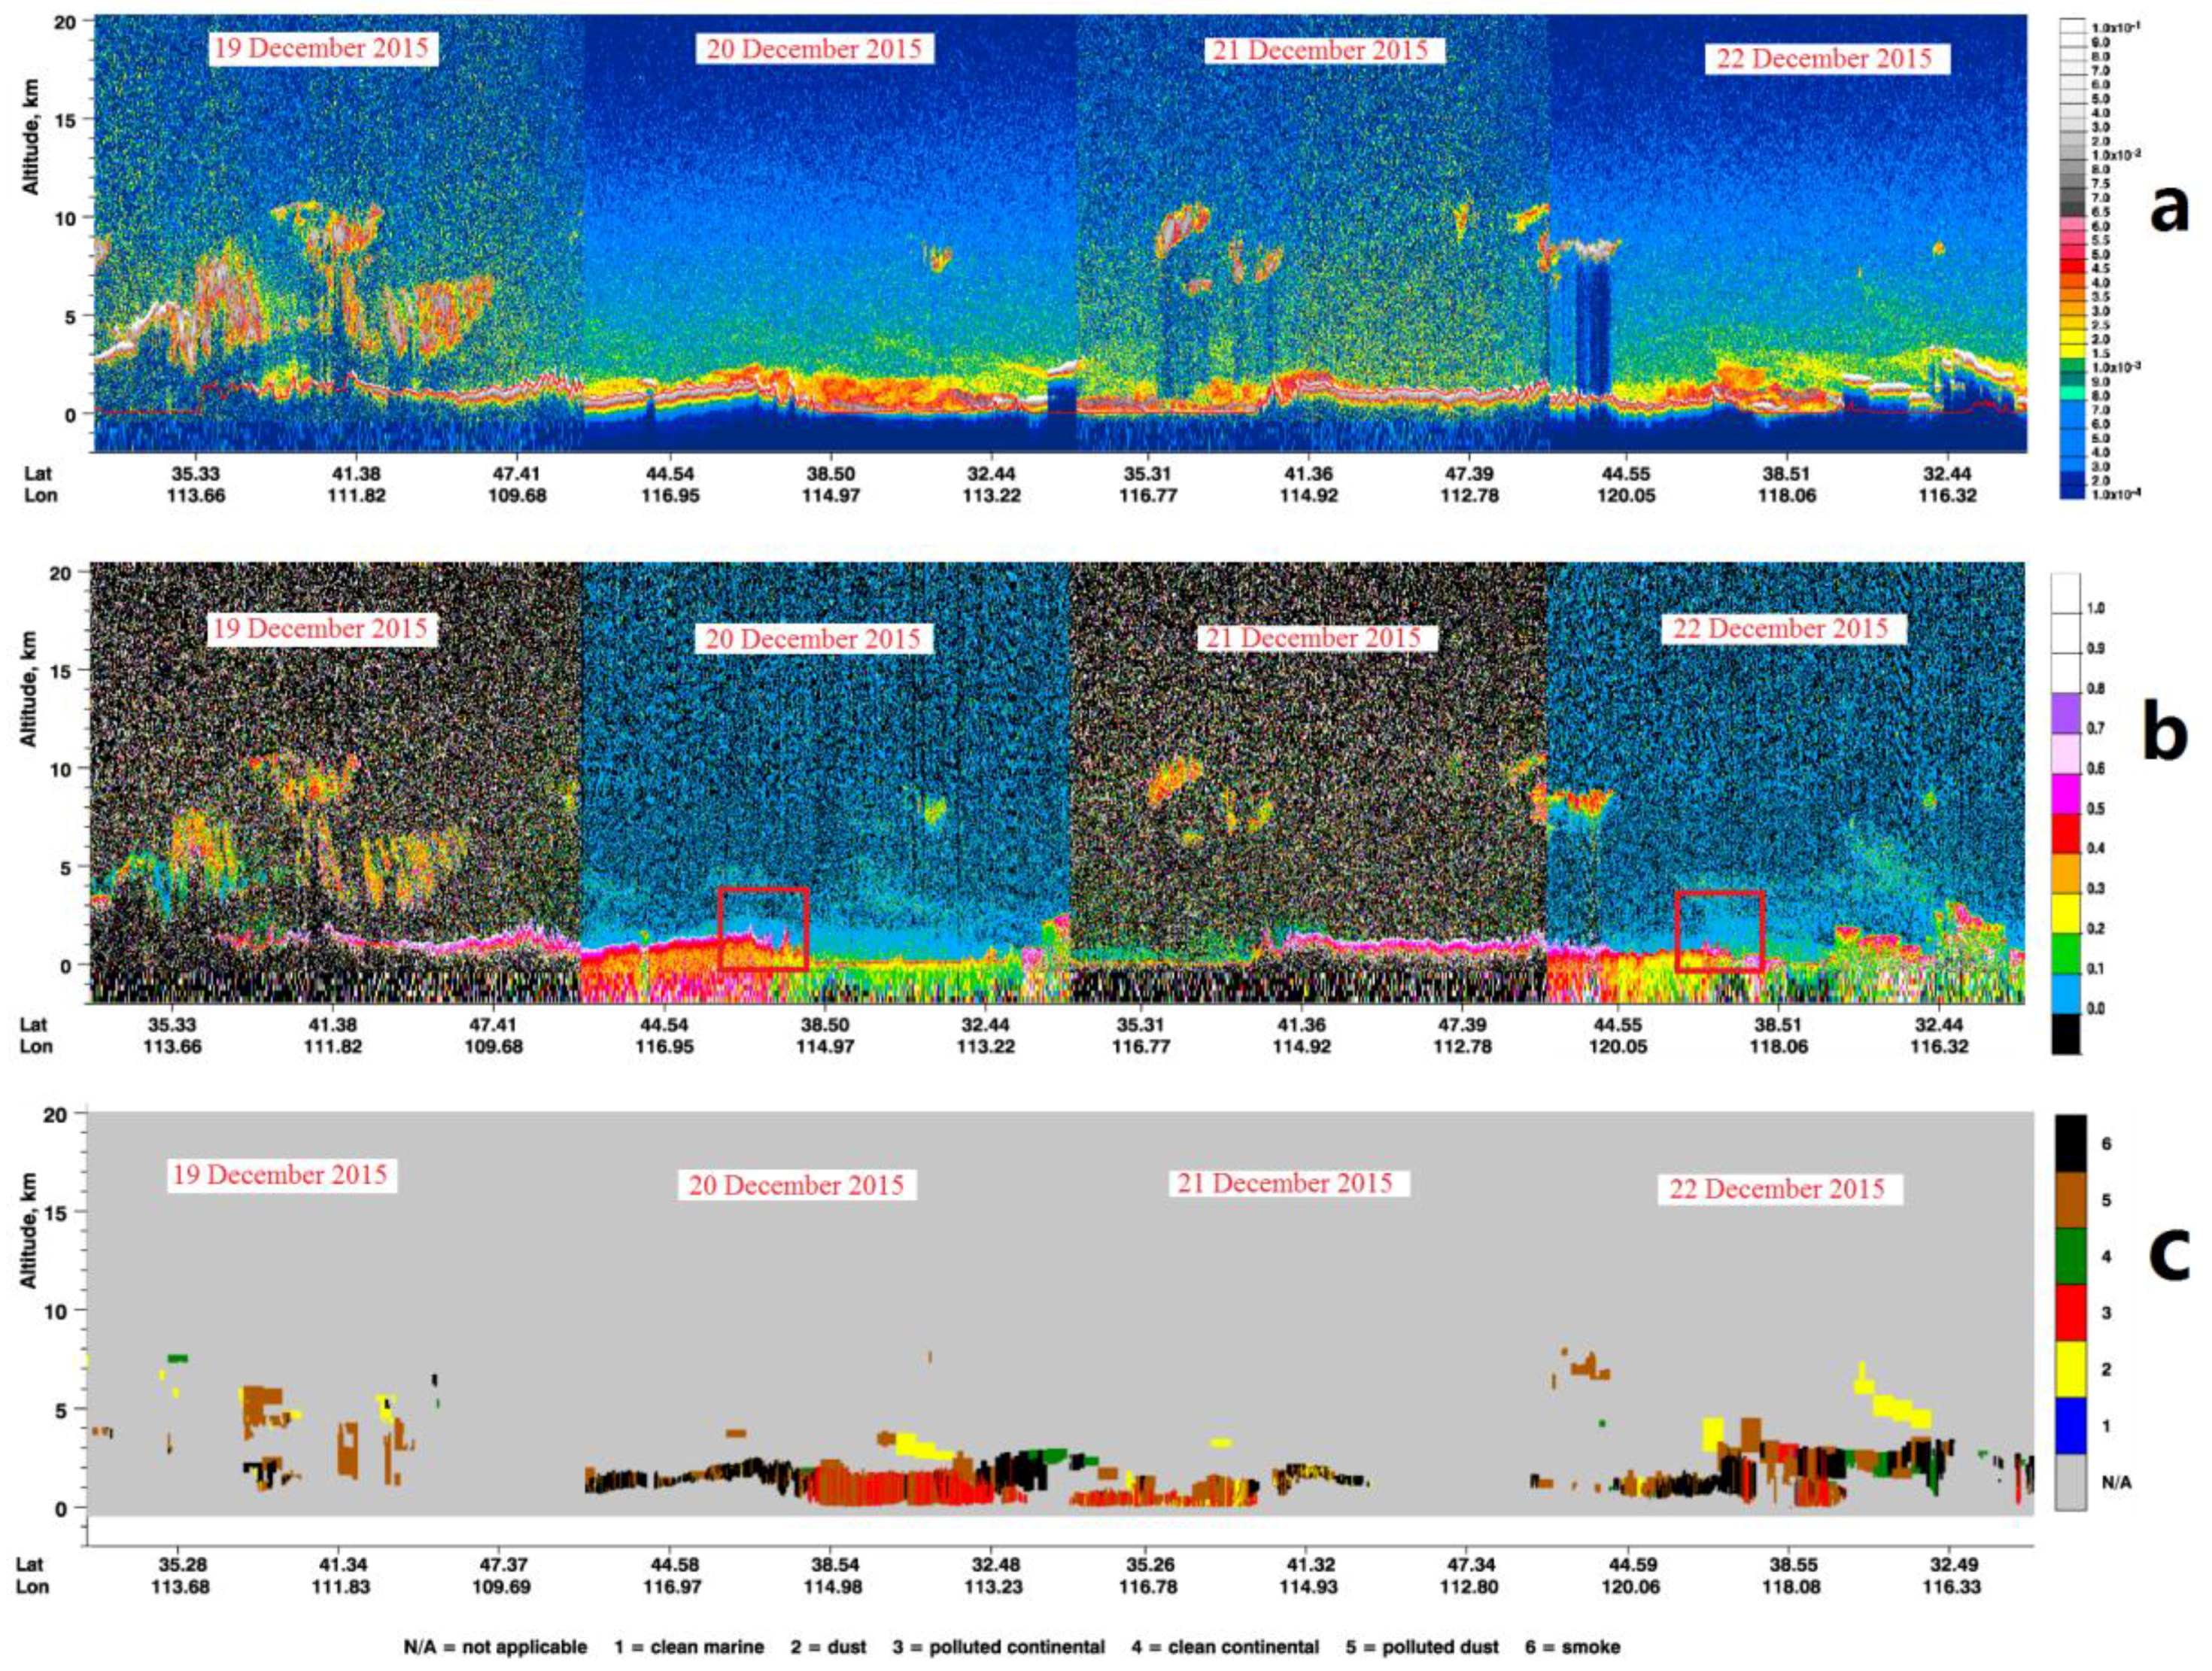
3.3. Satellite View of the Haze over Beijing

Figure 11 displays the MODIS true color images from 19 to 22 December. As can be seen, the satellite observations showed an obvious pollution episode happened in Beijing and its surrounding areas; the color of the pollution area gradually deepened and peaked on 22 December, identical to the PM daily variation trend. The CALIPSO satellite can provide vertical structure and optical property information regarding aerosol during haze periods [33,34]. However, the daytime data can be influenced by the noise of strong solar radiation, so the daytime data in this case were only used for reference. The shortest distance between Beijing (39.93°N, 116.43°E) and the sub-satellite track is about 43 km. As shown in Figure 12a, there was an obvious aerosol layer in the Beijing area during the haze period, concentrated at ground level to within 2 km in the upper layers. The volume depolarization ratio is the ratio of 532 nm vertical backward scattering intensity to 532 nm parallel backward scattering intensity. In cases of significant aerosol concentration δv can be used instead of the particle volume linear depolarization ratio: if δv is larger than approximately 0.2, it can be assumed that the particles are predominantly non-spherical. Though it is not possible to distinguish between individual shapes, it provides very useful information for the aerosol typing algorithm [34,50]. As shown in Figure 12b, it is clear that both spherical and non-spherical particles existed at each height and at the same time within 2 km over Beijing and its peripheral areas (highlighted by the red frame). With increasing height, spherical particles became more dominant. We use the aerosol types provided by CALIPSO as a consistency check of our findings. The classification results of aerosol types are shown in Figure 12c, revealing that the aerosol types over and close to Beijing were mainly composed of mixed pollution aerosols (consistent with the AAE results), indicating pollution was transported from northern China or emitted from local human activity, fugitive dust, or industrial combustion. At the same time, fugitive dust mixed with local pollutants under stagnant conditions, reducing visibility even further.

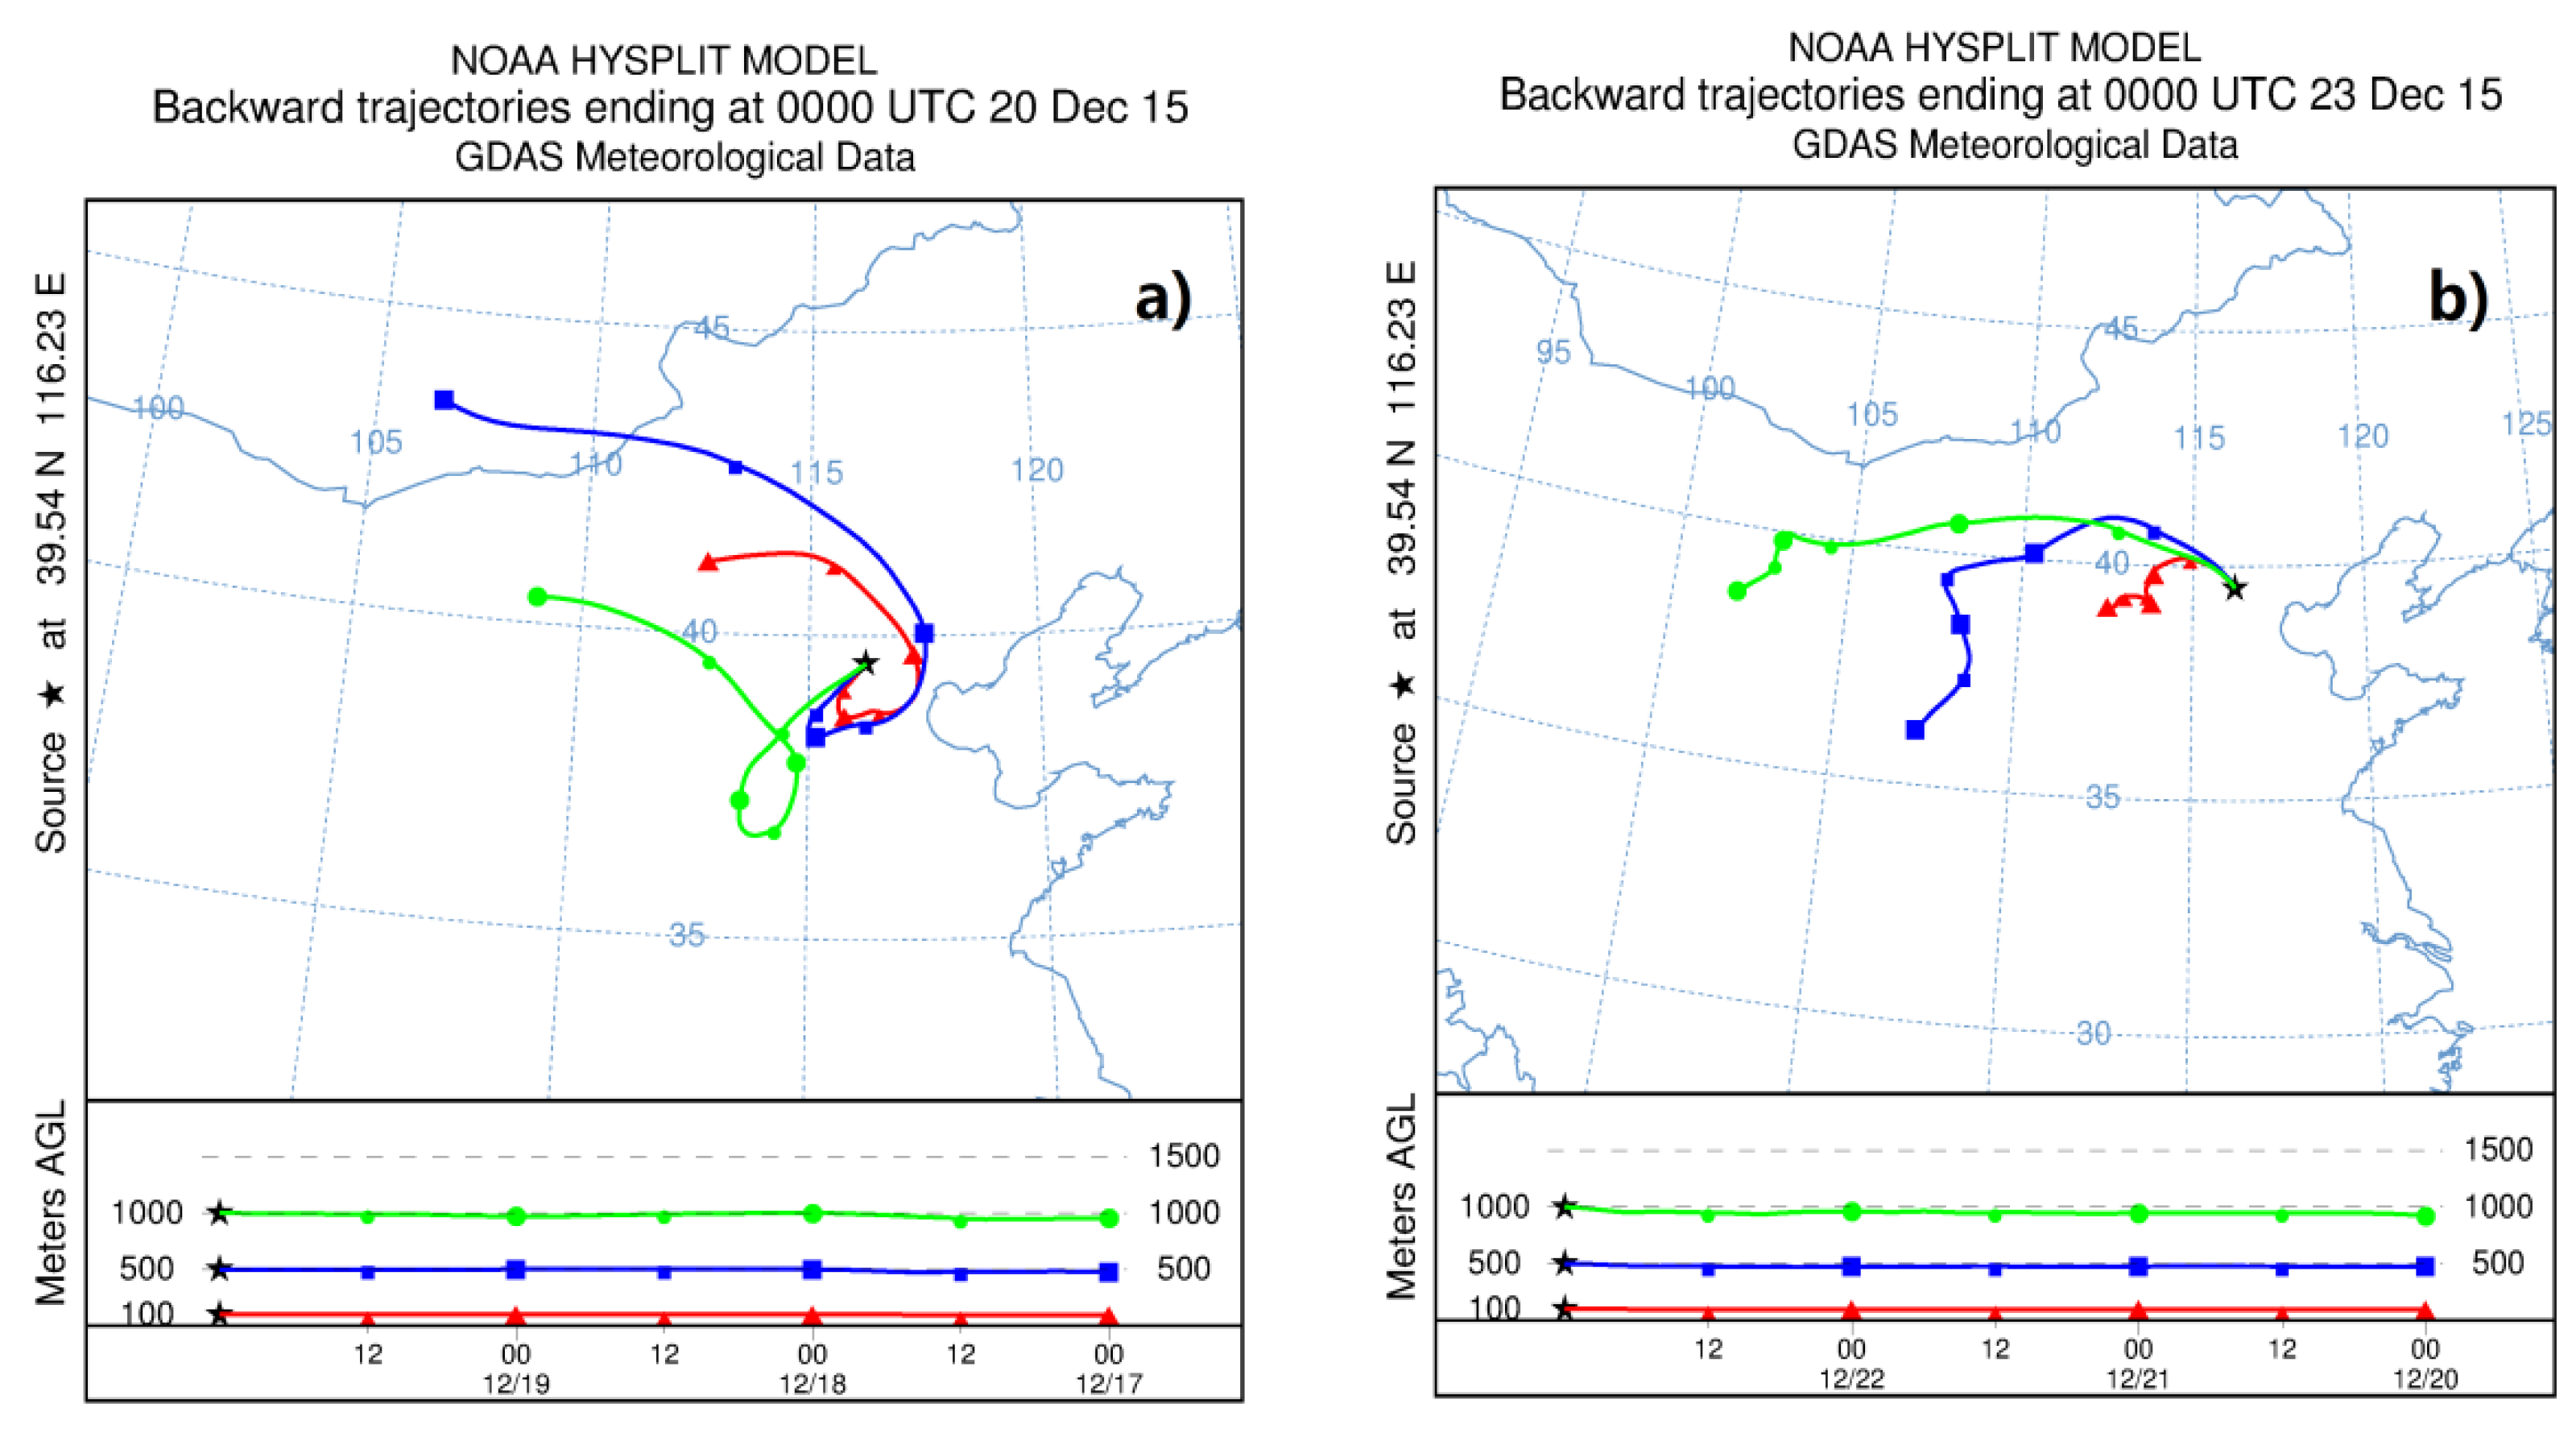
3.4. Backward Trajectory Analysis

Figure 13 shows the results of the 72-h backward trajectory from NOAA’s HYSPLIT model for three heights (100 m, 500 m, and 1000 m) in Beijing at 0800 LT 20 December and 0800 LT 23 December. It can be seen that for the haze of the early stage (17–19 December), at the 1000 m height, the air mass originated from the southern part of Mongolia, travelling through Inner Mongolia and Hebei Province. Air masses at the 100 m height, meanwhile, were from Inner Mongolia and passed through the Tianjin and Hebei regions, along with the air masses at the 1000 m height. Air masses at the 500 m height derived from the southwest part of Inner Mongolia and passed through Hebei Province and Shanxi Province. After 19 December, the northwesterly airflow turned southwesterly, meaning pollutants in Hebei Province and Shanxi Province could be transported to the Beijing area, resulting in the formation of the haze event. As shown in Figure 13b, for the haze in the most serious stage (20–22 December), air masses at the 1000 m height passed through the Gansu, Inner Mongolia, and Hebei regions. Air masses at the 500 m height derived from Shanxi Province, travelling through Inner Mongolia and Hebei Province. Air masses at the 100 m height were from the northwest part of Shanxi Province and moved through Hebei Province. Finally, the three air masses arrived together in the Beijing area on 23 December. Along this route are highly polluted areas, meaning it is easy for southwesterly flow to transport pollutants originating from these regions to the Beijing area. Owing to the continuous existence of stable atmospheric conditions and an inversion layer, and combined with the decrease in wind speed, pollutants accumulated in the Beijing area. This, on top of pollutants from local emissions, made the concentration of pollutants even heavier and the visibility decreased. The level of haze reached a maximum on 22 December, after which the southwesterly airflow turned northwesterly and the haze dissipated.

4. Conclusions

This study analyzed the formation process of haze pollution and aerosol optical properties during a haze event in the Beijing area, based on ground-based and satellite observation. The main conclusions can be summarized as follows:
The high RH, poor diffusion conditions (low wind speed and stable stratification) and favorable secondary transformation conditions under the conditions of the hygroscopic growth of aerosol and high emissions led to this serious haze event. Aerosol optical properties based on ground-based measurements showed that, during the haze period, the AOD500nm and CWV varied by 0.20–2.34 and 0.30–0.55, respectively, with average values of 1.15 and 0.42, respectively. The AE varied by 0.73–1.42, with an average value of 1.19, suggesting that fine aerosol particles were dominant. The FMF varied by 0.48–0.98, with an average value of 0.81, indicating fine-mode particles were the dominant contributor to atmospheric extinction. Importantly, compared with other polluted periods, the AE, CWV and FMF reached a maximum, minimum and minimum on 19 December, respectively, indicating the effect of the hygroscopic growth of fine-mode articles. The correlation coefficient between CWV and AOD500nm was 0.91, suggesting that CWV played a vital role during the haze formation. The 7-day average SSA was greater than 0.90 at 1020, 870, 675 and 440 nm, suggesting the accumulation of fine-mode particles, and thereby an increase in the light scattering coefficient, during the haze period. Compared with other polluted periods with a bimodal distribution, there was an obvious trimodal distribution on 19 December. There were three peaks at radii of approximately 0.1 μm, 0.5–0.8 μm and 4 μm. Moreover, the volume of coarse-mode particles was four times that of fine-mode particles. The 0.5–0.8 μm peak value mainly embodied the effect of the hygroscopic growth of fine-mode particles and the droplet dissipation residual. The AAOD440nm and AAE varied by 0.05–0.16 and 0.86–2.35, respectively, with daily average values of 1.15 and 0.42, respectively, suggesting there were more absorptive aerosol particles during the haze period.
Satellite observations showed that there was an obvious aerosol layer in the Beijing area during the haze period, concentrated at ground level to within 2 km in the upper layers. The types of aerosols were mainly composed of mixed pollution aerosols, indicating that the pollution derived from northern China, as well as being emitted from local human activity, fugitive dust, and industrial combustion. To improve the link between ground-based in-situ measurements and columnar measurements achievable from sun photometers (e.g., AERONET) the consideration of ground based active remote sensing is expected to provide significant progress. From ceilometers [51], the stratification of aerosols can readily be retrieved on a routine basis whereas advanced LiDARs must be implemented to get a thorough characterization of particles (e.g., Ansmann et al. [52]). The application of either of these techniques can help to estimate how representative point measurements at the ground are for the atmospheric column. There are plans to take advantage of this approach in future studies.

Acknowledgments

This work is financially supported by grants from the Project (41375153) supported by NSFC, the National Key Project of Basic Research (2014CB441201), the CAMS Basis Research Project (2014R17), the Climate Change Special Fund of CMA (CCSF201504),and the Sichuan Youth Fund (2014JQ0019).

Author Contributions

Ke Gui wrote the article; Huizheng Che and Quanliang Chen conceived and designed the experiments; Ke Gui, Linchang An, and Zhaoliang Zeng, performed the experiments; Ke Gui, Zengyuan Guo, and Yu Zheng analyzed the data; Hong Wang, Yaqiang Wang, Jie Yu and Xiaoye Zhang helped perform the statistical analysis.

Conflicts of Interest

The authors declare no conflict of interest.

References

  1. Ackerman, P.; Toon, O.B. Absorption of visible radiation in atmosphere containing mixtures of absorbing and non-absorbing particles. Appl. Opt. 1981, 20, 3661–3668. [Google Scholar] [CrossRef] [PubMed]
  2. Charlson, R.J.; Schwartz, S.E.; Hales, J.M.; Cess, R.D.; Coakley, J.A.; Hansen, J.E.; Hofmann, D.J. Climate forcing by anthropogenic aerosols. Science 1992, 255, 423–430. [Google Scholar] [CrossRef] [PubMed]
  3. Watson, J.G. Visibility: Science and Regulation. J. Air Waste Manag. Assoc. 2002, 52, 628–713. [Google Scholar] [CrossRef] [PubMed]
  4. Schäfer, K.; Thomas, W.; Peters, A.; Ries, L.; Obleitner, F.; Schnelle-Kreis, J.; Birmili, W.; Diemer, J.; Fricke, W.; Junkermann, W.; et al. Influences of the 2010 Eyjafjallajökull volcanic plume on air quality in the northern Alpine region. Atmos. Chem. Phys. 2011, 11, 8555–8575. [Google Scholar] [CrossRef]
  5. Tie, X.X.; Wu, D.; Brasseur, G. Lung cancer mortality and exposure to atmospheric aerosol particles in Guangzhou, China. Atmos. Environ. 2009, 43, 2375–2377. [Google Scholar] [CrossRef]
  6. Hansen, J.; Sato, M.; Ruedy, R.; Lacis, A.; Oinas, V. Global warming in the twenty-first century: An alternative scenario. Proc. Natl. Acad. Sci. USA 2000, 97, 9875–9880. [Google Scholar] [CrossRef] [PubMed]
  7. Ramanathan, V.; Crutzen, P.J.; Lelieveld, J.; Mitra, A.P.; Althausen, D.; Anderson, J.; Andreae, M.O.; Cantrell, W.; Cass, G.R.; Chung, C.E.; et al. The Indian Ocean experiment: An integrated analysis of the climate forcing and effects of the great Indo-Asian haze. J. Geophys. Res. 2001, 106, 28371–28398. [Google Scholar] [CrossRef]
  8. Chan, C.K.; Yao, X. Air pollution in megacities in China. Atmos. Environ. 2008, 42, 1–42. [Google Scholar] [CrossRef]
  9. Sun, Y.L.; Wang, Z.F.; Fu, P.Q.; Yang, T.; Jiang, Q.; Dong, H.B.; Li, J.; Jia, J.J. Aerosol composition, sources and processes during wintertime in Beijing, China. Atmos. Chem. Phys. 2013, 13, 4577–4592. [Google Scholar] [CrossRef]
  10. Liu, X.; Li, J.; Qu, Y.; Han, T.; Hou, L.; Gu, J.; Chen, C.; Yang, Y.; Liu, X.; Yang, T.; et al. Formation and evolution mechanism of regional haze: A case study in the megacity Beijing, China. Atmos. Chem. Phys. 2013, 13, 4501–4514. [Google Scholar] [CrossRef]
  11. Wang, Y.; Zhuang, G.; Sun, Y.; An, Z. The variation of characteristics and formation mechanisms of aerosols in dust, haze, and clear days in Beijing. Atmos. Environ. 2006, 40, 6579–6591. [Google Scholar] [CrossRef]
  12. Tao, M.H.; Chen, L.F.; Wang, Z.F.; Ma, P.F.; Tao, J.H.; Jia, S.L. A study of urban pollution and haze clouds over northern China during the dusty season based on satellite and surface observations. Atmos. Environ. 2014, 82, 183–192. [Google Scholar] [CrossRef]
  13. Quan, J.; Tie, X.; Zhang, Q.; Liu, Q.; Li, X.; Gao, Y.; Zhao, D. Characteristics of heavy aerosol pollution during the 2012–2013 winter in Beijing, China. Atmos. Environ. 2014, 88, 83–89. [Google Scholar] [CrossRef]
  14. Quan, J.N.; Zhang, Q.; Liu, J.Z.; Huang, M.Y.; Jin, H. Analysis of the formation of fog and haze in North China Plain (NCP). Atmos. Chem. Phys. 2011, 11, 8205–8214. [Google Scholar] [CrossRef]
  15. Che, H.; Xia, X.; Zhu, J.; Li, Z.; Dubovik, O.; Holben, B.; Goloub, P.; Chen, H.; Estelles, V.; Cuevas-Agulló, E.; et al. Column aerosol optical properties and aerosol radiative forcing during a serious haze-fog month over North China Plain in 2013 based on ground-based sunphotometer measurements. Atmos. Chem. Phys. 2014, 14, 2125–2138. [Google Scholar] [CrossRef]
  16. Che, H.Z.; Xia, X.A.; Zhu, J.; Wang, H.; Wang, Y.Q.; Sun, J.Y.; Zhang, X.Y.; Shi, G.Y. Aerosol optical properties under the condition of heavy haze over an urban site of Beijing, China. Environ. Sci. Pollut. Res. 2014, 22, 1043–1053. [Google Scholar] [CrossRef] [PubMed]
  17. Yu, X.N.; Zhu, B.; Yin, Y.; Yang, J.; Li, Y.W.; Bu, X.L. A comparative analysis of aerosol properties in dust and haze-fog days in a Chinese urban region. Atmos. Res. 2011, 99, 241–247. [Google Scholar] [CrossRef]
  18. Holben, B.; Tanre, D.; Smirnov, A.; Eck, T.; Slutsker, I.; Abuhassan, N.; Newcomb, W.W.; Schafer, J.; Chatenet, B.; Lavenue, F.; et al. An emerging ground-based aerosol climatology: Aerosol Optical Depth from AERONET. J. Geophys. Res. 2001, 106, 12067–12097. [Google Scholar] [CrossRef]
  19. Holben, B.N.; Eck, T.F.; Slutsker, I.; Tanre, D.; Buis, J.P.; Setzer, A.; Vermote, E.; Reagan, J.A.; Kaufman, Y.; Nakajima, T.; et al. AERONET—A federated instrument network and data archive for aerosol characterization. Remote Sens. Environ. 1998, 66, 1–16. [Google Scholar] [CrossRef]
  20. Goloub, P.; Li, Z.; Dubovik, O.; Blarel, L.; Podvin, T.; Jankowiak, I.; Lecoq, R.; Deroo, C.; Chatenet, B.; Morel, J.P.; et al. PHOTONS/AERONET sunphotometer network overview: Description, activities, results. Proc. SPIE 2007, 6936. [Google Scholar] [CrossRef]
  21. Che, H.; Zhang, X.Y.; Chen, H.B.; Damiri, B.; Goloub, P.; Li, Z.Q.; Zhang, X.C.; Wei, Y.; Zhou, H.G.; Dong, F.; et al. Instrument calibration and aerosol optical depth validation of the China aerosol remote sensing network. J. Geophys. Res. 2009, 114. [Google Scholar] [CrossRef]
  22. Che, H.; Zhang, X.; Xia, X.; Goloub, P.; Holben, B.; Zhao, H.; Wang, Y.; Zhang, X.; Wang, H.; Blarel, L.; et al. Ground-based aerosol climatology of China: aerosol optical depths from the China Aerosol Remote Sensing Network (CARSNET) 2002–2013. Atmos. Chem. Phys. 2015, 15, 7619–7652. [Google Scholar] [CrossRef]
  23. Uchiyama, A.; Yamazaki, A.; Togawa, H.; Asano, J. Characteristics of aeolian dust observed by sky-radiometer in the Intensive Observation Period 1 (IOP1). J. Meteorol. Soc. Jpn. 2005, 83A, 291–305. [Google Scholar] [CrossRef]
  24. Sun, Y.; Zhuang, G.; Tang, A.; Wang, Y.; An, Z. Chemical characteristics of PM2.5 and PM10 in haze-fog episodes in Beijing. Environ. Sci. Technol. 2006, 40, 3148–3155. [Google Scholar] [CrossRef] [PubMed]
  25. Gui, K.; Che, H.; Chen, Q.; Yu, J.; Zheng, Y.; Lu, S.; Wang, H.; Wang, Y.; Zhang, X.; Shi, G. Analysis of the error in retrievals of aerosol optical properties from sunphotometer measurements of CARSNET due to a variety of objective factors. Atmosphere 2016, 7, 9. [Google Scholar] [CrossRef]
  26. Zheng, Y.; Che, H.; Zhao, T.; Xia, X.; Gui, K.; An, L.; Qi, B.; Wang, H.; Wang, Y.; Yu, J.; et al. Aerosol optical properties over Beijing during the world athletics championships and victory day military parade in August and September 2015. Atmosphere 2016, 7, 47. [Google Scholar] [CrossRef]
  27. Smirnov, A.; Holben, B.N.; Eck, T.F.; Dubovik, O.; Slutsker, I. Cloud-screening and quality control algorithms for the AERONET database. Remote Sens. Environ. 2000, 73, 337–349. [Google Scholar] [CrossRef]
  28. Eck, T.F.; Holben, B.N.; Reid, J.S.; Dubovik, O.; Smirnov, A.; O’neill, N.T.; Slutsker, I.; Kinne, S. Wavelength dependence of the optical depth of biomass burning, urban, and desert dust aerosols. J. Geophys. Res. 1999, 104, 31333–31349. [Google Scholar] [CrossRef]
  29. Dubovik, O.; King, M.D. A flexible inversion algorithm for the retrieval of aerosol optical properties from Sun and sky radiance measurements. J. Geophys. Res. 2000, 105, 20673–20696. [Google Scholar] [CrossRef]
  30. Dubovik, O.; Sinyuk, A.; Lapyonok, T.; Holben, B.N.; Mishchenko, M.; Yang, P.; Eck, T.F.; Volten, H.; Munoz, O.; Veihelmann, B.; et al. Application of spheroid models to account for aerosol particlenonsphericity in remote sensing of desert dust. J. Geophys. Res. Atmos. 2006, 111. [Google Scholar] [CrossRef]
  31. Dee, D.P.; Uppala, S.M.; Simmons, A.J.; Berrisford, P.; Poli, P.; Kobayashi, S.; Andrae, U.; Balmaseda, M.A.; Balsamo, G.; Bauer, P.; et al. The ERA-Interim reanalysis: Configuration and performance of the data assimilation system. Q. J. R. Meteorol. Soc. 2011, 137, 553–597. [Google Scholar] [CrossRef]
  32. Draxler, R.R.; Rolph, G.D. HYSPLIT (HYbrid Single-Particle Lagrangian Integrated Trajectory). NOAA Air Resources Laboratory, Silver Spring, MD. Model Access via NOAA ARL READY Website. Available online: http://ready.arl.noaa.gov/HYSPLIT.php (accessed on 18 May 2016).
  33. Liu, Z.; Liu, D.; Huang, J.; Vaughan, M.; Uno, I.; Sugimoto, N.; Kittaka, C.; Trepte, C.; Wang, Z.; Hostetler, C.; et al. Airborne dust distributions over the Tibetan Plateau and surrounding areas derived from the first year of CALIPSO LiDAR observations. Atmos. Chem. Phys. 2008, 8, 5045–5060. [Google Scholar] [CrossRef]
  34. Omar, A.H.; Winker, D.M.; Vaughan, M.A.; Hu, Y.; Trepte, C.R.; Ferrare, R.A.; Lee, K.; Hostetler, C.A.; Kittaka, C.; Rogers, R.R.; et al. The CALIPSO automated aerosol classification and LiDAR ratio selection algorithm. J. Atmos. Ocean. Technol. 2009, 26, 1994–2014. [Google Scholar] [CrossRef]
  35. Fu, G.; Xu, W.; Rong, R.; Li, J.; Zhao, C. The distribution and trends of fog and haze in the North China plain over the past 30 years. Atmos. Chem. Phys. 2014, 14, 11949–11958. [Google Scholar] [CrossRef] [Green Version]
  36. Hennigan, C.J.; Bergin, M.H.; Dibb, J.E.; Weber, R.J. Enhanced secondary organic aerosol formation due to water uptake by fine particles. Geophys. Res. Lett. 2008, 35. [Google Scholar] [CrossRef]
  37. Wang, Y.S.; Yao, L.; Wang, L.L.; Liu, Z.R.; Ji, D.S.; Tang, G.Q.; Zhang, J.K.; Sun, Y.; Hu, B.; Xin, J.Y. Mechanism for the formation of the January 2013 heavy haze pollution episode over central and eastern China. Sci. China Earth Sci. 2014, 57, 14–25. [Google Scholar] [CrossRef]
  38. Eck, T.F.; Holben, B.N.; Sinyuk, A.; Pinker, R.T.; Goloub, P.; Chen, H.; Chatenet, B.; Li, Z.; Singh, R.P.; Tripathi, S.N.; et al. Climatological aspects of the optical properties of fine/coarse mode aerosol mixtures. J. Geophys. Res. 2010, 115. [Google Scholar] [CrossRef]
  39. Xia, X.; Chen, H.; Goloub, P.; Zong, X.; Zhang, W.; Wang, P. Climatological aspects of aerosol optical properties in North China Plain based on ground and satellite remote-sensing data. J. Quant. Spectroc. Radit. Trans. 2013, 127, 12–23. [Google Scholar] [CrossRef]
  40. Zhang, X.Y.; Wang, Y.Q.; Niu, T.; Zhang, X.C.; Gong, S.L.; Zhang, Y.M.; Sun, J.Y. Atmospheric aerosol compositions in China: Spatial/temporal variability, chemical signature, regional haze distribution and comparisons with global aerosols. Atmos. Chem. Phys. 2012, 12, 779–799. [Google Scholar] [CrossRef]
  41. Li, W.; Li, P.; Sun, G.; Zhou, S.; Yuan, Q.; Wang, W. Cloud residues and interstitial aerosols from non-precipitating clouds over an industrial and urban area in northern China. Atmos. Environ. 2011, 45, 2488–2495. [Google Scholar] [CrossRef]
  42. Eck, T.F.; Holben, B.N.; Reid, J.S.; Giles, D.M.; Rivas, M.A.; Singh, R.P.; Tripathi, S.N.; Bruegge, C.J.; Platnick, S.; Arnold, G.T.; et al. Fog- and cloud-induced aerosol modification observed by the Aerosol Robotic Network (AERONET). J. Geophys. Res. 2012, 117. [Google Scholar] [CrossRef]
  43. Li, Z.Q.; Eck, T.; Zhang, Y.; Zhang, Y.H.; Li, D.H.; Li, L.; Xu, H.; Hou, W.Z.; L, Y.; Goloub, P.; et al. Observations of residual submicron fine aerosol particles related to cloud and fog processing during a major pollution event in Beijing. Atmos. Environ. 2014, 86, 187–192. [Google Scholar] [CrossRef]
  44. Li, W.J.; Shao, L.Y.; Buseck, P.R. Haze types in Beijing and the influence of agricultural biomass burning. Atmos. Chem. Phys. 2010, 10, 8119–8130. [Google Scholar] [CrossRef]
  45. Bergstrom, R.W.; Pilewskie, P.; Russell, P.B.; Redemann, J.; Bond, T.C.; Quinn, P.K.; Sierau, B. Spectral absorption properties of atmospheric aerosols. Atmos. Chem. Phys. 2007, 7, 5937–5943. [Google Scholar] [CrossRef]
  46. Bergstrom, R.W. Extinction and absorption coefficients of the atmospheric aerosol as a function of particle size. Contr. Atmos. Phys. 1973, 46, 223–234. [Google Scholar]
  47. Bohren, C.F.; Huffman, D.R. Absorption and Scattering of Light by Small Particles; John Wiley: New York, NY, USA, 1983. [Google Scholar]
  48. Gyawali, M.; Arnott, W.P.; Zaveri, R.A.; Song, C.; Moosmüller, H.; Liu, L.; Mishchenko, M.I.; Chen, L.W.A.; Green, M.C.; Watson, J.G.; et al. Photoacoustic optical properties at UV, VIS, and near IR wavelengths 555 for laboratory generated and winter time ambient urban aerosols. Atmos. Chem. Phys. 2012, 12, 2587–2601. [Google Scholar] [CrossRef] [Green Version]
  49. Gyawali, M.; Arnott, W.P.; Lewis, K.; Moosmüller, H. In situ aerosol optics in Reno, NV, USA during and after the summer 2008 California wildfires and the influence of absorbing and non-absorbing coatings on spectral light absorption. Atmos. Chem. Phys. 2009, 9, 8007–8015. [Google Scholar] [CrossRef]
  50. Wiegner, M.; Gasteiger, J.; Kandler, K.; Weinzierl, B.; Rasp, K.; Esselborn, M.; Freudenthaler, V.; Heese, B.; Toledano, C.; Tesche, M.; et al. Numerical simulations of opticalproperties of Saharan dust aerosols with emphasis on LiDAR applications. Tellus B 2009, 61, 180–194. [Google Scholar]
  51. Wiegner, M.; Madonna, F.; Binietoglou, I.; Forkel, R.; Gasteiger, J.; Geiß, A.; Pappalardo, G.; Schäfer, K.; Thomas, W. What is the benefit of ceilometers for aerosol remote sensing? An answer from EARLINET. Atmos. Meas. Tech. 2014, 7, 1979–1997. [Google Scholar] [CrossRef]
  52. Ansmann, A.; Tesche, M.; Groß, S.; Freudenthaler, V.; Seifert, P.; Hiebsch, A.; Schmidt, J.; Wandinger, U.; Mattis, I.; Müller, D.; et al. The 16 April 2010 major volcanic ash plume over central Europe: EARLINET LiDAR and AERONET photometer observations at Leipzig and Munich, Germany. Geophys. Res. Lett. 2010, 37, L13810. [Google Scholar] [CrossRef]
Figure 1. Daily variation of the (a) particle mass concentration and (b) proportion of PM2.5/PM10 (ground measurement dataset).
Atmosphere 07 00070 g001
Figure 2. The daily average wind fields at (a) 850 hPa and (b) the surface during 17–23 December in the Beijing area (ERA-Interim dataset).
Atmosphere 07 00070 g002aAtmosphere 07 00070 g002b
Figure 3. Temporal variation of meteorological parameters and pollutants from 17 to 23 December 2015: (a) temperature (°C) and RH (%); (b) visibility (km) and RH (%); (c) visibility (km) and PM2.5 concentration (μg/m3) (meteorological dataset).
Atmosphere 07 00070 g003aAtmosphere 07 00070 g003b
Figure 4. Vertical distribution of temperature from 17 to 23 December 2015 in Beijing (radiosonde dataset).
Atmosphere 07 00070 g004
Figure 5. Daily variation of (a) AOD500nm and AE; and (b) CWV and FMF (Level 1.5 aerosol inversions datasets).
Atmosphere 07 00070 g005
Figure 6. Scattergram of the AOD500nm vs. CWV on 19 December in Beijing.
Atmosphere 07 00070 g006
Figure 7. The (a) SSA and (b) aerosol volume size distribution measurements in Beijing during 17–23 December 2015.
Atmosphere 07 00070 g007
Figure 8. The daily averages of AAOD at different wavelengths and AAE measurements at Beijing on 17–23 December 2015.
Atmosphere 07 00070 g008
Figure 9. Daily average refractive index during the haze event in Beijing on 17–23 December 2015: (a) the real parts; (b) the imaginary parts.
Atmosphere 07 00070 g009
Figure 10. The (a) daily averages of asymmetry factor at 440, 675, 870 and 1020 nm; and (b) sphericity measurements, in Beijing on 17–23 December 2015.
Atmosphere 07 00070 g010
Figure 11. The (a,b) Aqua and (c,d) Terra MODIS true color images for 19–22 December 2015.
Atmosphere 07 00070 g011
Figure 12. The CALIPSO (a) backscatter extinction at 532 nm; (b) volume depolarization ratio; and (c) aerosol subtypes, at nighttime on 20 and 22 December, and during the daytime on 19 and 21 December (CALIPSO V3.30 dataset).
Atmosphere 07 00070 g012
Figure 13. The 72-h backward air trajectories arriving at three heights in Beijing at (a) 0800 LT 20 December and (b) 0800 LT 23 December (HYSPLIT model).
Atmosphere 07 00070 g013
Table 1. Daily mean parameters of aerosol volume size distribution (Cv is volume concentration; Reff is effective radius; Rv is volume median radius; δ is standard deviation).
DayFine ModeCoarse ModeCf/Cc
CvRvReffδCvRvReffδ
17 December0.0230.170.150.540.0333.042.360.690.71
19 December0.0690.170.150.540.2952.431.760.790.23
20 December0.2170.220.190.560.1013.162.760.542.15
21 December0.1420.190.170.500.0642.812.300.652.22
22 December0.3090.250.220.510.1033.102.630.603.00
23 December0.1120.200.200.580.0472.942.450.622.39

