
Temporal Variability of Summer Temperature Extremes in Poland


Abstract
:1. Introduction
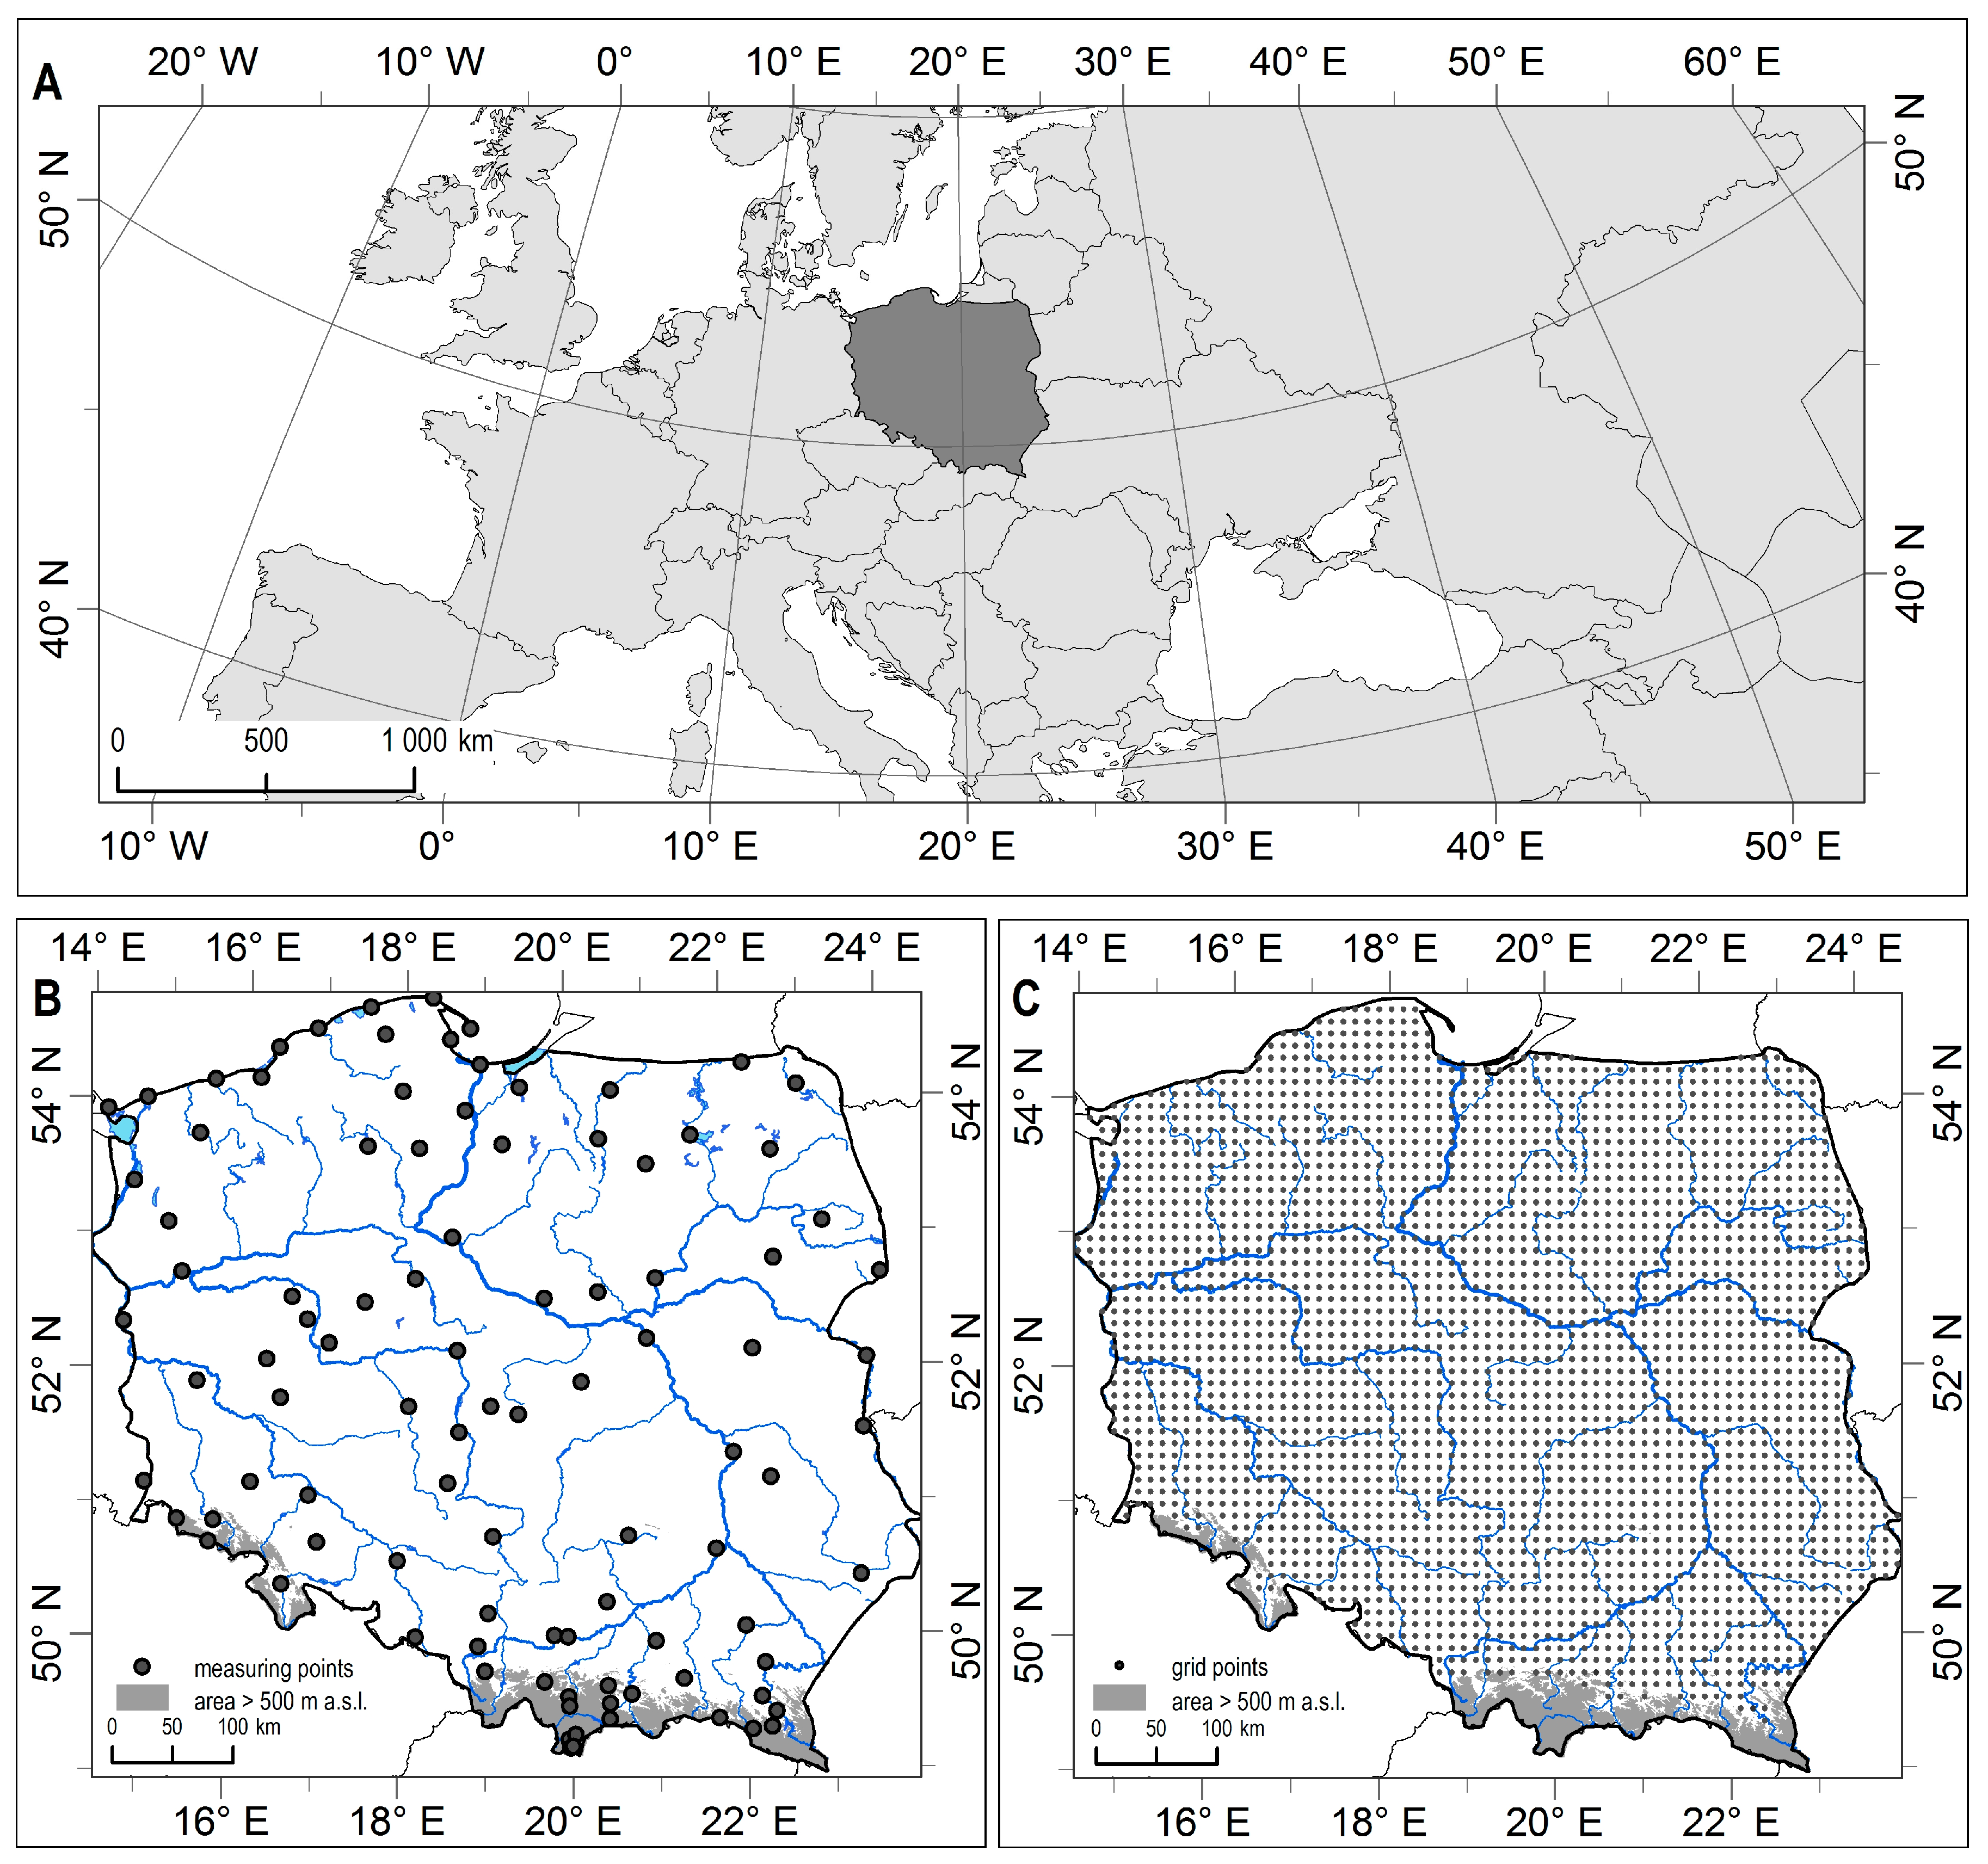
2. Data and Methods
3. Results and Discussion
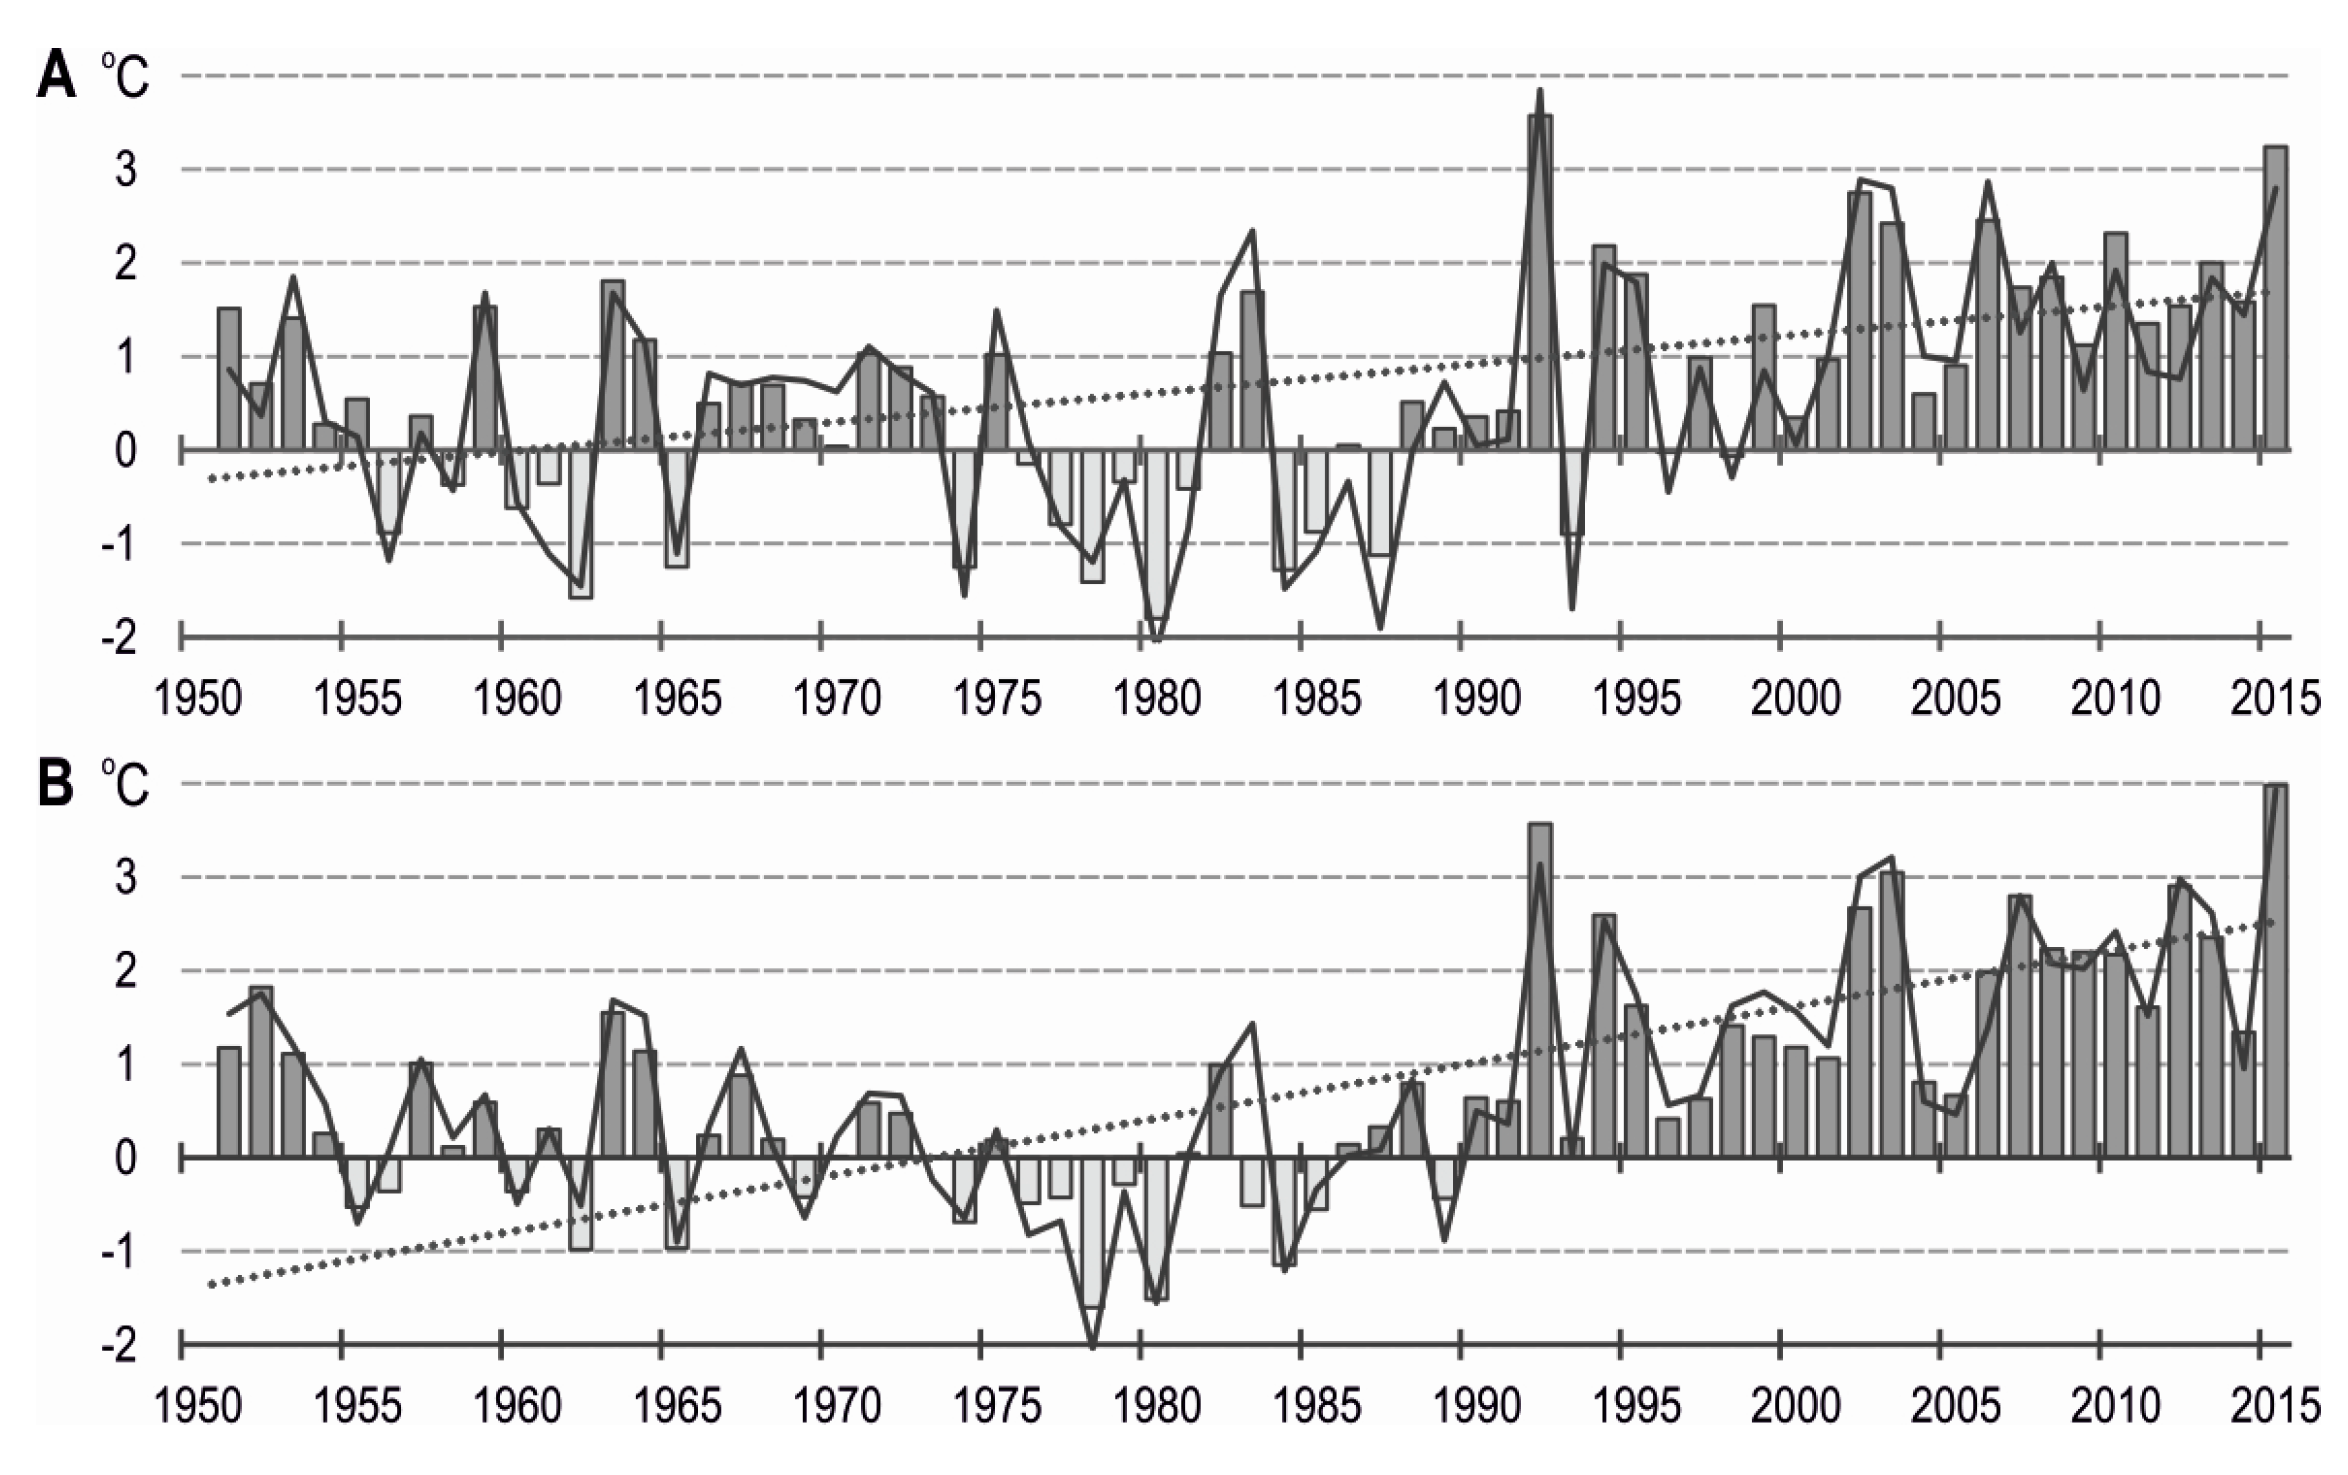
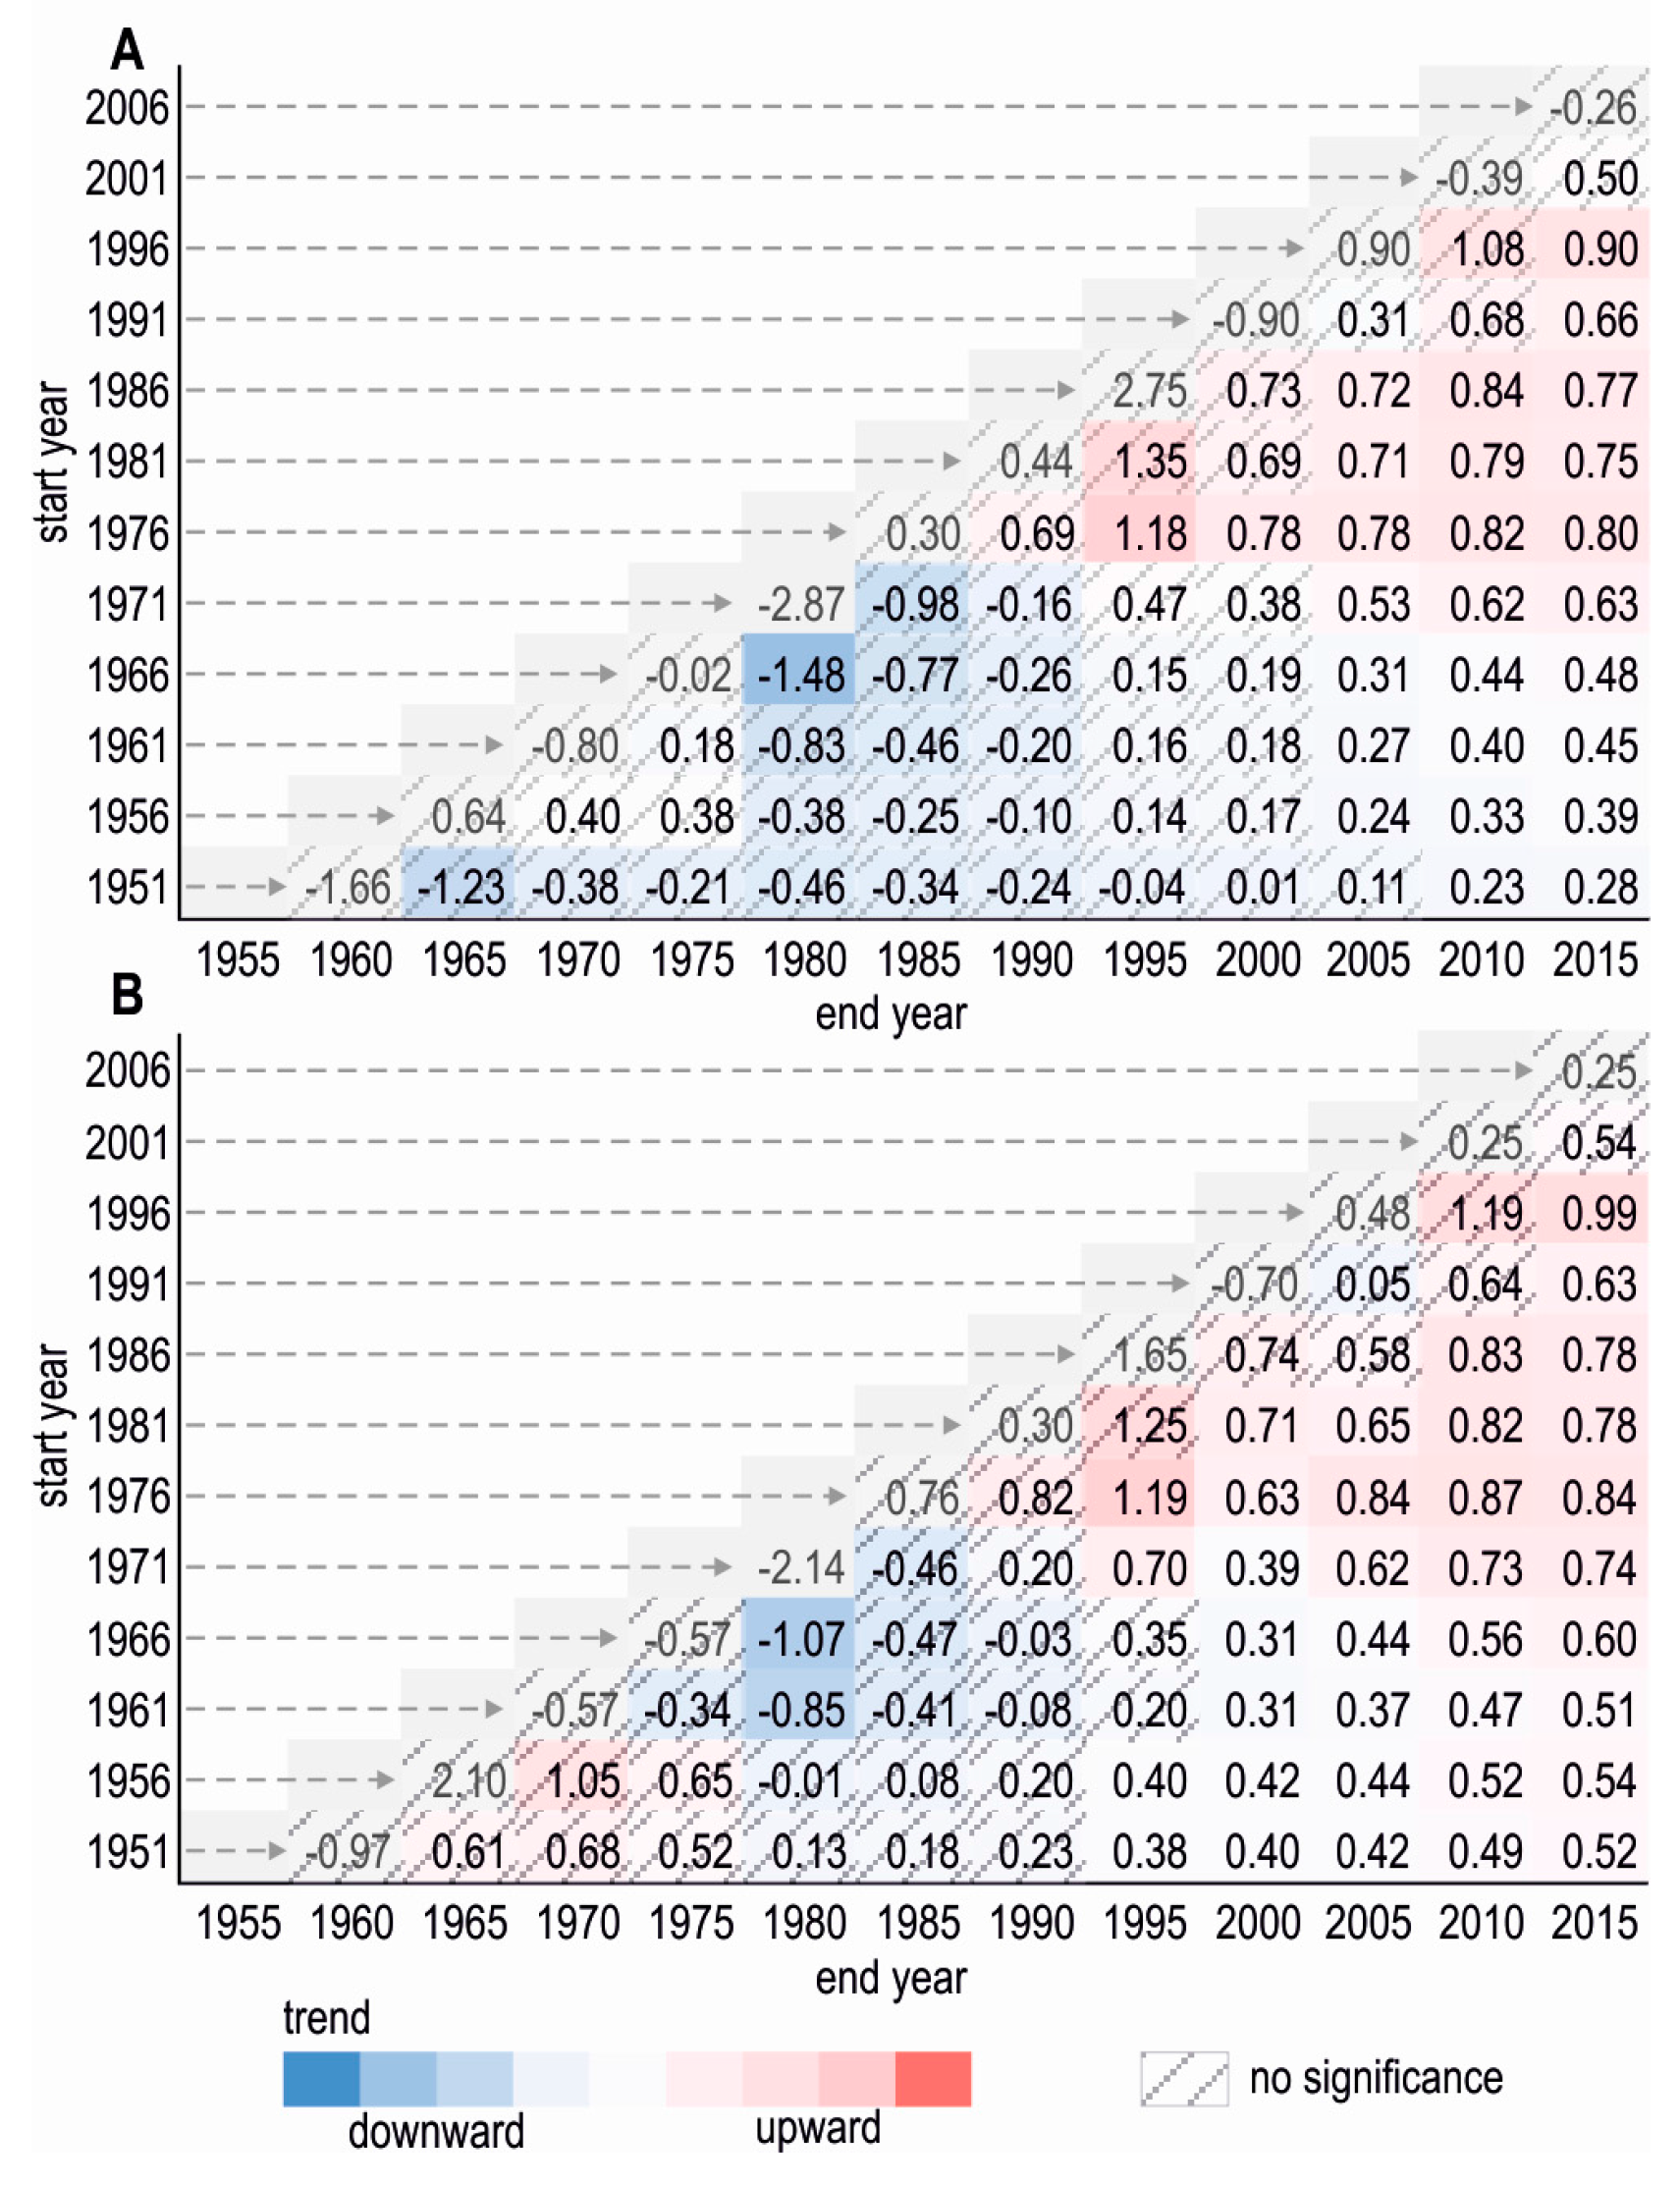
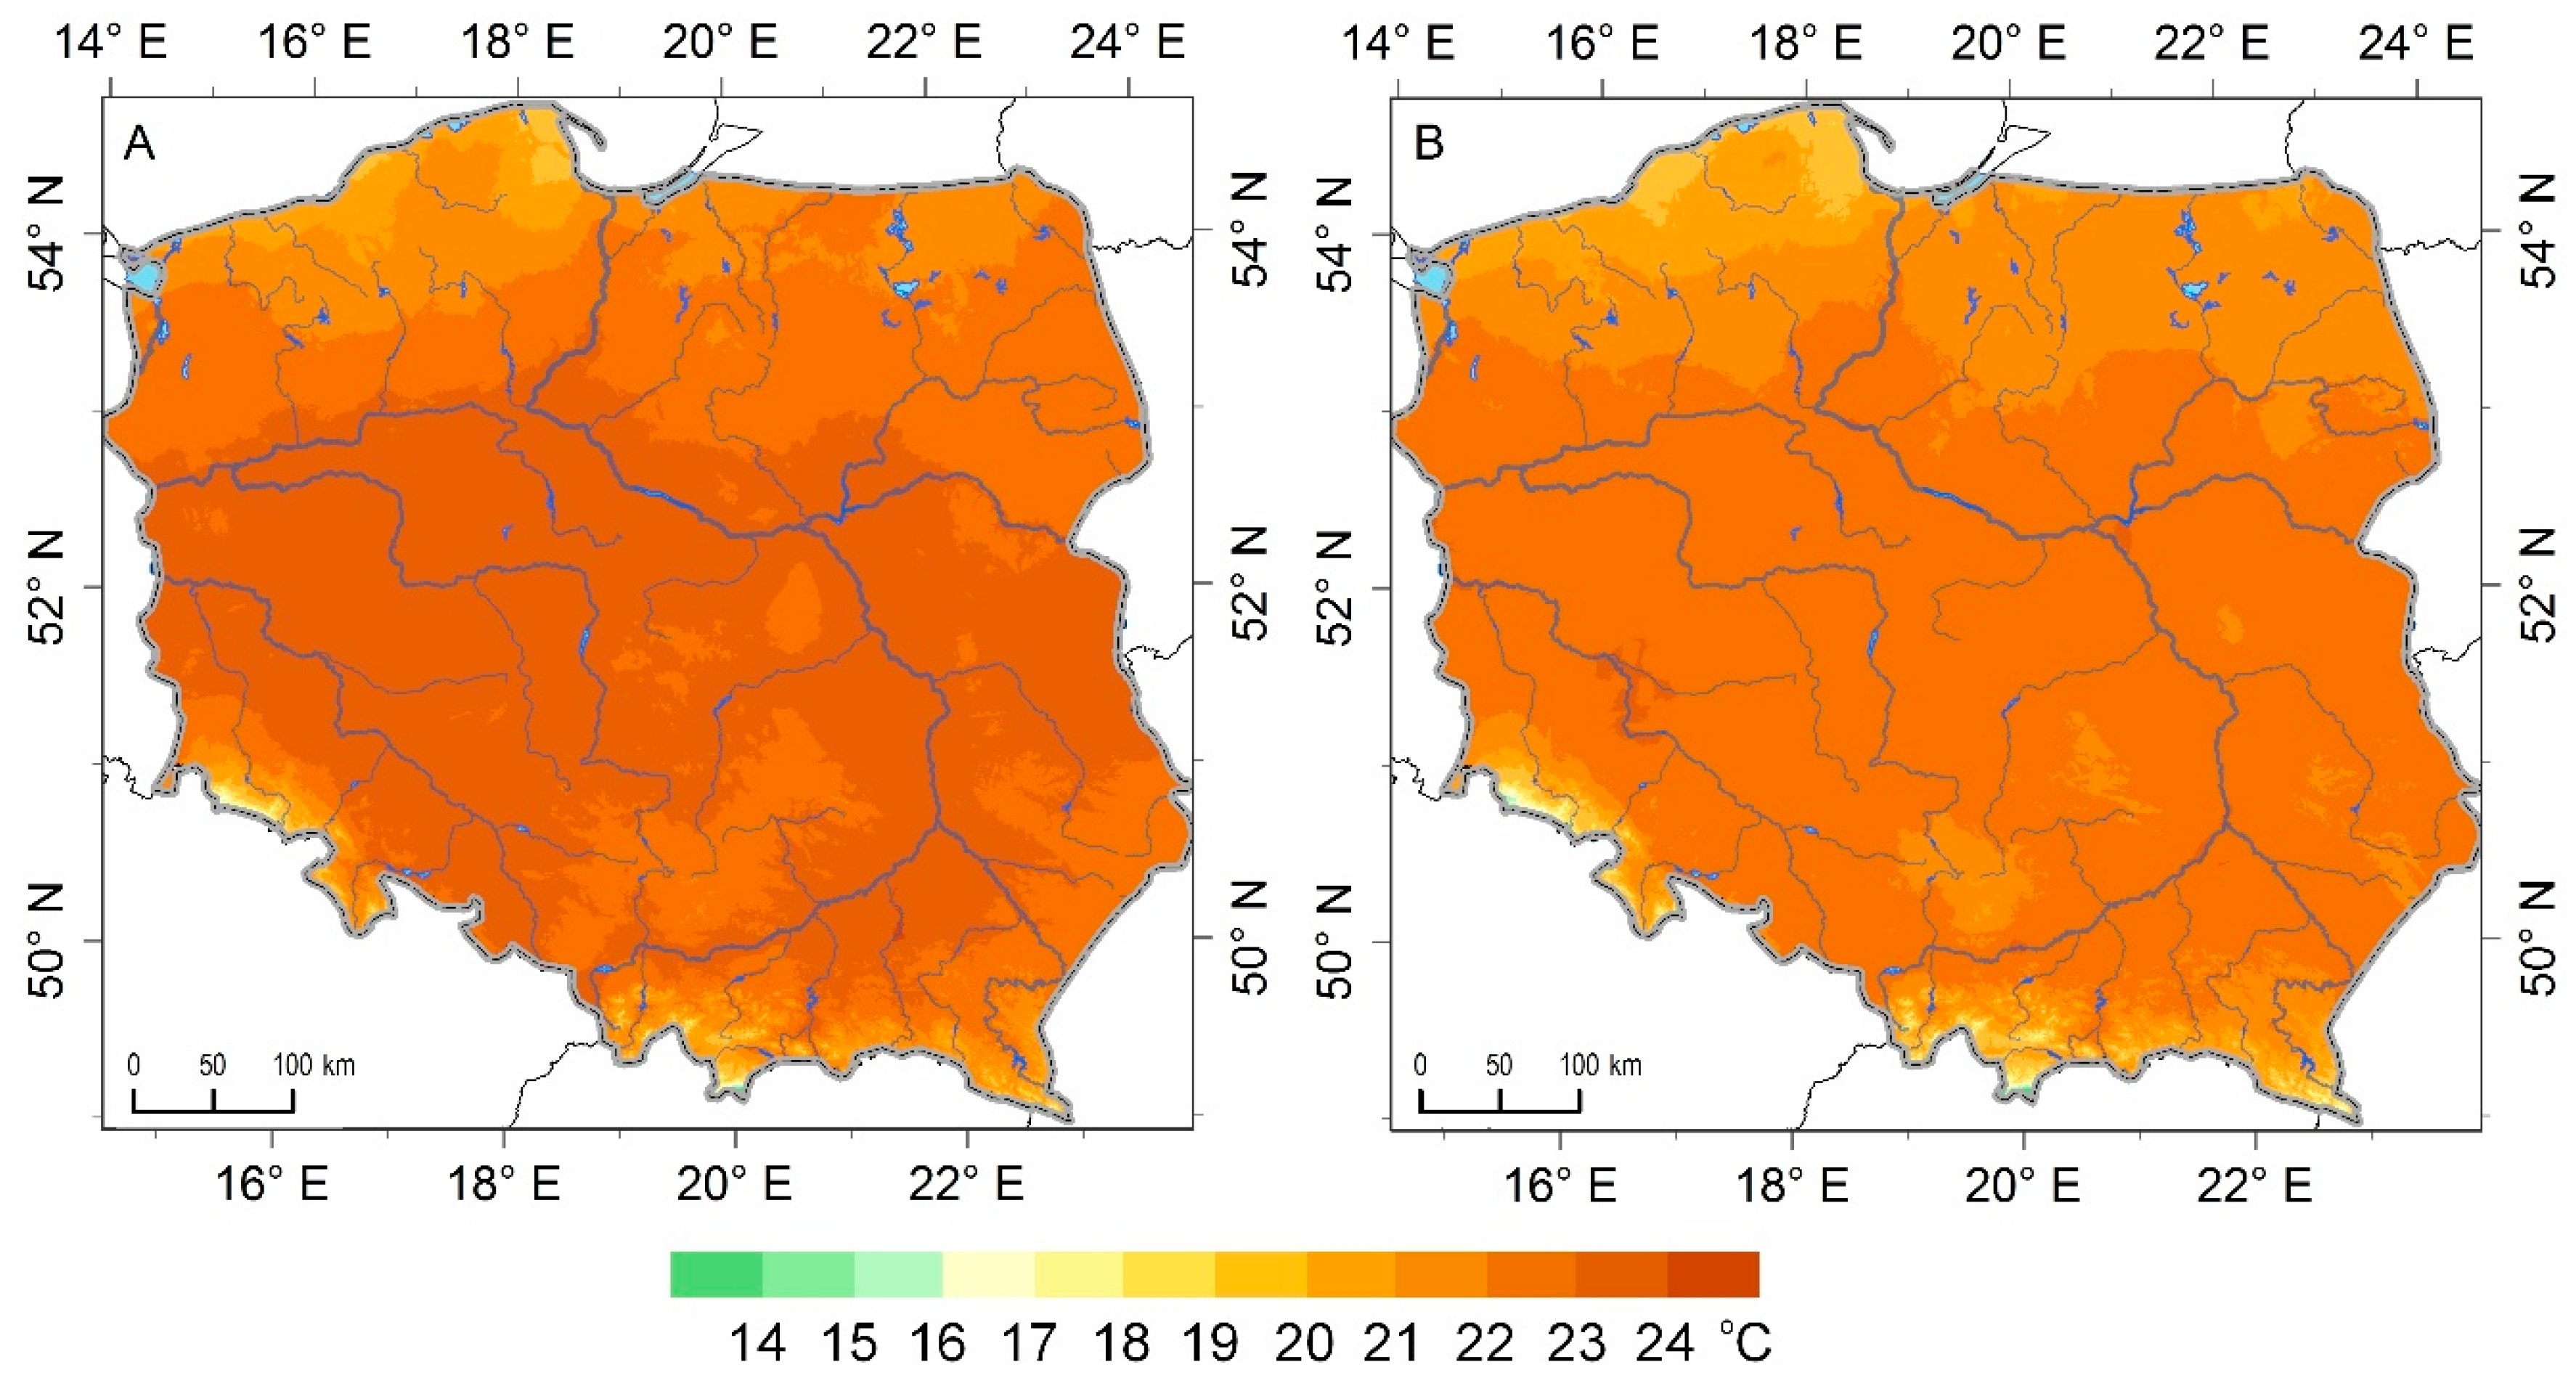
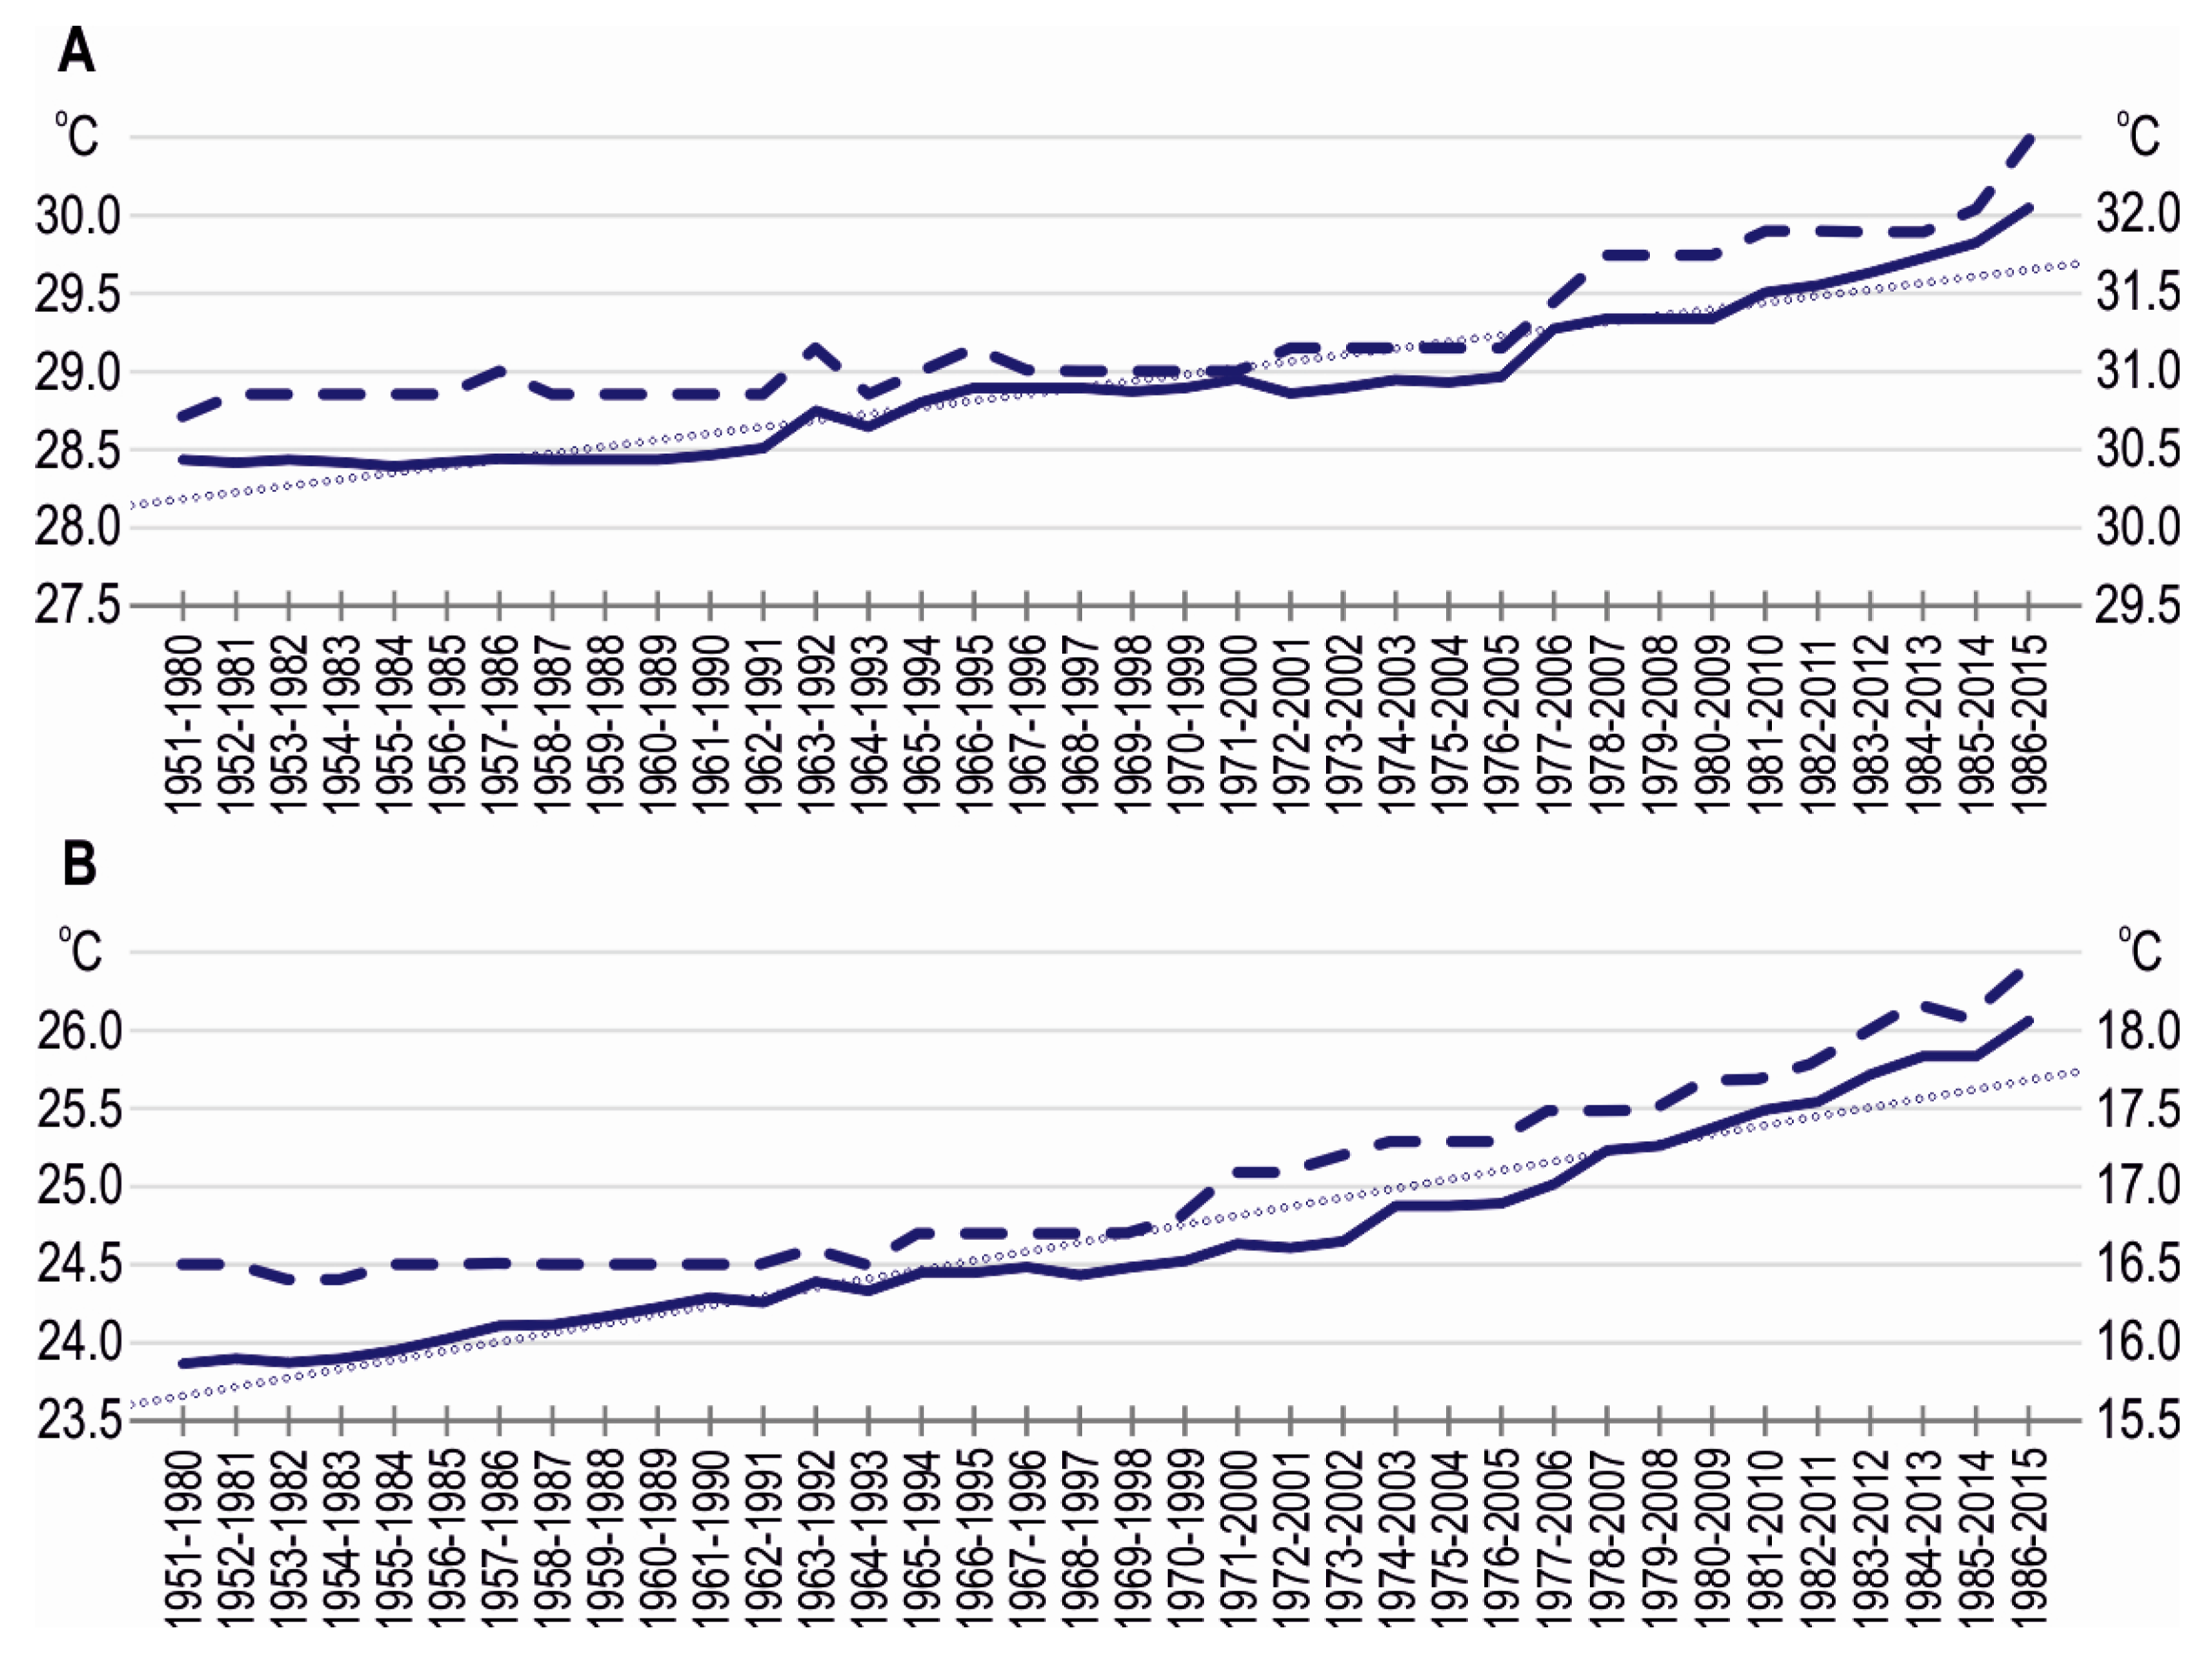
3.1. Long-Term Variability of Summer Maximum Air Temperature
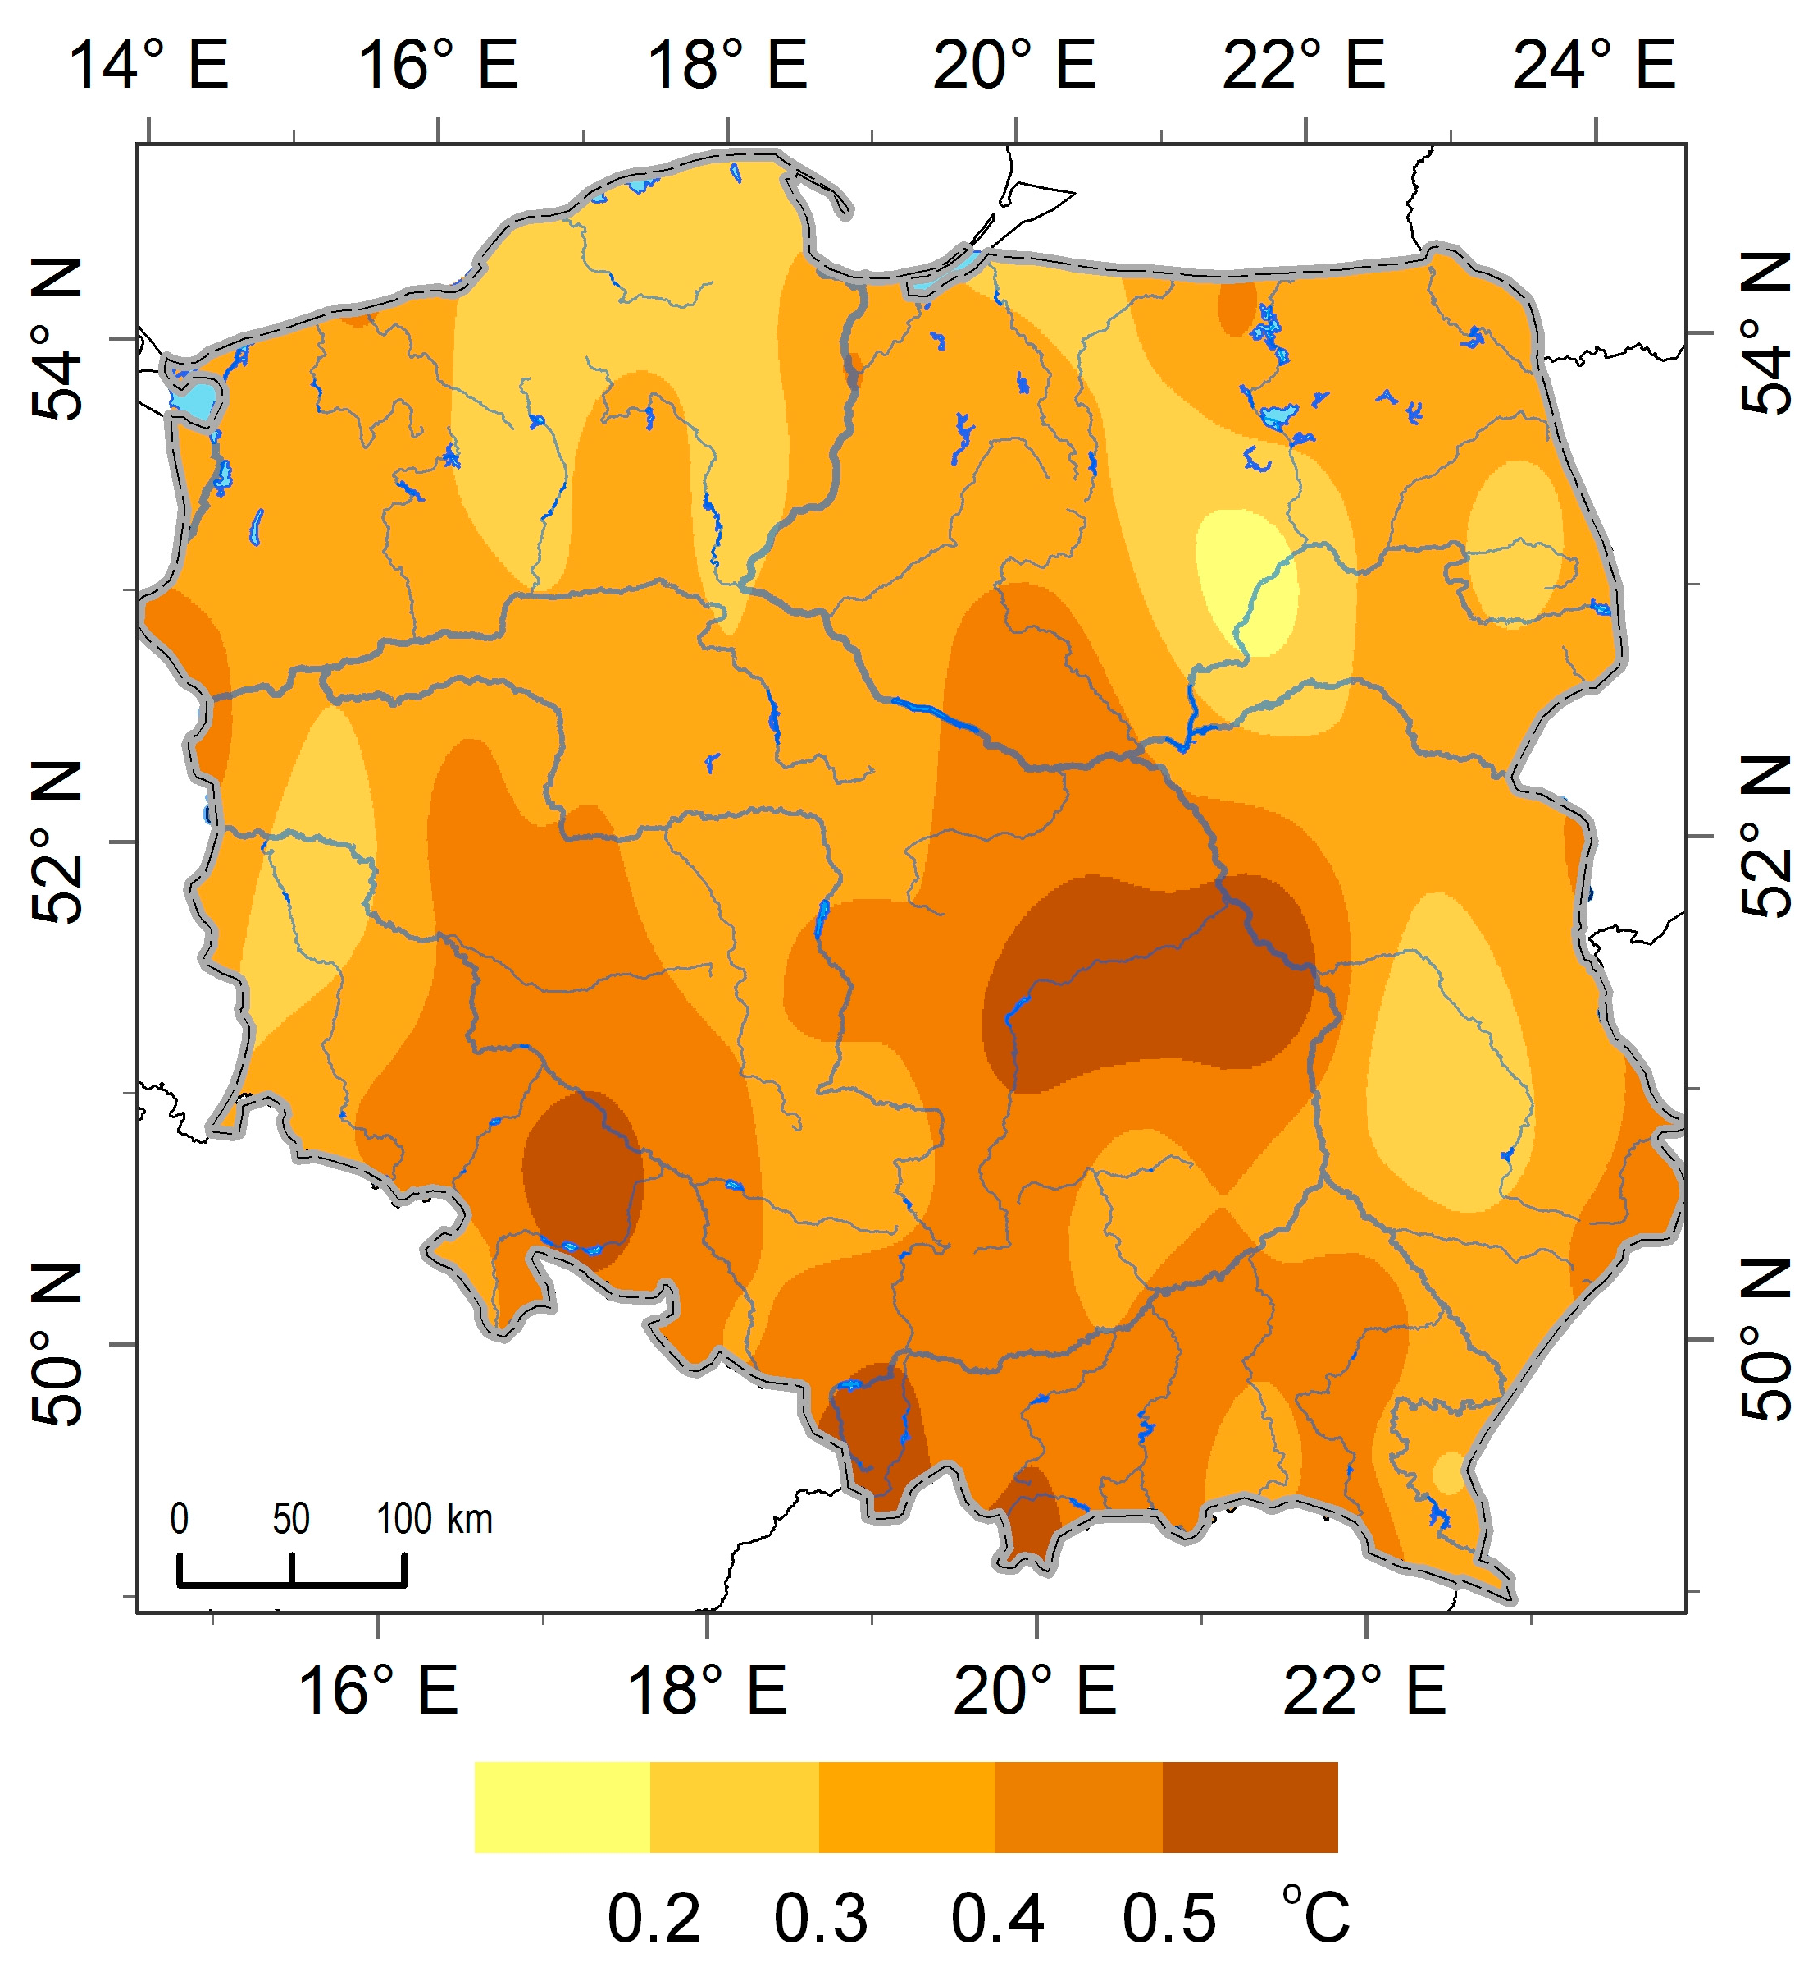
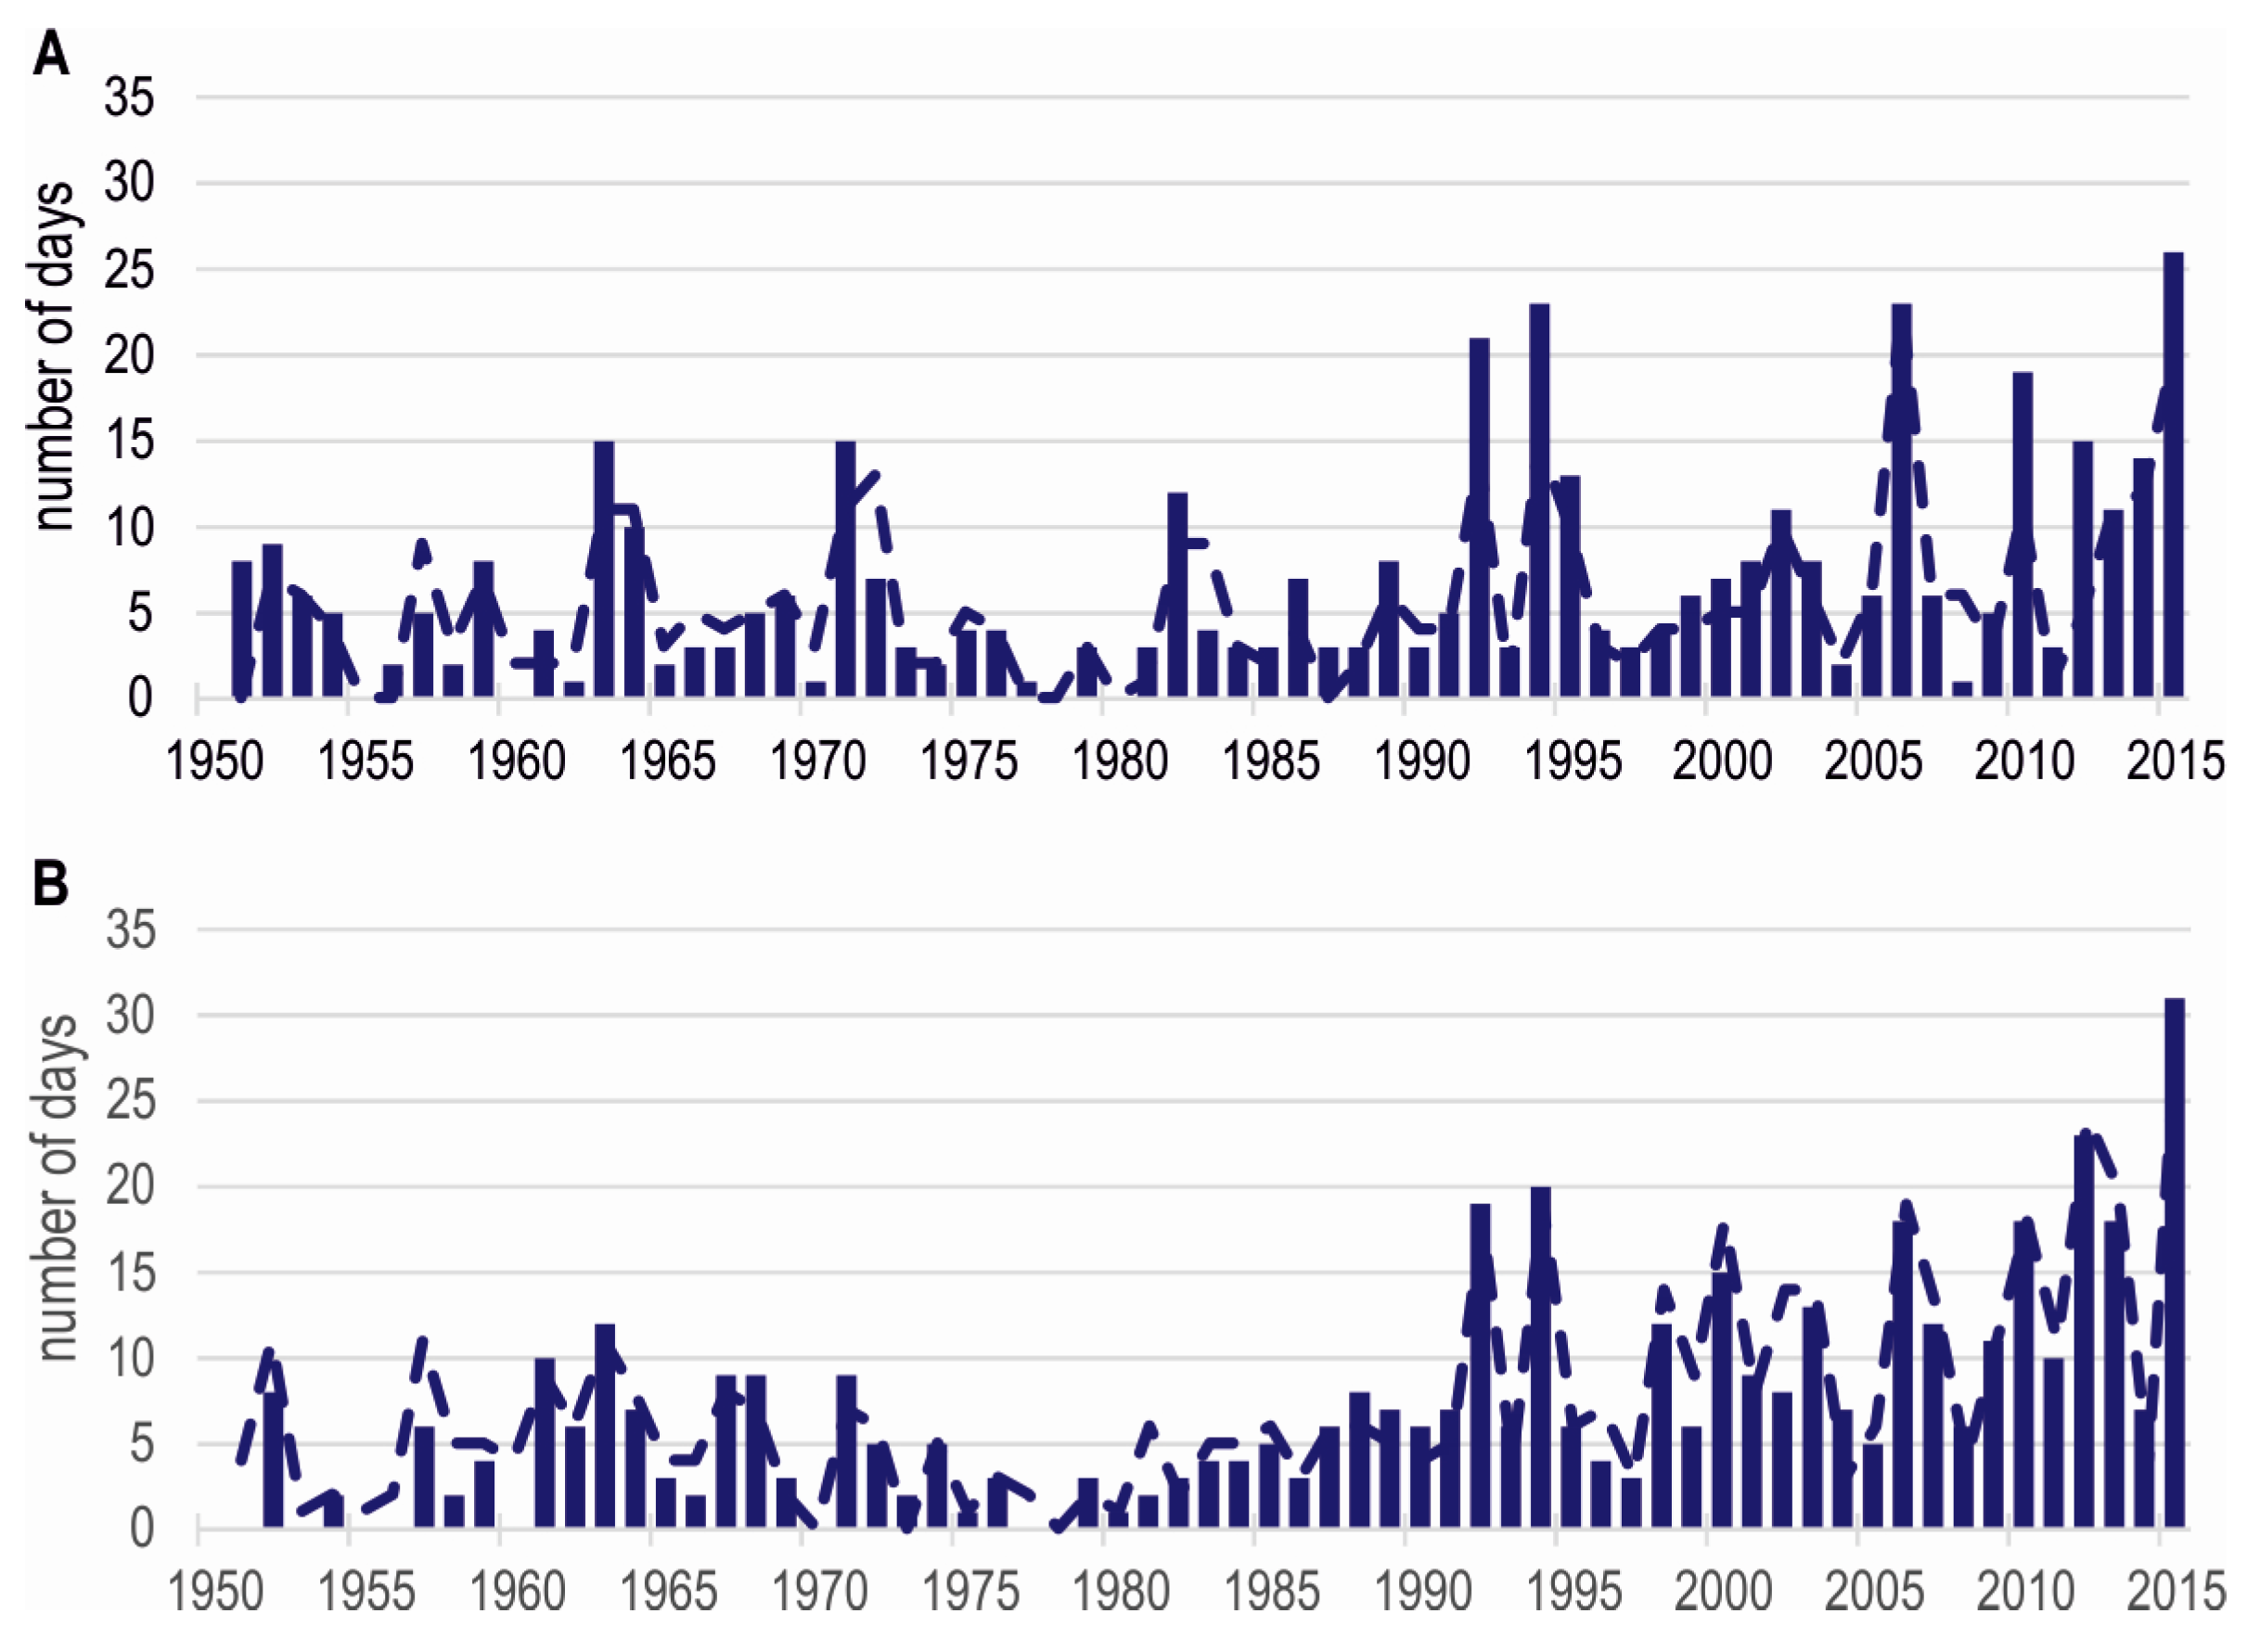
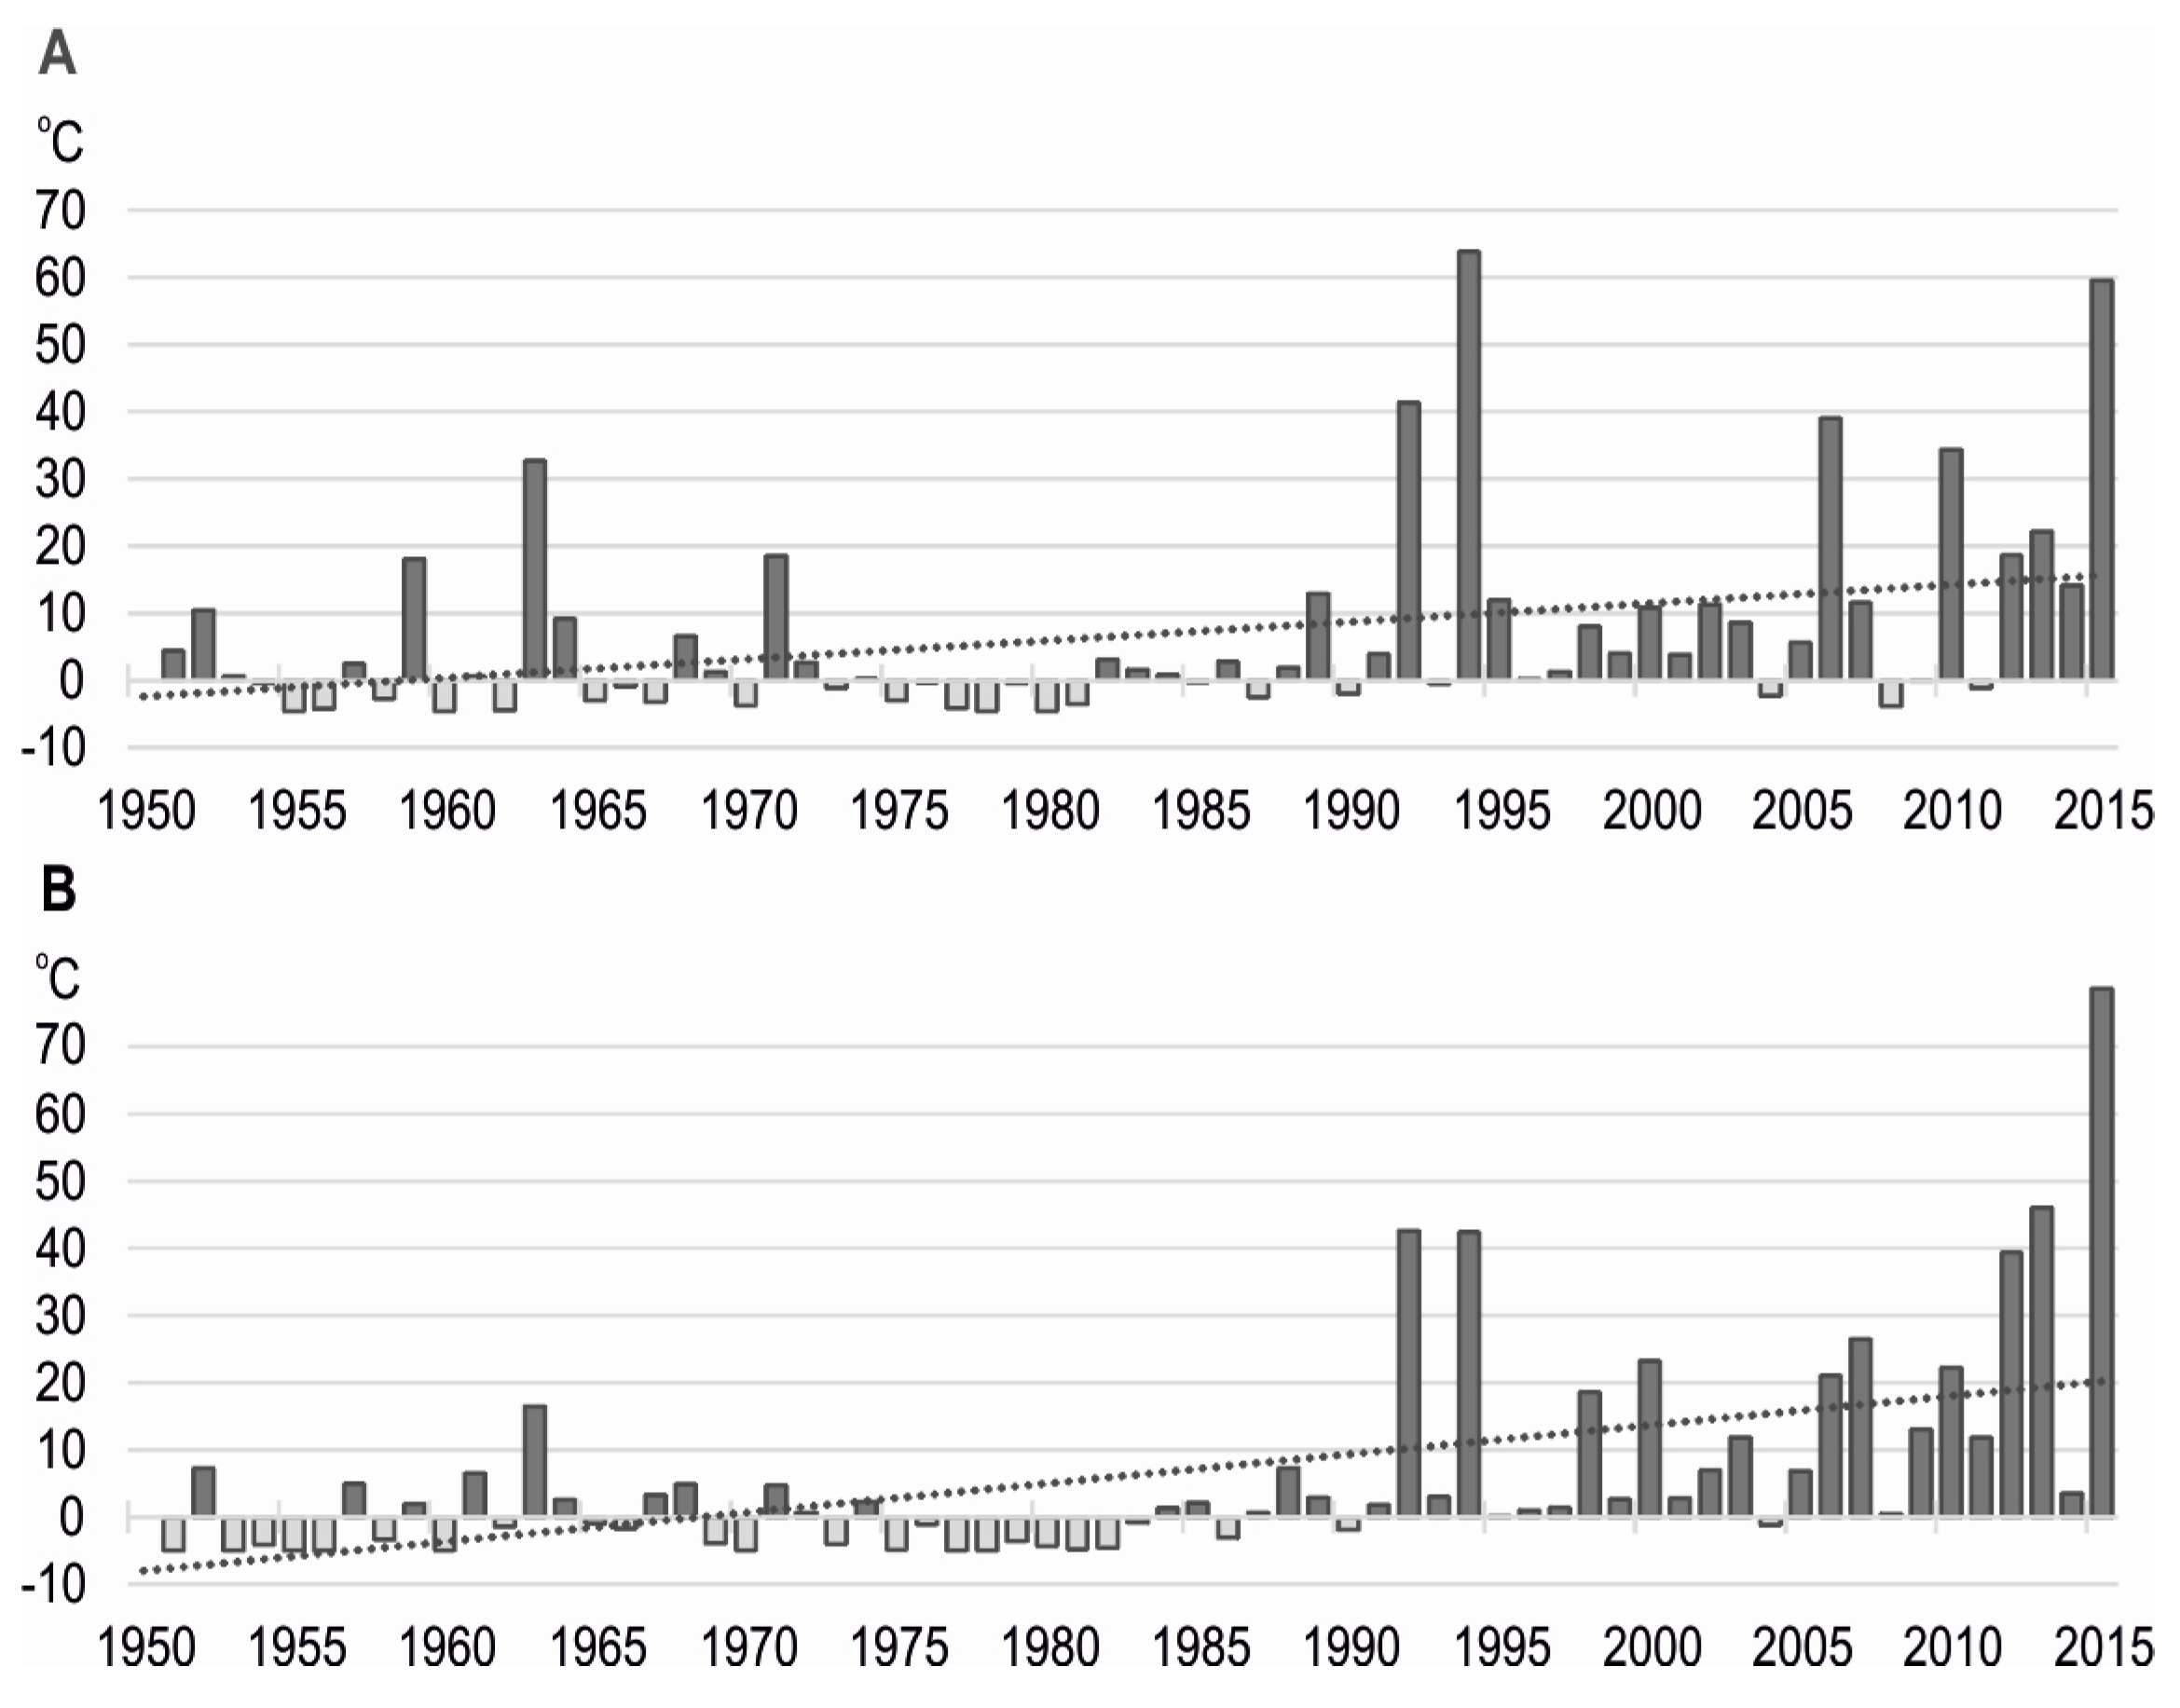
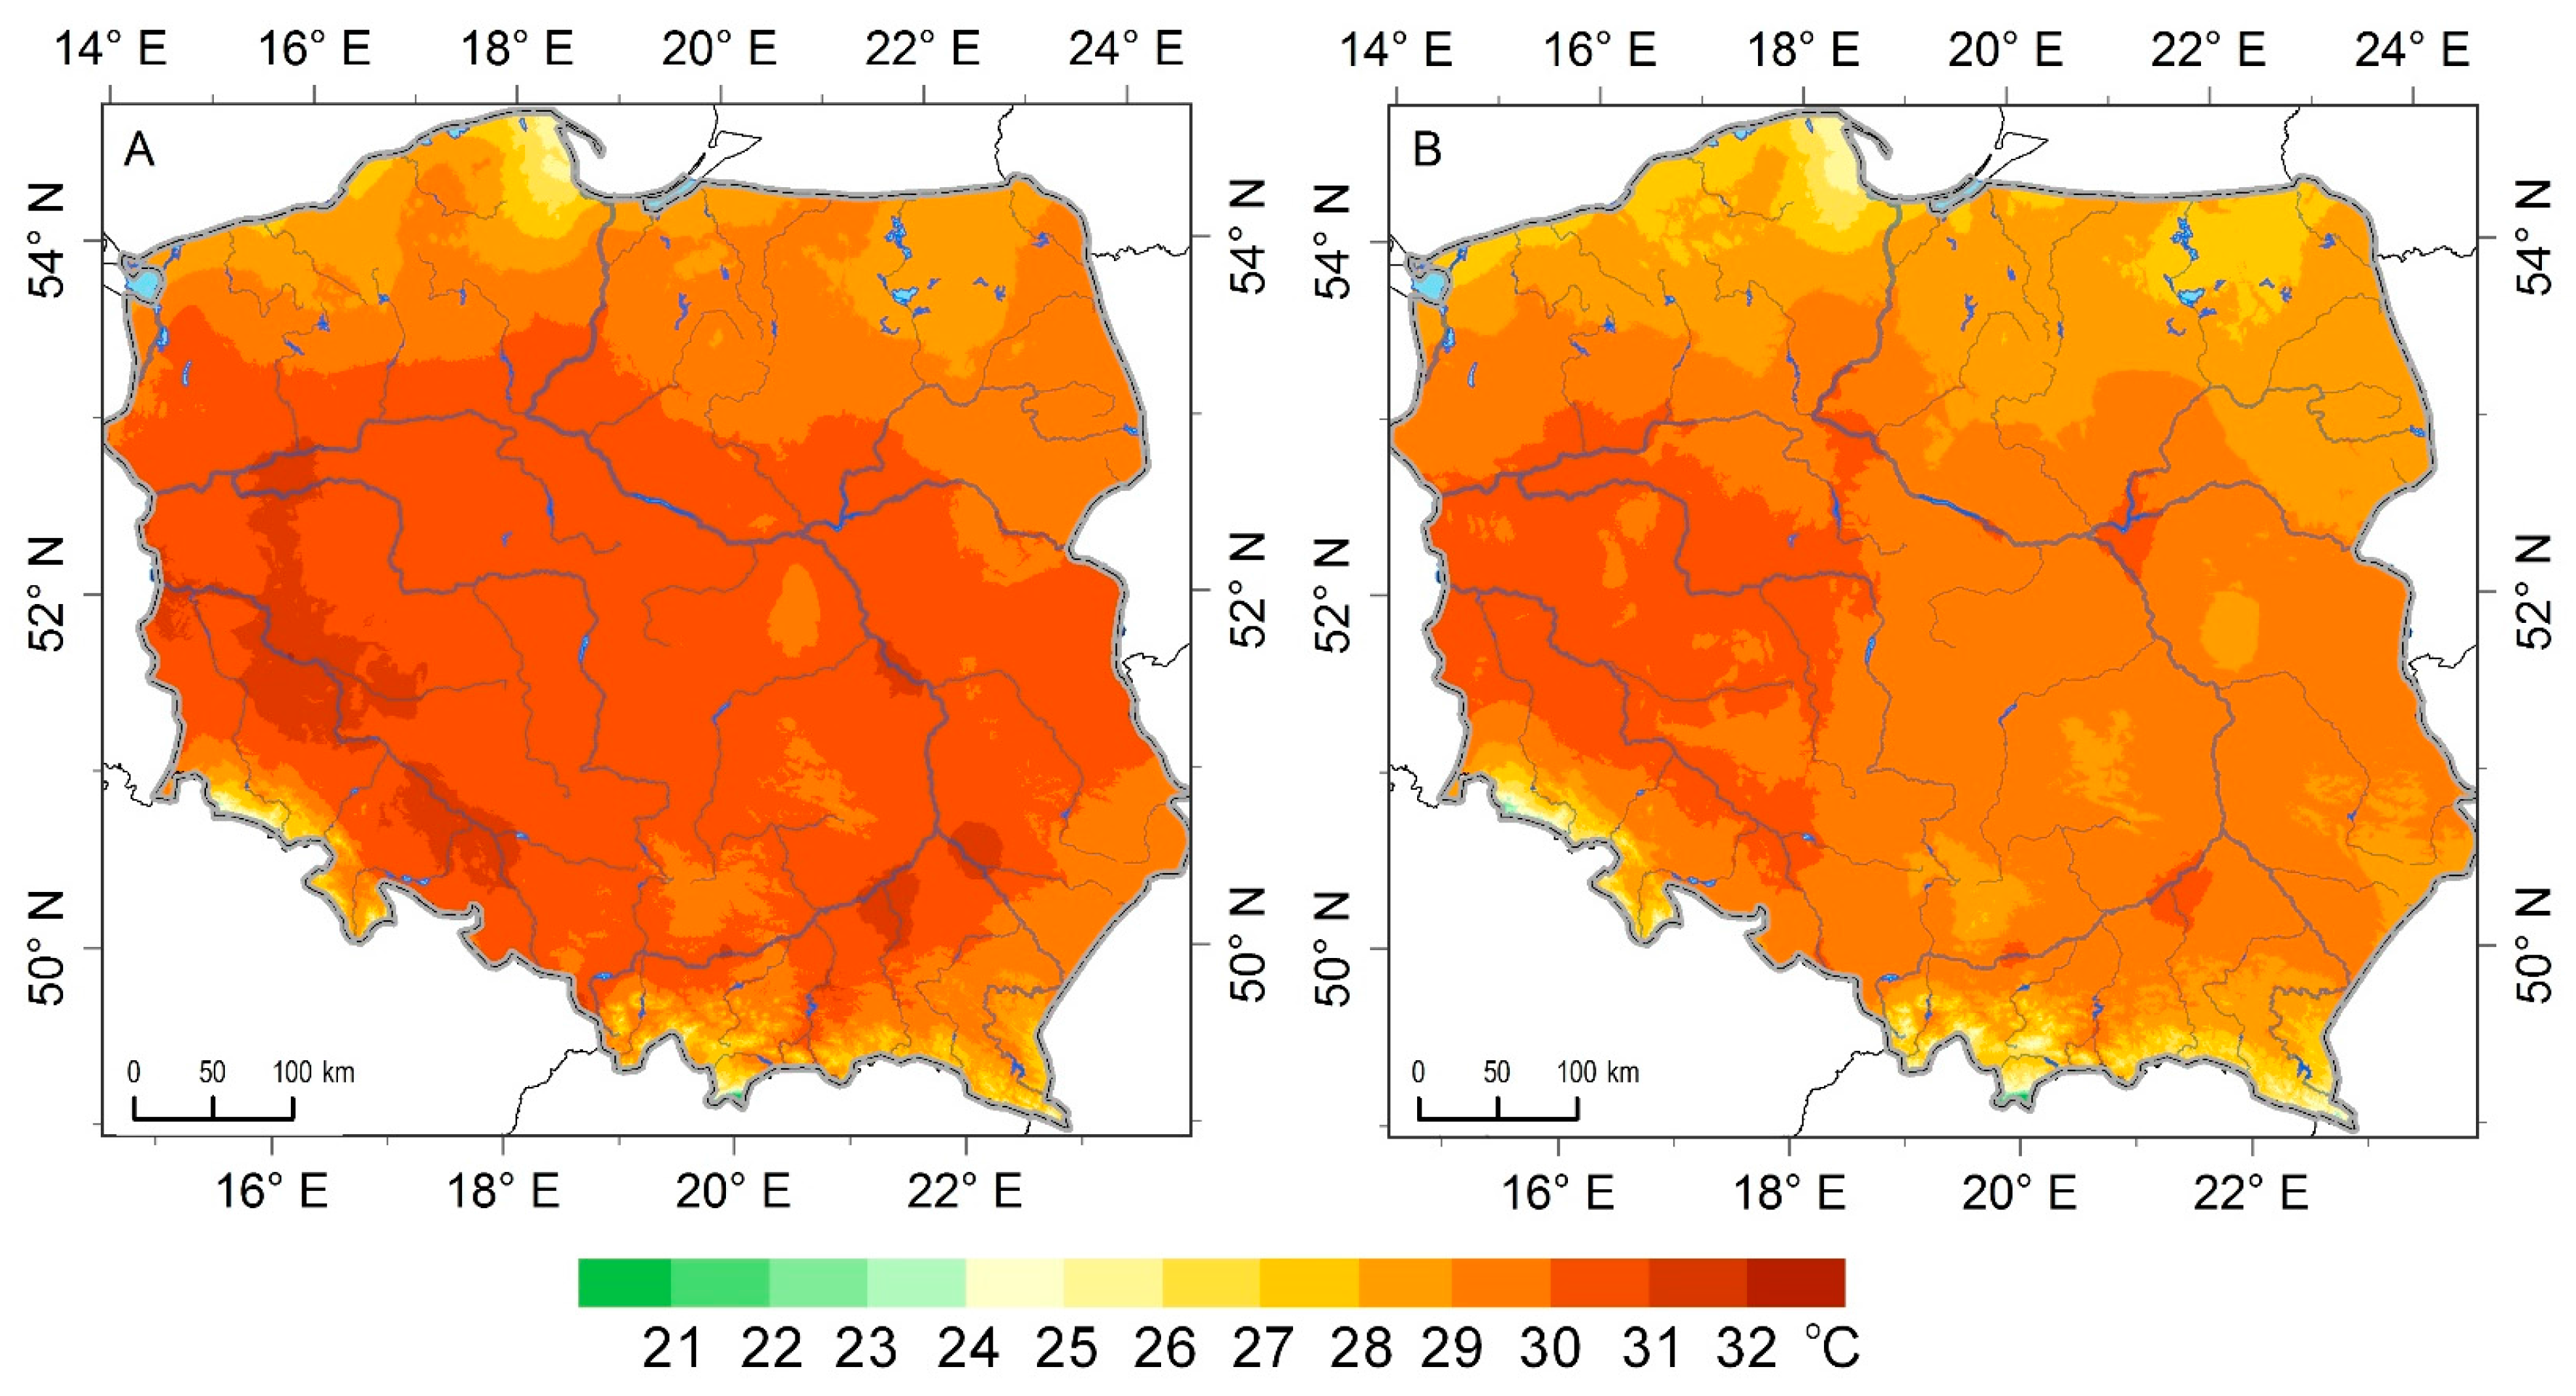
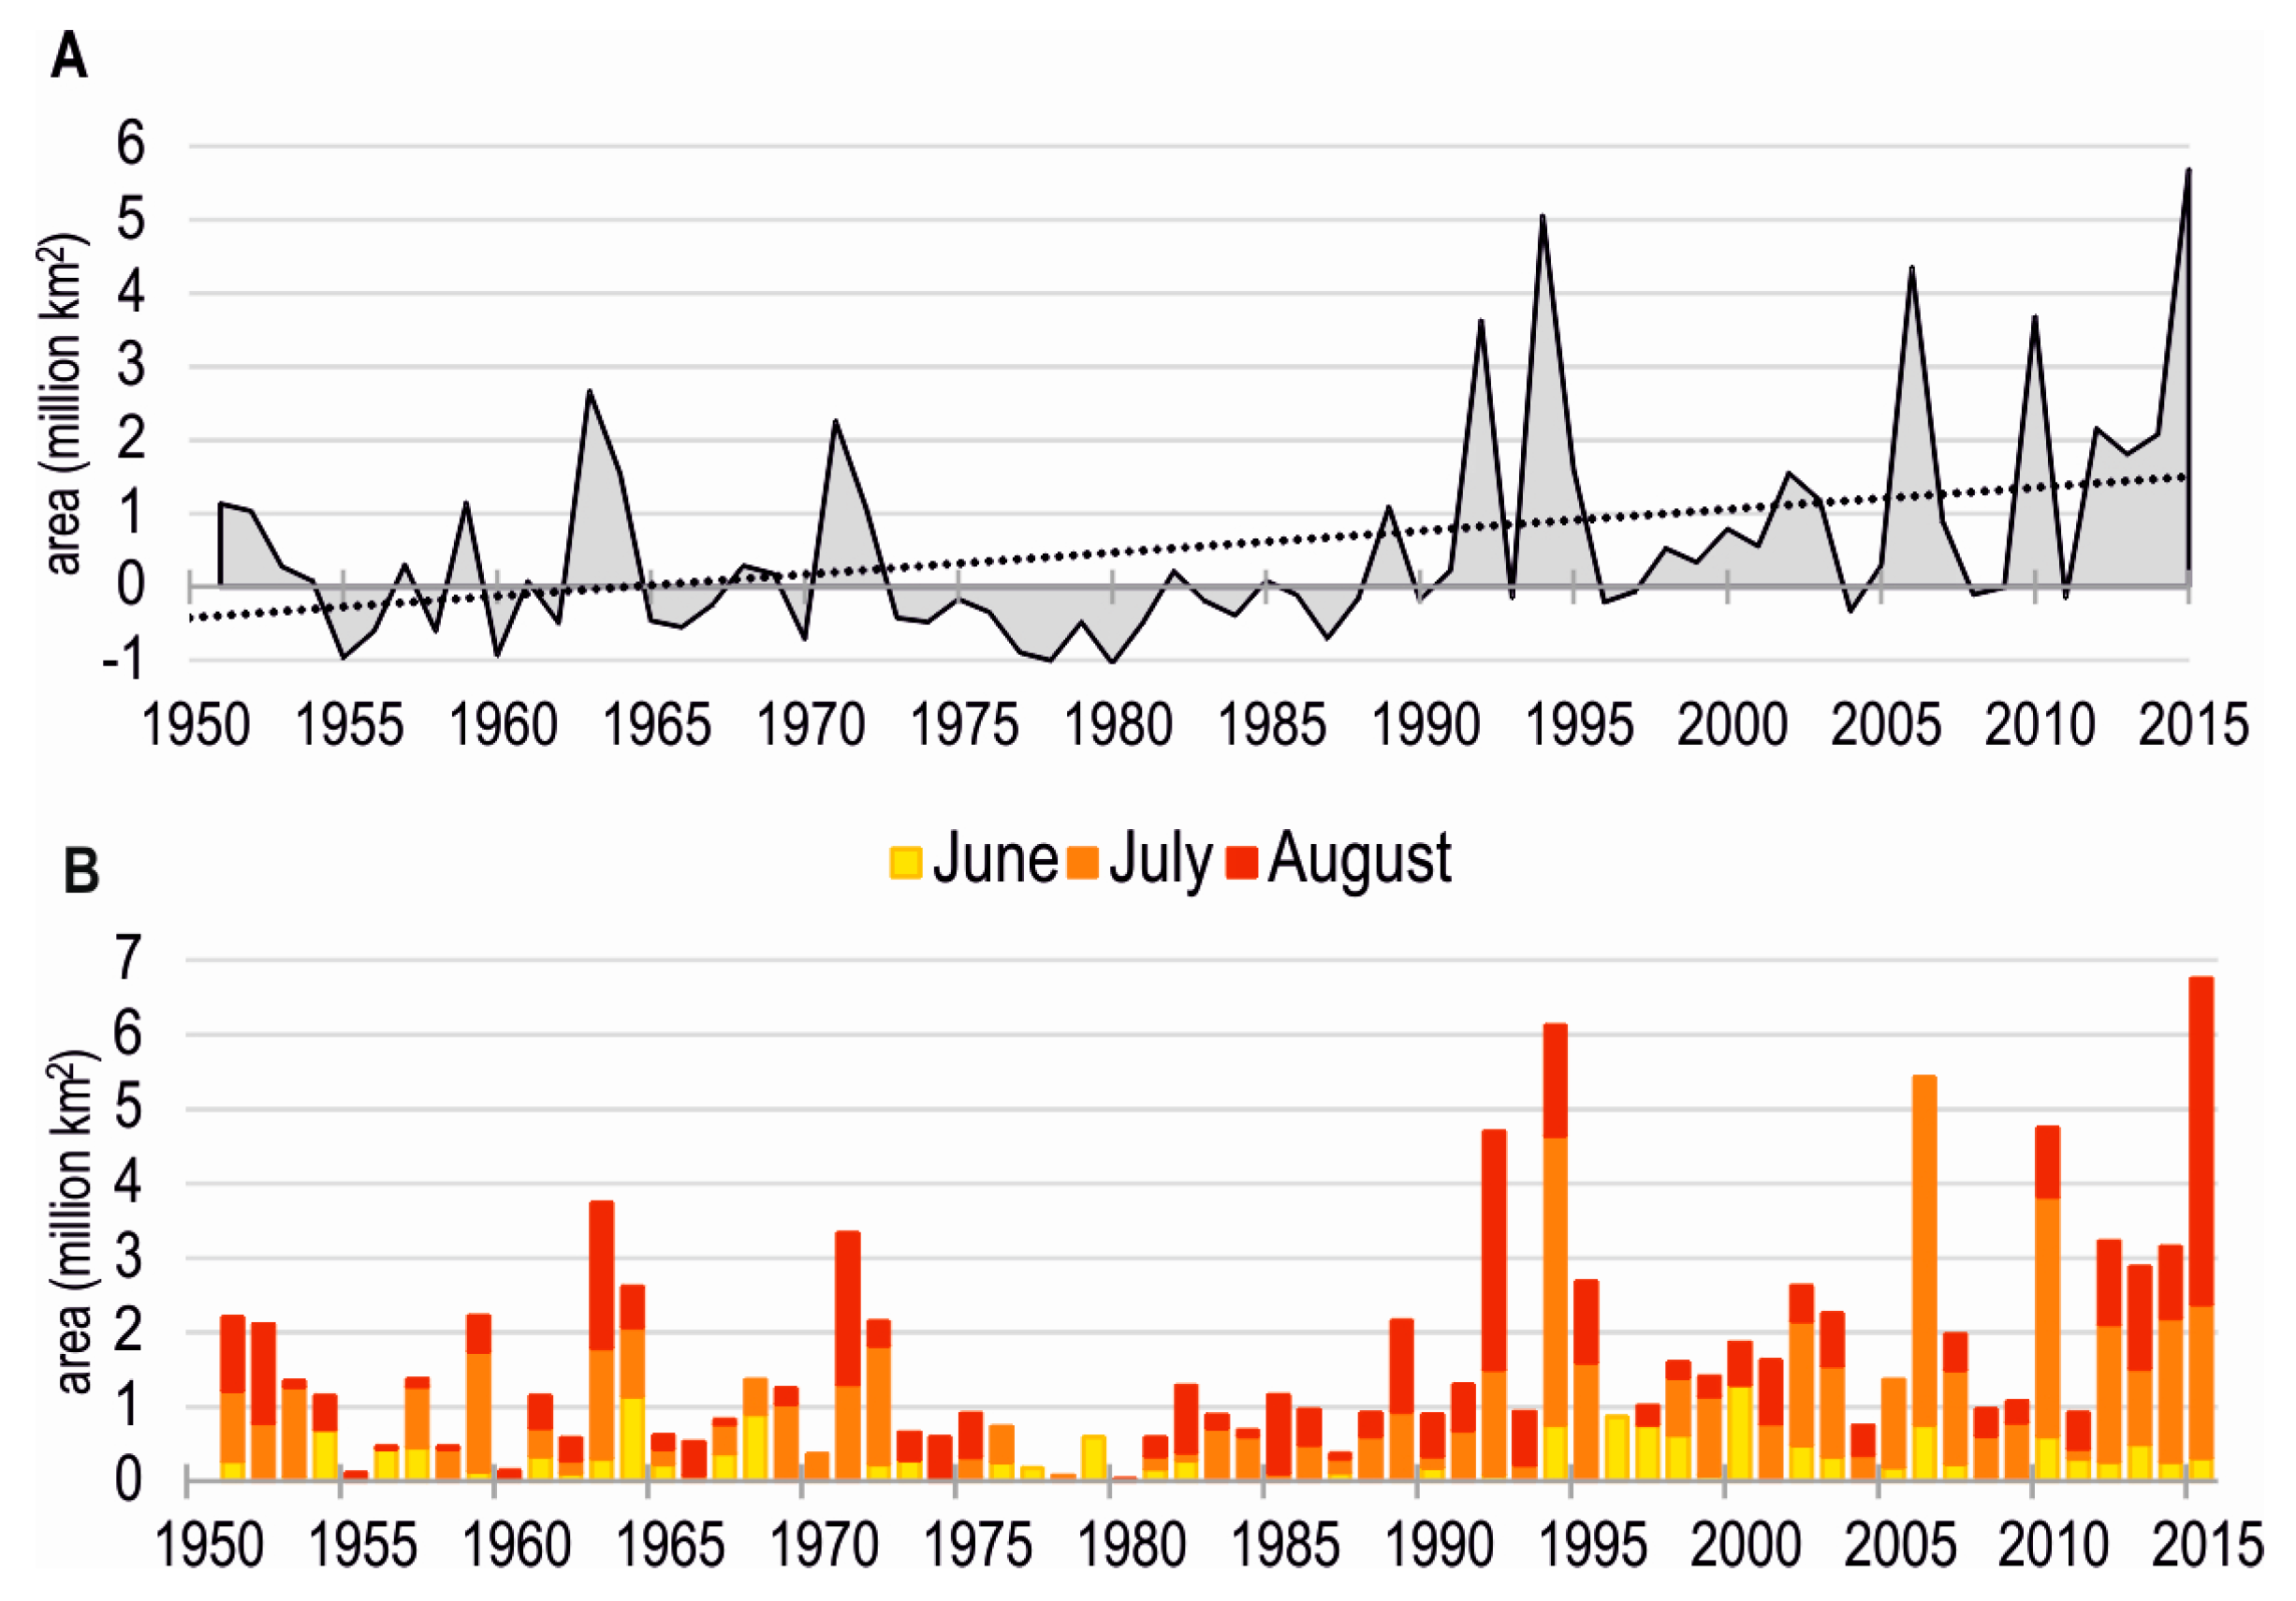
3.2. Extreme Summer Temperature Changes
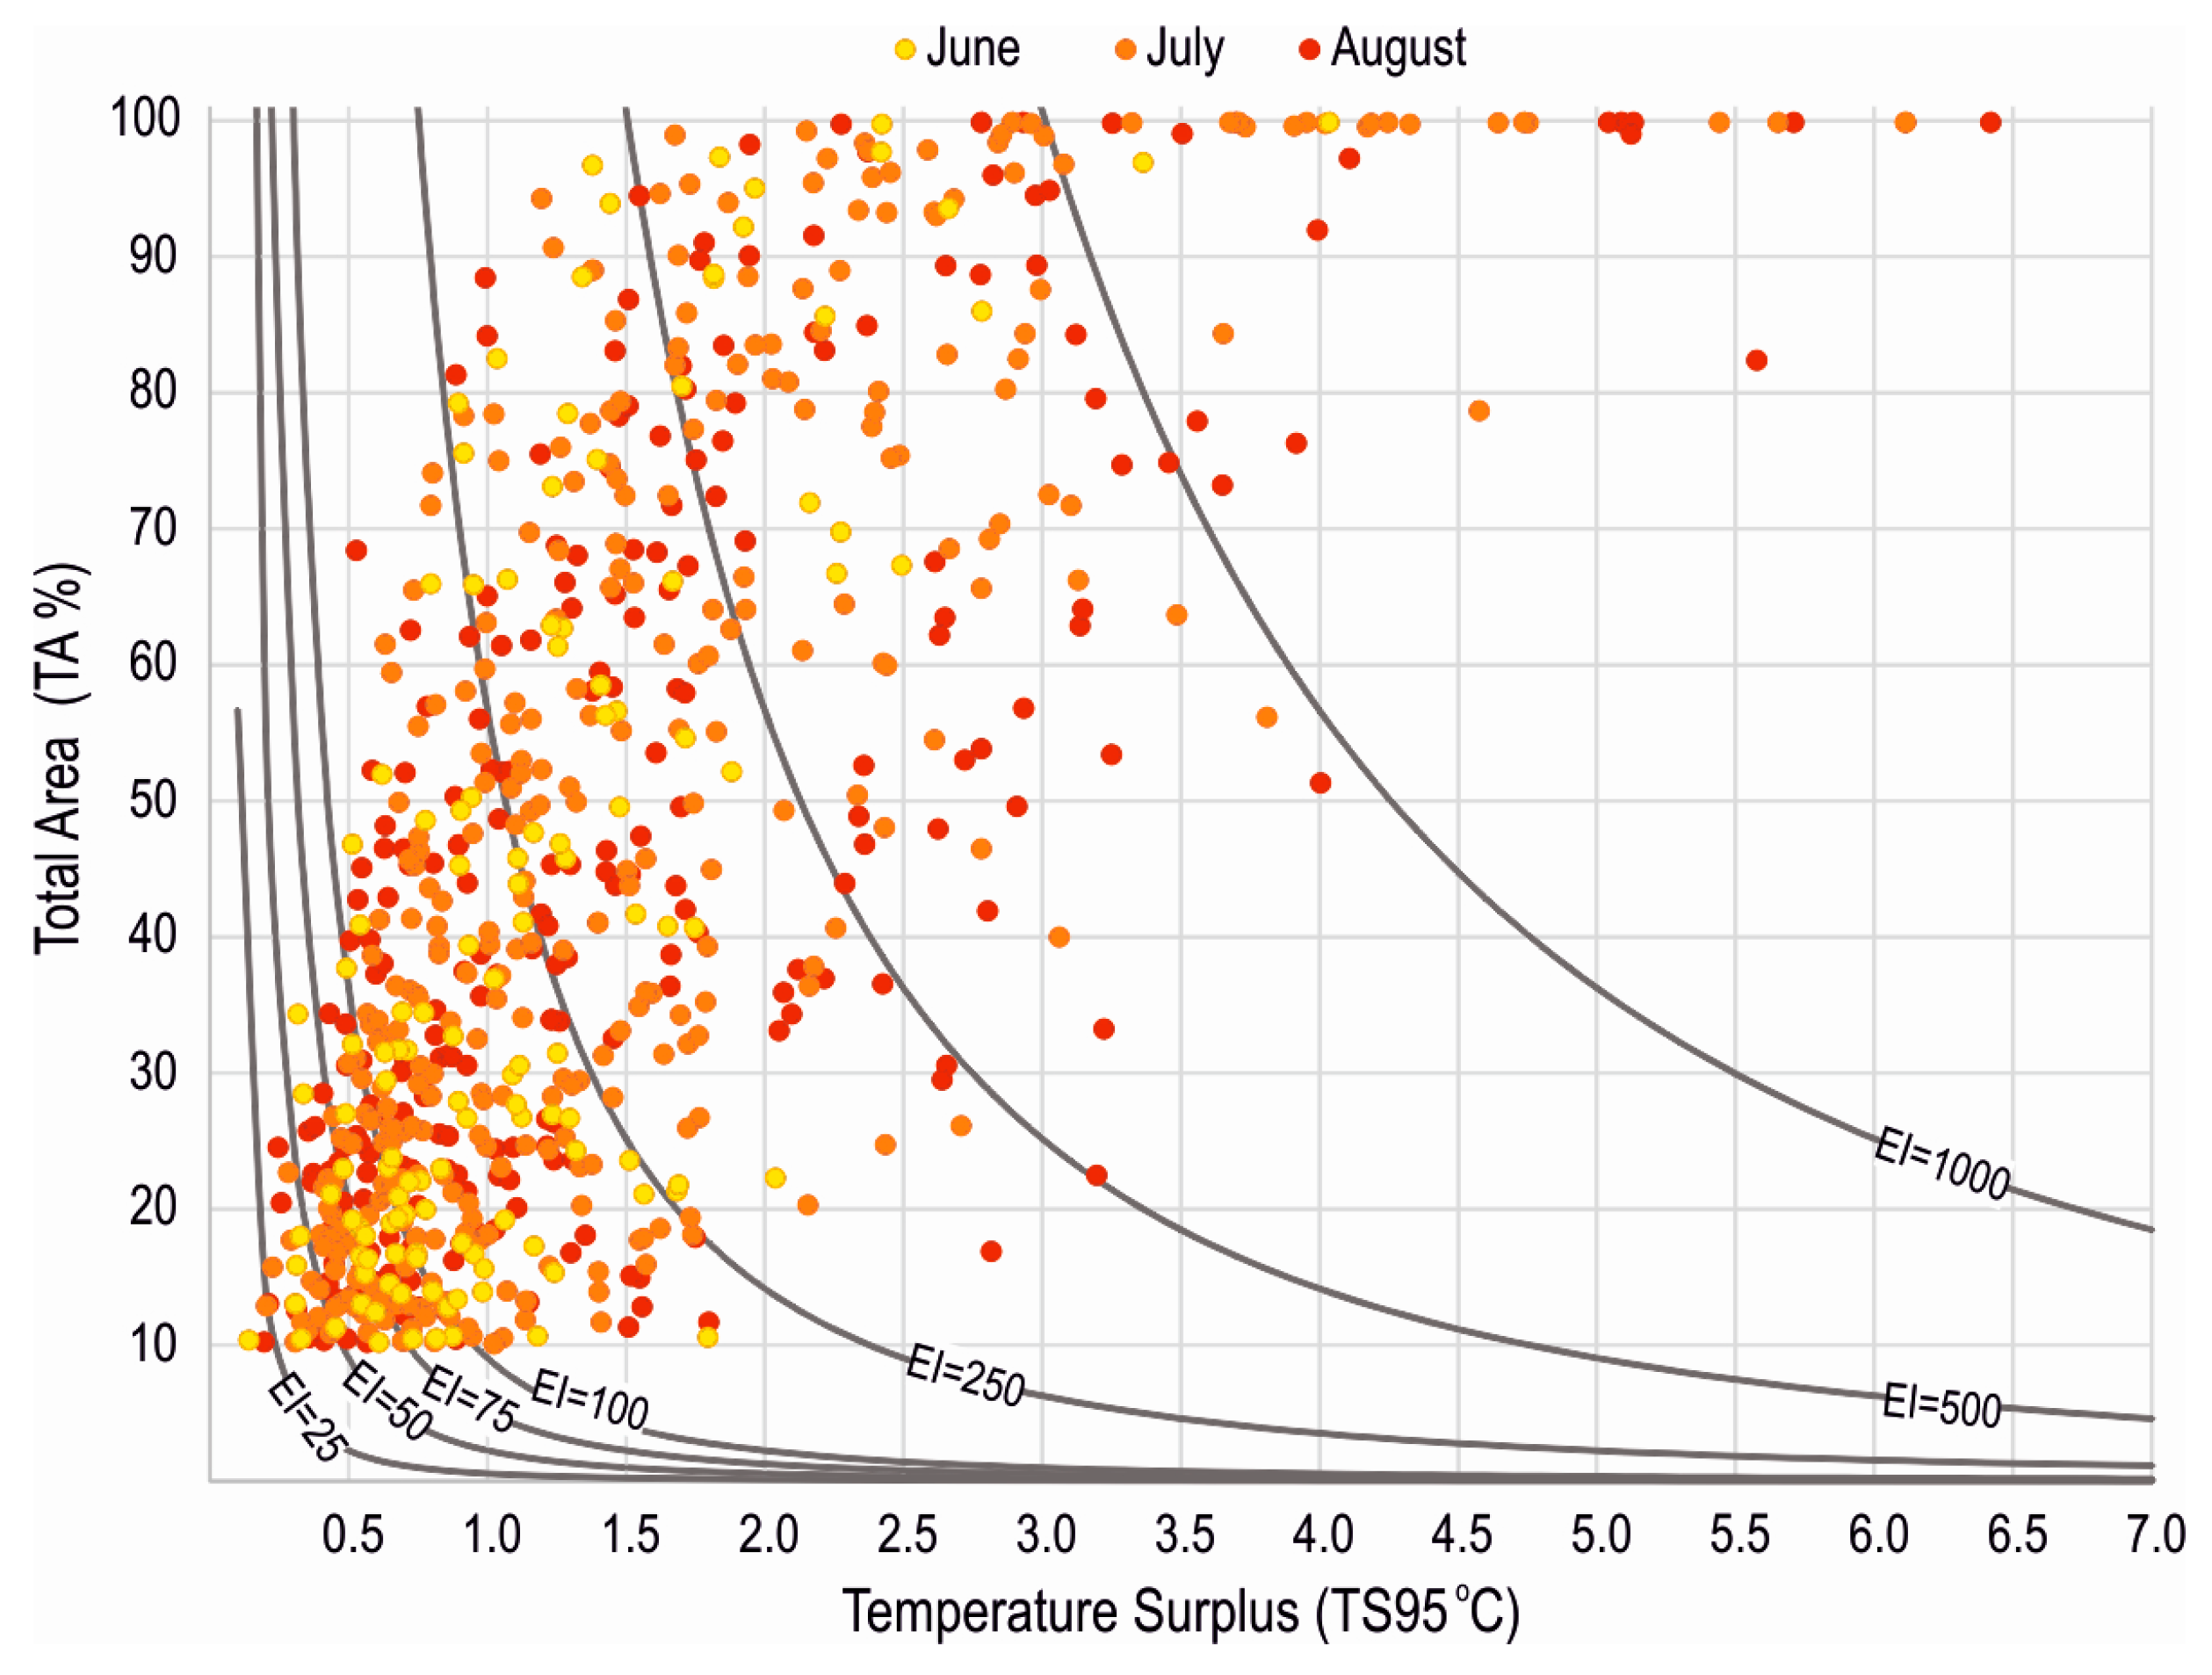
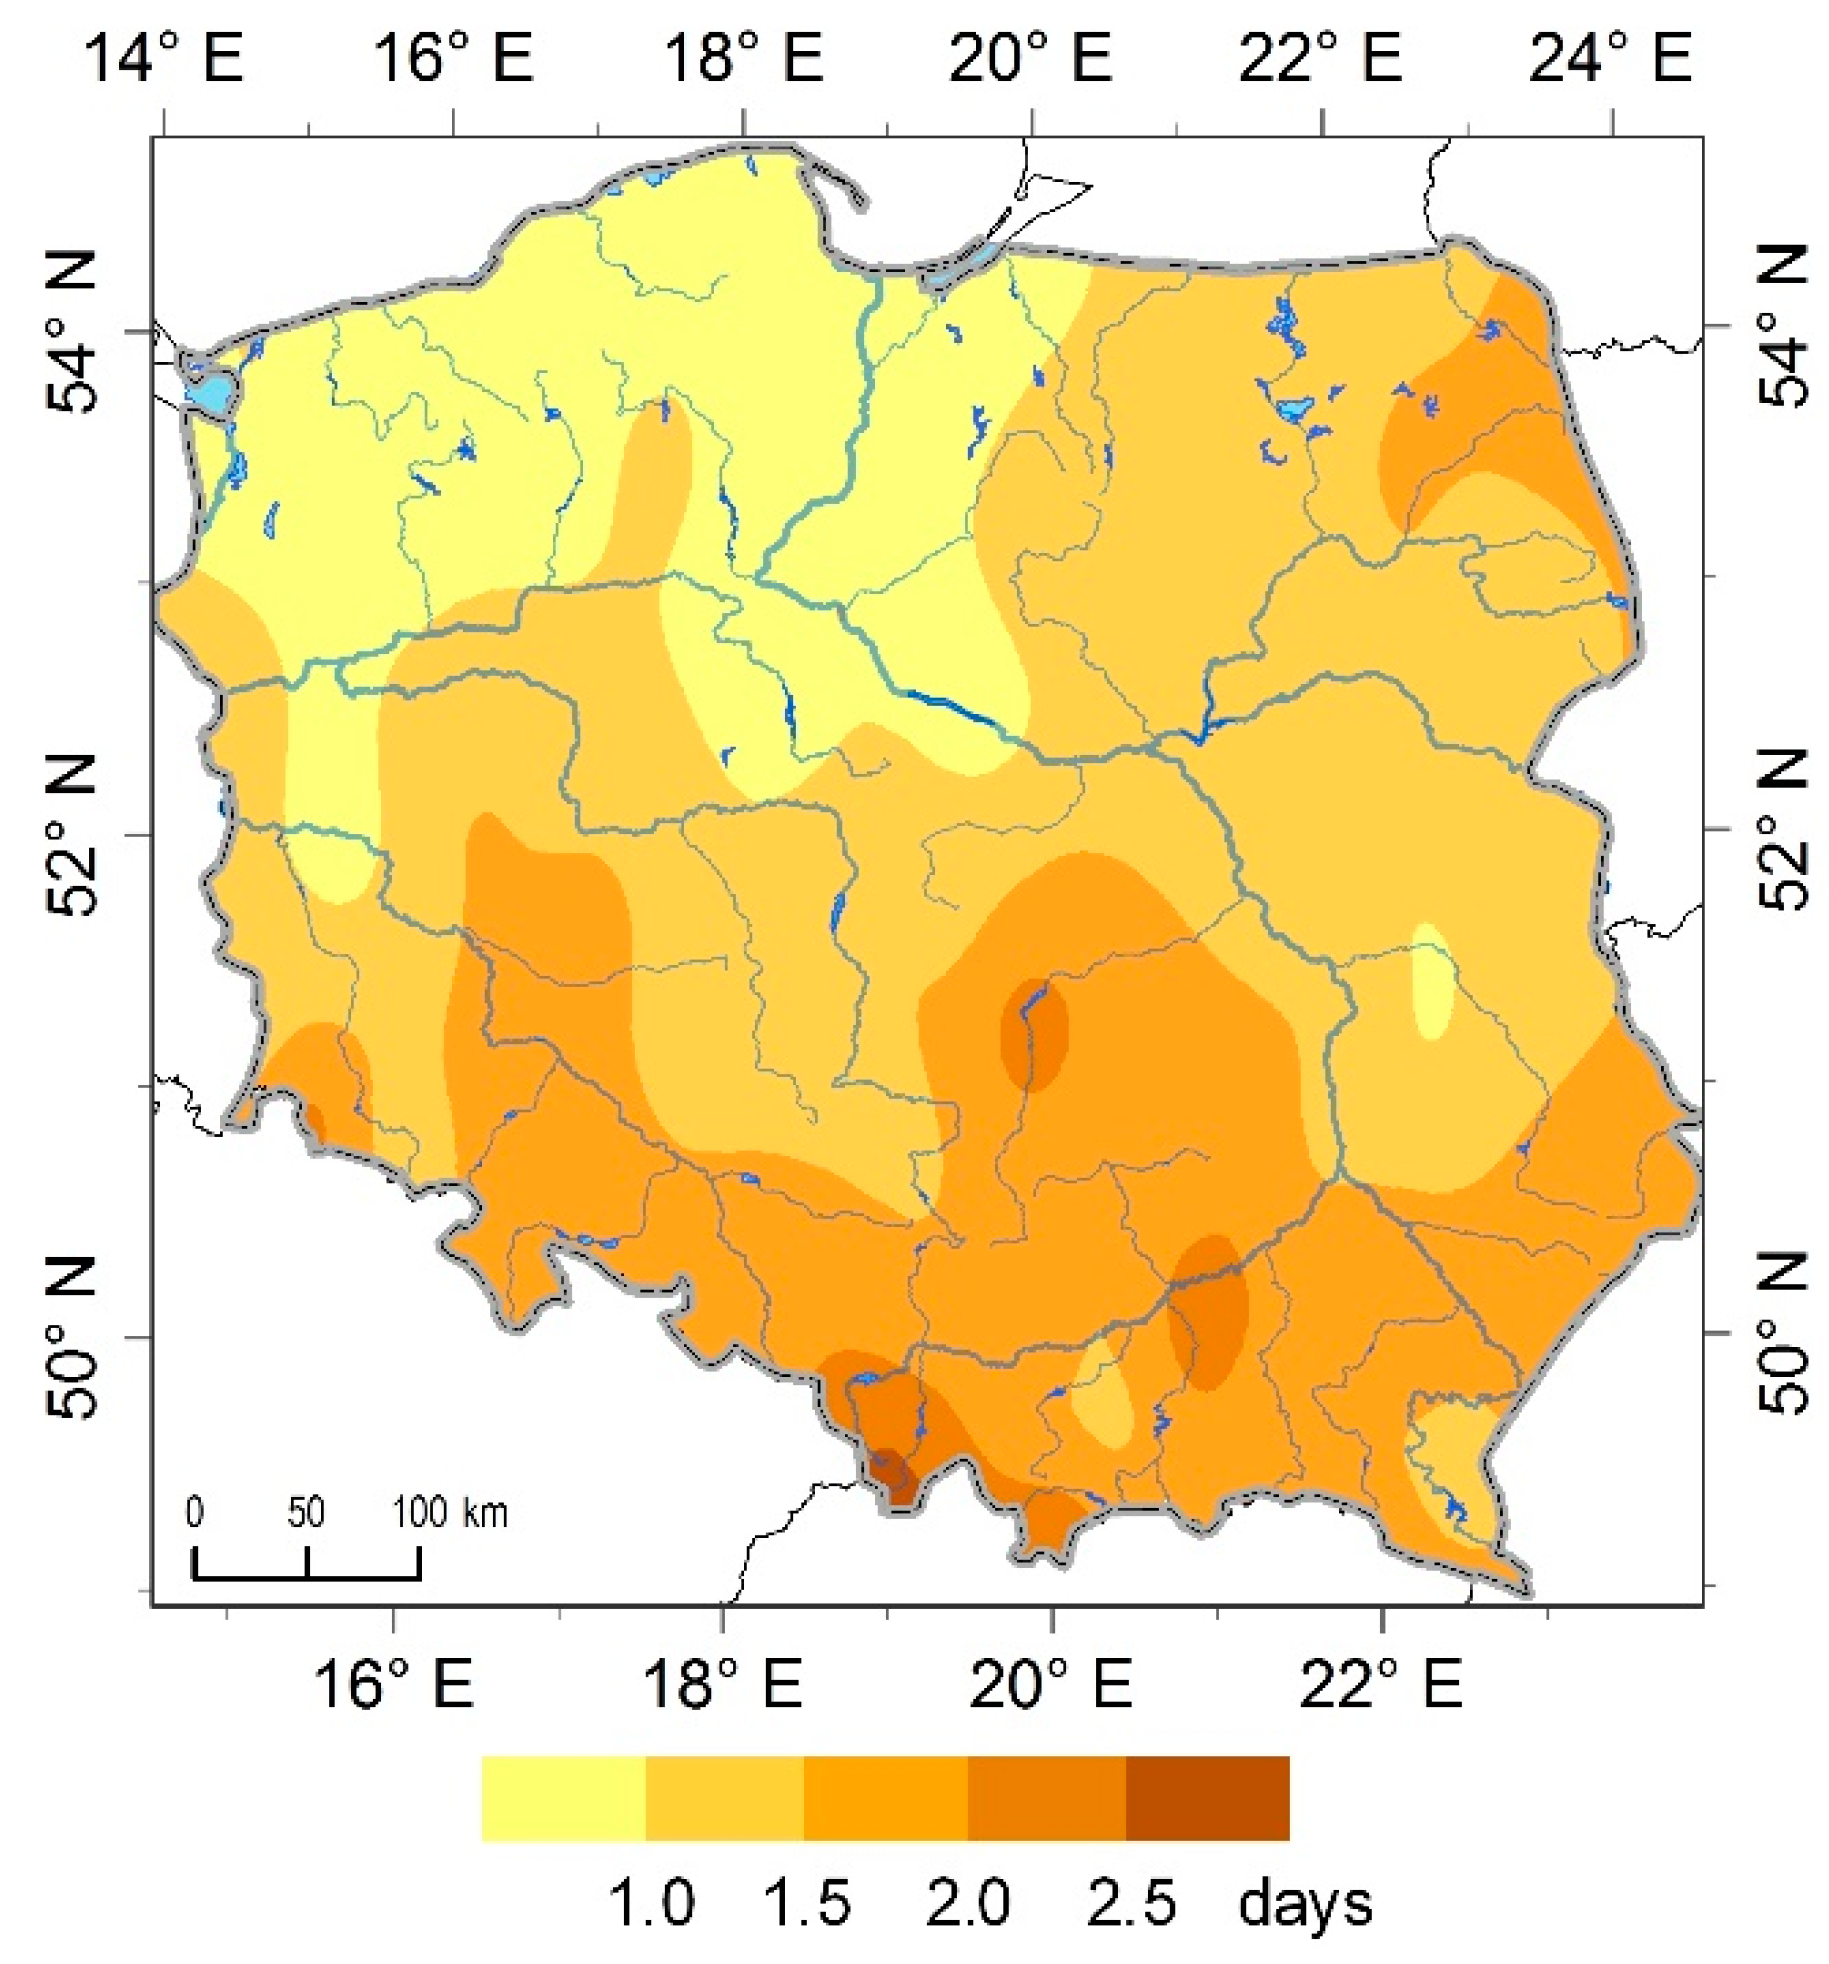
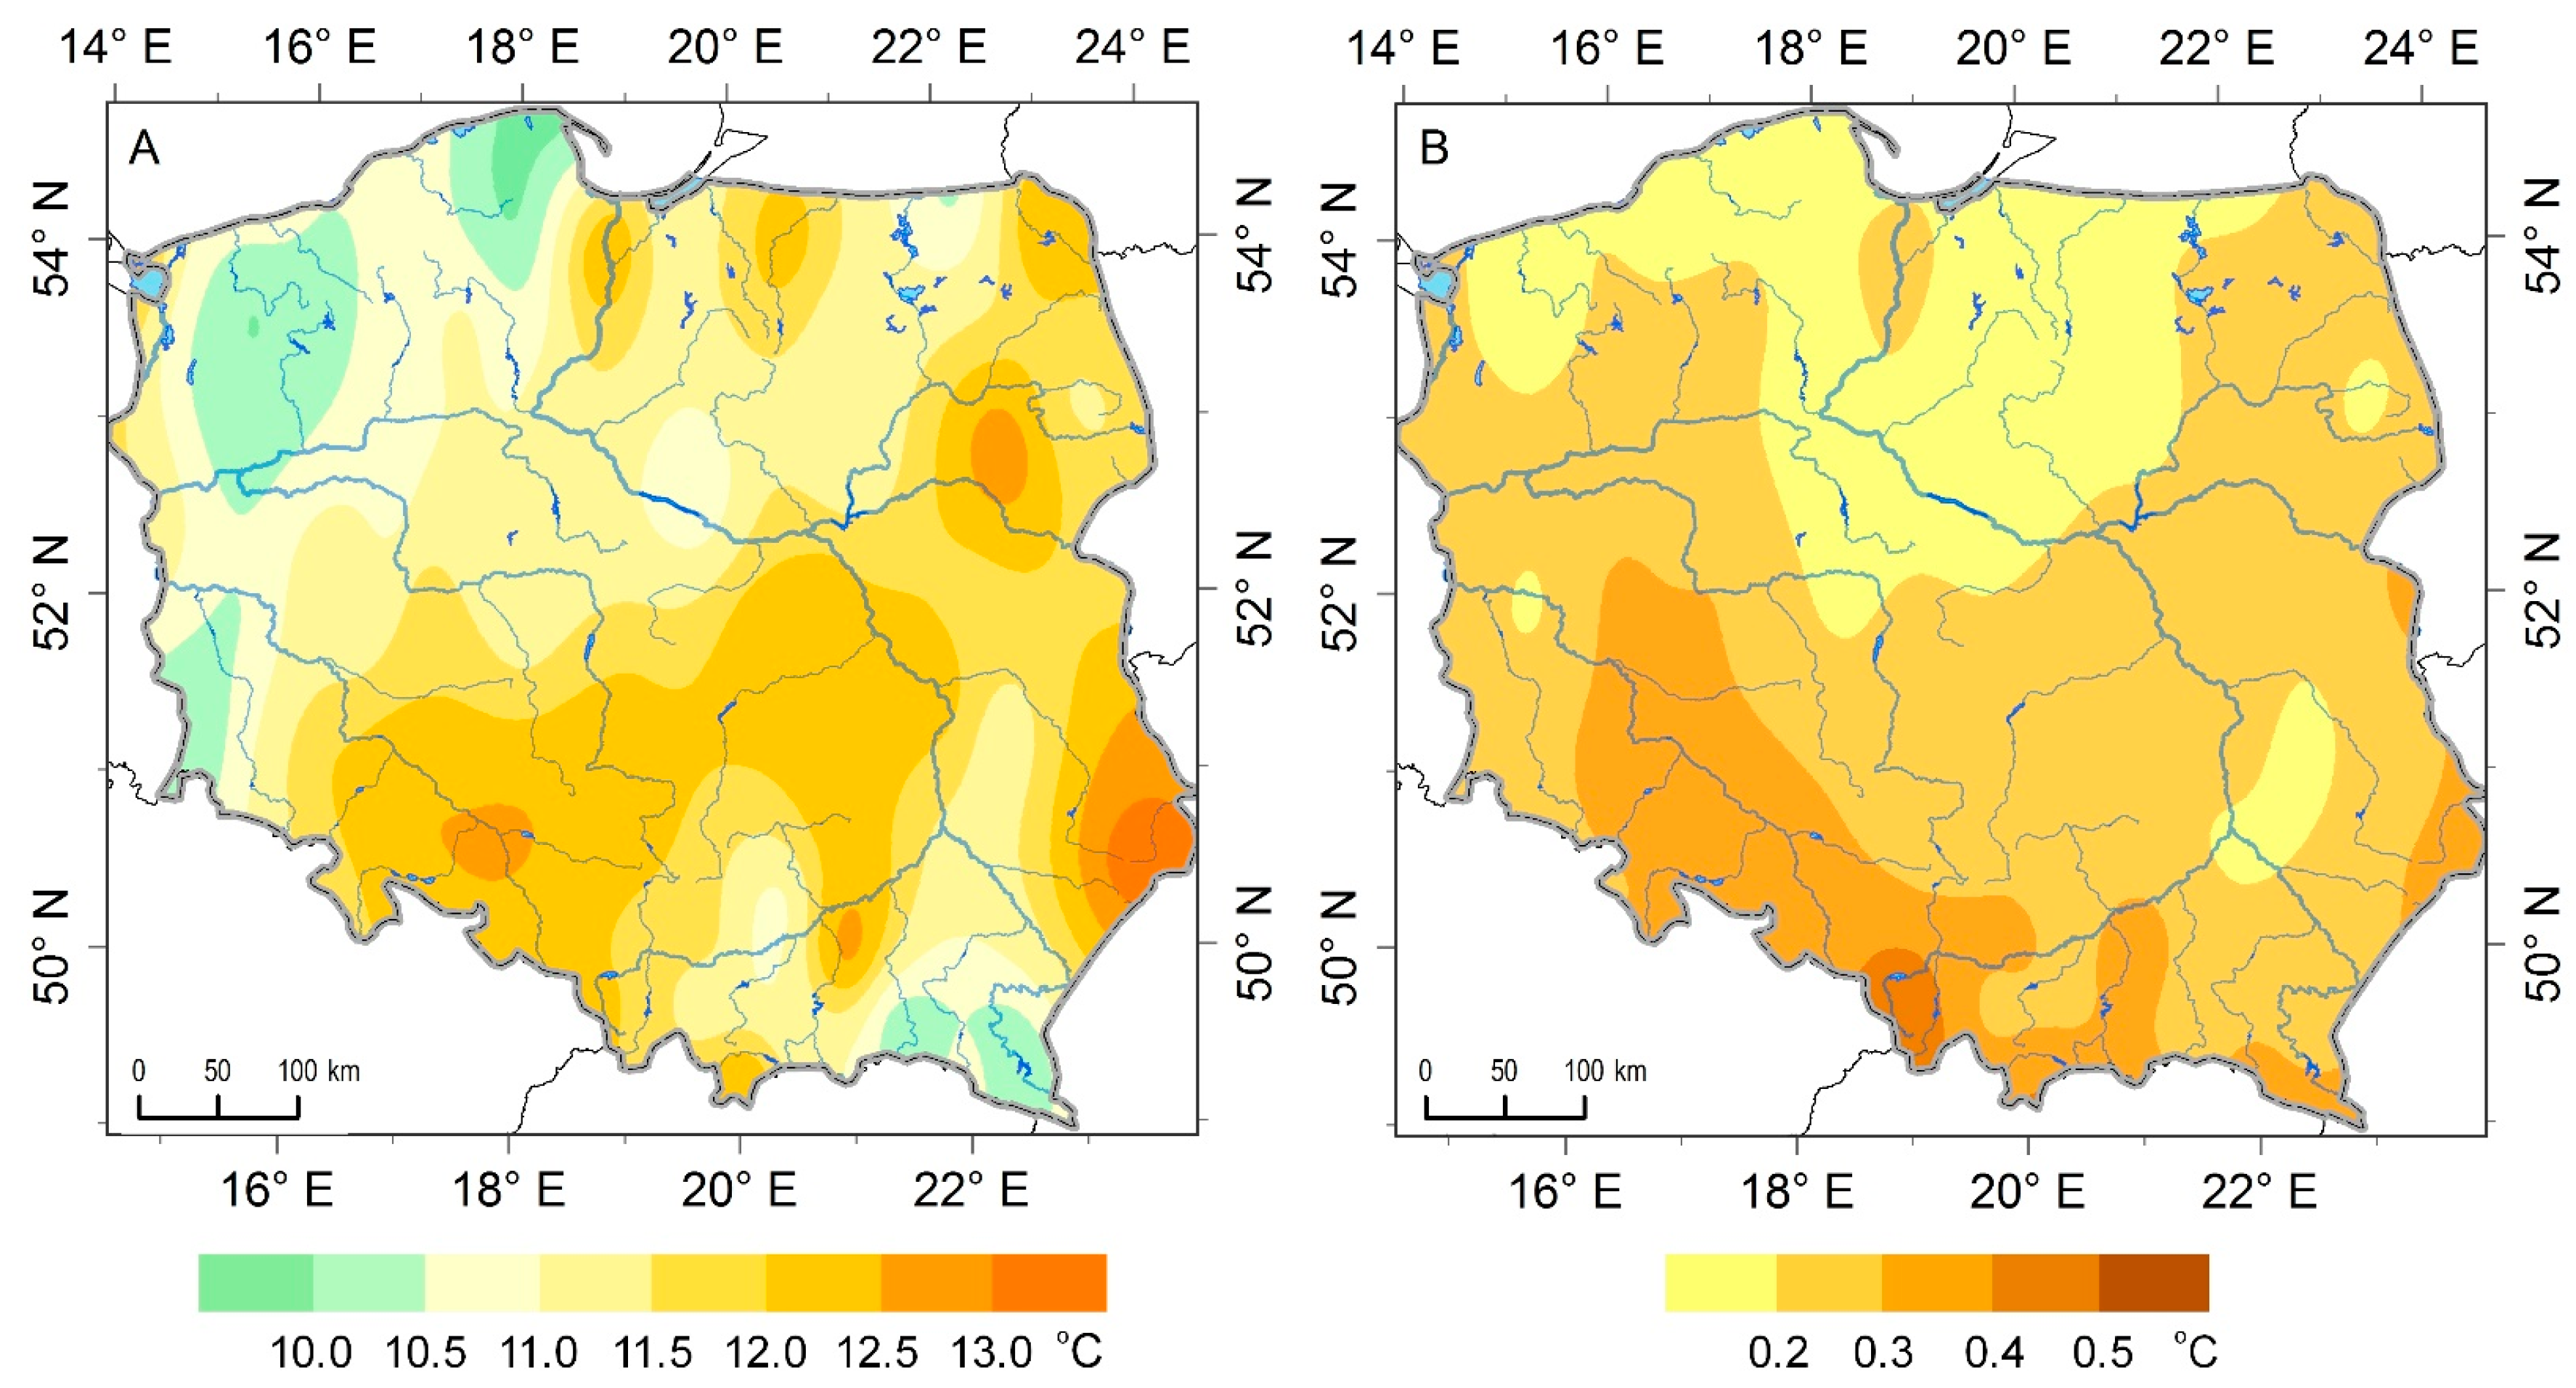
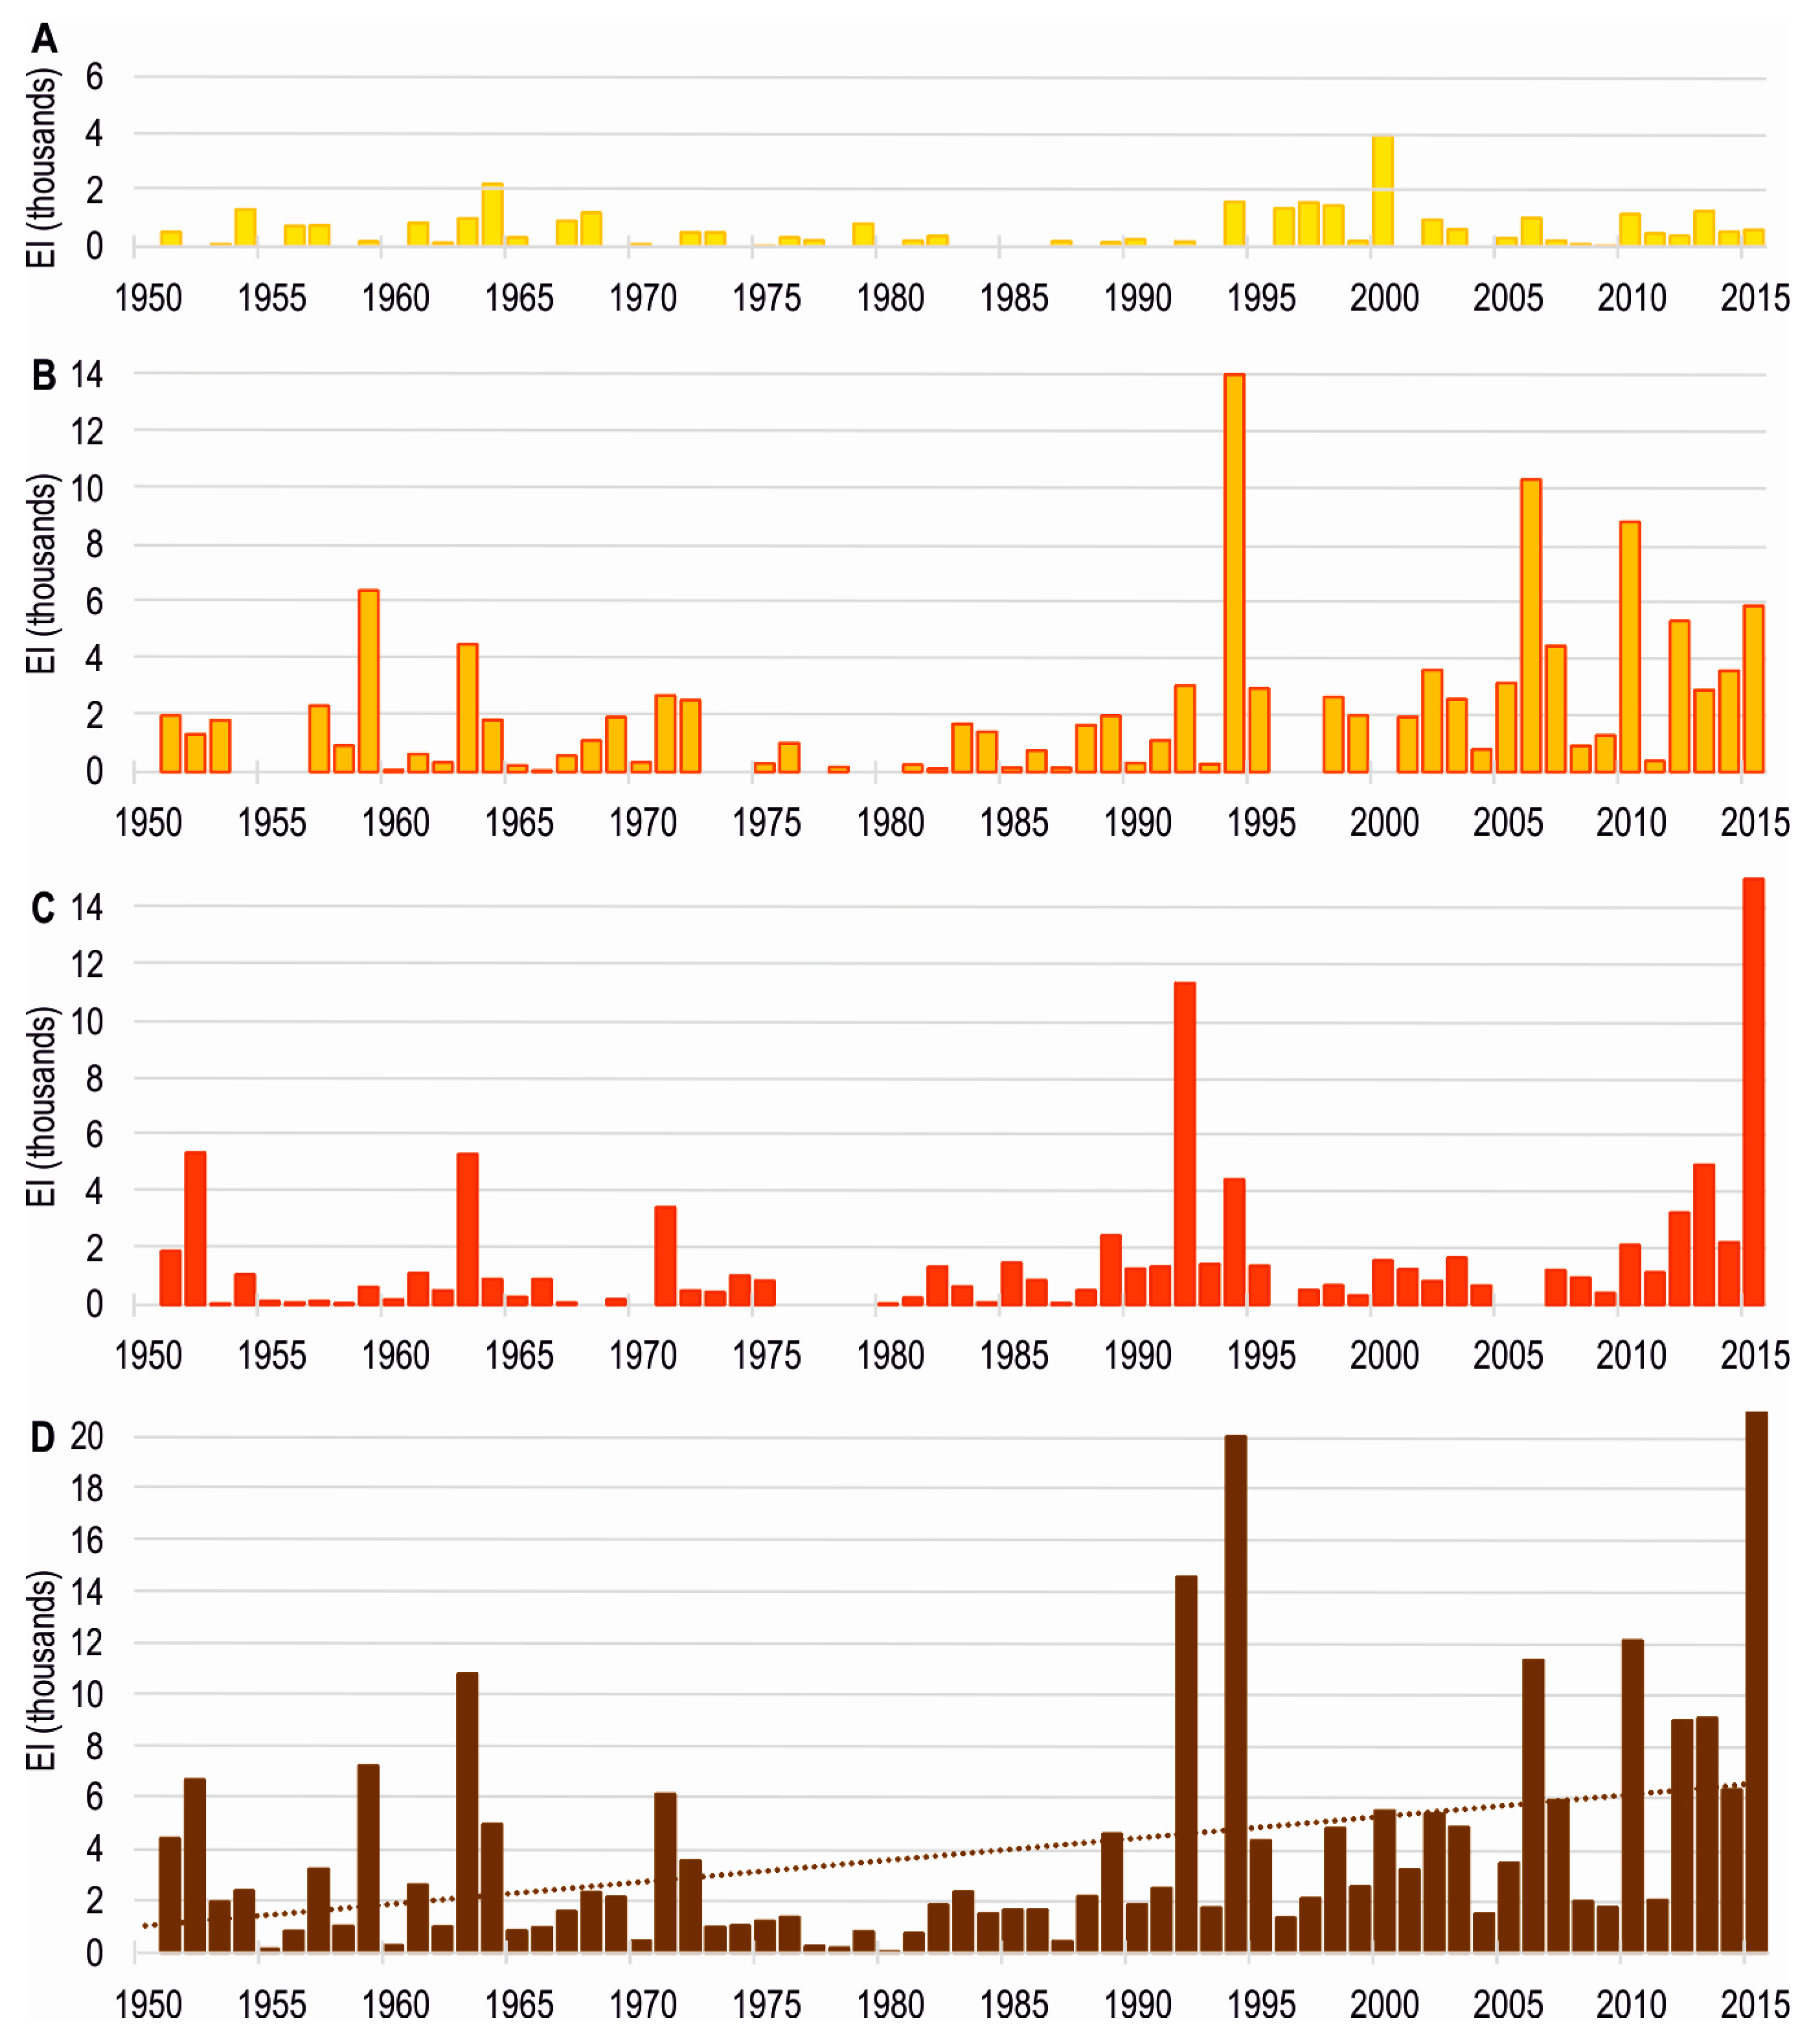
3.3. Changes in Extremeness of Maximum Summer Temperature Events
4. Conclusions
Acknowledgments
Author Contributions
Conflicts of Interest
References
- Hartmann, D.L.; Klein Tank, A.M.G.; Rusticucci, M.; Alexander, L.V.; Brönnimann, S.; Charabi, Y.; Dentener, F.J.; Dlugokencky, E.J.; Easterling, D.R.; Kaplan, A.; et al. Observations: Atmosphere and Surface. In Climate Change 2013: The Physical Science Basis. Contribution of Working Group I to the Fifth Assessment Report of the Intergovernmental Panel on Climate Change, 1st ed.; Stocker, T.F., Qin, D., Plattner, G.-K., Tignor, M., Allen, S.K., Boschung, J., Nauels, A., Xia, Y., Bex, V., Midgley, P.M., Eds.; Cambridge University Press: Cambridge, UK; New York, NY, USA, 2013; pp. 159–254. [Google Scholar]
- Giorgi, F. Climate change hot-spots. Geophys. Res. Lett. 2006, 33. [Google Scholar] [CrossRef]
- Beniston, M.; Stephenson, D.B.; Christensen, O.B.; Ferro, C.A.T.; Frei, C.; Goyette, S.; Halsnaes, K.; Holt, T.; Jylhä, K.; Koffi, B.; et al. Future extreme events in European climate: An exploration of regional climate model projections. Clim. Chang. 2007, 81, 71–95. [Google Scholar] [CrossRef]
- Ballester, J.; Rodó, X.; Giorgi, F. Future changes in Central Europe heat waves expected to mostly follow summer mean warming. Clim. Dyn. 2010, 35, 1191–1205. [Google Scholar] [CrossRef]
- Russo, S.; Sillmann, J.; Fischer, E.M. Top ten European heatwaves since 1950 and their occurrence in the coming decades. Environ. Res. Lett. 2015, 10, 124003. [Google Scholar]
- Della-Marta, P.M.; Haylock, M.R.; Luterbacher, J.; Wanner, H. Doubled length of western European summer heat waves since 1880. J. Geophys. Res. 2007, 112, D15103. [Google Scholar] [CrossRef]
- Twardosz, R.; Kossowska-Cezak, U. Exceptionally hot summers in central and eastern Europe (1951–2010). Theor. Appl. Climatol. 2013, 112, 617–628. [Google Scholar] [CrossRef]
- Tomczyk, A.M.; Bednorz, E. Heat waves in Central Europe and their circulation conditions. Int. J. Climatol. 2016, 36, 770–782. [Google Scholar] [CrossRef]
- Meehl, G.A.; Tebaldi, C. More intense, more frequent, and longer lasting heat waves in the 21st century. Science 2004, 305, 994–997. [Google Scholar] [CrossRef] [PubMed]
- Fischer, E.M.; Schär, C. Consistent geographical patterns of changes in high-impact European heatwaves. Nat. Geosci. 2010, 3, 398–403. [Google Scholar] [CrossRef]
- Fischer, E.M.; Rajczak, J.; Schär, C. Changes in European summer temperature variability revisited. Environ. Res. Lett. 2012, 39, L19702. [Google Scholar] [CrossRef]
- Christensen, J.H.; Krishna Kumar, K.; Aldrian, F.; An, S.-I.; Cavalcanti, I.F.A.; de Castro, M.; Dong, W.; Goswami, P.; Hall, A.; Kanyanga, J.K.; et al. Climate Phenomena and their Relevance for Future Regional Climate Change. In Climate Change 2013: The Physical Science Basis. Contribution of Working Group I to the Fifth Assessment Report of the Intergovernmental Panel on Climate Change, 1st ed.; Stocker, T.F., Qin, D., Plattner, G.-K., Tignor, M., Allen, S.K., Boschung, J., Nauels, A., Xia, Y., Bex, V., Midgley, P.M., Eds.; Cambridge University Press: Cambridge, UK; New York, NY, USA, 2003; pp. 1217–1308. [Google Scholar]
- Jaagus, J.; Briede, A.; Rimkus, E.; Remm, K. Variability and trends in daily minimum and maximum temperatures and in the diurnal temperature range in Lithuania, Latvia and Estonia in 1951–2010. Theor. Appl. Climatol. 2014, 118, 57–68. [Google Scholar] [CrossRef]
- Brázdil, R.; Budikova, M.; Auer, I.; Bőhm, R.; Cegnar, T.; Faško, P.; Lapin, P.; Gajic-Čapka, M.; Zaninovic, K.; Koleva, E.; et al. Trends of maximum and minimum daily temperatures in Central and Southeastern Europe. Int. J. Climatol. 1996, 16, 765–782. [Google Scholar] [CrossRef]
- Kürbis, K.; Mudelsee, M.; Tetzlaff, G.; Brázdil, R. Trends in extremesof temperature, dew point, and precipitation from long instrumental series from Central Europe. Theor. Appl. Climatol. 2009, 98, 187–195. [Google Scholar] [CrossRef]
- Kyselý, J. Recent severe heat waves in central Europe: How to view them in a long-term prospect? Int. J. Climatol. 2010, 30, 89–109. [Google Scholar] [CrossRef]
- Shevchenko, O.; Lee, H.; Snizhko, S.; Mayer, H. Long-term analysis of heat waves in Ukraine. Int. J. Climatol. 2014, 34, 1642–1650. [Google Scholar] [CrossRef]
- Della-Marta, P.M.; Luterbacher, J.; Weissenfluh, H.; Xoplaki, E.; Brunet, M.; Wanner, H. Summer heat waves over western Europe 1880–2003, their relationship to large-scale forcings and predictability. Clim. Dyn. 2007, 29, 251–275. [Google Scholar] [CrossRef]
- El Kenawy, A.; López-Moreno, J.I.; Vicente-Serrano, S.M. Summer temperature extremes in northeastern Spain: Spatial regionalization and links to atmospheric circulation (1960–2006). Theor. Appl. Climatol. 2013, 113, 387–405. [Google Scholar] [CrossRef]
- Deniz, Z.A.; Gönençgil, B. Trends of summer daily maximum temperature extremes in Turkey. Phys. Geogr. 2015, 36, 268–281. [Google Scholar] [CrossRef]
- Luterbacher, J.; Dietrich, D.; Xoplaki, E.; Grosjean, M.; Wanner, H. European seasonal and annual temperature variability, trends, and extremes since 1500. Science 2004, 303, 1499–1503. [Google Scholar] [CrossRef] [PubMed]
- Schär, C.; Vidale, P.L.; Lühti, D.; Frei, C.; Häberli, C.; Liniger, M.A.; Appenzeller, C. The role of increasing temperature variability in European summer heatwaves. Nature 2004, 427, 332–336. [Google Scholar]
- Barriopedro, D.; Fischer, E.M.; Luterbacher, J.; Trigo, R.M.; García-Herrera, R. The hot summer of 2010: Redrawing the temperature record map of Europe. Science 2011, 332, 220–224. [Google Scholar] [CrossRef] [PubMed]
- Dole, R.; Hoerling, M.; Perlwitz, J.; Eischeid, J.; Pegion, P.; Zhang, T.; Quan, X.-W.; Xu, T.; Murray, D. Was there a basis for anticipating the 2010 Russian heat wave? Geophys. Res. Lett. 2011, 38, L06702. [Google Scholar] [CrossRef]
- Ustrnul, Z.; Czekierda, D.; Wypych, A. Extreme values of air temperature in Poland according to different atmospheric circulation classifications. Phys. Chem. Earth 2010, 35, 429–436. [Google Scholar] [CrossRef]
- Lhotka, O.; Kyselý, J. Characterizing joint effects of spatial extent, temperature magnitude and duration of heat waves and cold spells over Central Europe. Int. J. Climatol. 2015, 35, 1232–1244. [Google Scholar] [CrossRef]
- Hoy, A.; Hänsel, S.; Skalak, P.; Ustrnul, Z.; Bochníček, O. The extreme European summer of 2015 in a long-term perspective. Int. J. Climatol. 2016. [Google Scholar] [CrossRef]
- Ustrnul, Z.; Wypych, A.; Kosowski, M. Extreme temperatures and precipitation in Poland—An evaluation attempt. Meteorol. Z. 2012, 21, 37–47. [Google Scholar] [CrossRef]
- Wibig, J.; Głowicki, B. Trends of minimum and maximum temperature in Poland. Clim. Res. 2002, 20, 123–133. [Google Scholar] [CrossRef]
- Kejna, M.; Araźny, A.; Maszewski, R.; Przybylak, R.; Uscka-Kowalkowska, J.; Vizi, Z. Daily minimum and maximum air temperature in Poland in the years 1951–2005. Bull. Geogr. 2009, 2, 35–56. [Google Scholar]
- Szczepanek, R. Extreme daily air temperatures in Poland (2000–2013). Infrastruktura i Ekologia Terenów Wiejskich 2014, 4, 1487–1498. [Google Scholar]
- Wypych, A.; Sulikowska, A.; Ustrnul, Z.; Czekierda, D. Variability of growing degree days in Poland in response to ongoing climate changes in Europe. Int. J. Biometeorol. 2017, 61, 49–59. [Google Scholar] [CrossRef] [PubMed]
- Graczyk, D.; Pińskwar, I.; Kundzewicz, Z.W.; Hov, Ø.; Førland, E.J.; Szwed, M.; Choryński, A. The heat goes on—Changes in indices of hot extremes in Poland. Theor. Appl. Climatol. 2016. [Google Scholar] [CrossRef]
- Klein Tank, A.M.G.; Zwiers, F.W.; Zhang, X. Guidelines on Analysis of Extremes in a Changing Climate. Available online: http://www.wmo.int/pages/prog/wcp/wcdmp/wcdmp_series/documents/WCDMP_72_TD_1500_en_1.pdf (accessed on 20 April 2016).
- Brönnimann, S.; Luterbacher, J.; Ewen, T.; Diaz, H.F.; Stolarski, R.S.; Neu, U. (Eds.) Climate Variability and Extremes during the Past 100 Years; Springer: Dordrecht, The Netherlands, 2008; pp. 1–353.
- World Meteorological Organization. Guide to Climatological Practices, WMO No. 100, 3rd ed. Available online: http://www.wmo.int/pages/prog/wcp/ccl/guide/documents/WMO_100_en.pdf (accessed on 10 September 2016).
- Brunet, M.; Saladié, O.; Jones, P.; Sigró, J.; Aguilar, E.; Moberg, A.; Lister, D.; Walther, A.; Almarza, C. A Case Study/Guidance on the Development of Long-Term Daily Adjusted Temperature Datasets. Available online: http://www.wmo.int/pages/prog/wcp/wcdmp/wcdmp_series/documents/WCDMP_Spain_case_study-cor_ver6March.pdf (accessed on 20 April 2016).
- Dobesch, H.; Dumolard, P.; Dyras, I. (Eds.) Spatial Interpolation for Climate Data: The Use of GIS in Climatology and Meteorology; Wiley-ISTE: London, UK, 2007; pp. 1–284.
- Lindner, M.; Maroschek, M.; Netherer, S.; Kremer, A.; Barbati, A.; Garcia-Gonzalo, J.; Seidl, R.; Delzon, S.; Corona, P.; Kolström, M.; et al. Climate change impacts, adaptive capacity, and vulnerability of European forest ecosystems. Forest Ecol. Manag. 2010, 259, 698–709. [Google Scholar] [CrossRef]
- Kohler, T.; Wehrli, A.; Jurek, M. (Eds.) Mountains and climate change: A global concern. Sustainable Mountain Development Series; Centre for Development and Environment (CDE), Swiss Agency for Development and Cooperation (SDC) and Geographica Bernensia: Bern, Switzerland, 2014; p. 136.
- Von Storch, H.; Zwiers, R.W. Statistical Analysis Climate Research; Cambridge University Press: Cambridge, UK, 2003; p. 484. [Google Scholar]
- Müller, M.; Kašpar, M. Event-adjusted evaluation of weather and climate extremes. Nat. Hazards Earth Syst. Sci. 2014, 14, 473–483. [Google Scholar] [CrossRef]
- Christidis, N.; Gareth, S.J.; Stott, P.A. Dramatically increasing chance of extremely hot summers since the 2003 European heatwave. Nat. Clim. Chang. 2015, 5, 46–50. [Google Scholar] [CrossRef]
- Wypych, A.; Ustrnul, Z.; Sulikowska, A.; Chmielewski, F.-M.; Bochenek, B. Spatial and temporal variability of the frost-free season in Central Europe and its circulation background. Int. J. Climatol. 2016. [Google Scholar] [CrossRef]
- Ustrnul, Z.; Czekierda, D. Atlas of Extreme Meteorological Phenomena and Synoptic Situations in Poland; Instytut Meteorologii i Gospodarki Wodnej: Warszawa, Poland, 2009; p. 182. [Google Scholar]
- Ustrnul, Z.; Wypych, A.; Henek, E.; Czekierda, D.; Walawender, J.; Kubacka, D.; Pyrc, R.; Czernecki, B. Meteorological hazard atlas of Poland; Instytut Meteorologii i Gospodarki Wodnej & Wydawnictwo Attyka: Warszawa-Kraków, Poland, 2014; p. 162. [Google Scholar]
- Beniston, M. Mountain Climates and Climatic Change: An Overview of Processes Focusing on the European Alps. Pure Appl. Geophys. 2005, 62, 1587–1606. [Google Scholar] [CrossRef]
- Wibig, J.; Jaczewski, A.; Brzóska, B.; Konca-Kędzierska, K.; Pianko-Kluczyńska, K. How does the areal averaging infuence the extremes? The context of gridded observation data sets. Meteorol. Z. 2014, 23, 181–187. [Google Scholar]
- Rangwala, I.; Miller, J.R. Climate change in mountains: a review of elevation-dependent warming and its possible causes. Clim. Chang. 2012, 114, 527–547. [Google Scholar] [CrossRef]
- Wypych, A. Variability of the European Climate on the Basis of Differentiation of Indicators of Continentalism. In Polish Climate in the European Context, 1st ed.; Przybylak, R., Majorowicz, J., Brazdil, R., Kejna, M., Eds.; Springer-Verlag: Berlin, Germany, 2010; pp. 473–484. [Google Scholar]
- Kyselý, J. Temporal fluctuations in heat waves at Prague–Klementinum, the Czech Republic, from 1901–1997 and their relationships to atmospheric circulation. Int. J. Climatol. 2002, 22, 33–50. [Google Scholar] [CrossRef]
- Stefanon, M.; D’Andrea, F.; Drobinski, P. Heatwave classification over Europe and the Mediterranean region. Environ. Res. Lett. 2012, 7, 014023. [Google Scholar] [CrossRef] [Green Version]
- Kuchcik, M.; Degórski, M. Heat- and cold-related mortality in the north-east of Poland as an example of the socio-economic effects of extreme hydrometeorological events in the Polish Lowland. Geogr. Polonica 2009, 82, 69–78. [Google Scholar] [CrossRef]
- Hlásny, T.; Trombik, J.; Dobor, L.; Barcza, Z.; Barka, I. Future climate of the Carpathians: Climate change hot-spots and implications for ecosystems. Reg. Environ. Change 2016, 16, 1495–1506. [Google Scholar] [CrossRef]


| Variable | H ≤ 500 m a.s.l. | H > 500 m a.s.l. |
|---|---|---|
| Tx (°C/10 yrs) | 0.28 | 0.52 |
| Tx95 (°C/10 yrs) 1 | 0.41 | 0.54 |
| Tx95 (days/10 yrs) | 0.77 | 1.62 |
| TS95 (°C/10 yrs) | 1.66 | 2.31 |
| TA (km2/10 yrs) | 189,500 | n.a. |
| EI (°C∙km2/10 yrs) | 489 | n.a. |
| Rank No. | June | July | August | Summer |
|---|---|---|---|---|
| 1 | 2000 | 1994 | 2015 | 2015 |
| 2 | 1964 | 2006 | 1992 | 1994 |
| 3 | 1994 | 2010 | 1952 | 1992 |
| 4 | 1997 | 1959 | 1963 | 2010 |
| 5 | 1998 | 2015 | 2013 | 2006 |
| 6 | 1996 | 2012 | 1994 | 1963 |
| 7 | 1954 | 1963 | 1971 | 2013 |
| 8 | 2013 | 2007 | 2012 | 2012 |
| 9 | 1968 | 2002 | 1989 | 1959 |
| 10 | 2010 | 2014 | 2014 | 1952 |
© 2017 by the authors. Licensee MDPI, Basel, Switzerland. This article is an open access article distributed under the terms and conditions of the Creative Commons Attribution (CC BY) license ( http://creativecommons.org/licenses/by/4.0/).
Share and Cite
Wypych, A.; Sulikowska, A.; Ustrnul, Z.; Czekierda, D. Temporal Variability of Summer Temperature Extremes in Poland. Atmosphere 2017, 8, 51. https://doi.org/10.3390/atmos8030051
Wypych A, Sulikowska A, Ustrnul Z, Czekierda D. Temporal Variability of Summer Temperature Extremes in Poland. Atmosphere. 2017; 8(3):51. https://doi.org/10.3390/atmos8030051
Chicago/Turabian StyleWypych, Agnieszka, Agnieszka Sulikowska, Zbigniew Ustrnul, and Danuta Czekierda. 2017. "Temporal Variability of Summer Temperature Extremes in Poland" Atmosphere 8, no. 3: 51. https://doi.org/10.3390/atmos8030051