Article

Black Carbon Aerosol in Rome (Italy): Inference of a Long-Term (2001–2017) Record and Related Trends from AERONET Sun-Photometry Data

1
Institute of Atmospheric Sciences and Climate (ISAC), National Research Council (CNR), Via Fosso del Cavaliere 100, 00133 Rome, Italy
2
DEIM—Industrial Engineering School, University of Tuscia, Largo dell’Università snc, 01100 Viterbo, Italy
3
Leibniz Institute for Tropospheric Research, Permoserstrasse 15, 04318 Leipzig, Germany
4
Particle Chemistry Department, Max Planck Institute for Chemistry, Hahn-Meitner-Weg 1, 55128 Mainz, Germany
*
Author to whom correspondence should be addressed.
Atmosphere 2018, 9(3), 81; https://doi.org/10.3390/atmos9030081
Submission received: 14 October 2017 / Revised: 12 February 2018 / Accepted: 21 February 2018 / Published: 25 February 2018
(This article belongs to the Special Issue Carbonaceous Aerosols in Atmosphere)

Abstract

:
Surface concentration of black carbon (BC) is a key factor for the understanding of the impact of anthropogenic pollutants on human health. The majority of Italian cities lack long-term measurements of BC concentrations since such a metric is not regulated by EU legislation. This work attempts a long-term (2001–2017) inference of equivalent black carbon (eBC) concentrations in the city of Rome (Italy) based on sun-photometry data. To this end, aerosol light absorption coefficients at the surface are inferred from the ”columnar” aerosol aerosol light absorption coefficient records from the Rome Tor Vergata AERONET sun-photometer. The main focus of this work is to rescale aerosol light absorption columnar data (AERONET) to ground-level BC data. This is done by using values of mixing layer height (MLH) derived from ceilometer measurements and then by converting the absorption into eBC mass concentration through a mass–to–absorption conversion factor, the Mass Absorption Efficiency (MAE). The final aim is to obtain relevant data representative of the BC aerosol at the surface (i.e., in-situ)–so within the MLH– and then to infer a long-term record of “surface” equivalent black carbon mass concentration in Rome. To evaluate the accuracy of this procedure, we compared the AERONET-based results to in-situ measurements of aerosol light absorption coefficients ( α abs) collected during some intensive field campaigns performed in Rome between 2010 and 2017. This analysis shows that different measurement methods, local emissions, and atmospheric conditions (MLH, residual layers) are some of the most important factors influencing differences between inferred and measured α abs. As a general result, ”inferred” and ”measured” α abs resulted to reach quite a good correlation (up to r = 0.73) after a screening procedure that excludes one of the major cause of discrepancy between AERONET inferred and in-situ measured α abs: the presence of highly absorbing aerosol layers at high altitude (e.g., dust), which frequently affects the Mediterranean site of Rome. Long-term trends of “inferred” α abs, eBC, and of the major optical variables that control aerosol’s direct radiative forcing (extinction aerosol optical depth, AODEXT, absorption aerosol optical depth, AODABS, and single scattering albedo, SSA) have been estimated. The Mann-Kendall statistical test associated with Sen’s slope was used to test the data for long-term trends. These show a negative trend for both AODEXT (−0.047/decade) and AODABS (−0.007/decade). The latter converts into a negative trend for the α abs of −5.9 Mm−1/decade and for eBC mass concentration of −0.76 μ g / m 3 /decade. A positive trend is found for SSA (+0.014/decade), indicating that contribution of absorption to extinction is decreasing faster than that of scattering. These long-term trends are consistent with those of other air pollutant concentrations (i.e., PM2.5 and CO) in the Rome area. Despite some limitations, findings of this study fill a current lack in BC observations and may bear useful implications with regard to the improvement of our understanding of the impact of BC on air quality and climate in this Mediterranean urban region.

1. Introduction

Black carbon (BC) is the most prominent component of the atmospheric light-absorbing aerosol. Its occurrence in the atmosphere has been more and more studied for both climate and health effect purposes. This explains the increasing scientific interest in monitoring BC in the atmosphere [1].
In recent years, short-term epidemiological studies provided sufficient evidence of an association of daily variations in BC concentrations with short-term changes in health (all-cause and cardiovascular mortality, and cardiopulmonary hospital admissions) [2]. Technical studies provide sufficient evidence of associations of all-cause and cardiopulmonary mortality with long-term average BC exposure [2]. Studies of short-term health effects suggest that BC is a better indicator of harmful particulate substances from combustion sources (especially traffic) than undifferentiated particulate matter (PM) mass, but the evidence for the relative strength of association from long-term studies is inconclusive [2].
In addition, scientific evidence has led to a recognition of the significant role of BC as one of the short-lived climate forcers [3]. Measures focused on BC are expected to achieve a significant short-term reduction in global warming [3]. If they were to be implemented immediately, together with measures to reduce CO2 emissions, the chances of keeping the Earth’s temperature increase to less than 2 C relative to pre-industrial levels would be greatly improved [3]. Global health would also directly benefit from the same measures.
To address the question concerning how large the contribution of BC to climate forcing is and how BC affects human health, it is still necessary to evaluate how BC aerosol properties affect that contribution [1,4]. As yet, there is only limited monitoring data of BC for epidemiologic analysis [5], or climate modeling validation studies [6,7].
BC forcing needs to be known accurately to interpret past climate change, project future change, and develop the most effective strategies for mitigating anthropogenic climate change. It is difficult to determine BC climate forcing by using emission estimates and aerosol transport models, because of imprecise knowledge of BC emission strengths and uncertainties in simulation of aerosol removal mechanisms. Long-term trends are of particular interest, because they help in understanding the global and regional cycling of different aerosol species of both natural and anthropogenic origin, as well as in validating emission inventories and the representation of aerosols in climate models. Aerosol trends are also critical in resolving the change in surface radiation balance over the past few decades, such as global brightening [8].
However, global atmospheric absorption attributable to BC is too low in many models and should be increased by a factor of almost three [4]. After this scaling, the best estimate for the industrial-era (1750 to 2005) direct radiative forcing of atmospheric BC is +0.71 W/m2 (with 90% uncertainty bounds of (+0.08, +1.27) W/m2) [4]. Total direct forcing by all BC sources, without subtracting the preindustrial background, is estimated as +0.88 (+0.17, +1.48) W/m2 [4]. Direct radiative forcing alone does not capture important rapid adjustment mechanisms. The best estimate of industrial-era climate forcing of BC through all forcing mechanisms, including clouds and cryosphere forcing, is +1.1 W/m2 (with 90% uncertainty bounds of +0.17 to +2.1 W/m2) [4]. Thus, there is a very high probability that BC emissions, independent of co-emitted species, have a positive forcing and warm the climate. It is estimated that BC, with a total climate forcing of +1.1 W/m2, is the second most important human emission in terms of climate forcing in the present-day atmosphere; only carbon dioxide is estimated to have a greater forcing [4]. Previous studies have shown large differences between estimates of the effect of black carbon on climate [1,4,5,9]. These differences are very extensively examined in literature, and the sources of uncertainty are relatively well understood. Overcoming them is what is hard to achieve.
In spite of such relevance, a long-term investigation of BC in the Rome area is missing in the literature. So the present work represents an attempt to fill this gap.
The primary objective of this work is to infer a long-term record of “surface” equivalent black carbon mass concentration (eBC) in Rome.
The main focus of this work is to rescale aerosol absorption columnar data (AERONET) to ground-level aerosol absorption. The ground-level aerosol absorption is converted into eBC mass concentration by using values of mixing layer height (MLH) derived from ceilometer measurements and then by converting the absorption into eBC mass concentration through a mass-to-absorption conversion factor, the Mass Absorption Efficiency (MAE). The final aim is to obtain relevant data representative of the BC aerosol concentration at the surface (i.e., in-situ)—within the MLH—and then to infer a long-term record of “surface” equivalent black carbon mass concentration in Rome.
To achieve our objective, columnar aerosol light absorption coefficients are obtained from remotely sensed observations (provided by the 2001–2017 sun-photometer dataset at the Rome-Tor Vergata AERONET site) and then validated against aerosol light absorption coefficients from “in-situ” measurements made during intensive field campaigns. The columnar vs. in-situ comparison is then analyzed to understand possible sources of discrepancy. In a following step, BC concentrations are inferred from AERONET aerosol light absorption coefficients observations and transformed into surface equivalent BC mass concentrations (eBC).
Original aspects of this work include: (i) easy-replicable methodology to infer “surface” eBC from remotely sensed aerosol absorption optical observations (AERONET) in desert dust and/or fire-plumes-free conditions; (ii) assessment of long-term trends of surface aerosol light absorption coefficients and surface eBC mass concentration over Rome.

2. Material and Methods

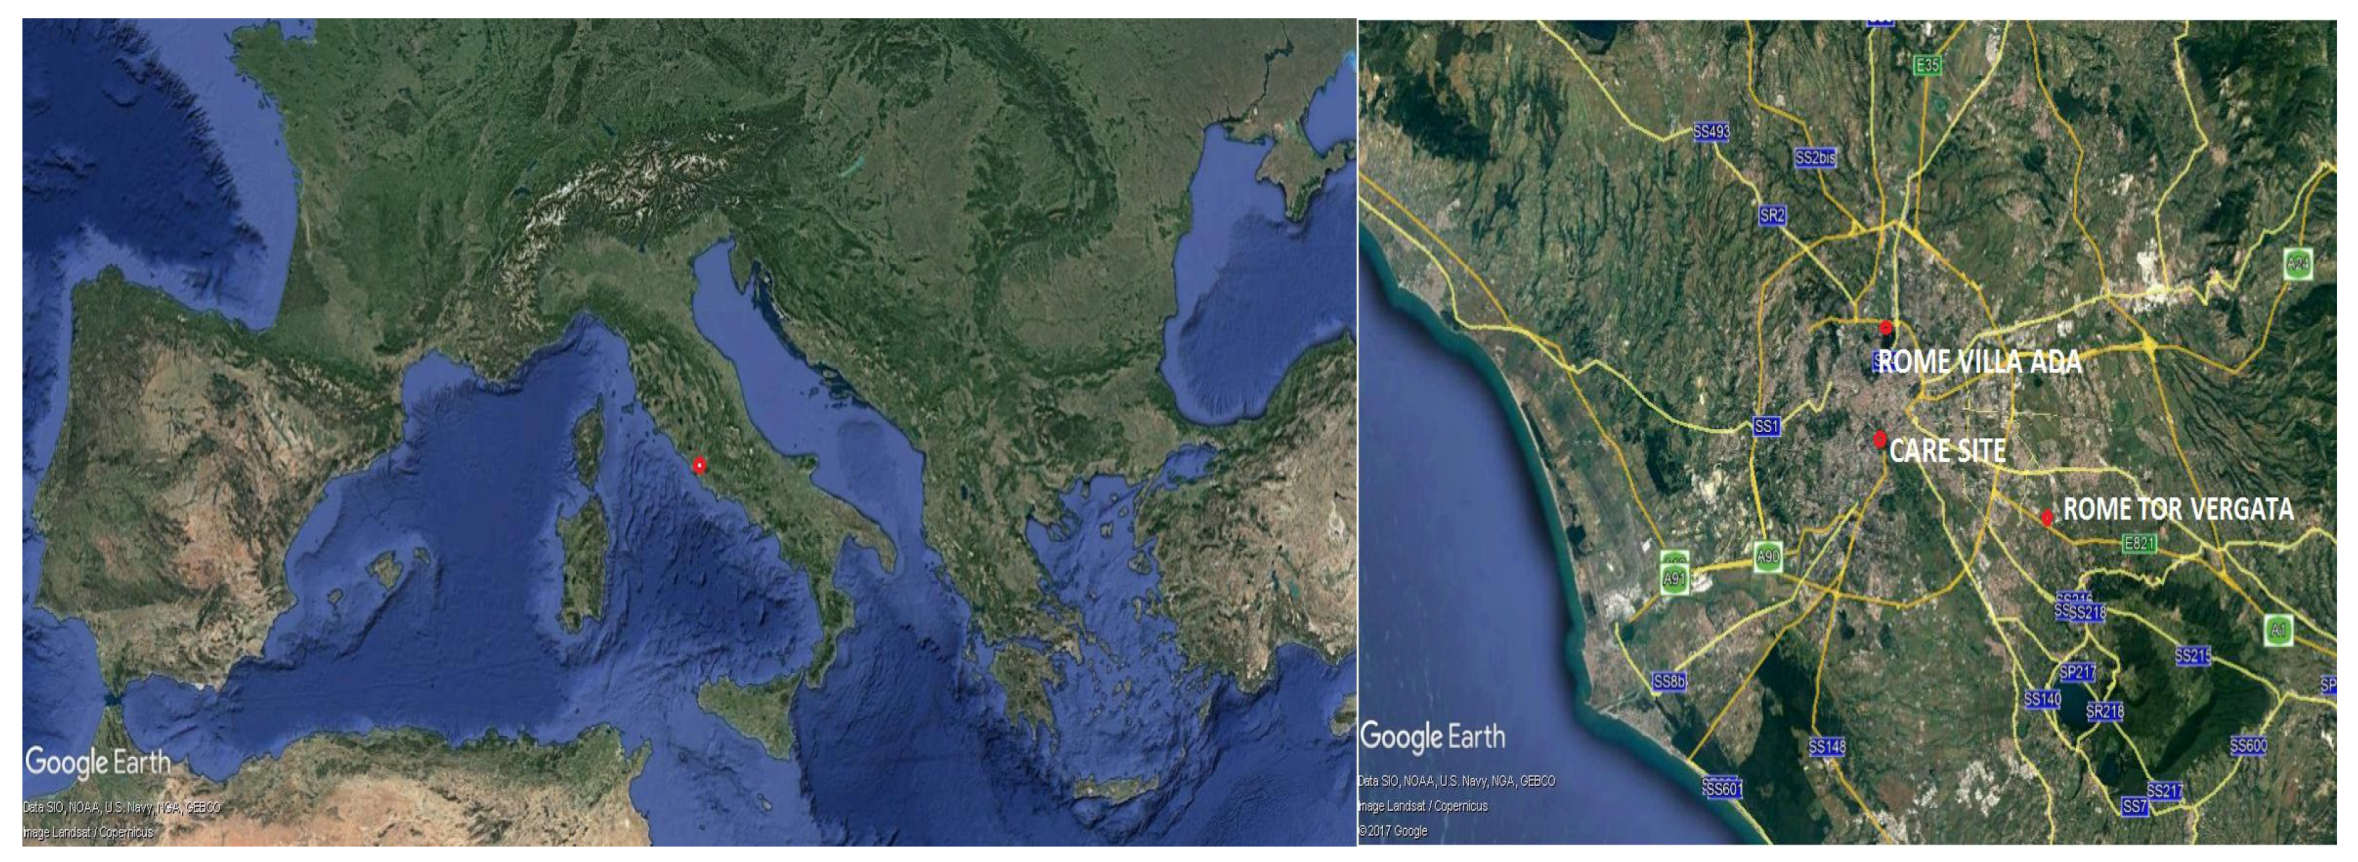
2.1. Measurement Sites

Columnar data of aerosol optical properties were measured by a sun and sky scanning photometer installed in the year 2000 at the Institute of Atmospheric Science and Climate (ISAC-CNR) in Tor Vergata, Rome (Figure 1). The institute is located in the southeastern outskirts of the city (41 50’30.2’’ N, 12 38’51.2’’ E, 103 m a.s.l., 14 km from central Rome, 5 km from the city boundary and 40 km from the Mediterranean coast) and considered to be an urban background site. The area of the site is surronded by a large portion made up of grassy vegetation, and is characterized by a flat orography. The closest highway (A1) is situated south-westerly at a distance of about 700 m. Single-house suburbs are scattered over this territory, starting some 1 km from the site. The site is affected by local (distance: 200 m) road traffic, air traffic (within 6.5 km from the Ciampino airport), local and long-range transported biomass burning, and mineral dust [10,11].
To evaluate how AERONET aerosol absorption coefficients agree with the in-situ measured ones, we compared them to surface-level data during different intensive field campaigns: the first, from November 2010 to July 2011, performed with the Rome Tor Vergata Research Area (referred to as ARTOV in the following), therefore co-located to the AERONET sun-photometer (see Figure 1) [12], the second in October–November 2013, and in May–June 2014. Despite the measurement site is the same, these latter campaigns will be referred to as DIAPASON in the following as data were collected in the framework of the EC-LIFE+ project DIAPASON (Desert-dust Impact on Air quality through model—Predictions and Advanced Sensors ObservatioNs) [10,13,14]. Another field campaign used in this study was performed in Rome downtown in February 2017 during the Carbonaceous Aerosol in Rome and Environs (CARE) experiment [15]. These fields measurements were based at the “Roma Capitale” site of San Sisto gardens, in the Rome downtown area near the Coliseum and Caracalla Baths, in between three traffic roads at 100–800 m distance (Figure 1). This is a Mediterranean site representative of the downtown urban background air pollution conditions in Rome, 14 km from the Rome Tor Vergata site.
In this study we also use monthly mean concentrations of a chemical species (i.e., CO) and of PM2.5 at the Rome area in order to compare their long-term trends with that of eBC. These data were taken from the Regional Environmental Protection Agency of the Lazio region (www.arpalazio.gov.it), and will be used in Section 3.4. Based on the availability of a large dataset of such variables, we chose the historical urban background monitoring station of the city, located in one of the largest public parks of Rome, called Villa Ada (Rome Villa Ada), 15 km from the site of Rome Tor Vergata, representative of an urban background (Figure 1).

2.2. Converting Light Absorption Columnar Data (AERONET) into Associated Surface Data (In-Situ)

2.2.1. Measurement of Columnar Aerosol Optical Properties

Columnar data of aerosol optical properties at the site of Rome are provided by AERONET inversion products. AErosol RObotic NETwork (AERONET) is an internationally federated, globally distributed network of automatic sun and sky scanning photometers that routinely observes and transmits observations for processing and posting to the AERONET web site (www.aeronet.gsfc.nasa.gov), with a fairly wide spatial coverage in the world, and long data records at many sites [16,17,18]. The direct solar radiation measured by Sun–sky photometers (CIMEL Electronique CE318) is used to measure the Aerosol Optical Depth, i.e., the vertically integrated aerosol extinction (AODEXT). In addition to AODEXT, algorithms have been developed utilizing both the spectral AODEXT and the spectral angular distribution of the sky radiances obtained from almucantar scans, which enable retrieval of other column aerosol properties including absorption AOD (AODABS) and single scattering albedo (SSA) [17,18]. The accuracy of the retrievals was analyzed in extensive sensitivity studies [17,18]. AERONET retrieved absorption aerosol optical depth (AODABS) is:
AOD ABS ( λ ) = [ 1 S S A ( λ ) ] AOD EXT ( λ )
The AODEXT estimated uncertainty varies spactrally from ±0.01 to ±0.02 with the highest error in the ultraviolet wavelengths, while for sky radiance measurements at all wavelengths (i.e., 440, 670, 870, and 1020 nm), the accuracy of the retrieved SSA is evaluated to be ±0.03 [18]. AERONET AODEXT data are computed for three data quality levels: Level 1.0 (unscreened), Level 1.5 (cloud-screened), and Level 2.0 (cloud-screened and quality-assured). The major difficulty in using AERONET inversion products is the uncertainty of the measurements: for example one limitation of the AERONET inversion retrievals is that the uncertainty of the derived SSA becomes very large at low values of AODEXT [18]. To minimize the effects of this uncertainty, AERONET Level 2 data invalidate all absorption-related values if the AODEXT at λ = 440 nm is <0.4 [17]. Unfortunately, this restriction heavily reduces the spatial and temporal coverage of data that can be obtained from AERONET for most sites. In fact, model analysis of global AODEXT suggests that 95% of global AODEXT values at λ = 440 nm are < 0.4, while over land this percentage is 89% [19]. At the site of Rome Tor Vergata, 94% of AODEXT ( λ = 440 nm) values are <0.4. For this study, in order to maximize the number of AERONET data points available for the comparison with in-situ data, we downloaded from the AERONET website the Version 2 Level 1.5 data inversion products in the period 2001–2017 (7697 points) and applied to it all the AERONET quality assurance criteria for Lev. 2.0 (including a check of the sky residual error as a function of AODEXT at λ = 440 nm, solar zenith angle greater than or equal to 50 and almucantars with a minimum number of measurements in each of the four designated scattering angle bins [20]) but the one requiring AODEXT > 0.4. In fact, addition of this criterium would reduce the number of data from 7697 to 455 with no data in coincidence to the field campaigns used in this study. Here, we will refer to these quality screened data as Lev. 2.0*.

2.2.2. MLH Measurements

The mixing layer height (MLH) is an essential parameter for predicting atmospheric pollution and for pollutants dispersion evaluation. In this work, statistical MLH data were obtained from a network of Automated LIdar-Ceilometer (ALC) measurements (ALICEnet, www.alice-net.eu, run by ISAC-CNR). ALICEnet provides near-real time, operational (i.e., H-24) atmospheric profiling of aerosols at several sites in Italy, including in Rome Tor Vergata, co-located with the AERONET sun-photometer. Based on these measurements, daily MLH is derived by evaluating the gradient, and the variance of the instrument signal along the vertical profile [21]. In this study we used a one-year database (2014) to derive monthly-mean, hourly-resolved MLH values to rescale AERONET columnar AODABS to ground–level values to be compared to the in-situ measured aerosol light absorption coefficients. Indeed, availability of actual MLH values or of the full extinction profile represents the ideal condition to better retrieve ground values out of column ones. This can be made possible by collocating sun-photometers with lidar e/o ceilometers. However, for a proper columnar AOD scaling, it is useful to remark upon the importance of having a reliable information about MLH.

2.2.3. Converting Columnar Data into Surface Data

From AODABS ( λ ) derived by Equation (1) in Section 2.2.1, MLH measurements have been used to derive the AERONET-derived surface aerosol light absorption coefficients (Mm 1 ):
α a b s = AOD ABS ( λ ) MLH
Equation (2) assumes that aerosol absorption is negligible above MLH and a well-mixed boundary layer with no elavated concentrations near ground. However, in many cases, at altitudes higher than MLH, there could be the presence of layers of absorbing aerosol in the atmospheric column, namely desert dust and fire plumes. In order to filter-out these cases, a screening scheme was implemented by applying specific thresholds (T) on AERONET AODEXT ( λ = 440 nm), AERONET SSA ( λ = 440 nm), and AERONET effective radius (Reff) as described hereafter and summarized in Table 1.
(T1)
AODEXT : we calculated its mean ( μ = 0.20) and standard deviation ( σ = 0.12) at the site of Rome Tor Vergata during the period 2001–2017 and then we selected only AODEXT values between μ σ and μ + σ . In fact, in Rome AODEXT > μ + σ are typically associated with increased aerosol layers from long-range transport of dust and/or fire plumes [11], while AODEXT < μ σ are found in northerly wind conditions, with a very clean atmosphere and too low AODEXT values to be trustworthy for our purposes;
(T2)
SSA: we selected only data with SSA values > 0.85. This is to exclude from the bulk aerosol the coarse mode dust (CDM) particles and the soot mode (STM) particles, according to the “paradigm” provided in [22];
(T3)
Reff : we selected only data with Reff values < 0.3 μ m in order to exclude dominance of larger particles, typical of Saharan dust transport conditions.
In Table 2 we show the number of aerosol light absorption coefficients measurements before and after the application of the T1–to–T3 screening scheme, split up by seasons.
At first, it is interesting to note that, due to prevailing fair weather, summer measurements are over-represented in the AERONET dataset (more than 40% of total data), while for the other seasons about 20% of the whole dataset is available. In addition, the application of the screening scheme strongly limits the number of data (about 60% of points are excluded). As expected, the number of points considerably decreases, these being in agreement with the relative frequent occurrence (33% of the time) of dust and/or fire plumes in our region [11,23].

2.3. Validation Dataset

During the ARTOV field campaign, in-situ aerosol absorption was measured with a 3-wavelength Radiance Research Particle/Soot Absorption Photometer (PSAP) [22,24]. More specifically, it was operated to measure dry aerosol absorption coefficients α abs ( λ ) [Mm 1 ] at λ = 467 nm, 530 nm and 660 nm, with an accuracy of 20%. The accuracy of the PSAP absorption measurements considering all empirical corrections, is estimated to be of the order of 20–30% [25,26,27,28], but it is known that PSAP may introduce up to 50% positive bias in measured absorption in urban locations and up to 100% positive bias in heavily polluted areas [29]. In addition, an integrating nephelometer (Ecotech, mod. Aurora 3000) was operated to measure continuously and in real-time the scattering coefficient due to aerosol particles ( α scatt) at three wavelengths, 450, 520 and 635 nm. Scattering error for truncation is estimated to be between 1% and 3%. Even if the accuracy of both PSAP and nephelometer was sufficiently large, to reduce possible experimental errors from the dataset, in this work very low values of scattering and absorption coefficients (<10 and <1 Mm 1 , respectively) have been excluded. For the same reason outlier values were also excluded (respectively, >700 and >130 Mm 1 ) for scattering and absorption coefficients. The measurements of absorption and scattering were made at low relative humidity (RH < 40%). During DIAPASON and CARE field campaigns, the absorption coefficients ( σ a b s ) at 637 nm were obtained from Multi Angle Absorption Photometer measurements (MAAP, Thermo Scientific™ (Waltham, MA, USA)) [10,15,30].
The MAAP measures the particle light absorption coefficient directly with an uncertainty of approximately 12% [30]. The uncertainty of the MAAP—eBC mass concentration is not well known, since there is no reference method for eBC, but an uncertainty of about 25% was derived from the results of the method intercomparison test reported in [31]. In a MAAP, a mass–to–absorption conversion factor (Mass Absorption Efficiency, MAE) of 6.6 m2 g 1 is internally used to obtain eBC mass concentration. This might be a reasonable value for an urban aerosol. The MAE might cover generally a range from 4 to 10, with increasing atmospheric aging. MAE values were determined for seven observation sites in Germany, ranging between 3.9 and 7.4 m2 g 1 , depending on measurement site and observational period. The highest values were found in a continentally aged air mass in winter, where soot particles were assumed to be mainly internally mixed [32]. Furthermore, it has to be mentioned that the MAAP was calibrated before the CARE campaign at the European Center for Aerosol Calibration (ECAC) in Leipzig against the World Meteorological Organization—Global Atmosphere Watch—World Calibration Center for Aerosol Physics (WMO—GAW—WCCAP) reference setup for the particle light absorption.

2.4. Converting the Aerosol Light Absorption Coefficient Into eBC Mass Concentration

The aerosol light absorption coefficients in the red region ( α abs( λ 2), being λ 2 = 660 nm by PSAP-derived in-situ data and λ 2 = 675 nm for the AERONET derived ones) were used to obtain the absorption coefficient due to BC at λ 1 = 530 nm, α abs(BC) ( λ 1). This calculation is based on the following assumptions:
  • (i) the Absorption Ångström Exponent AAE ( λ 1, λ 2) of BC = 1;
  • (ii) the aerosol light absorption coefficient is affected by three different aerosol light absorbers: black carbon, brown carbon, and dust:
    α a b s ( λ ) = α a b s ( B C ) ( λ ) + α a b s ( B r C ) ( λ ) + α a b s ( D U S T ) ( λ ) ;
  • (iii) at the red wavelengths ( λ 2 = 660–675 nm) the contribution of BrC is negligible [33], and Equation (3) can be rewritten as:
    α a b s ( λ 2 ) = α a b s ( B C ) ( λ 2 ) + α a b s ( D U S T ) ( λ 2 ) ;
The assumption (i) may result in rounding errors. We previously discussed that there is no single value for the AAE ( λ 1, λ 2) of BC since this AAE depends on BC particle size, coating, core, and wavelength [34]. AAE of BC tends to be 1 for externally mixed BC particles with diameter < 50 nm and can increase to an upper limit of more than 1.7 for the larger (internally or externally mixed) BC particles (e.g., [27,34,35,36,37,38,39,40]. To take into account these errors, we decided to use here AAE ( λ 1, λ 2) of BC = 1, and estimate the uncertainty to be 22%.
To calculate α abs(BC)( λ 2) in Equation (4), we identified conditions in which the contribution of dust was negligible. To improve the clarity of methods applied, we here provide a brief overview of this paradigm. This is a scheme to classify aerosol populations based on the information contained in their spectral optical properties (Scattering Ångström Exponent, SAE; Absorption Ångström Exponent, AAE; and SSA) of the bulk aerosol, and the relevant dependance on particle size and composition. The spectral variability of the aerosol single scattering albedo (dSSA), and the extinction, scattering and absorption Angstrom exponents (EAE, SAE and AAE, respectively) were observed for various aerosol types and coupled to measurements of particle number size distributions and relevant optical properties simulations (Mie theory). A general “paradigm” was built on dSSA, SAE and AAE to identify the signature of key aerosol populations, including soot, biomass burning, organics, dust and marine particles. Aerosol conditions dominated by dust were identified based on threshold values of SAE467–660, SSA530, AAE440–675 and dSSA × AAE (Table 3, based on [22]).
Under these conditions (i.e., the bulk aerosol dominated by dust), we set α abs( λ 2) = 0. In the remaining time records, we set α abs(DUST)( λ 2) = 0, and then:
α a b s ( λ 2 ) = α a b s ( B C ) ( λ 2 ) ;
This “paradigm” was applied to AERONET data in order to assess conditions when the bulk aerosol was dominated by dust. These data were eliminated from the timeseries. Recently, this paradigm was compared to similar schemes proposed in literature and its general validity for in-situ measurements was confirmed [41].
The absorption coefficient attributable to eBC mass concentration was finally calculated in this way [12,33,36,37,42] :
α abs ( BC ) ( λ 1 ) = α abs ( BC ) ( λ 2 ) · λ 2 λ 1 AAE ( λ 1 , λ 2 )
where λ 1 = 530 nm, λ 2 = 660 nm for in-situ measurements and 675 nm for AERONET derived ones, and AAE ( λ 1, λ 2) = 1. Finally, the eBC mass concentration ( μ g / m 3 ) was calculated using Mass Absorption Efficiency MAEBC ( λ = 530 nm):
eBC = α abs ( BC ) ( λ = 530 nm ) MAE BC ( λ = 530 nm )
A wrong choice for the eBC MAE can affect comparisons. We thus applied the same value (10 m2 g 1 ) to both in-situ surface (PSAP measurements) and AERONET data. This implies that all comparisons showed here do represent both (i) eBC mass concentration, and (ii) absorption coefficients (obtained by multiplying eBC mass concentration by 10). We used the value of eBC mass concentration absorption efficiency at 530 nm of 10 m2 g 1 as it is used in a series of previous publications for ambient aerosol (e.g., [12,15,43,44]). This value is suggested by the PSAP manufacturer (PSAP manual, Radiance research). In [45], authors used a value of 7.5 ± 1.2 m2 g 1 at 550 nm for uncoated particles representing fresh combustion aerosol, whereas they do not refuse the large body of literature suggesting that some ambient aerosol has MAE values greater than 7.5 m2 g 1 . In another work, authors indicated that measured values for freshly generated BC fall within a relatively narrow range of 7.5 ± 1.2 m2 g 1 at 550 nm, whereas MAE of BC increases by approximately 50% as BC becomes internally mixed with other aerosol chemical components [4].

2.5. Trends Analysis Method

The estimation of trends in time series data is a critical task, especially when the values are not normally distributed and autocorrelation associated with seasonality usually exists in the record, as in the case of the variables analyzed in this work (AODEXT, AODABS, SSA, and eBC mass concentration). To detect the trends, at first we calculated monthly medians of the values by using all-point measurements. It is preferable to use the median instead of the mean because many optical parameters, such as AODEXT and AODABS do not follow a normal distribution, in which case the median is a better representation than the mean. A monthly median was considered valid only if there were more than five measurements in that month. To determine and estimate annual trends, we followed the same approach developed in [46]. We used a statistical method, the seasonal Mann-Kendall (MK) test associated with Sen’s slope to the deseasonalized data (by removing a multi-year averaged seasonal cycle) in order to test and estimate the trends. The trend analysis procedure is described in the following section.

2.5.1. Mann-Kendall Test and Sen’s Slope

The Mann-Kendall statistical test is a nonparametric test to identify whether monotonictrends exist in a time series [47,48]. The advantage of the nonparametric statistical tests over the parametric ones, is that the nonparametric tests are more suitable for non-normally distributed and missing data, which are frequently encountered in the AERONET dataset. Many time series of aerosol variables may frequently show statistically significant serial correlation, especially those associated with seasonal variability. In such cases, the existence of serial correlation will increase the probability that the MK test detects a significant trend. It is now well understood that autocorrelation in the data can have a broad influence on the analysis leading to an overestimation of the statistical significance [49,50] and that “pre-whitening” is the best method to eliminate the influence of autoregressive AR (1) serial correlation on the Mann-Kendall test [51]. The pre-whitening method consists of the following iterative process: (1) estimate the auto-correlation, (2) while the auto-correlation coefficient remains higher than 0.05, calculate the Sen’s slope, (3) remove the linear trend using the Sen’s slope, (4) remove the auto-correlation and (5) add the trend. This pre-whitening procedure was therefore applied to the data prior to the Mann-Kendall trend analysis. To test for either an upward or downward trend, a two-tailed test at the 95% level of significance was applied.

3. Results

In Section 3.1 we first show long-term records (2001–2017) of columnar aerosol optical properties retrieved from AERONET data. Then, to show the expected accuracy of the derived surface AODABS, in Section 3.2 we compare AERONET inferred surface aerosol light absorption coefficients with in-situ measured aerosol light absorption coefficients obtained during intensive field campaigns. In Section 3.3 we infer a long-term record of the surface aerosol light absorption coefficients from AERONET absorption observations. Finally, in Section 3.4 we estimate long-term trends of surface aerosol light absorption coefficients and AERONET columnar optical parameters. These are also translated into eBC mass concentrations following the procedure detailed in Section 2.4.

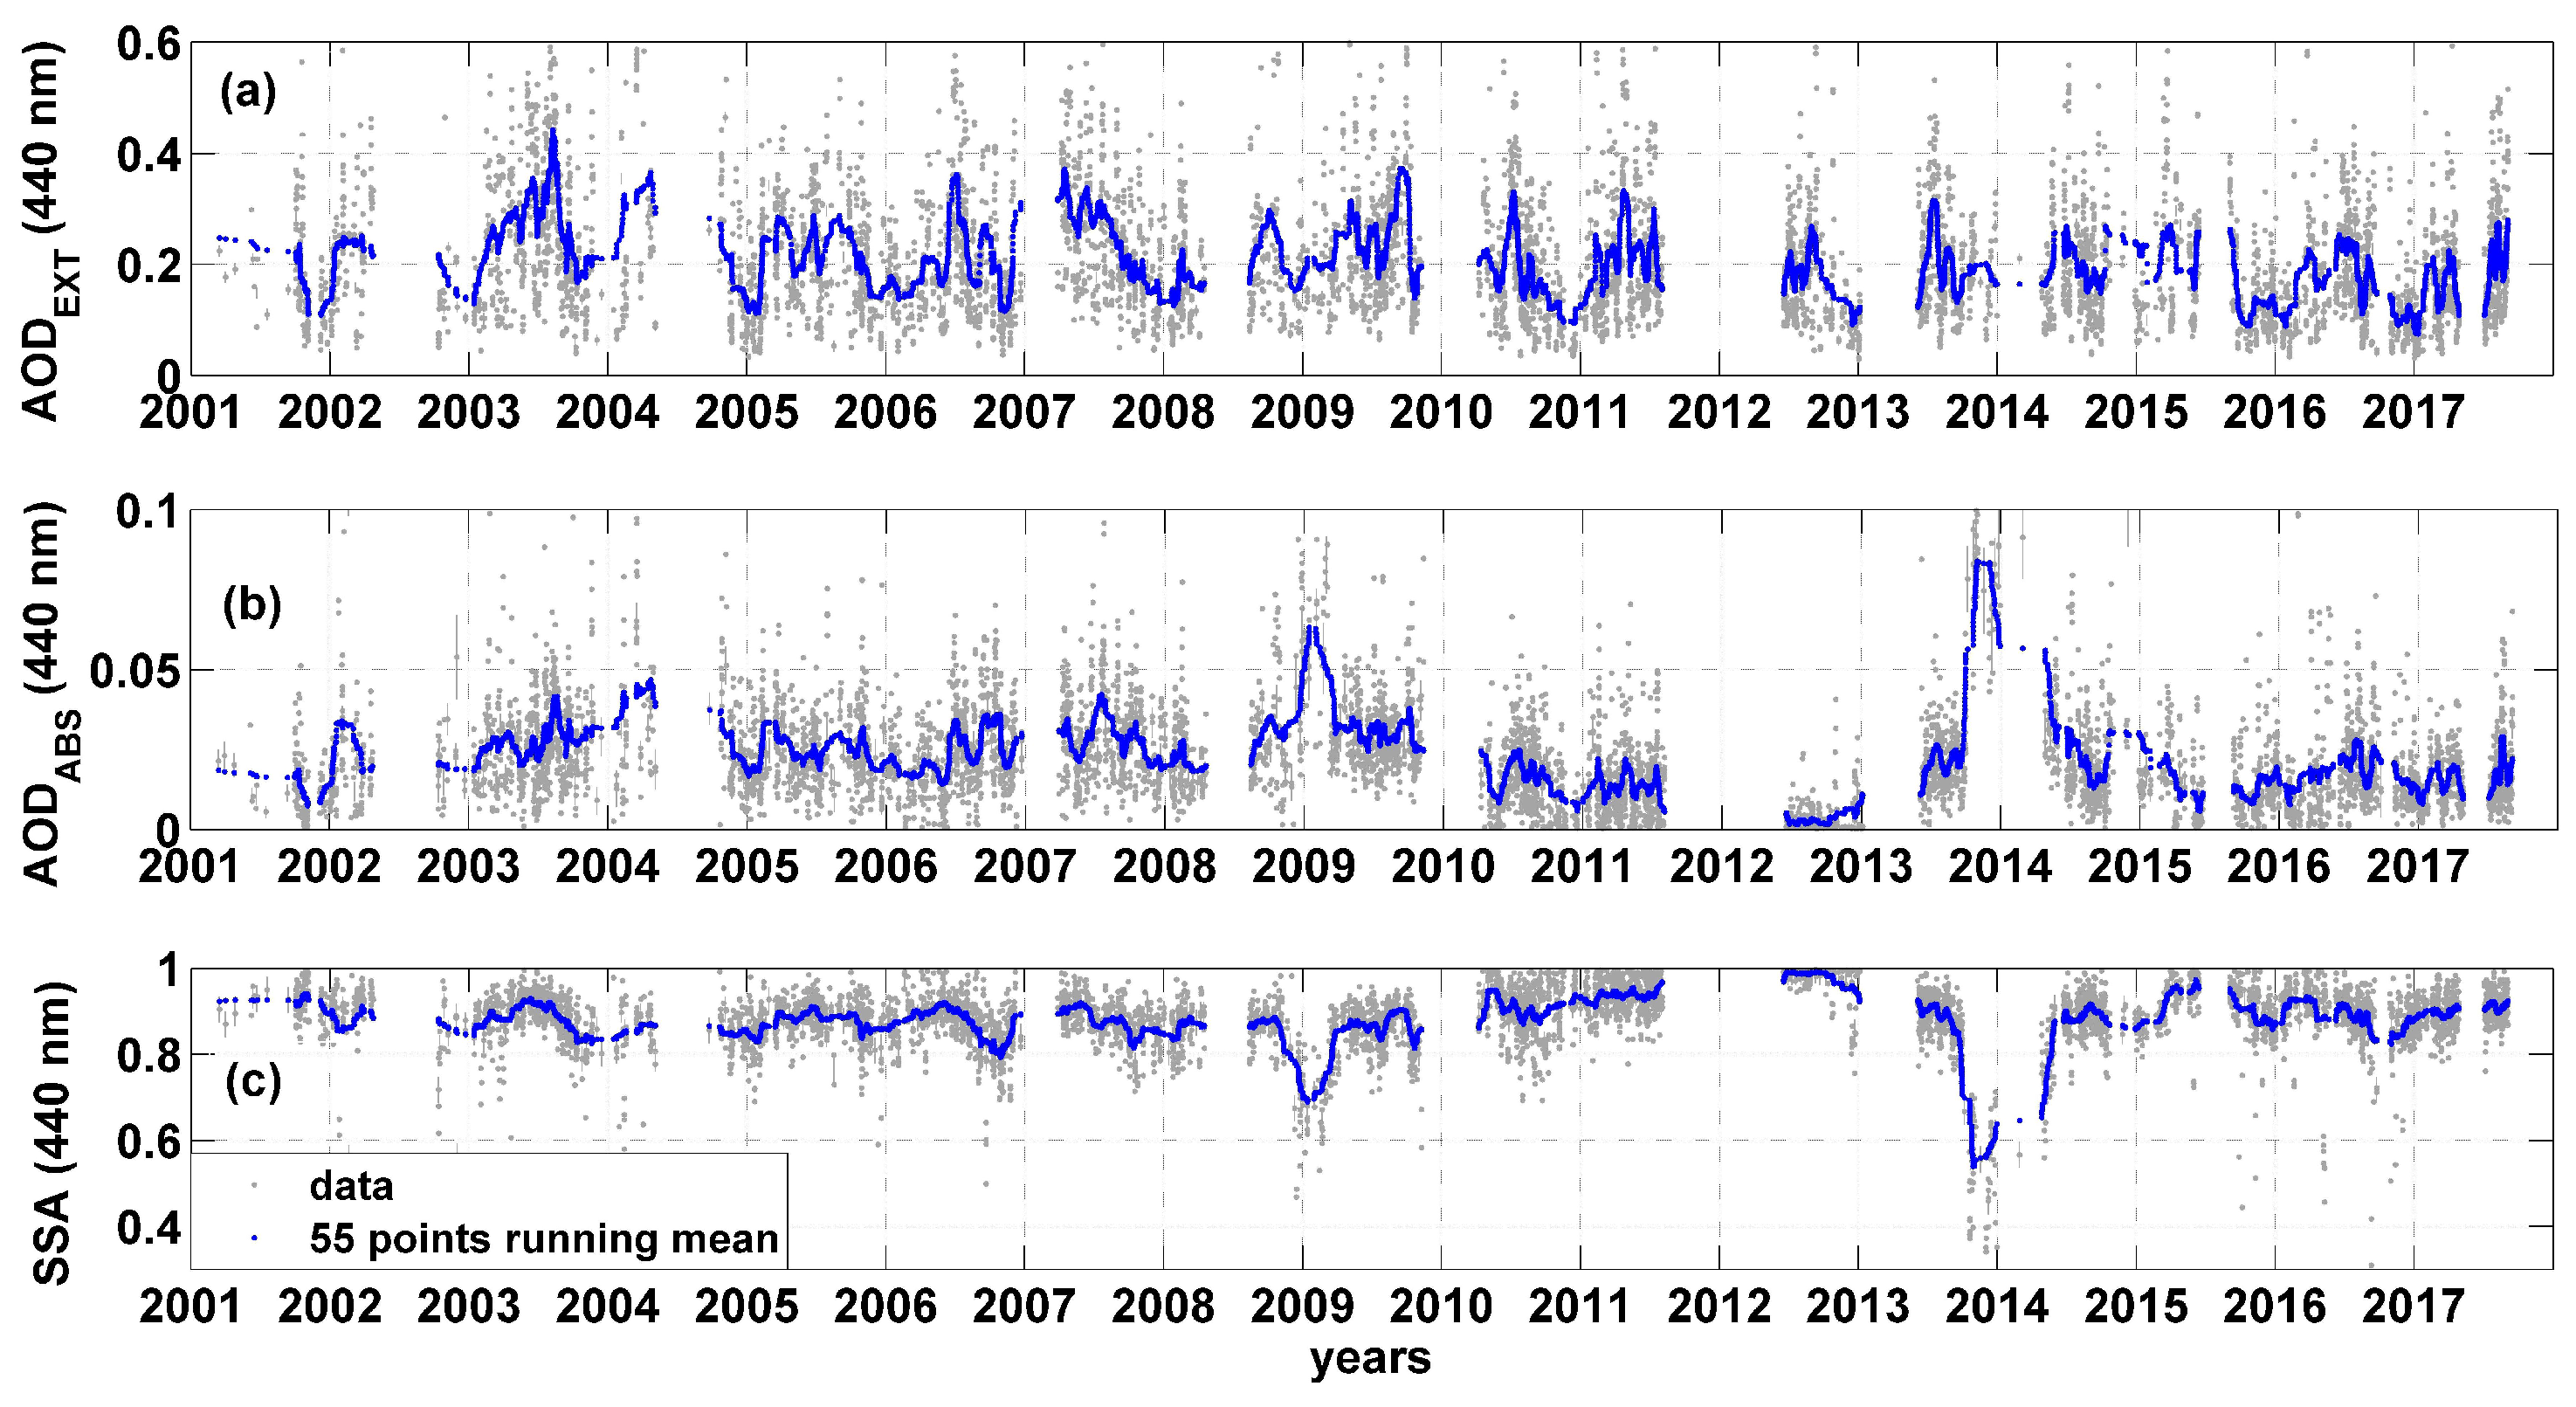
3.1. Long-Term Records of Columnar Aerosol Optical Properties

In this section, columnar aerosol optical properties derived from AERONET data in Rome are presented. We used Lev. 2.0* data, during daytime and clear sky conditions (see Section 2.2). Figure 2 shows time series of: (a) extinction aerosol optical depth, AODEXT ( λ = 440 nm), (b) absorption aerosol optical depth, AODABS ( λ = 440 nm), (c) and single scattering albedo, SSA ( λ = 440 nm) measured from January 2001 to August 2017. Grey markers show measured values; blue markers show related running-mean (55 points). Columnar measurements in Rome cover a wide temporal range (2001–2017, more than 7600 data points), with few interruptions (e.g., August 2011–May 2012, due to instrument calibration). We show data at λ = 440 nm to enable the comparison with previous studies (Section 4.3).
The average values (mean and standard deviation) of the examined values are: 0.21 ± 0.12 for AODEXT, 0.02 ± 0.01 for AODABS, and 0.89 ± 0.07 for SSA. The lowest values of AODABS (running mean = 0.002) were measured from June to December 2012. The highest ones (running mean = 0.08) from October to December 2013, and in January and February 2009 (running mean = 0.06). SSA shows a specular tendency, the lowest values (running mean = 0.54) from October to December 2013, and the highest ones (running mean = 0.99) from June to December 2012.

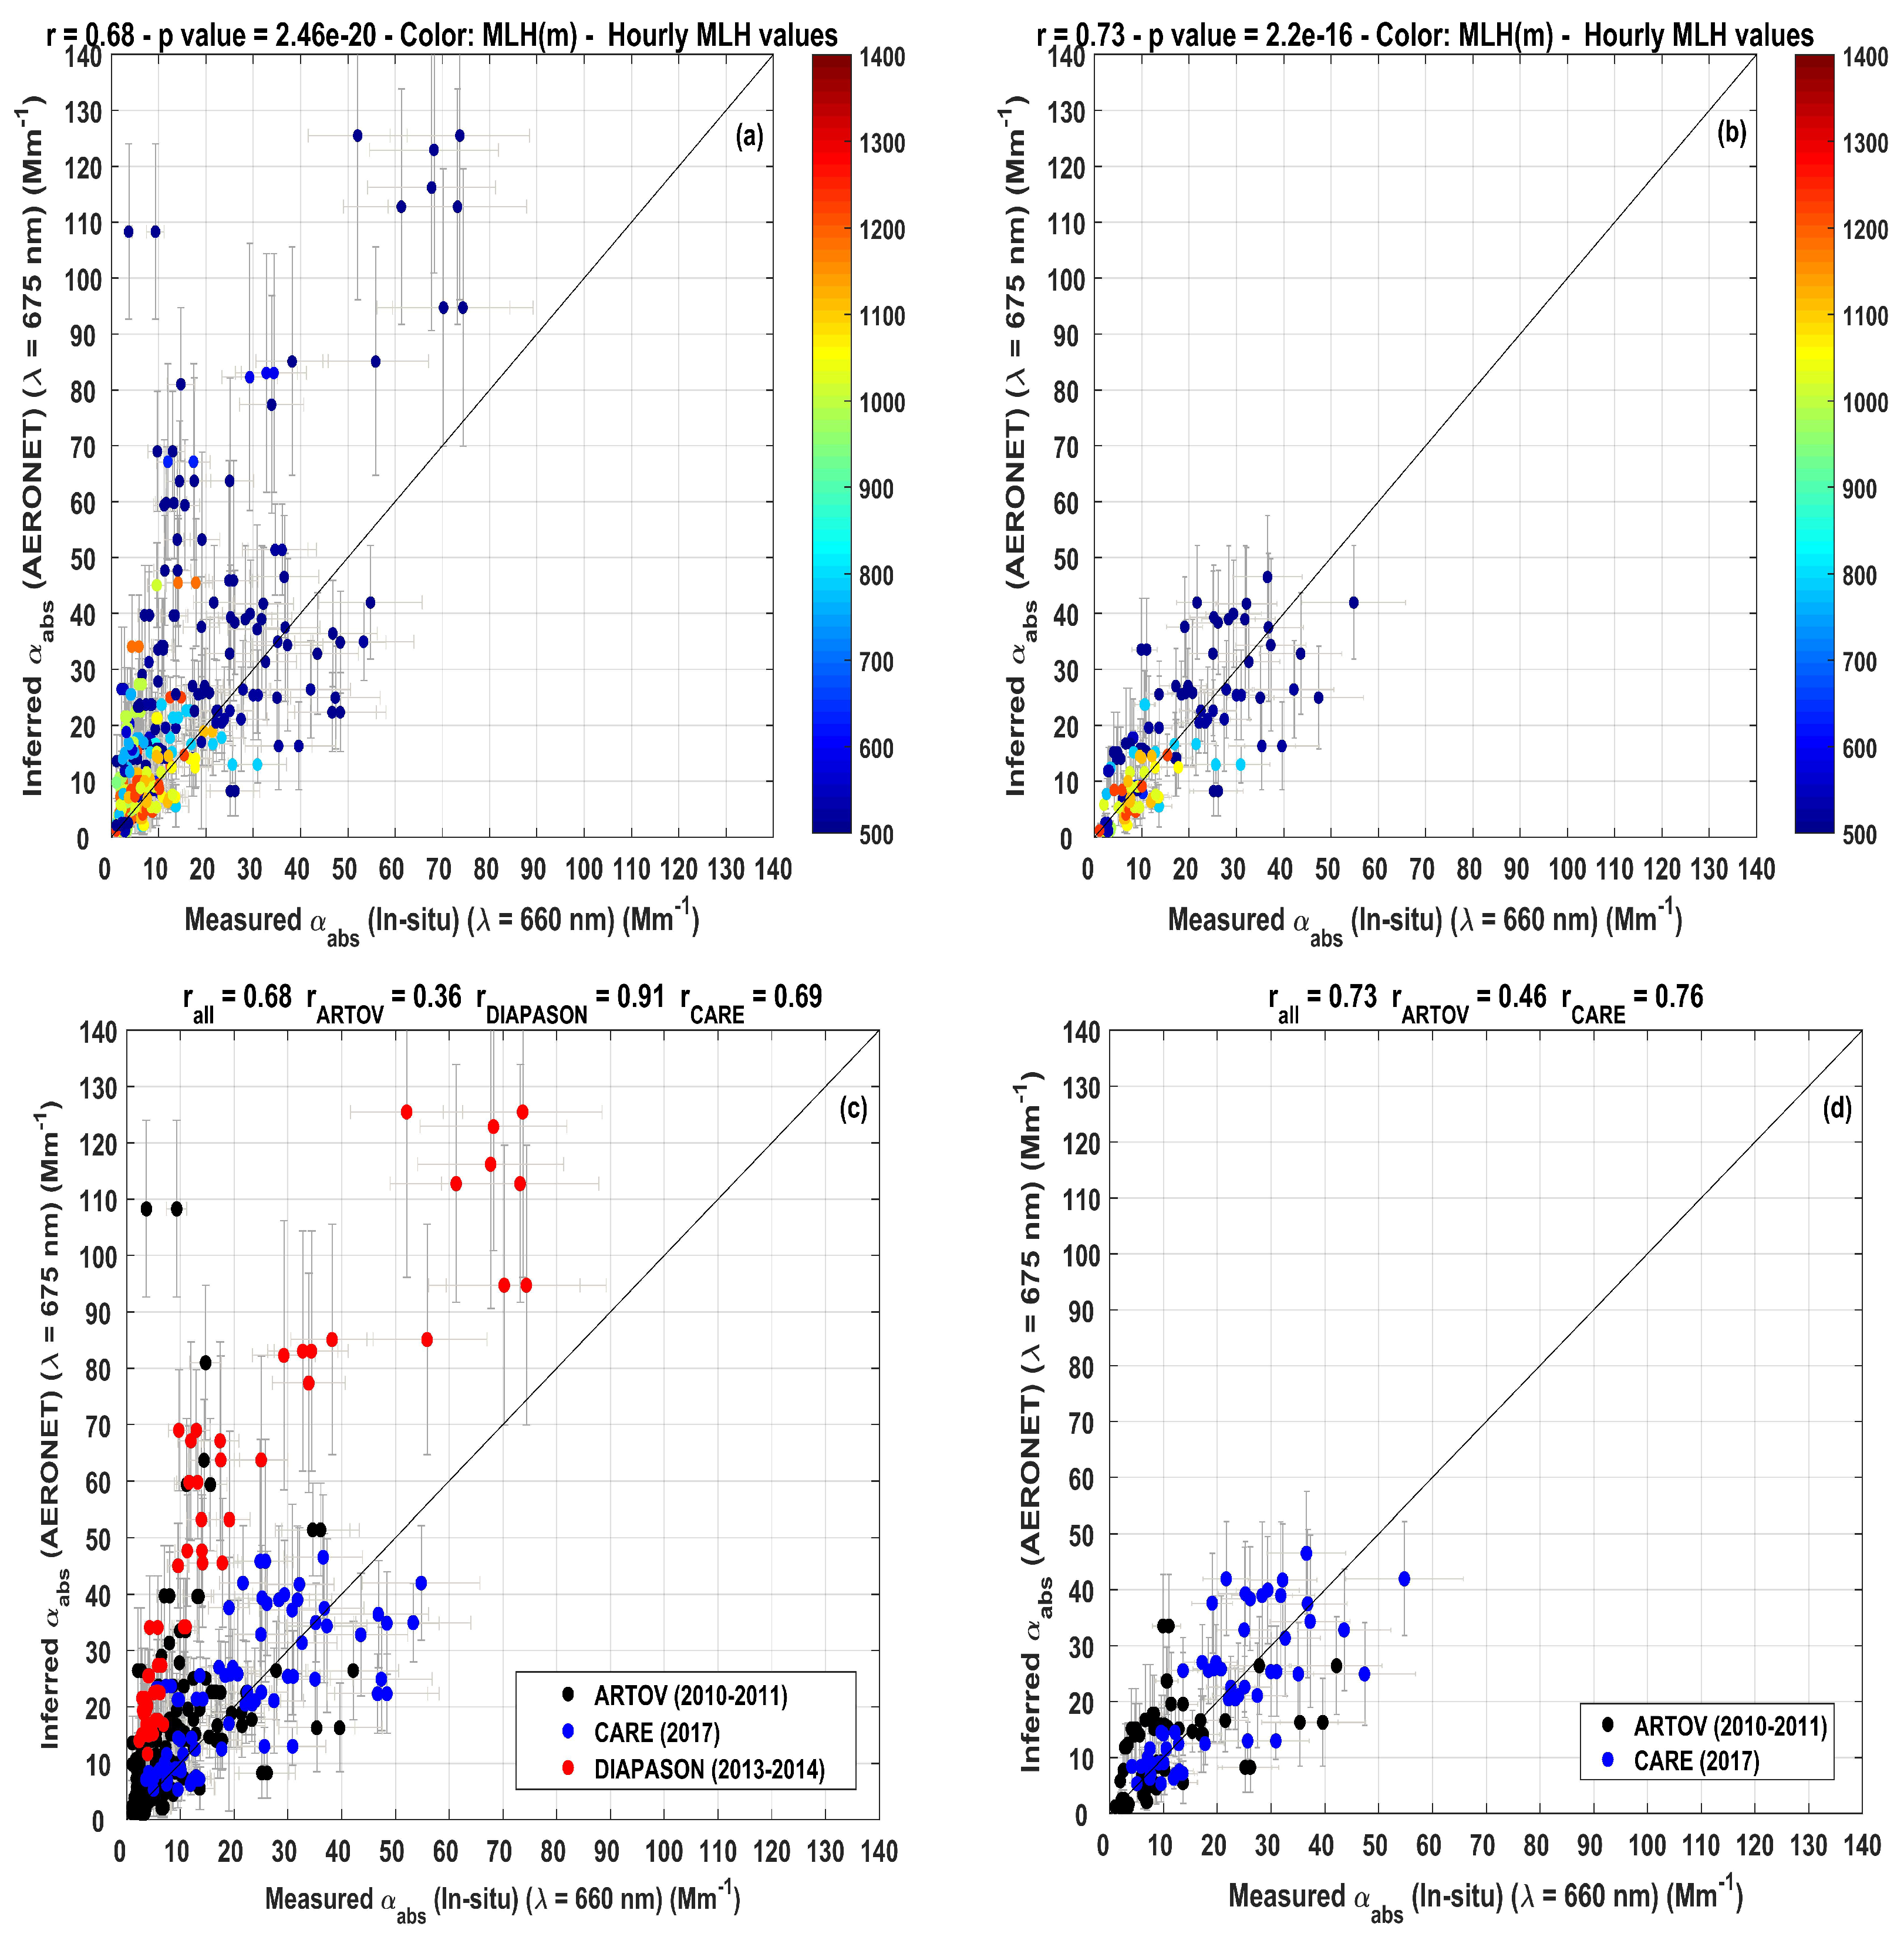
3.2. Surface Absorption Coefficient Comparison between AERONET Inferences and In-Situ Measurements

Absorption enhancement due to hygroscopic growth can vary from 1.1 to 2.7 for RH values greater than 80% [52,53,54]. However, the humidity effect on absorption is by far less relevant than the humidity effect on scattering [55]. For this reason, we will focus on aerosol light absorption only. In this section we compare AERONET retrieved surface aerosol light absorption coefficients with aerosol light absorption coefficients measured at the surface. The comparison is shown in Figure 3. Plots (a) and (b) of Figure 3 show that, similar to the the overall long-term record, the combined application of the “paradigm” and the screening scheme strongly limits the number of points of aerosol light absorption coefficients: from 321 to 121, about 60% of the data, in agreement with the relatively frequent occurrence (33% of the time) of dust and/or fire plumes in our region. On the other hand, this approach leads to a better correlation between AERONET and surface measurements (from r = 0.68 to 0.73). Both correlations continue to have a high significance also after the application of the screening scheme.

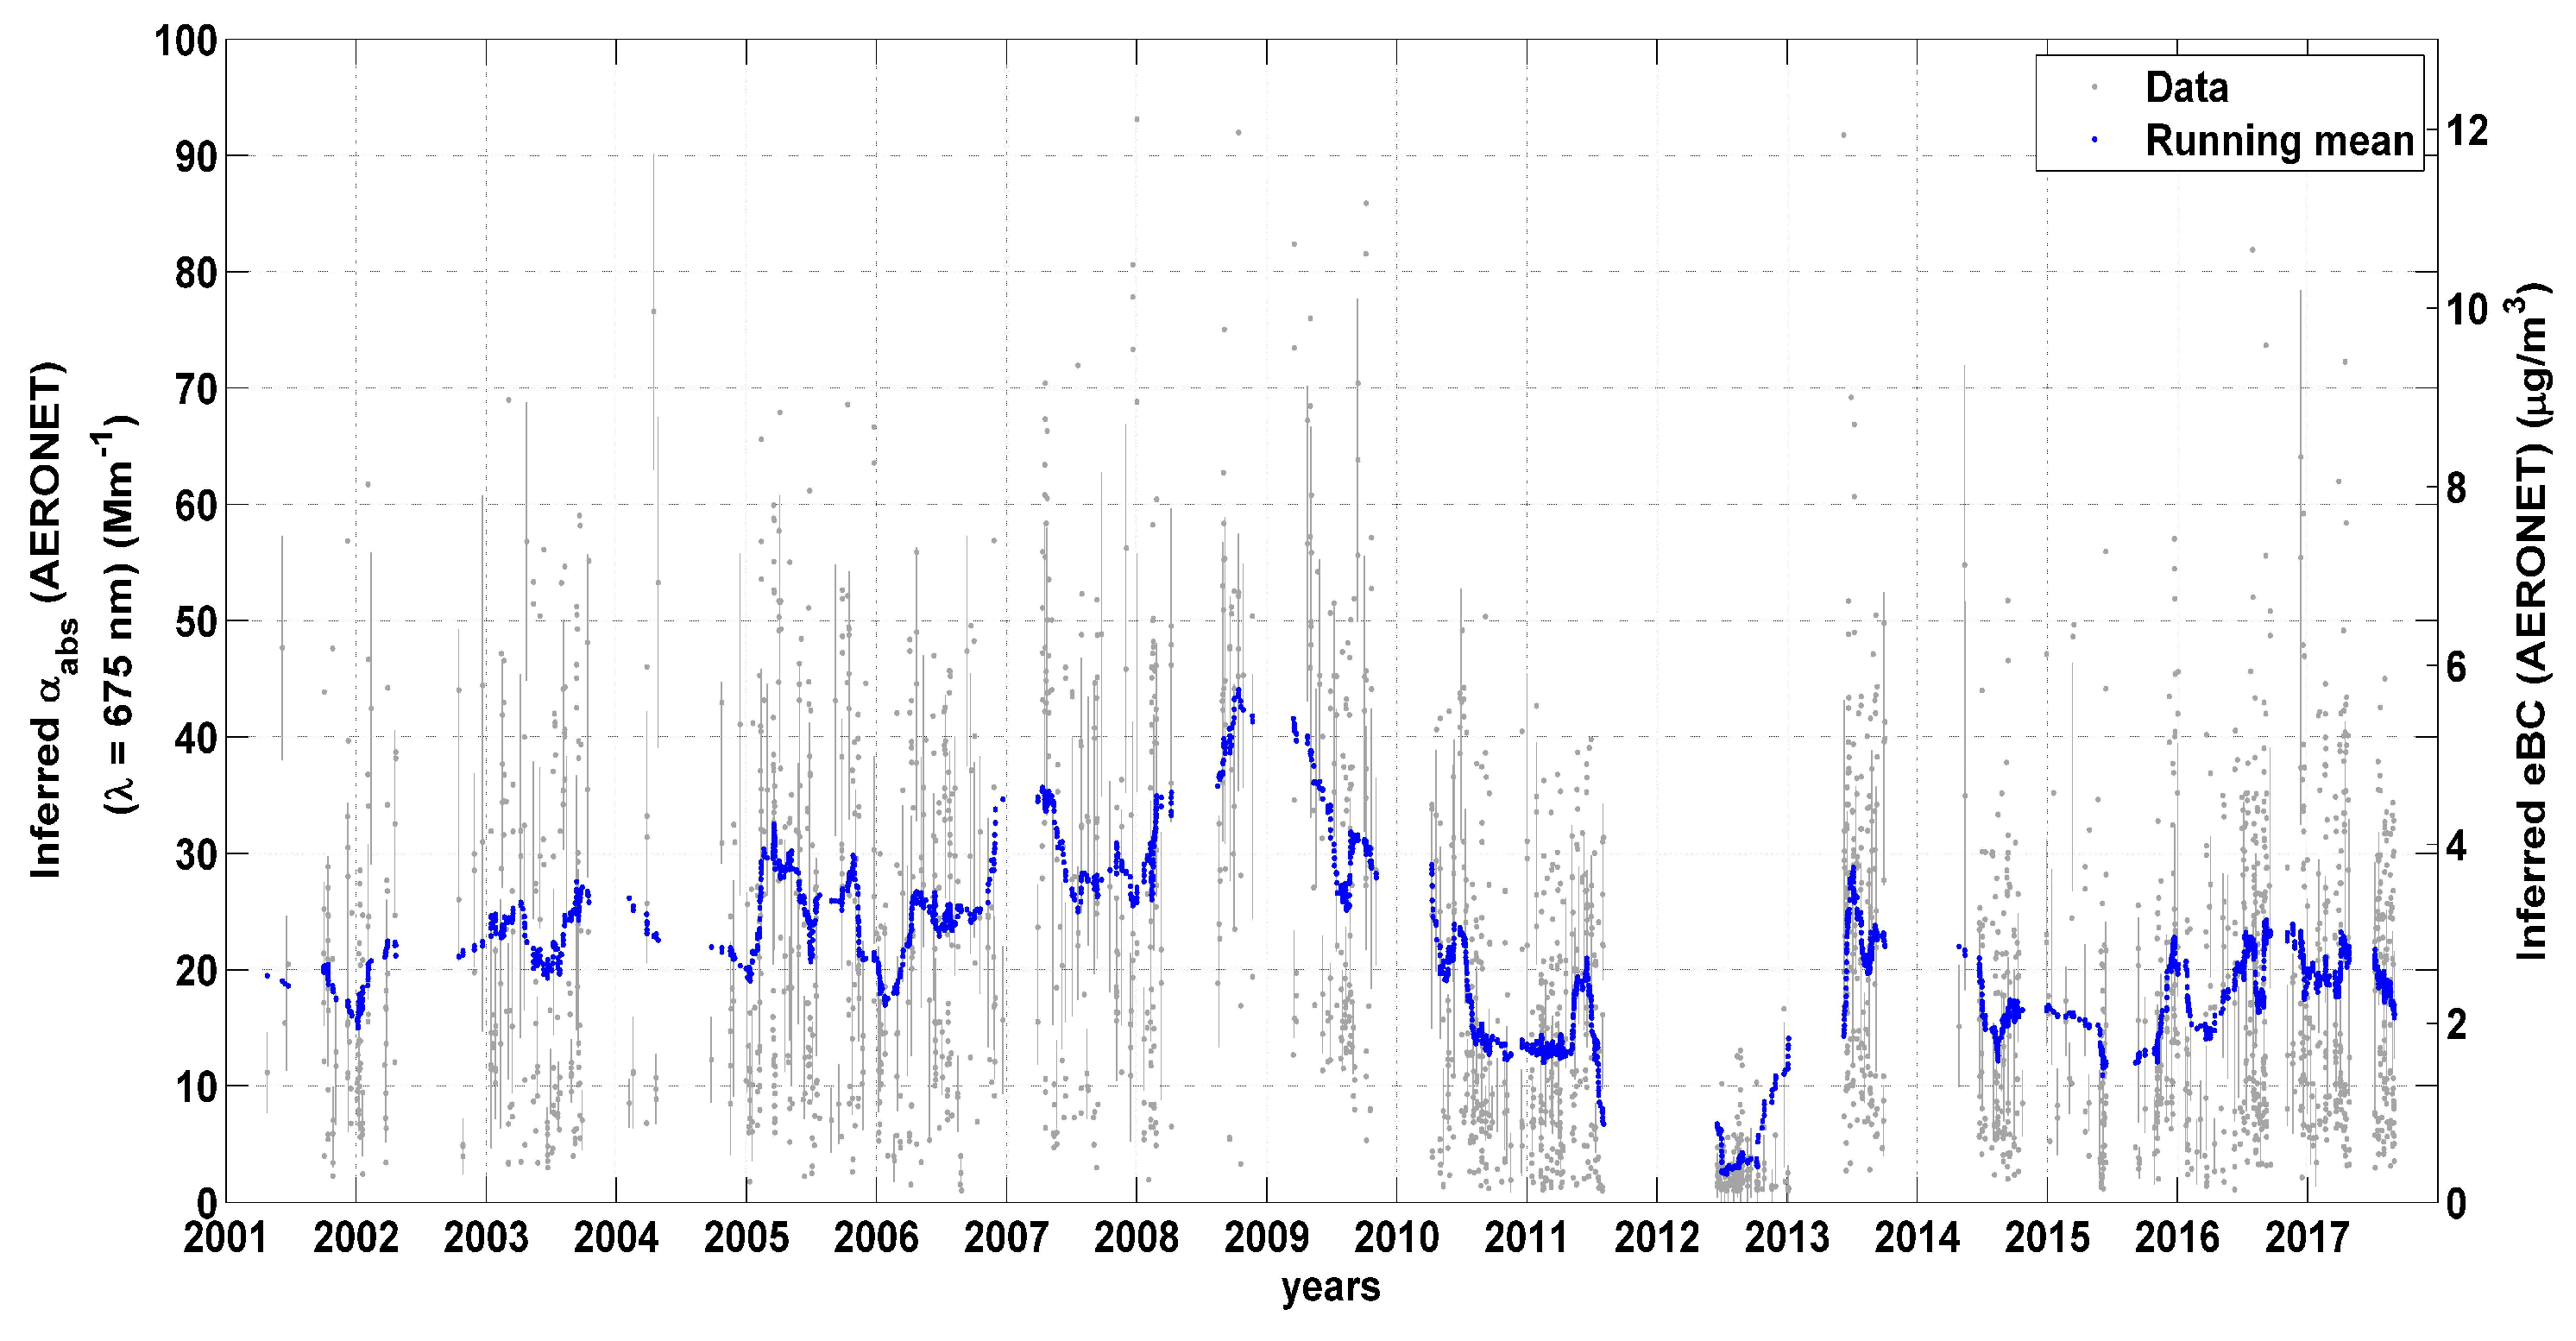
3.3. Long-Term Record of Surface Aerosol Light Absorption Properties Inferred from AERONET Columnar Measurements

Given the relatively good performance of our approach as presented in Figure 3, in Figure 4 we show results applying the same procedure (see also Section 2.2.1) to the overall 2001–2017 record of the surface aerosol light absorption coefficients α abs ( λ = 675 nm) inferred from AERONET data from January 2001 to August 2017 in Rome. Grey markers show inferred α abs values; blue markers show related running mean values (55 points). On the right y–axis the corresponding equivalent BC (eBC) mass concentration values ( μ g / m 3 ) are shown as described in Section 2.4. The average value (mean and standard deviation) for the whole α abs dataset is 20.67 ± 15.35 Mm 1 . Inferred surface α abs follow the same pattern of AODABS: the lowest values were observed from June to December 2012 (running mean = 4.42 Mm 1 ), and the highest values from August 2008 to April 2009 (running mean = 40.06 Mm 1 ). The corresponding eBC mass concentration average value (mean and standard deviation) is 2.66 ± 1.97 μ g / m 3 , with the lowest values observed from June to December 2012 (running mean = 0.57 μ g / m 3 ), and the highest values from August 2008 to April 2009 (running mean = 5.15 μ g / m 3 ).

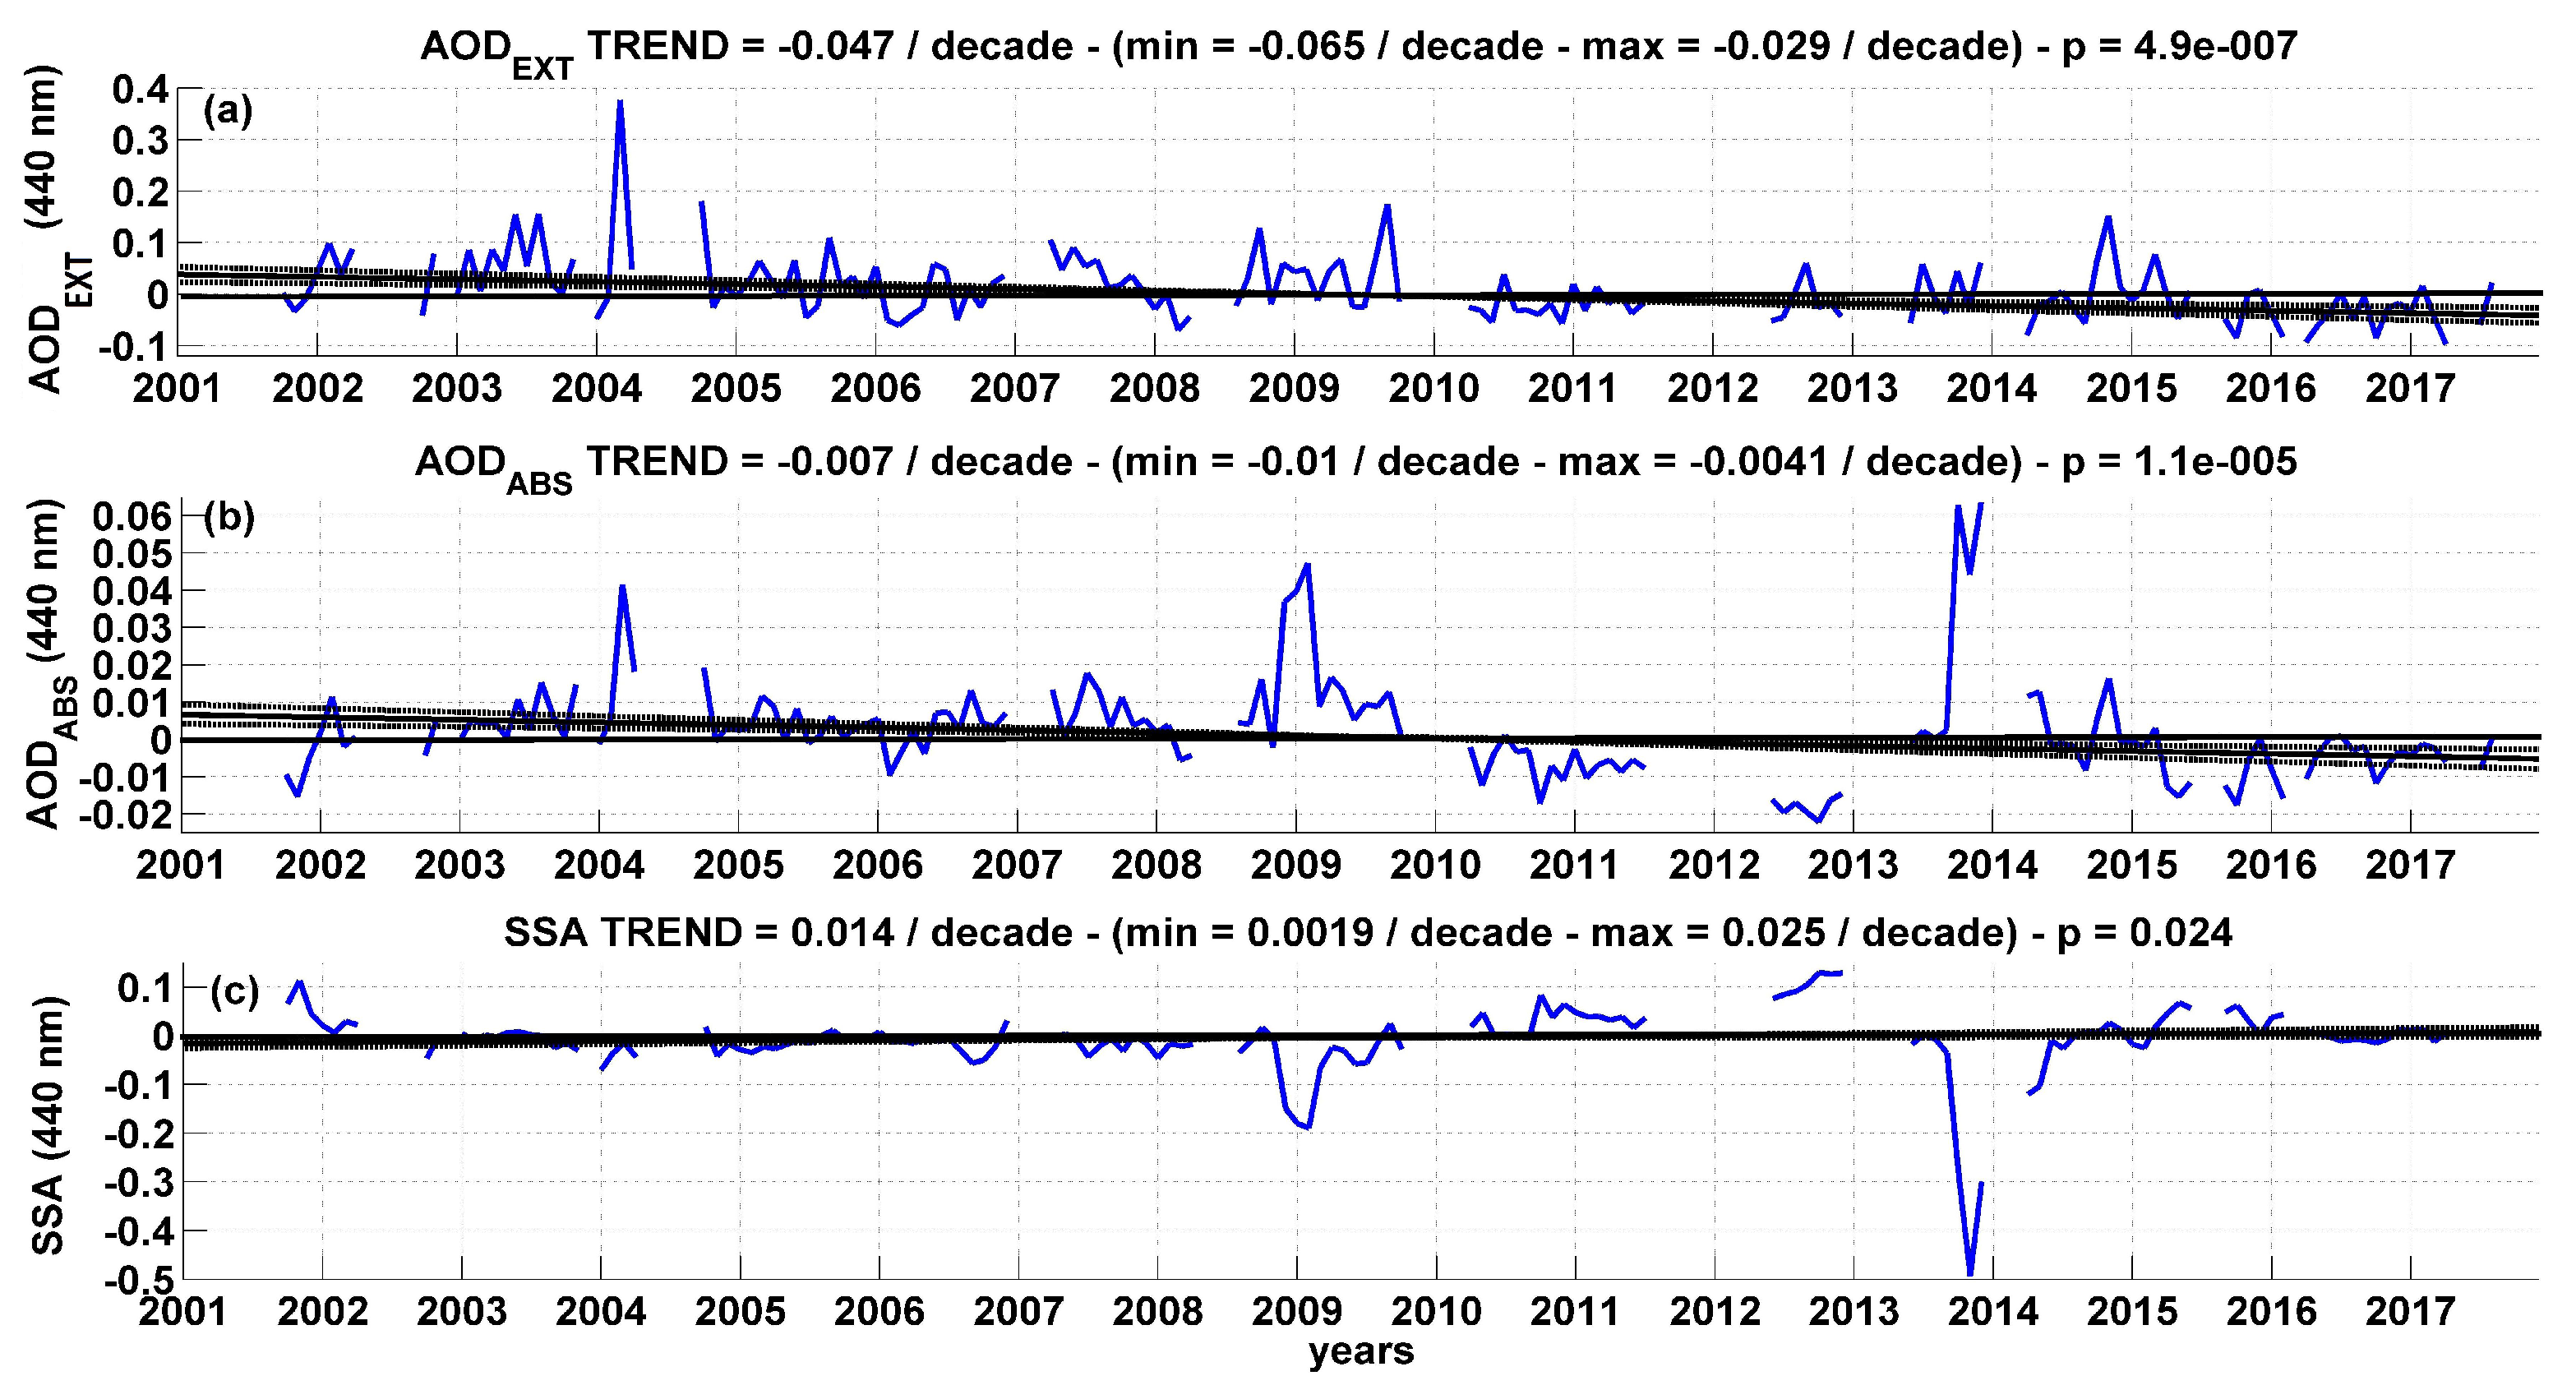
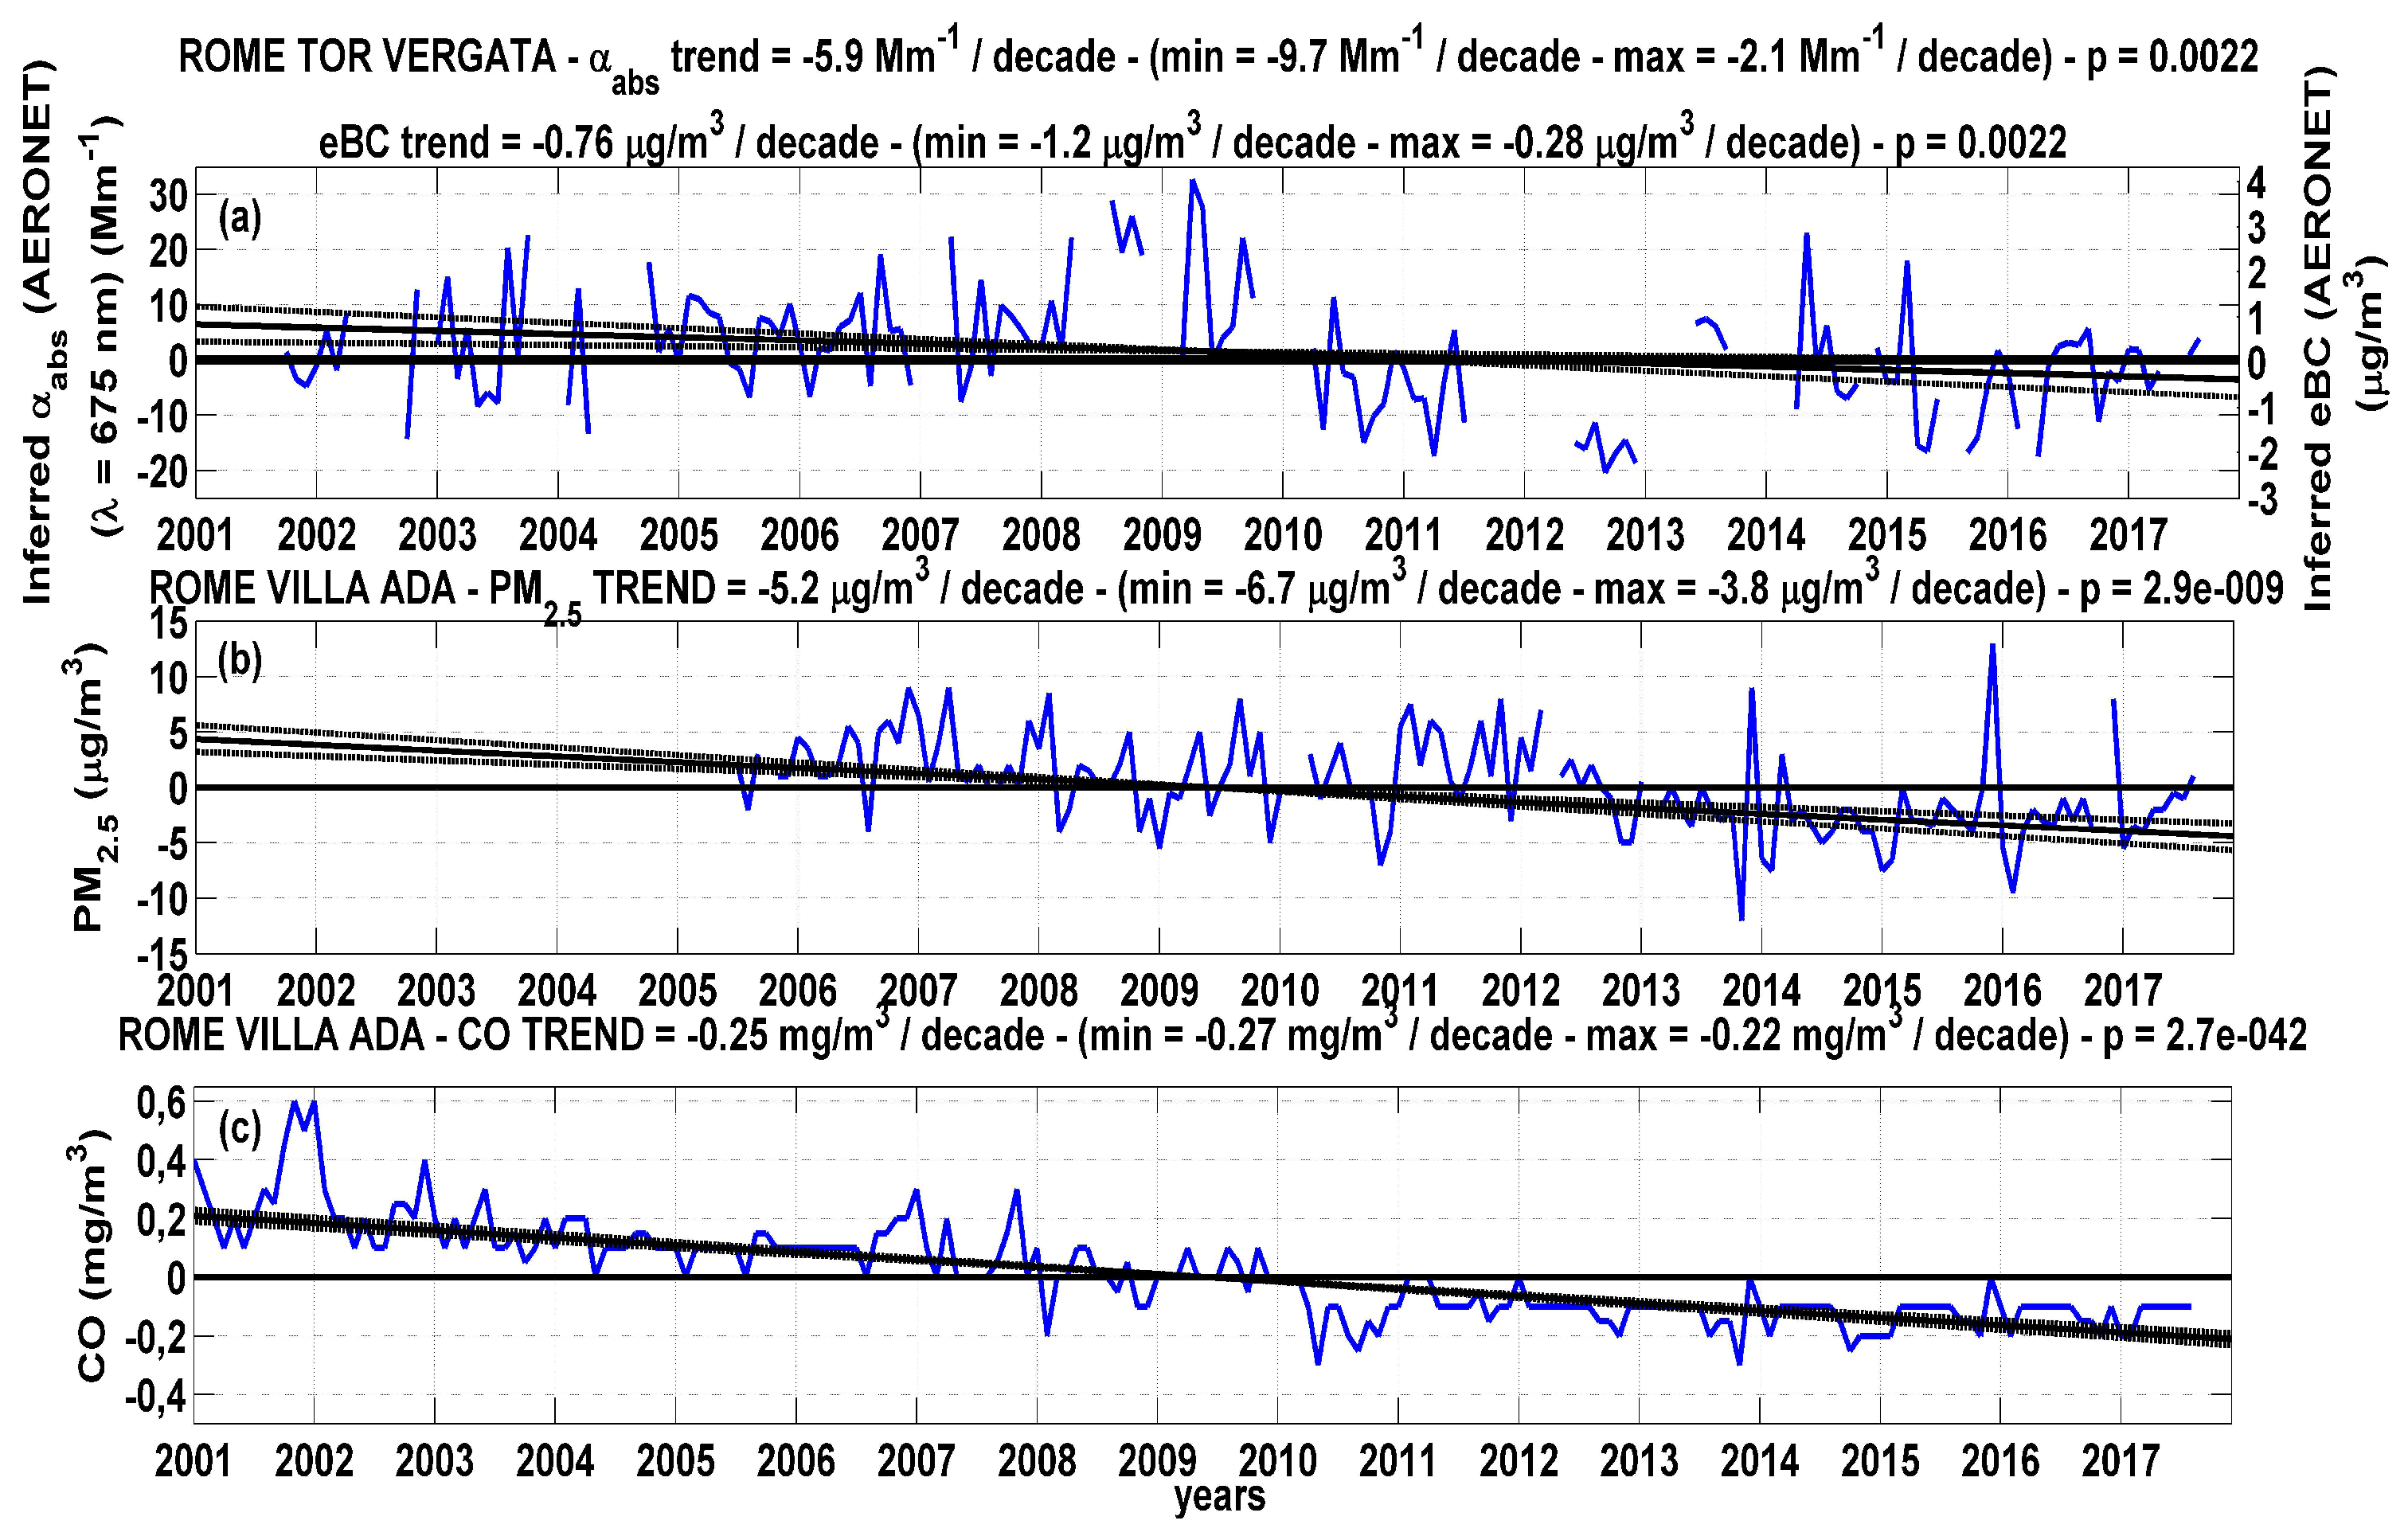
3.4. Long-Term Trends

In this section, we present long-term trends of surface aerosol light absorption coefficients inferred from AERONET data, in comparison to columnar optical and in-situ air quality parameters. This is shown in Figure 5 and Figure 6. The blue lines are the deseasonalized time series of monthly median anomalies. Black lines are the linear trends estimated using the Mann-Kendall test associated with Sen’s slope. Trends are presented for: AERONET AODEXT (Figure 5a), AERONET AODABS (Figure 5b), AERONET SSA (Figure 5c), AERONET inferred surface α abs and surface eBC mass concentration (Figure 6a), in-situ PM2.5 (Figure 6b) and in-situ measured carbon monoxide (CO) (Figure 6c). The magnitude of the trends is shown as Sen’s slope, together with its significance (p value). Section 2.5 and Section 2.5.1 contain the description of the method applied for the trend estimation.
Similar patterns can be seen for eBC mass concentration and AODABS, while a specular pattern is observed for SSA. Major positive anomalies for surface α abs and AODABS—and negative for SSA—are found in:March 2004 (positive anomaly for AODEXT, too), from August 2008 to April 2009, May 2014. Major negative anomalies for α abs and AODABS—and positive for SSA— are found in: November 2001 (negative anomaly for AODEXT, too), May and Semptember 2010, second half of 2012, April and September 2015 (negative anomaly for AODEXT too).
The estimated trends resulting from the Mann–Kendall test associated with Sen’s slope are as follows:
  • negative trend for AODEXT: −0.047/decade, with 90% uncertainty bounds of −0.065 and −0.029/decade;
  • negative trend for AODABS: –0.007/decade, with 90% uncertainty bounds of −0.01 and −0.0041/decade;
  • positive trend for SSA: +0.014/decade, with 90% uncertainty bounds of −0.0019 and 0.025/decade;
  • negative trend for α abs: −5.9 Mm−1/decade, with 90% uncertainty bounds of −9.7 to −2.1 Mm−1/decade;
  • negative trend for eBC mass concentration: −0.76 μ g / m 3 /decade, with 90% uncertainty bounds of −1.2 to −0.28 μ g / m 3 /decade;
  • negative trend for PM2.5: −5.2 μ g / m 3 /decade, with 90% uncertainty bounds of −6.7 to −3.8 μ g / m 3 /decade;
  • negative trend for CO: −0.25 mg/m 3 /decade, with 90% uncertainty bounds of −0.27 to −0.22 mg/m 3 /decade.
All detected trends are statistically significant. These trends are all negative but that of SSA, indicating that the contribution of absorption to extinction is decreasing faster than that of scattering.

4. Discussion

In this section we discuss the results presented in Section 3. First, we assess possible factors influencing the observed differences between AERONET inferred surface aerosol light absorption coefficients and in-situ measured surface aerosol light absorption coefficients (Section 4.1). In Section 4.2 we discuss the influence of atmospheric conditions. Comparison with previous work is presented in Section 4.3.

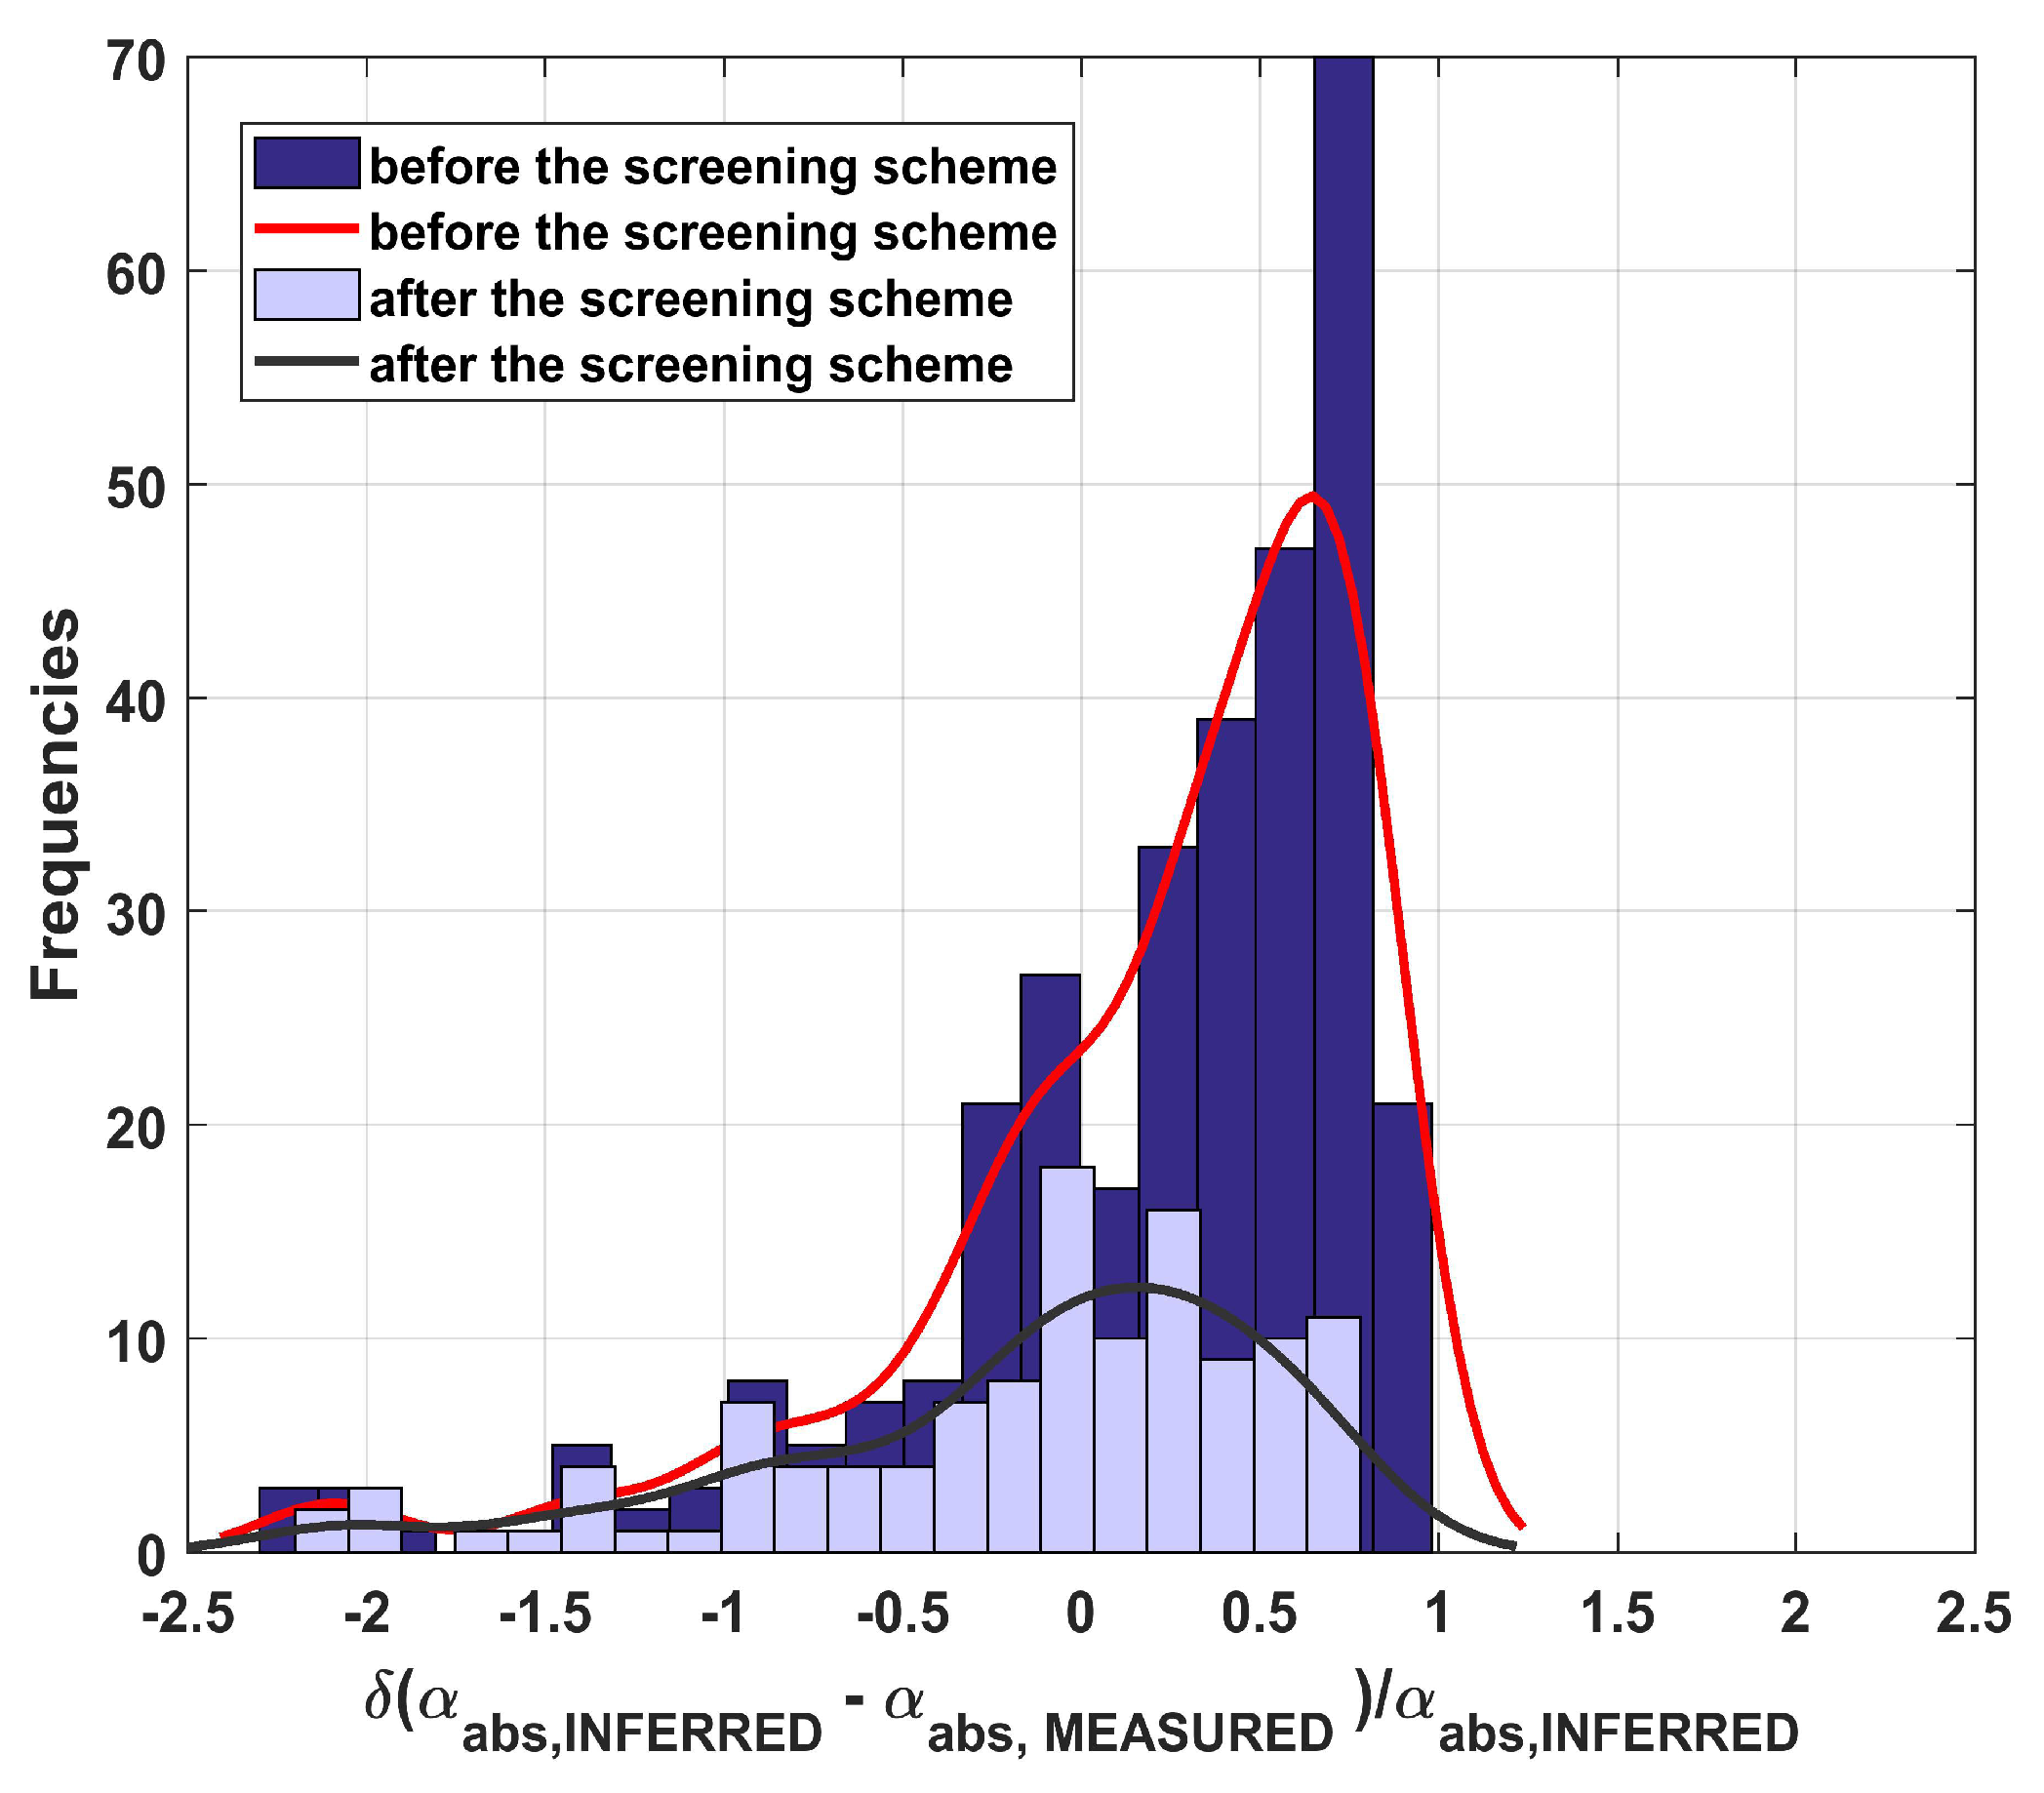
4.1. Influence of the Different Measurement Methods

In a previous study we addressed the issue of retrieving ground values of extinction coefficients out of sun-photometer columnar measurements [56]. It was found that retrieval of extinction by AERONET is more robust than that of absorption. However, the main problem in rescaling extinction to ground values is that the aerosol scattering (which accounts for about 90% of extinction) is highly dependent on particle size, which in turn is highly dependent on the atmospheric RH profile due to particle hygroscopicity. In-situ measurements of aerosol optical properties are typically performed in dry conditions while AERONET sounds columnar optical properties in “environmental conditions”. These differences introduce a major problem when comparing aerosol scattering from different platforms [53,56,57]. Conversely, aerosol absorption is separated, at least in principle, from scattering artifacts [58]. This means that, as an apparent paradox, rescaling of AERONET AODABS to ground-level absorption, and so converting the absorption coefficient provided by AERONET into a surface absorption coefficient (i.e., a value only affected by the conditions at the ground) is possibly less critical than doing it for extinction.
In this work, we applied the same screening scheme discussed in Section 2.2.3 to both scattering and absorption coefficients. This is presented in Figure S2 of the Supplementary Materials showing that scattering coefficients inferred from AERONET and those measured in-situ show a larger discrepancy than that observed for the absorption coefficients.
A numerical simulation (Mie theory) of the scattering and absorption efficiency (Qscatt and Qabs) vs. particle size within the visible wavelength range (467, 530 and 660 nm) is presented in Figure S3 of the Supplementary Materials. Figure S3 shows that Qscatt is more dependent on particle size than Qabs. In particular, the derivative of Qscatt is significantly larger than that of Qabs within the particle diameter range 100–400 nm, i.e., where typical aerosol effective diameters peak. This is consistent with previous findings indicating that even though the humidity effect on absorption is substantial, its maximum contribution to the humidity effect on extinction is very low (only 0.2% within the wavelength range from 450 to 700 nm) [55].
One reason could be that scattering is critically influenced by the aerosol measurement method: AERONET measurements deal with ambient, hydrated aerosols, while in-situ ones are typically taken in dry conditions (RH < 30%). In literature, the difference in scattering coefficients values measured at low and ambient RH reflects the net increase of scattering coefficients due to the hygroscopic growth of particles under ambient RH conditions [57]. Discussion of the poor conversion of the extinction coefficient is out of the scope of this paper.
Based on these findings, we decided to focus the work on the absorption coefficient only.
Our results show that in-situ measured surface aerosol light absorption coefficients and those inferred from AERONET are generally in a good agreement (Section 3.2), with AERONET inferred surface aerosol light absorption coefficients usually higher than in-situ measured ones. This findings is in line with a recent study comparing AERONET retrievals and in-situ profiling measurements, and concluding that either AERONET retrievals overestimate absorbing aerosol or the in-situ measurements underestimate aerosol absorption [19]. To clarify this aspect, additional research would be useful. Here we mention only a few aspects which could have influenced our data.
First, AERONET data are taken under ambient conditions, whereas in-situ surface measurements were typically performed under dry conditions (RH < 30%). Despite absorption enhancement due to RH can be large [52,53,54], this is by far lower than the effect on scattering [55].
Solar absorption by eBC mass concentration is enhanced when it is coated with water, which may be much more likely in the vicinity of clouds: the model of [59] estimated solar absorption enhancement to be a factor of 2 to 4, depending on the size of the eBC mass concentration particle. This could therefore be a major issue in explaining differences.
Second, AERONET data are acquired only during direct sunlight, and clear sky conditions. Uncertainty in the retrieval of AERONET parameters due to clear-sky bias has been estimated to be around ±5% [4]. Conversely, in-situ eBC mass concentration is measured continuously (24-h, day and night, all sky conditions). To solve this issue, we had to extract a subset of in-situ eBC mass concentration measurements when AERONET data were available (cf. coincident measurements, Table 4).
Third, unlike in-situ surface measurements (PSAP, MAAP), AERONET absorption data are the result of indirect measurements. Additionally, both AERONET and in-situ measurements represent the light absorption due to the bulk aerosol, and not to eBC mass concentration (i.e., one of its components).
To minimize the influence of light absorbing aerosols other than BC (i.e., dust and brown carbon), we:
  • eliminated cases when the bulk aerosol was dominated by dust and/or fire plumes (see Section 2.2.3);
  • analysed only data in the red region (wavelength of 660–675 nm), where the absorption due to brown carbon is expected to be negligible [60].
In this way, we also contribute to reducing the uncertainty attributable to the lensing effect by brown carbon, that has been shown theoretically to enhance the absorption by a factor of 1.7 up to 2.4 [60].

4.2. Influence of Atmospheric Conditions

Relating columnar aerosol quantities to ground-level ones is challenging for a number of reasons, one of the main ones being the variable vertical distribution of particles along the atmospheric column. For example, a study performed in Ispra (Northern Italy) showed that while in winter up to 90% of the AODEXT is build up within the lowermost 500 m, in summer this percentage goes down to 30%, the majority of AODEXT being due to aerosols layers reaching up to 1500 m [56]. In the present study this issue was taken into account by rescaling AODABS to ground levels values using MLH datasets. However, this procedure is limited for three main reasons:
  • it does not consider the vertical inhomogeneity of the aerosol load within the MLH;
  • MLH can be quite heterogeneous even at the urban scale, thus caution should be used in comparing ground values obtained at different locations using the same MLH value;
  • it does not take into account the potential presence of absorbing elevated layers aloft, as desert dust and biomass burning plumes, which were demonstrated to have a non negligible impact on AODEXT in the investigated area [11,23].
Results of Figure 3 show that the applied screening scheme strongly limits the number of aerosol light absorption coefficient measurements (from 321 to 121), and leads to a better correlation between AERONET and surface measurements (from r = 0.68 to 0.73). We believe our screening-scheme to be quite effective at eliminating cases affected by elevated layers of desert dust and/or fire plumes. As an example, note that all the DIAPASON measurements (red markers) disappear because, as well documented elsewhere, these data were affected by dust [13,14].
To support our results, we show in Figure S5 of the Supplementary Materials the two most relevant cases of dust advections detected by the lidar-ceilometer at the site of Rome Tor Vergata (data available at http://www.alice-net.eu/): between 22 May 2014 and 10 February 2017.
In detail, in Figure S5 the average range-corrected backscatter signal intensity as a function of time and height above ground level is shown: the high values (yellow to orange/red color) mark the regions and times where dust is present. The screening scheme developed in this work correctly removes from the dataset the data related to these two “dust days”, together with other measurements affected by dust.
To exclude the influence of dust particles from the aerosol bulk, we applied proper threshold values on the SAE, together with thresholds on SSA530, AAE440–675 and dSSA675–440 × AAE (Table 3, based on [22]).
This scheme was intended to identify conditions of “pure” dust. To exclude all conditions in which dust was present (i.e., mixed aerosols), we decided to add this screening scheme. After the screening scheme, all the SAE440–675 values are within 0.69 and 2.09 (Figure S4 in the Supplementary Materials). So, we are confident that dust was eliminated (i.e., the screening scheme in Table 1 removed all data with SAE440–675 < 0.5, which were not excluded from the “paradigm” in Table 3.
To conclude, Figure 7 shows that the differences between AERONET-inferred and in-situ measured surface α abs peak closer to 0 after application of the screening scheme.

4.3. Comparison with Previous Studies

In this section, we compare our findings to others from the literature. No previous long-term trend for eBC mass concentration in the area of Rome is available, but there are prior studies that have measured in-situ eBC mass concentrations during intensive field campaigns. Here we compare our results with those from two other sites in Rome (Rome Montelibretti and Rome Villa Ada, Table 4) [24,61] for which no coincident measurement analysis could be done.
This comparison is described in Table 4 showing: measurement sites, measurement periods, and average values (mean ( μ ) and standard deviation ( σ )) both for coincident measurements and for the whole campaign, and associated differences. These are presented as absolute values of the mean differences, MD (%) calculated as:
MD ( % ) = M . A . D . A . M . · 100
where M.A.D. is the mean absolute difference between eBC mass concentration inferred from AERONET and in-situ measured eBC mass concentration, and A.M. is the arithmetic mean of the two measurements.
Comparisons with these sites, support some of previous results and show that:
  • eBC mass concentrations inferred from AERONET measurements are generally higher than those measured in-situ;
  • minimum differences mostly occur during winter (MD of 22% at the site of Rome Villa Ada);
  • largest differences occur in summer and spring (MD of 121% at the site of Rome Montelibretti).
The long-term trends of AERONET AODEXT, AODABS and SSA in Rome estimated in this work (Section 3.4) at the site of Rome Tor Vergata are consistent with those measured at two Italian sites (Lecce University and Ispra) and at other European sites (Avignon and Barcelona) [46,62]. In Table 5 we compare our findings to results obtained at different locations. Note that the decrease of SSA obtained in Ispra cannot be explained from the measurements of elemental carbon (EC) and PM2.5 concentrations alone, since no constant increase of the EC/PM2.5 ratio was observed during this period. A possible explanation for the decrease in SSA could be the increase in the contribution of light-absorbing organic matter to light absorption during cold months [62]. In addition, there is consistency with trends of aerosol optical properties derived from in-situ measurements in sites reported by [63], in which global positive SSA trends coupled with negative AODABS trends are found in Europe. The AODEXT reduction observed at the site of Rome and in general in Europe is possibly due to reduced fine-mode anthropogenic emissions. Trend estimates are important to address interesting questions regarding the effects of pollution control measures taken especially in developed countries. In this respect, we compared our trends with those relative to PM2.5 and CO at the city of Rome and we found consistency.

5. Conclusions

This work attempts a long-term (2001–2017) inference of equivalent black carbon mass concentration (eBC) in the city of Rome (Italy) based on sun-photometry absorption data.
The main focus of this work is to rescale aerosol light absorption columnar data (AERONET) to ground-level BC data. This is done by using values of mixing layer height (MLH) derived from ceilometer measurements and then by converting obtained absorption coefficients into eBC mass concentrations through a mass-to-absorption conversion factor (MAE). The final aim is to obtain relevant data representative of the BC aerosol concentration at the surface (i.e., in-situ)—within the MLH—and then to infer a long-term record of “surface” equivalent black carbon mass concentration in Rome.
From our experience, due to the limited impact of RH on absorption relative to scattering, inference of ground-level (dry) absorption coefficients can be less uncertain than for the extinction coefficient.
To achieve our objective, aerosol light absorption coefficient data at the surface are inferred on the basis of the ”columnar” aerosol light absorption coefficient records from the Rome Tor Vergata AERONET sun-photometer.
To evaluate the accuracy of this procedure, we compared the AERONET-based results to those from in-situ measurements of aerosol light absorption coefficients ( α abs) collected during some intensive field campaigns performed in Rome between 2010 and 2017. This analysis shows that different measurement methods, local emissions, and atmospheric conditions (MLH, residual layers) are some of the most important factors influencing differences between inferred and measured α abs.
As a general result, ”inferred” and ”measured” α abs reach quite a good correlation (up to r = 0.73) after a screening procedure that excludes one of the major causes of discrepancy between AERONET inferred and in-situ measured α abs: the presence of highly absorbing aerosol layers at high altitude (e.g., dust), that frequently affect the Mediterranean site of Rome.
Long-term trends of "inferred" α abs, eBC mass concentration, and of the major optical variables that control aerosol’s direct radiative forcing (extinction aerosol optical depth, AODEXT, absorption aerosol optical depth, AODABS, and single scattering albedo, SSA) have been estimated. For this estimate, the Mann-Kendall statistical test associated with Sen’s slope was used.
These estimates show a negative trend for both AODEXT (−0.047/decade) and AODABS (−0.007/decade). The latter converts into a negative trend for the α abs of −5.9 Mm−1 and for eBC mass concentration of −0.76 μ g / m 3 /decade. A positive trend is found for SSA (+0.014/decade), indicating that the contribution of absorption to extinction is decreasing faster than that of scattering. These long-term trends are consistent with those of other air pollutant concentrations (i.e., PM2.5 and CO) in the Rome area.
Despite some limitations, findings of this study fill a current lack in BC observations and may bear useful implications with regard to the improvement of our understanding of the impact of BC on air quality and climate in this Mediterranean urban region.

Supplementary Materials

The following are available online at https://www.mdpi.com/2073-4433/9/3/81/s1, Figure S1: Scatter plots of: (a) α ext, (b) α abs and (c) α scatt in-situ measured (x-axis) vs. inferred from AERONET measurements (y-axis) for hourly MLH values before the application of the screening scheme. Color of the markers indicates the hourly MLH values (m). Black line is the 1-to-1 line. ±15 min average values of α ext, α abs and α scatt are used (321 points); Figure S2: Scatter plots of: (a) α ext, (b) α abs and (c) α scatt in-situ measured (x-axis) vs. inferred from AERONET (y-axis) for hourly MLH values after the application of the screening scheme. Color of the markers indicates the hourly MLH values (m). Black line is the 1-to-1 line. ±15 min average values of α ext, α abs and α scatt are used (121 points); Figure S3: Simulation of the absorption (Qabs) and scattering efficiency (Qscatt) with varying particle diameter (Dp) at three wavelengths (467 nm, 530 nm and 660 nm); Figure S4: Scatter plots of: (x-axis) surface α abs obtained from in-situ measurements, (y-axis) α abs obtained from AERONET data. The color code in panels shows the Scattering Ångström Exponent (SAE) values at 440 and 675 nm. Black line is the 1-to-1 line. ±15 min average values are shown. Panel (a) shows all data (321 points), panel (b) shows data after the application of the screening scheme (121 points); Figure S5: Detection of the Saharan dust with the lidar-ceilometer based at the site of Rome Tor Vergata during the 22 May 2014 (a) and 10 February 2017 (b): average range-corrected backscatter signal intensity as a function of time and height above ground level.

Acknowledgments

We acknowledge support from the DIAPASON project funded by the EU LIFE+ programme (LIFE+10 ENV/IT/391). We thank the Arpa Lazio Environmental Agency for providing chemical data. We thank the two anonymous referees for their constructive reviewing of the manuscript.

Author Contributions

Antonio Di Ianni wrote the manuscript with support from Francesca Barnaba, Francesca Costabile, Gian Paolo Gobbi, Frank Drewnick, Alfred Wiedensohler and Luca Di Liberto. Luca Di Liberto, Francesca Barnaba, Gian Paolo Gobbi, Francesca Costabile, Kay Weinhold, Alfred Wiedensohler, Caroline Struckmeier and Frank Drewnick carried out the measurements. Francesca Costabile, Antonio Di Ianni, Francesca Barnaba, Luca Di Liberto and Gian Paolo Gobbi conceived the conceptual framework of the study, and planned the analysis experiments. Antonio Di Ianni performed the numerical calculations for the suggested experiments and analysed data. Antonio Di Ianni, Francesca Barnaba, Francesca Costabile, Frank Drewnick, Gian Paolo Gobbi, Luca Di Liberto and Kay Weinhold verified the analytical methods. Antonio Di Ianni, Francesca Costabile, Francesca Barnaba, Gian Paolo Gobbi and Luca Di Liberto contributed to the interpretation of the results. Antonio Di Ianni, Francesca Costabile, Francesca Barnaba, Gian Paolo Gobbi and Luca Di Liberto contributed to the revision of the manuscript. All the authors contributed with suggestions and recommendations to the article, to the final check of the manuscript and approved it.

Conflicts of Interest

The authors declare no conflict of interest.

References

  1. Ramanathan, V.; Carmichael, G. Global and regional climate changes due to black carbon. Nat. Geosci. 2008, 1, 221–227. [Google Scholar] [CrossRef]
  2. Janssen, N.A.; Gerlofs-Nijland, M.E.; Lanki, T.; Salonen, R.O.; Cassee, F.; Hoek, G.; Fischer, P.; Brunekreef, B.; Krzyzanowski, M. Health Effects of Black Carbon; WHO Regional Office for Europe Copenhagen: Copenhagen, Denmark, 2012. [Google Scholar]
  3. Graedel, T.; Allwood, J.; Birat, J.; Reck, B.; Sibley, S.; Sonnemann, G.; Buchert, M.; Hagelüken, C. A Report of the Working Group on the Global Metal Flows to the International Resource Panel, United Nations Environment Programme; UNEP Recycling Rates of Metals-A Status Report; UNEP: Nairobi, Kenya, 2011. [Google Scholar]
  4. Bond, T.C.; Doherty, S.J.; Fahey, D.; Forster, P.; Berntsen, T.; DeAngelo, B.; Flanner, M.; Ghan, S.; Kärcher, B.; Koch, D.; et al. Bounding the role of black carbon in the climate system: A scientific assessment. J. Geophys. Res. Atmos. 2013, 118, 5380–5552. [Google Scholar] [CrossRef] [Green Version]
  5. Smith, J.B.; Schneider, S.H.; Oppenheimer, M.; Yohe, G.W.; Hare, W.; Mastrandrea, M.D.; Patwardhan, A.; Burton, I.; Corfee-Morlot, J.; Magadza, C.H.; et al. Assessing dangerous climate change through an update of the Intergovernmental Panel on Climate Change (IPCC)“reasons for concern”. Proc. Natl. Acad. Sci. USA 2009, 106, 4133–4137. [Google Scholar] [CrossRef] [PubMed]
  6. Aquila, V.; Hendricks, J.; Lauer, A.; Riemer, N.; Vogel, H.; Baumgardner, D.; Minikin, A.; Petzold, A.; Schwarz, J.; Spackman, J.; et al. MADE-in: A new aerosol microphysics submodel for global simulation of insoluble particles and their mixing state. Geosci. Model Dev. 2011, 4, 325–355. [Google Scholar] [CrossRef] [Green Version]
  7. Reddington, C.; McMeeking, G.; Mann, G.; Coe, H.; Frontoso, M.; Liu, D.; Flynn, M.; Spracklen, D.; Carslaw, K. The mass and number size distributions of black carbon aerosol over Europe. Atmos. Chem. Phys. 2013, 13, 4917–4939. [Google Scholar] [CrossRef]
  8. Wild, M. Global dimming and brightening: A review. J. Geophys. Res. Atmos. 2009, 114, D00D16. [Google Scholar] [CrossRef]
  9. Stocker, T.F. Climate Change 2013: The Physical Science Basis: Working Group I Contribution to the Fifth Assessment Report of the Intergovernmental Panel on Climate Change; Cambridge University Press: Cambridge, UK, 2014. [Google Scholar]
  10. Struckmeier, C.; Drewnick, F.; Fachinger, F.; Gobbi, G.P.; Borrmann, S. Atmospheric aerosols in Rome, Italy: Sources, dynamics and spatial variations during two seasons. Atmos. Chem. Phys. 2016, 16, 15277–15299. [Google Scholar] [CrossRef]
  11. Barnaba, F.; Gobbi, G.P. Aerosol seasonal variability over the Mediterranean region and relative impact of maritime, continental and Saharan dust particles over the basin from MODIS data in the year 2001. Atmos. Chem. Phys. 2004, 4, 2367–2391. [Google Scholar] [CrossRef]
  12. Costabile, F.; Angelini, F.; Barnaba, F.; Gobbi, G.P. Partitioning of Black Carbon between ultrafine and fine particle modes in an urban airport vs. urban background environment. Atmos. Environ. 2015, 102, 136–144. [Google Scholar] [CrossRef]
  13. Barnaba, F.; Bolignano, A.; Di Liberto, L.; Morelli, M.; Lucarelli, F.; Nava, S.; Perrino, C.; Canepari, S.; Basart, S.; Costabile, F.; et al. Desert dust contribution to PM10 loads in Italy: Methods and recommendations addressing the relevant European Commission Guidelines in support to the Air Quality Directive 2008/50. Atmos. Environ. 2017, 161, 288–305. [Google Scholar] [CrossRef]
  14. Rizza, U.; Barnaba, F.; Miglietta, M.M.; Mangia, C.; Di Liberto, L.; Dionisi, D.; Costabile, F.; Grasso, F.; Gobbi, G.P. WRF-Chem model simulations of a dust outbreak over the central Mediterranean and comparison with multi-sensor desert dust observations. Atmos. Chem. Phys. 2017, 17, 93. [Google Scholar] [CrossRef]
  15. Costabile, F.; Alas, H.; Aufderheide, M.; Avino, P.; Amato, F.; Argentini, S.; Barnaba, F.; Berico, M.; Bernardoni, V.; Biondi, R.; et al. First results of the “Carbonaceous aerosol in Rome and Environs (CARE)” experiment: Beyond current standards for PM10. Atmosphere 2017, 8, 249. [Google Scholar] [CrossRef]
  16. Holben, B.; Eck, T.; Slutsker, I.; Tanre, D.; Buis, J.; Setzer, A.; Vermote, E.; Reagan, J.; Kaufman, Y.; Nakajima, T.; et al. AERONET—A federated instrument network and data archive for aerosol characterization. Remote Sens. Environ. 1998, 66, 1–16. [Google Scholar] [CrossRef]
  17. Dubovik, O.; King, M.D. A flexible inversion algorithm for retrieval of aerosol optical properties from Sun and sky radiance measurements. J. Geophys. Res. Atmos. 2000, 105, 20673–20696. [Google Scholar] [CrossRef]
  18. Dubovik, O.; Smirnov, A.; Holben, B.; King, M.; Kaufman, Y.; Eck, T.; Slutsker, I. Accuracy assessments of aerosol optical properties retrieved from Aerosol Robotic Network (AERONET) Sun and sky radiance measurements. J. Geophys. Res. Atmos. 2000, 105, 9791–9806. [Google Scholar] [CrossRef]
  19. Andrews, E.; Ogren, J.A.; Kinne, S.; Samset, B. Comparison of AOD, AAOD and column single scattering albedo from AERONET retrievals and in situ profiling measurements. Atmos. Chem. Phys. 2017, 17, 6041–6072. [Google Scholar] [CrossRef]
  20. Holben, B.; Eck, T.; Slutsker, I.; Smirnov, A.; Sinyuk, A.; Schafer, J.; Giles, D.; Dubovik, O. AERONET’s version 2.0 quality assurance criteria. In Proceedings of the Asia-Pacific Remote Sensing Symposium on International Society for Optics and Photonics, Goa, India, 8 December 2006. [Google Scholar]
  21. Angelini, F.; Gobbi, G.P. Some remarks about lidar data preprocessing and different implementations of the gradient method for determining the aerosol layers. Ann. Geophys. 2014, 57. [Google Scholar] [CrossRef]
  22. Costabile, F.; Barnaba, F.; Angelini, F.; Gobbi, G.P. Identification of key aerosol populations through their size and composition resolved spectral scattering and absorption. Atmos. Chem. Phys. 2013, 13, 2455–2470. [Google Scholar] [CrossRef]
  23. Barnaba, F.; Angelini, F.; Curci, G.; Gobbi, G.P. An important fingerprint of wildfires on the European aerosol load. Atmos. Chem. Phys. 2011, 11, 10487–10501. [Google Scholar] [CrossRef] [Green Version]
  24. Costabile, F.; Amoroso, A.; Wang, F. Sub-μm particle size distributions in a suburban Mediterranean area. Aerosol populations and their possible relationship with HONO mixing ratios. Atmos. Environ. 2010, 44, 5258–5268. [Google Scholar] [CrossRef]
  25. Bond, T.C.; Anderson, T.L.; Campbell, D. Calibration and intercomparison of filter-based measurements of visible light absorption by aerosols. Aerosol Sci. Technol. 1999, 30, 582–600. [Google Scholar] [CrossRef]
  26. Virkkula, A.; Ahlquist, N.C.; Covert, D.S.; Arnott, W.P.; Sheridan, P.J.; Quinn, P.K.; Coffman, D.J. Modification, calibration and a field test of an instrument for measuring light absorption by particles. Aerosol Sci. Technol. 2005, 39, 68–83. [Google Scholar] [CrossRef]
  27. Lack, D.A.; Cappa, C.D.; Covert, D.S.; Baynard, T.; Massoli, P.; Sierau, B.; Bates, T.S.; Quinn, P.K.; Lovejoy, E.R.; Ravishankara, A. Bias in filter-based aerosol light absorption measurements due to organic aerosol loading: Evidence from ambient measurements. Aerosol Sci. Technol. 2008, 42, 1033–1041. [Google Scholar] [CrossRef]
  28. Cappa, C.D.; Lack, D.A.; Burkholder, J.B.; Ravishankara, A. Bias in filter-based aerosol light absorption measurements due to organic aerosol loading: Evidence from laboratory measurements. Aerosol Sci. Technol. 2008, 42, 1022–1032. [Google Scholar] [CrossRef]
  29. Zhang, Q.; Jimenez, J.; Canagaratna, M.; Allan, J.; Coe, H.; Ulbrich, I.; Alfarra, M.; Takami, A.; Middlebrook, A.; Sun, Y.; et al. Ubiquity and dominance of oxygenated species in organic aerosols in anthropogenically-influenced Northern Hemisphere midlatitudes. Geophys. Res. Lett. 2007, 34, L13801. [Google Scholar] [CrossRef]
  30. Müller, T.A.; Henzing, J.; Leeuw, G.D.; Wiedensohler, A.; Alastuey, A.; Angelov, H.; Bizjak, M.; Collaud Coen, M.; Engström, J.; Gruening, C.; et al. Characterization and intercomparison of aerosol absorption photometers: Result of two intercomparison workshops. Atmos. Meas. Tech. 2011, 4, 245–268. [Google Scholar] [CrossRef] [Green Version]
  31. Schmid, H.; Laskus, L.; Abraham, H.J.; Baltensperger, U.; Lavanchy, V.; Bizjak, M.; Burba, P.; Cachier, H.; Crow, D.; Chow, J.; et al. Results of the “carbon conference” international aerosol carbon round robin test stage I. Atmos. Environ. 2001, 35, 2111–2121. [Google Scholar] [CrossRef]
  32. Nordmann, S.; Birmili, W.; Weinhold, K.; Müller, K.; Spindler, G.; Wiedensohler, A. Measurements of the mass absorption cross section of atmospheric soot particles using Raman spectroscopy. J. Geophys. Res. Atmos. 2013, 118, 12075–12085. [Google Scholar] [CrossRef]
  33. Kirchstetter, T.W.; Novakov, T.; Hobbs, P.V. Evidence that the spectral dependence of light absorption by aerosols is affected by organic carbon. J. Geophys. Res. Atmos. 2004, 109. [Google Scholar] [CrossRef]
  34. Costabile, F.; Gilardoni, S.; Barnaba, F.; Di Ianni, A.; Di Liberto, L.; Dionisi, D.; Manigrasso, M.; Paglione, M.; Poluzzi, V.; Rinaldi, M.; et al. Characteristics of brown carbon in the urban Po Valley atmosphere. Atmos. Chem. Phys. 2017, 17, 313–326. [Google Scholar] [CrossRef]
  35. Bahadur, R.; Praveen, P.S.; Xu, Y.; Ramanathan, V. Solar absorption by elemental and brown carbon determined from spectral observations. Proc. Natl. Acad. Sci. USA 2012, 109, 17366–17371. [Google Scholar] [CrossRef] [PubMed]
  36. Bergstrom, R.W.; Russell, P.B.; Hignett, P. Wavelength dependence of the absorption of black carbon particles: Predictions and results from the TARFOX experiment and implications for the aerosol single scattering albedo. J. Atmos. Sci. 2002, 59, 567–577. [Google Scholar] [CrossRef]
  37. Gyawali, M.; Arnott, W.; Lewis, K.; Moosmüller, H. In situ aerosol optics in Reno, NV, USA during and after the summer 2008 California wildfires and the influence of absorbing and non-absorbing organic coatings on spectral light absorption. Atmos. Chem. Phys. 2009, 9, 8007–8015. [Google Scholar] [CrossRef]
  38. Moosmüller, H.; Chakrabarty, R.; Ehlers, K.; Arnott, W. Absorption Ångström coefficient, brown carbon, and aerosols: Basic concepts, bulk matter, and spherical particles. Atmos. Chem. Phys. 2011, 11, 1217–1225. [Google Scholar] [CrossRef]
  39. Lack, D.; Langridge, J. On the attribution of black and brown carbon light absorption using the Ångström exponent. Atmos. Chem. Phys. 2013, 13, 10535–10543. [Google Scholar] [CrossRef]
  40. Shinozuka, Y.; Clarke, A.; DeCarlo, P.; Jimenez, J.; Dunlea, E.; Roberts, G.; Tomlinson, J.; Collins, D.; Howell, S.; Kapustin, V.; et al. Aerosol optical properties relevant to regional remote sensing of CCN activity and links to their organic mass fraction: Airborne observations over Central Mexico and the US West Coast during MILAGRO/INTEX-B. Atmos. Chem. Phys. 2009, 9, 6727–6742. [Google Scholar] [CrossRef]
  41. Schmeisser, L.; Andrews, E.; Ogren, J.A.; Sheridan, P.; Jefferson, A.; Sharma, S.; Kim, J.E.; Sherman, J.P.; Sorribas, M.; Kalapov, I.; et al. Classifying aerosol type using in situ surface spectral aerosol optical properties. Atmos. Chem. Phys. 2017, 17, 12097–12120. [Google Scholar] [CrossRef]
  42. Arola, A.; Schuster, G.; Myhre, G.; Kazadzis, S.; Dey, S.; Tripathi, S. Inferring absorbing organic carbon content from AERONET data. Atmos. Chem. Phys. 2011, 11, 215–225. [Google Scholar] [CrossRef]
  43. Gilardoni, S.; Massoli, P.; Paglione, M.; Giulianelli, L.; Carbone, C.; Rinaldi, M.; Decesari, S.; Sandrini, S.; Costabile, F.; Gobbi, G.P.; et al. Direct observation of aqueous secondary organic aerosol from biomass-burning emissions. Proc. Natl. Acad. Sci. USA 2016, 113, 10013–10018. [Google Scholar] [CrossRef] [PubMed]
  44. Stohl, A.; Klimont, Z.; Eckhardt, S.; Kupiainen, K.; Shevchenko, V.P.; Kopeikin, V.; Novigatsky, A. Black carbon in the Arctic: The underestimated role of gas flaring and residential combustion emissions. Atmos. Chem. Phys. 2013, 13, 8833–8855. [Google Scholar] [CrossRef] [Green Version]
  45. Bond, T.C.; Bergstrom, R.W. Light absorption by carbonaceous particles: An investigative review. Aerosol Sci. Technol. 2006, 40, 27–67. [Google Scholar] [CrossRef]
  46. Li, J.; Carlson, B.E.; Dubovik, O.; Lacis, A.A. Recent trends in aerosol optical properties derived from AERONET measurements. Atmos. Chem. Phys. 2014, 14, 12271–12289. [Google Scholar] [CrossRef]
  47. Mann, H.B. Nonparametric tests against trend. Econom. J. Econom. Soc. 1945, 13, 245–259. [Google Scholar] [CrossRef]
  48. Kendall, M. Multivariate Analysis; Charles Griffin: London, UK, 1975. [Google Scholar]
  49. Yue, S.; Pilon, P.; Phinney, B.; Cavadias, G. The influence of autocorrelation on the ability to detect trend in hydrological series. Hydrol. Process. 2002, 16, 1807–1829. [Google Scholar] [CrossRef]
  50. Zhang, X.; Zwiers, F.W. Comment on “Applicability of prewhitening to eliminate the influence of serial correlation on the Mann-Kendall test” by Sheng Yue and Chun Yuan Wang. Water Resour. Res. 2004, 40. [Google Scholar] [CrossRef]
  51. Bayazit, M.; Önöz, B. To prewhiten or not to prewhiten in trend analysis? Hydrol. Sci. J. 2007, 52, 611–624. [Google Scholar] [CrossRef]
  52. Redemann, J.; Russell, P.B.; Hamill, P. Dependence of aerosol light absorption and single-scattering albedo on ambient relative humidity for sulfate aerosols with black carbon cores. J. Geophys. Res. Atmos. 2001, 106, 27485–27495. [Google Scholar] [CrossRef]
  53. Adam, M.; Putaud, J.P.; Martins dos Santos, S.; Dell’Acqua, A.; Gruening, C. Aerosol hygroscopicity at a regional background site (Ispra) in Northern Italy. Atmos. Chem. Phys. 2012, 12, 5703–5717. [Google Scholar] [CrossRef]
  54. Brem, B.T.; Mena Gonzalez, F.C.; Meyers, S.R.; Bond, T.C.; Rood, M.J. Laboratory-measured optical properties of inorganic and organic aerosols at relative humidities up to 95%. Aerosol Sci. Technol. 2012, 46, 178–190. [Google Scholar] [CrossRef]
  55. Nessler, R.; Weingartner, E.; Baltensperger, U. Effect of humidity on aerosol light absorption and its implications for extinction and the single scattering albedo illustrated for a site in the lower free troposphere. J. Aerosol Sci. 2005, 36, 958–972. [Google Scholar] [CrossRef]
  56. Barnaba, F.; Putaud, J.P.; Gruening, C.; Dos Santos, S. Annual cycle in co-located in situ, total-column, and height-resolved aerosol observations in the Po Valley (Italy): Implications for ground-level particulate matter mass concentration estimation from remote sensing. J. Geophys. Res. Atmos. 2010, 115. [Google Scholar] [CrossRef]
  57. Yoon, S.C.; Kim, J. Influences of relative humidity on aerosol optical properties and aerosol radiative forcing during ACE-Asia. Atmos. Environ. 2006, 40, 4328–4338. [Google Scholar] [CrossRef]
  58. Moosmüller, H.; Chakrabarty, R.; Arnott, W. Aerosol light absorption and its measurement: A review. J. Quant. Spectrosc. Radiat. Transf. 2009, 110, 844–878. [Google Scholar] [CrossRef]
  59. Jacobson, M.Z. Short-term effects of controlling fossil-fuel soot, biofuel soot and gases, and methane on climate, Arctic ice, and air pollution health. J. Geophys. Res. Atmos. 2010, 115. [Google Scholar] [CrossRef]
  60. Lack, D.; Cappa, C. Impact of brown and clear carbon on light absorption enhancement, single scatter albedo and absorption wavelength dependence of black carbon. Atmos. Chem. Phys. 2010, 10, 4207–4220. [Google Scholar] [CrossRef] [Green Version]
  61. Sandrini, S.; Fuzzi, S.; Piazzalunga, A.; Prati, P.; Bonasoni, P.; Cavalli, F.; Bove, M.C.; Calvello, M.; Cappelletti, D.; Colombi, C.; et al. Spatial and seasonal variability of carbonaceous aerosol across Italy. Atmos. Environ. 2014, 99, 587–598. [Google Scholar] [CrossRef]
  62. Putaud, J.P.; Cavalli, F.; Martins dos Santos, S.; Dell’Acqua, A. Long-term trends in aerosol optical characteristics in the Po Valley, Italy. Atmos. Chem. Phys. 2014, 14, 9129–9136. [Google Scholar] [CrossRef] [Green Version]
  63. Collaud Coen, M.; Andrews, E.; Asmi, A.; Baltensperger, U.; Bukowiecki, N.; Day, D.; Fiebig, M.; Fjaeraa, A.; Flentje, H.; Hyvärinen, A.; et al. Aerosol decadal trends—Part 1: In-situ optical measurements at GAW and IMPROVE stations. Atmos. Chem. Phys. 2013, 13, 869–894. [Google Scholar] [CrossRef] [Green Version]
Figure 1. Measurement sites in the area of Rome and relevant datasets: Rome Tor Vergata (AERONET inferred eBC 2001–2017, in-situ measured equivalent black carbon (eBC) during ARTOV and DIAPASON (Desert-dust Impact on Air quality through model—Predictions and Advanced Sensors ObservatioNs) campaigns); CARE (Carbonaceous Aerosol in Rome and Environs) site (in-situ measured eBC during CARE campaign); Rome Villa Ada (PM2.5 and CO).
Atmosphere 09 00081 g001
Figure 2. Time series of (a) AODEXT, (b) AODABS, and (c) SSA retrieved from AERONET data, at the site of Rome Tor Vergata, from January 2001 to August 2017 (7697 data points). Grey markers show columnar measurements (measurement error bars are indicated by grey lines). Blue markers show the related (55 points) running mean. AERONET Version 2 Lev. 2.0* data inversion products are used (Section 2.2).
Atmosphere 09 00081 g002
Figure 3. Comparison of the aerosol light absorption coefficients ( α abs) inferred from AERONET with surface α abs. Panels show scatter plots of: (x-axis) surface α abs obtained from in-situ measurements, (y-axis) α abs obtained from AERONET data, before (a,c), and after (b,d) applying the screening scheme. The color code shows the hourly mixing layer height in panels (a,b), and the aerosol type dominating the field measurements (urban pollution during CARE 2017 [15], dust during DIAPASON 2013–2014 [10], mixed during ARTOV 2010–2011 [12]) in (c,d). Black line is the 1-to-1 line. ±15 min average values of α abs are used. Data measured from November 2010 to February 2017 are shown. Thin grey lines indicate the measurement error associated with the α abs data.
Atmosphere 09 00081 g003
Figure 4. Time series of surface aerosol light absorption coefficients α abs ( λ = 675 nm) inferred from AERONET data, at the site of Rome Tor Vergata, from January 2001 to August 2017 (2924 data points). Grey markers show the inferred α abs (measurement error bars are indicated by grey lines). Blue markers show the relevant (55 points) running mean. On right y-axis the corresponding eBC mass concentration values ( μ g / m 3 ) are shown.
Atmosphere 09 00081 g004
Figure 5. Trend analysis of: (a) AODEXT ( λ = 440 nm), (b) AODABS ( λ = 440 nm), and (c) SSA ( λ = 440 nm) retrieved from columnar measurements, at the site of Rome Tor Vergata, from January 2001 to August 2017, using the Mann-Kendall test associated with Sen’s slope. The solid black lines in the test result show the linear trend and the 90% confidence interval of the estimated Sen’s slope. AERONET Version 2 Level 2.0* data inversion products were used.
Atmosphere 09 00081 g005
Figure 6. Trend analysis of: (a) surface α abs (and surface eBC mass concentration ( μ g / m 3 )) inferred from AERONET data at the site of Rome Tor Vergata, (b) PM2.5 ( μ g / m 3 ) and (c) CO concentrations (mg/m 3 ) measured at the site of Rome Villa Ada, from January 2001 to August 2017, using the Mann-Kendall test associated with Sen’s slope. The solid black lines in the test result show the linear trend and the 90% confidence interval of the estimated Sen’s slope.
Atmosphere 09 00081 g006
Figure 7. Histogram plot of differences between AERONET—inferred and in-situ measured surface α abs relative to AERONET—inferred α abs before (dark blue) and after (light blue) the screening scheme, with smoothing fit curves.
Atmosphere 09 00081 g007
Table 1. Criteria of the “screening scheme” performed in this work, based on thresholds applied to AERONET AODEXT (440 nm), SSA (440 nm) and Reff, to remove data affected by the presence of layers of absorbing aerosol in the atmospheric column, namely desert dust and fire plumes.
CriteriumThresholds
T10.08 < AODEXT (440 nm) < 0.32
T2SSA440 > 0.85
T3Reff < 0.3 μ m
Table 2. Number of aerosol light absorption coefficients measurements before and after the application of the screening scheme, split up by seasons.
SeasonBeforeAfter
Winter1238539
Spring1424602
Summer28951270
Fall1669513
Total72262924
Table 3. Intensive optical properties (SAE, SSA, AAE, and dSSA × AAE) of “pure” dust and “pure” black carbon aerosol resulting from the "paradigm" developed in [22].
“Pure” Dust“Pure” Black Carbon
SAE467–660 < 0.5SAE467–660 ≈ 1–3
SSA530 > 0.85SSA530 < 0.85
AAE467–660 ≈ 2AAE467–660 < 2
dSSA × AAE > 0dSSA × AAE < 0
Table 4. Comparison of results from various sites: measurement site (name of the campaign), its classification (UB = urban background), measurement period, mean ( μ ) and standard deviation ( σ ), and mean differences (MD) of in-situ measured and AERONET inferred surface eBC mass concentrations during intensive field campaings performed in Rome. MD is calculated using Equation (8). Note that we show both values measured during all the field (all data) and a subset of these measured only when AERONET data were available (coincident measurements). N/A = not available data.
SiteClassificationPeriodCoincident MeasurementsAll Data
eBC ( μ ± σ )eBC ( μ ± σ )|MD (%)|eBC ( μ ± σ )eBC ( μ ± σ )|MD (%)|
In-SituInferred In-SituInferred
Rome Tor Vergata (ARTOV 2010)UBNovember 20100.90±0.351.87±1.0470%1.23 ± 1.581.43 ± 0.9715%
Rome Tor Vergata (ARTOV 2011)UBJanuary–February 20111.61 ± 1.112.10 ± 1.7026%1.77 ± 1.691.95 ± 1.6010%
Rome Tor Vergata (ARTOV 2011)UBApril–May 20110.63 ± 0.502.68 ± 3.73124%0.76 ± 0.783.98 ± 3.19136%
Rome Tor Vergata (ARTOV 2011)UBJune–July 20110.49 ± 0.581.64 ± 1.76108%0.71 ± 0.652.22 ± 1.72103%
Center Rome (CARE 2017)UBFebruary 20172.70 ± 1.942.59 ± 1.644%2.60 ± 2.50 [15]2.52 ± 1.631%
Rome Villa AdaUBWinter (2005–2007)N/AN/AN/A2.80 ± 1.60 [61]3.51±2.4522%
Rome Villa AdaUBSummer (2005–2007)N/AN/AN/A1.70 ± 0.80 [61]4.01 ± 2.5881%
Rome MontelibrettiUBWinter (2005–2010)N/AN/AN/A1.40 ± 0.8 [24,61]3.77 ± 2.8892%
Rome MontelibrettiUBSummer (2005–2010)N/AN/AN/A1.00 ± 0.4 [24,61]4.06 ± 2.59121%
Table 5. Comparison between trends estimated in Rome and across other Italian and European sites. Site categories are: UB = urban or suburban, Mo = mountain. N/A = not available data.
SiteTypeTime RangeAODEXT/DecadeAODABS/DecadeSSA/DecadeeBC Mass Concentration ( μ g / m 3 /Decade)Reference
Rome Tor VergataUB2001–2017−0.047−0.007+0.014−0.76This work
Rome Tor VergataUB2001–2013−0.03−0.019+0.07N/A[46]
IspraUB2001–2013−0.03−0.002−0.026N/A[46,62]
Lecce UniversityUB2001–2013−0.06−0.010+0.032N/A[46]
HohenpeissenbergMo1995–2010N/AN/AN/A−0.044[63]
AvignonUB2001–2013−0.02−0.004+0.027N/A[46]
BarcelonaUB2001–2013−0.07−0.008+0.028N/A[46]

