Analysis and Comparison of Shading Strategies to Increase Human Thermal Comfort in Urban Areas

1
Department of Geography, University of Western Ontario, London, ON N6A 3K7, Canada
2
School of Environmental Sciences, University of Guelph, Guelph, ON N1G 2W1, Canada
*
Author to whom correspondence should be addressed.
Atmosphere 2018, 9(3), 91; https://doi.org/10.3390/atmos9030091
Submission received: 13 November 2017
/
Revised: 23 February 2018
/
Accepted: 27 February 2018
/
Published: 1 March 2018
(This article belongs to the Special Issue Urban Design and City Microclimates)
Abstract
:With the expected increase in warmer conditions caused by climate change, heat-related illnesses are becoming a more pressing issue. One way that humans can protect themselves from this is to seek shade. The design of urban spaces can provide individuals with a variety of ways to obtain this shade. The objective of this study was to perform a detailed evaluation and comparison of three shading strategies that could be used in an urban environment: shade from a building, from a tree, and from an umbrella. This was done through using field measurements to calculate the impact of each strategy on a thermal comfort index (Comfort Formula (COMFA)) in two urban settings during sunny days of the summer of 2013 and 2014 in London, Canada. Building shade was found to be the most effective cooling strategy, followed by the tree strategy and the umbrella strategy. As expected, the main determinant of this ranking was a strategy’s ability to block incoming shortwave radiation. Further analysis indicated that changes in the convective loss of energy and in longwave radiation absorption had a smaller impact that caused variations in the strategy effectiveness between settings. This suggests that under non-sunny days, these rankings could change.

1. Introduction
Studies have shown that prolonged exposure to hot conditions can have a negative impact on human health. Humans, like all warm-blooded animals, must maintain their core temperature within a fairly narrow range for their bodies to function optimally. Exposure to extended periods of heat can cause the core temperature to rise, resulting in a decrease of thermal comfort and the onset of a variety of ailments such as the exacerbation of pre-existing respiratory issues, heat stroke, and, in the most serious circumstances, death [1]. Instances of this phenomenon include the 1995 heat wave in Chicago, which played a part in up to 700 deaths [2], and the 2003 heat wave in France, which is estimated to have caused 3096 deaths [3].
With the expected increase in hot conditions due to climate change, the occurrence of heat-related illnesses will become more common. This is especially true for those living in cities as urban residents are exposed to locally warmer conditions due to the urban heat island effect (UHI). The UHI is a phenomenon where the temperature in an urban environment is higher than its rural surroundings due to the materials that it is made of, as well as human activities. In addition, the number of people living in urban areas is increasing [4], thus exposing more people to hotter conditions and increasing the risk.
There are many different ways to address this issue and help populations adapt to these hotter conditions. One way is through the design of urban spaces. Many studies have found that city design and the presence of certain urban forms can, during times of extreme heat, cool an area and increase the thermal comfort of individuals there [5,6,7]. An increase in thermal comfort will decrease the chances of an individual suffering from a heat-related illness.
In general, urban planning strategies have focused on increasing thermal comfort during the day. This is likely because periods of extreme heat occur during the summer, in which daytime is at its maximum length [5]. One way in which the design of urban spaces can cause cooling is by decreasing the amount of radiation that an individual absorbs. The mean radiant temperature (which is the temperature if only absorbed radiation is taken into account) is one of the main determinants of a person’s thermal comfort [8]. Since during the day the main component of absorbed radiation is sunlight or shortwave radiation, providing shade can be an effective strategy to increase thermal comfort and decrease the potential health impacts of heat [9,10].
Shade of all different types has been shown to be an effective strategy for increasing the thermal comfort of an individual in an urban setting. Shade trees have been successfully used to combat the hotter conditions caused by the UHI [11] and it was found through computer models of Gothenburg, Sweden that, under certain vegetation configurations, there is a linear decrease in mean radiant temperature with increasing vegetation cover ratio (which provides shade) [10]. In a study based in De Bilt, Netherlands, it was found that among five urban forms during a very hot day, the courtyard provided the greatest number of thermally comfortable hours in a day, while linear north–south blocks provided the lowest average PET; PET (physiologically equivalent temperature) is a heat index. The authors attributed these findings mainly to the duration for which a person is exposed to direct sun, or the ability of the urban form to provide shade [7].
On a very general level, one would expect that during sunny days, the degree of shade that an object provides will determine its effectiveness in increasing thermal comfort. For instance, shade from an opaque structure like a building will cause a greater increase in thermal comfort than shade from a tree canopy, which lets in some sunlight. Yet designing the urban space to provide shade is not as simple as incorporating a series of opaque structures. This is because the inclusion of objects to provide shade will influence other meteorological variables which, in turn, could influence the thermal comfort of an individual. Vegetation is known to have a cooling effect in the surrounding area due to the fact that plants transpire and tall buildings are known to increase or decrease wind speed depending on the orientation of the buildings. Thus, a deeper understanding of how various shading strategies affect the human energy budget and how they compare to each other is needed so that urban planners can have a better idea as to what impacts their changes may have.
This type of in-depth analysis and comparison of multiple shading strategies is not common. Many studies in this area have focused on the impact of one particular shading strategy on air temperature [12,13] or the value of a more complex indicator like a heat index [14,15,16,17,18,19]. In addition, it is difficult to make comparisons between studies as many of them use different heat indices or take place in different climatic conditions and at different times of the year. For example, one study used Comfort Formula (COMFA) to test the impact of parks (which includes shade from vegetation) in Toronto, Canada in September 2009 [18] while another used the PET index to test the impact of canyon dimensions (which includes building shade) in Singapore from July to October 2007 [19]. A more detailed analysis and comparison was done in [5], which consisted of comparing the impacts of tree shading and building shading. However, this analysis focused on the radiative components of the energy budget and ignored other elements, such as the latent and sensible heat flux.
Thus, the objective of this study is to provide an analysis and comparison of the impact of various components of the energy budget by three different shading strategies. Three strategies commonly used by individuals are shading from a building, shading from trees, and shading from semipermeable material (such as an umbrella). These will be the three strategies evaluated in this study.
2. Materials and Methods
2.1. Location and Measurement Times
Evaluation of the shading strategies took place on the campus of the University of Western Ontario (UWO) in London, Ontario, Canada. Two common settings found in an urban environment are the downtown core and the residential area. The downtown environment usually contains a high aspect ratio and impervious surface fraction while a residential setting can be characterized by a lower aspect ratio and lower impervious surface fraction [20]. Thus, two sites at UWO were chosen that were representative of these two settings. The location chosen for the downtown core was in an area surrounded by three tall buildings (each building had at least 4 floors) with the majority of the surface consisting of concrete (Figure 1). The residential location was found in a courtyard of a building with a low aspect ratio and a larger portion of the surface containing vegetation (Figure 2).
For both settings, “reference” and “strategy” sites were established to allow comparison of the strategies; a cooling strategy was used at each strategy site, while no cooling strategy was used at the reference site. Testing of the strategies involved comparing the measurements made from the strategy site with those of the reference site. The reference site was chosen to represent a location where heat absorption by a person was expected to be high and, thus, implementation of the cooling strategy would be important. Measurements took place between August 2013 to early October 2013 and August 2014 to September 2014. They were made during relatively clear, sunny days between 10:00 to 17:00 when heating was greatest and when use of a strategy would be most relevant to human heat stress; the exact measurement period depended on the conditions on that day. Measurements were made every 5 min. In total, three replicates were done for each of the strategies at each of the settings.
2.2. Heat Index
To evaluate the effectiveness of the shading strategies, the COMFA (Comfort Formula) model, a heat index based on the human energy budget, was used. The reason why this index was chosen, as opposed to other indicators such as PET or UTCI (Universal Thermal Climate Index), was because the authors already had detailed experience with its use. In addition, COMFA has been shown to effectively quantify the thermal comfort of an individual as well as quantify the impact of differences in the surrounding environment on the thermal comfort. It has been used in many studies to perform such a task [18,21,22,23].
Budget values of COMFA (Equation (1) [24]) were calculated at the reference and strategy site and then compared.
where
B = M + RRT − C − E − L
B = COMFA Budget value (W m−2);
M = Human metabolic energy (W m−2);
RRT = Radiation absorbed (W m−2);
C = Convective sensible heat flux (W m−2);
E = Convective latent heat flux (W m−2);
L = Longwave radiation emitted (W m−2).
In Equation (1), RRT and M are inputs to the human energy budget, while C, E (due to wind flow past an individual), and L are outputs.
The COMFA Budget value is equivalent to the storage heat value of the human energy budget. Hereafter the COMFA Budget value will be referred to as the “COMFA value”. To calculate the COMFA value, the methods and equations found in [25,26] were used to determine the values for M, C, E, and L. It should be noted that to determine L, the surface temperature of an individual was needed; this was calculated as the heat flow from the skin surface to the surroundings. For RRT, the cylindrical radiation thermometer (CRT) absorbed radiation method described in [27] was used. To calculate all of these COMFA components, measurements of wind speed, air temperature, vapor pressure, and atmospheric pressure were needed. Table 1 shows which of these measured variables were used to calculate the various components of Equation (1).
To obtain these values, each measurement site was instrumented with a 2-dimensional sonic anemometer (Model 425, Vaisala, Sunnyvale, United States or Model, 85000, RM Young Company, Traverse City, MI, United States), a temperature and humidity probe (Model HC2-S3-L, Rotronic, Hauppauge, NY, United States), and a custom-built cylindrical radiation thermometer (CRT). During the residential site measurements in 2014, the Vaisala sonic anemometer failed and was replaced by a cup anemometer (Model 014a, Met One, Grants Pass, OR, United States). The temperature and humidity probes were shielded using a 10-plate solar radiation shield (Model 41003-X, RM Young, Traverse City, MI, United States). The CRT was built by inserting a Fenwall thermistor into a copper cylinder, measuring 10 mm in diameter and 100 mm in length. The cylinder was then filled with Omegabond 101 Two Part Epoxy: High Thermal Conductivity and was painted dark green (albedo = 0.11) using acrylic paint. Atmospheric pressure values were obtained from Environment Canada weather station observations made at the London International Airport [28]. In addition, while not necessary for the COMFA values, a net radiometer (Model CNR1, Kipp & Zonen, Delft, The Netherlands) was set up at each of the measurement sites. These measurements were used to aid the analysis. This net radiometer contains a pyranometer (which measures incoming shortwave radiation) and a pyrgeometer (which measures incoming longwave radiation) on the top (facing the sky) and bottom (facing the ground) of the instrument. Values obtained from the top pyranometer and pyrgeometer were termed kin and Lin, respectively, and the values obtained from the bottom pyranometer and pyrgeometer were termed kout and Lout. Thus, kin and Lin represent the radiation received from anything above the net radiometer (mainly the sky and buildings), while kout and Lout represent the radiation received from anything below the net radiometer (mainly the ground).
All equipment was situated at approximately 1.5 m above the ground—a height that is representative of the conditions that an individual experiences [29]. To reduce the impacts of instrument bias, the instruments were alternated between the reference and strategy site between replicates for each strategy. Finally, for the COMFA calculation it was assumed that
- The vapor pressure of the skin was at saturation; this is a viable assumption since during the conditions that the field measurements were taking place in, it is likely that an individual would be sweating;
- The individual is standing and in a relaxed position, which corresponds to a metabolic intensity of 120 W m−2 [30];
- The individual is wearing a cotton T-shirt and shorts, which have a convective resistance of 62 s m−1 and a vapor resistance of 169 s m−1 [31].
2.3. Shading Types
The three shading types that were used in this study are described in the following three subsections.
2.3.1. Building Shade (or the Building Strategy)
In this strategy, the shade was provided by a large, opaque building. The exact locations of the reference and strategy sites are found in Figure 1 and Figure 2. For the residential setting, the strategy site was found in the shadow of a wall. For the downtown site, the strategy site was found under a small overhang from a building. In both cases all direct shortwave radiation is being blocked so that only diffuse shortwave radiation is reaching the site.
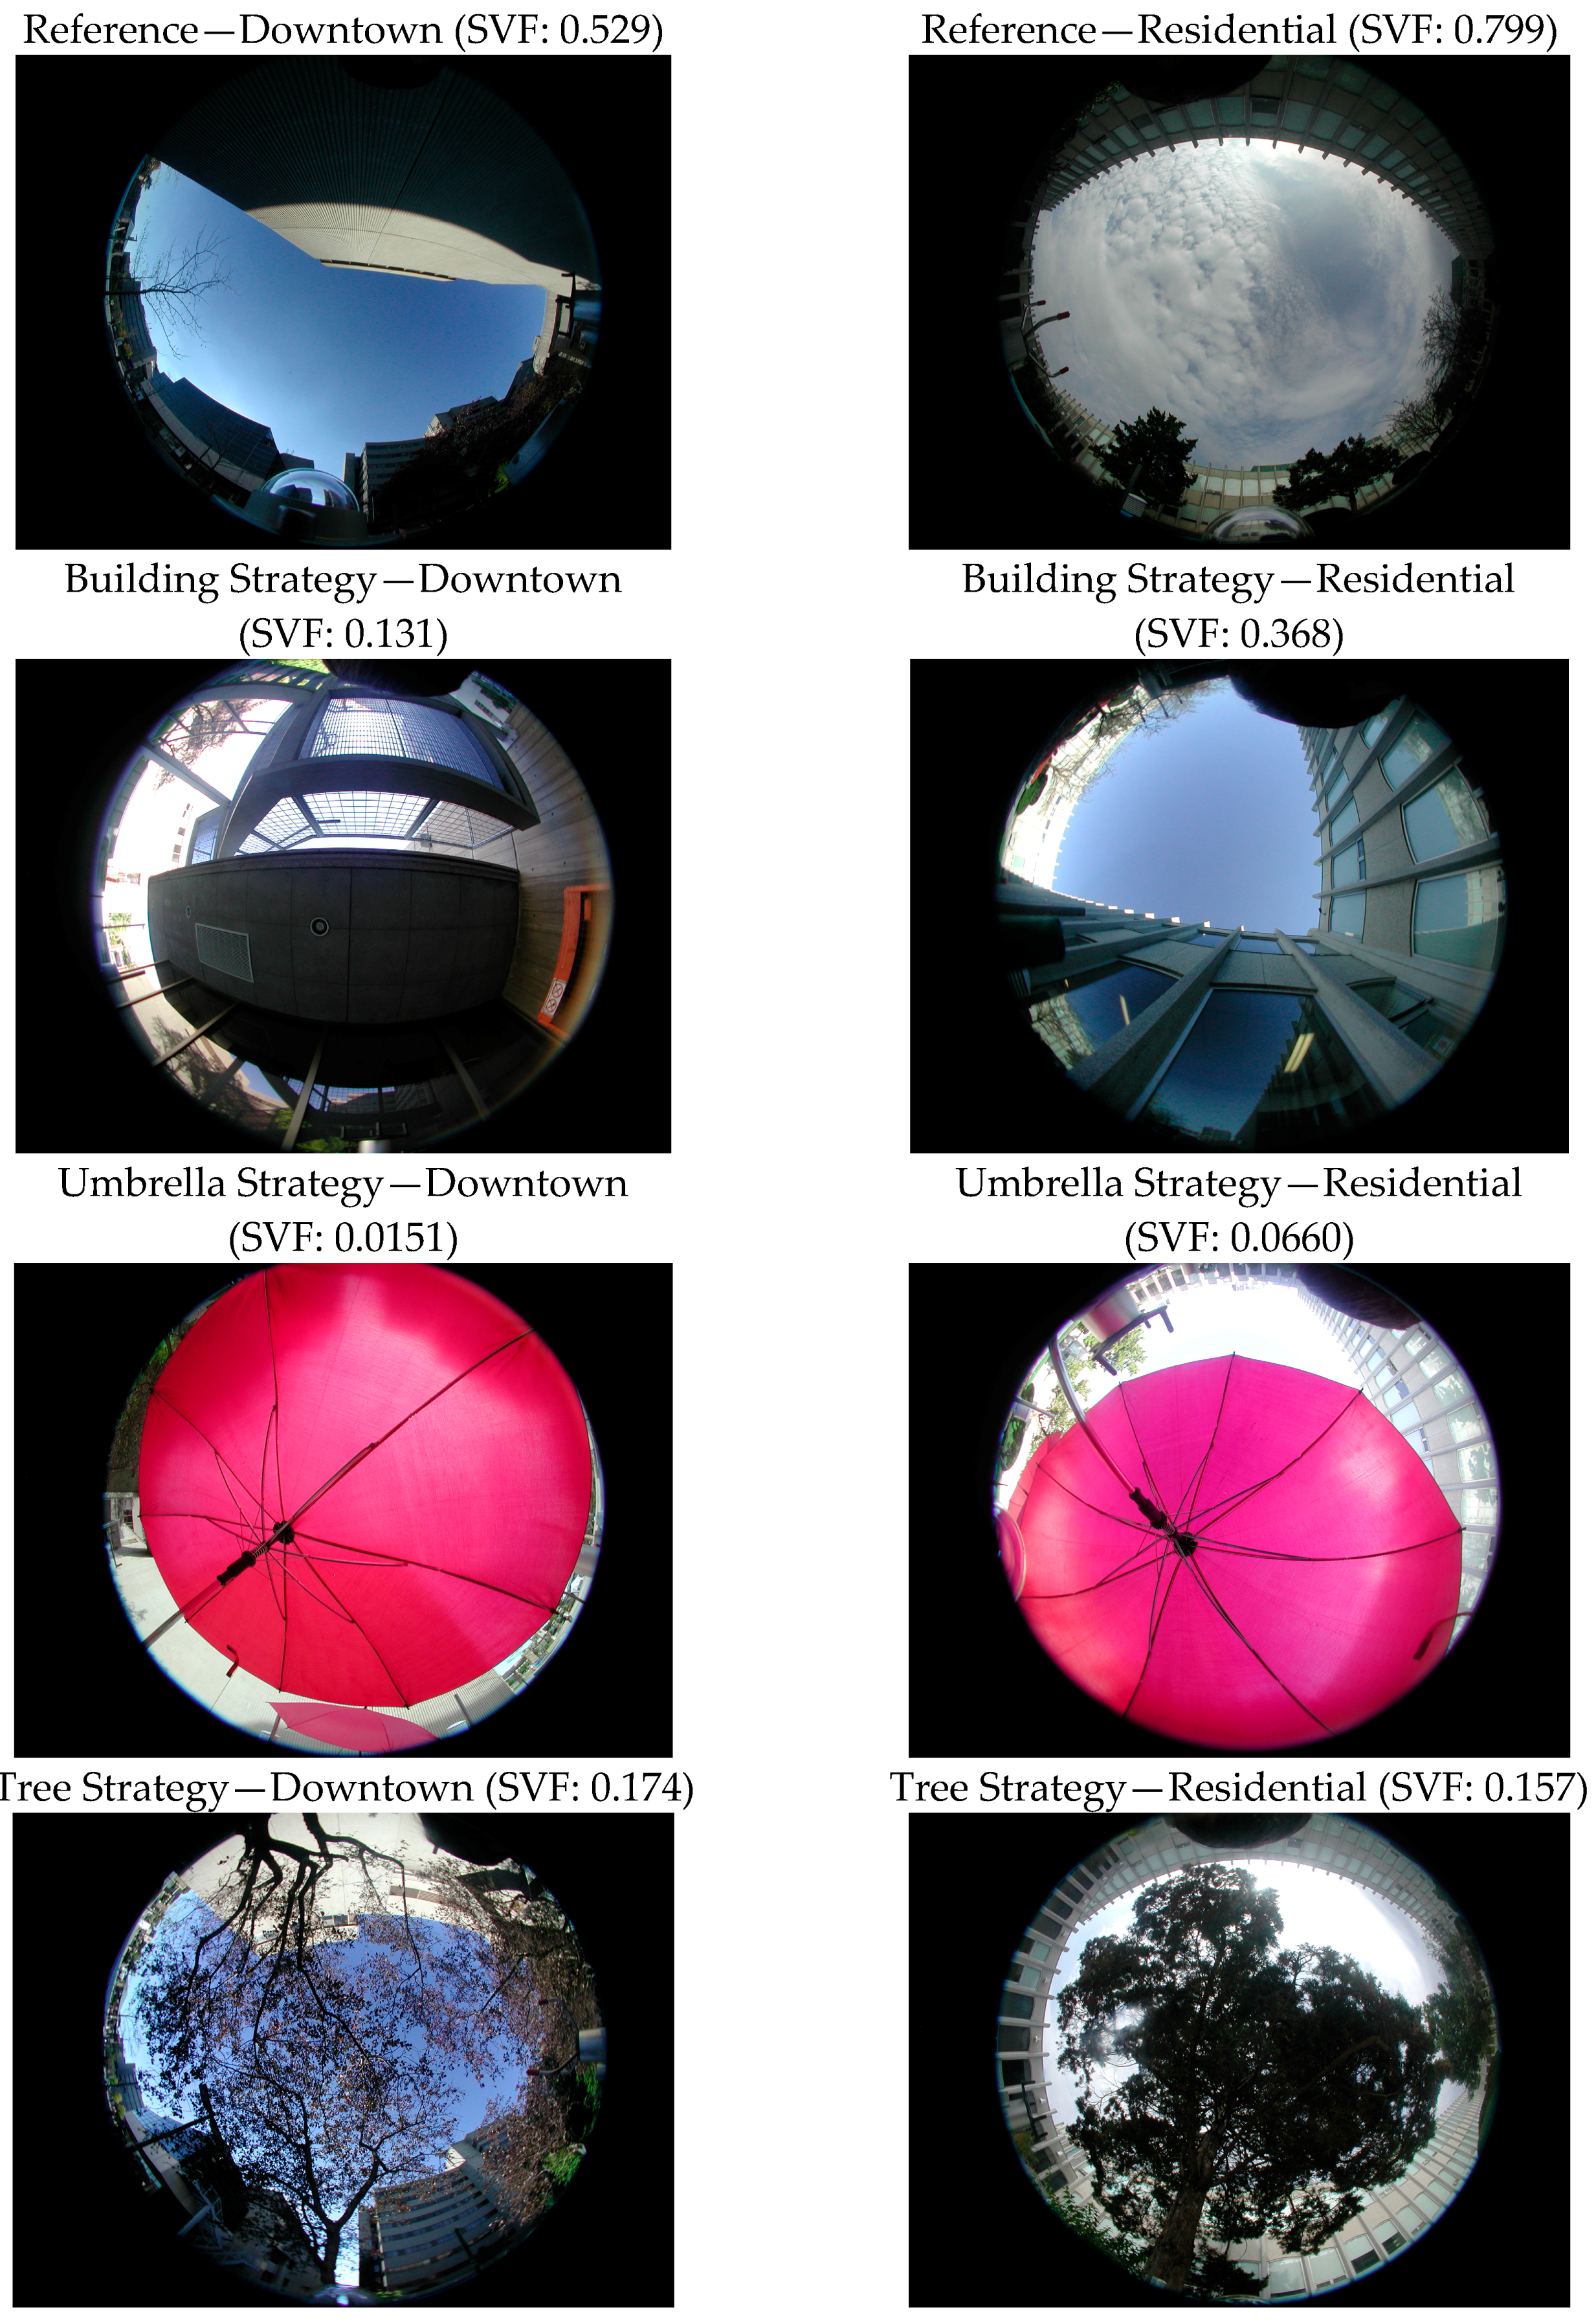
The sky view factor is the proportion of the sky seen from a given point on a horizontal surface. This factor is important as, during the day, as the sky view factor increases, so does the amount of shortwave radiation absorbed. The sky view factor can be approximated from a hemispherical photo facing up; these photos will be henceforth termed “hemispherical up photos” for the remainder of this document. The hemispherical up photos taken at a height of 1.5 m at all of the strategy sites and the reference site for both settings as well as approximate sky view factors are shown in Figure 3.
2.3.2. Umbrella Shade (or the Umbrella Strategy)
During the summer months, many individuals can use personal or fixed (e.g., found above outdoor tables) umbrellas to shade themselves. This was the second shading strategy tested. The umbrella is less opaque than the building, so the character of the shade differs; the main impact is that an individual will absorb more diffuse shortwave radiation under an umbrella than when shaded by a building. The hemisphere up photos of this strategy are located in Figure 3.
For this study, the shade was provided by a dark red umbrella (with an albedo of approximately 0.30) that is located 40–45 cm above the net radiometer and CRT, 35–40 cm from these instruments horizontally, and at a 35 degree angle (see Figure 4). The strategy site was situated near the reference site for both settings (Figure 1 and Figure 2). In addition, the anemometer for the reference site was placed slightly higher than normal at a height of 1.7–1.8 m. This was done because the use of the umbrellas would have affected wind measurements if the anemometer was placed at their usual height.
The albedo of the umbrella as well as the green paint used on the CRT was determined through the use of a CNR1 net radiometer (Kipp & Zonen, Delft, The Netherlands). The net radiometer was placed 15 cm above and in the middle of either a piece of cardboard painted with the green paint or some material that made up the umbrella; in each case the view factor was 1.
Data was collected for 30 min; 5 min averages were taken and then averaged to obtain the final albedo value. Albedo measurements made at a height of 15 cm have an approximate error of 5% [33]. Given this finding and that the albedo values were only used for descriptive purposes in this study, this error was deemed acceptable.
2.3.3. Tree Shade (or the Tree Strategy)
The final strategy used was the cooling effectiveness of tree shade. Unlike a building and umbrella, a tree canopy permits some direct solar radiation to pass through; thus, the total solar radiation on a person in the shade of a tree will include both direct and diffuse radiation. At the same time, the shade provided by the trees can be more opaque in places as compared to that of an umbrella. For the downtown site, three smaller trees (Malus species unknown) were used to provide the shade, while for the residential site there was one large tree (Juniperus virginiana). The setup at both settings can be found in Figure 1 and Figure 2.
2.4. Data Analysis
Data analysis was restricted to times when the reference site was exposed to direct sunlight and the strategy site would have been exposed to direct sunlight if not for the use of the strategy. Analysis was further restricted to times when the COMFA value of the reference site exceeded 200 W m−2 as these best represent “hot” conditions [25] when the cooling strategies would most likely be used by individuals. The full classification of COMFA values and their description can be found in Table 2 [25]; these values are based on work done by [34]. Data were filtered to remove any measurements representing anomalous conditions, e.g., wind shifting the position of the umbrella. Finally, only times when valid data were recorded from both the strategy and reference sites were used in the analysis; this ensured equal numbers of data points for the strategy and reference site for each measurement period. All data management and analysis (including the running of relevant statistical tests) were performed in Matlab R2012a (Mathworks, Natick, MA, United States). Unless otherwise stated, for all statistical tests, statistical significance (α) was set at a value of 0.05.
3. Results and Discussion
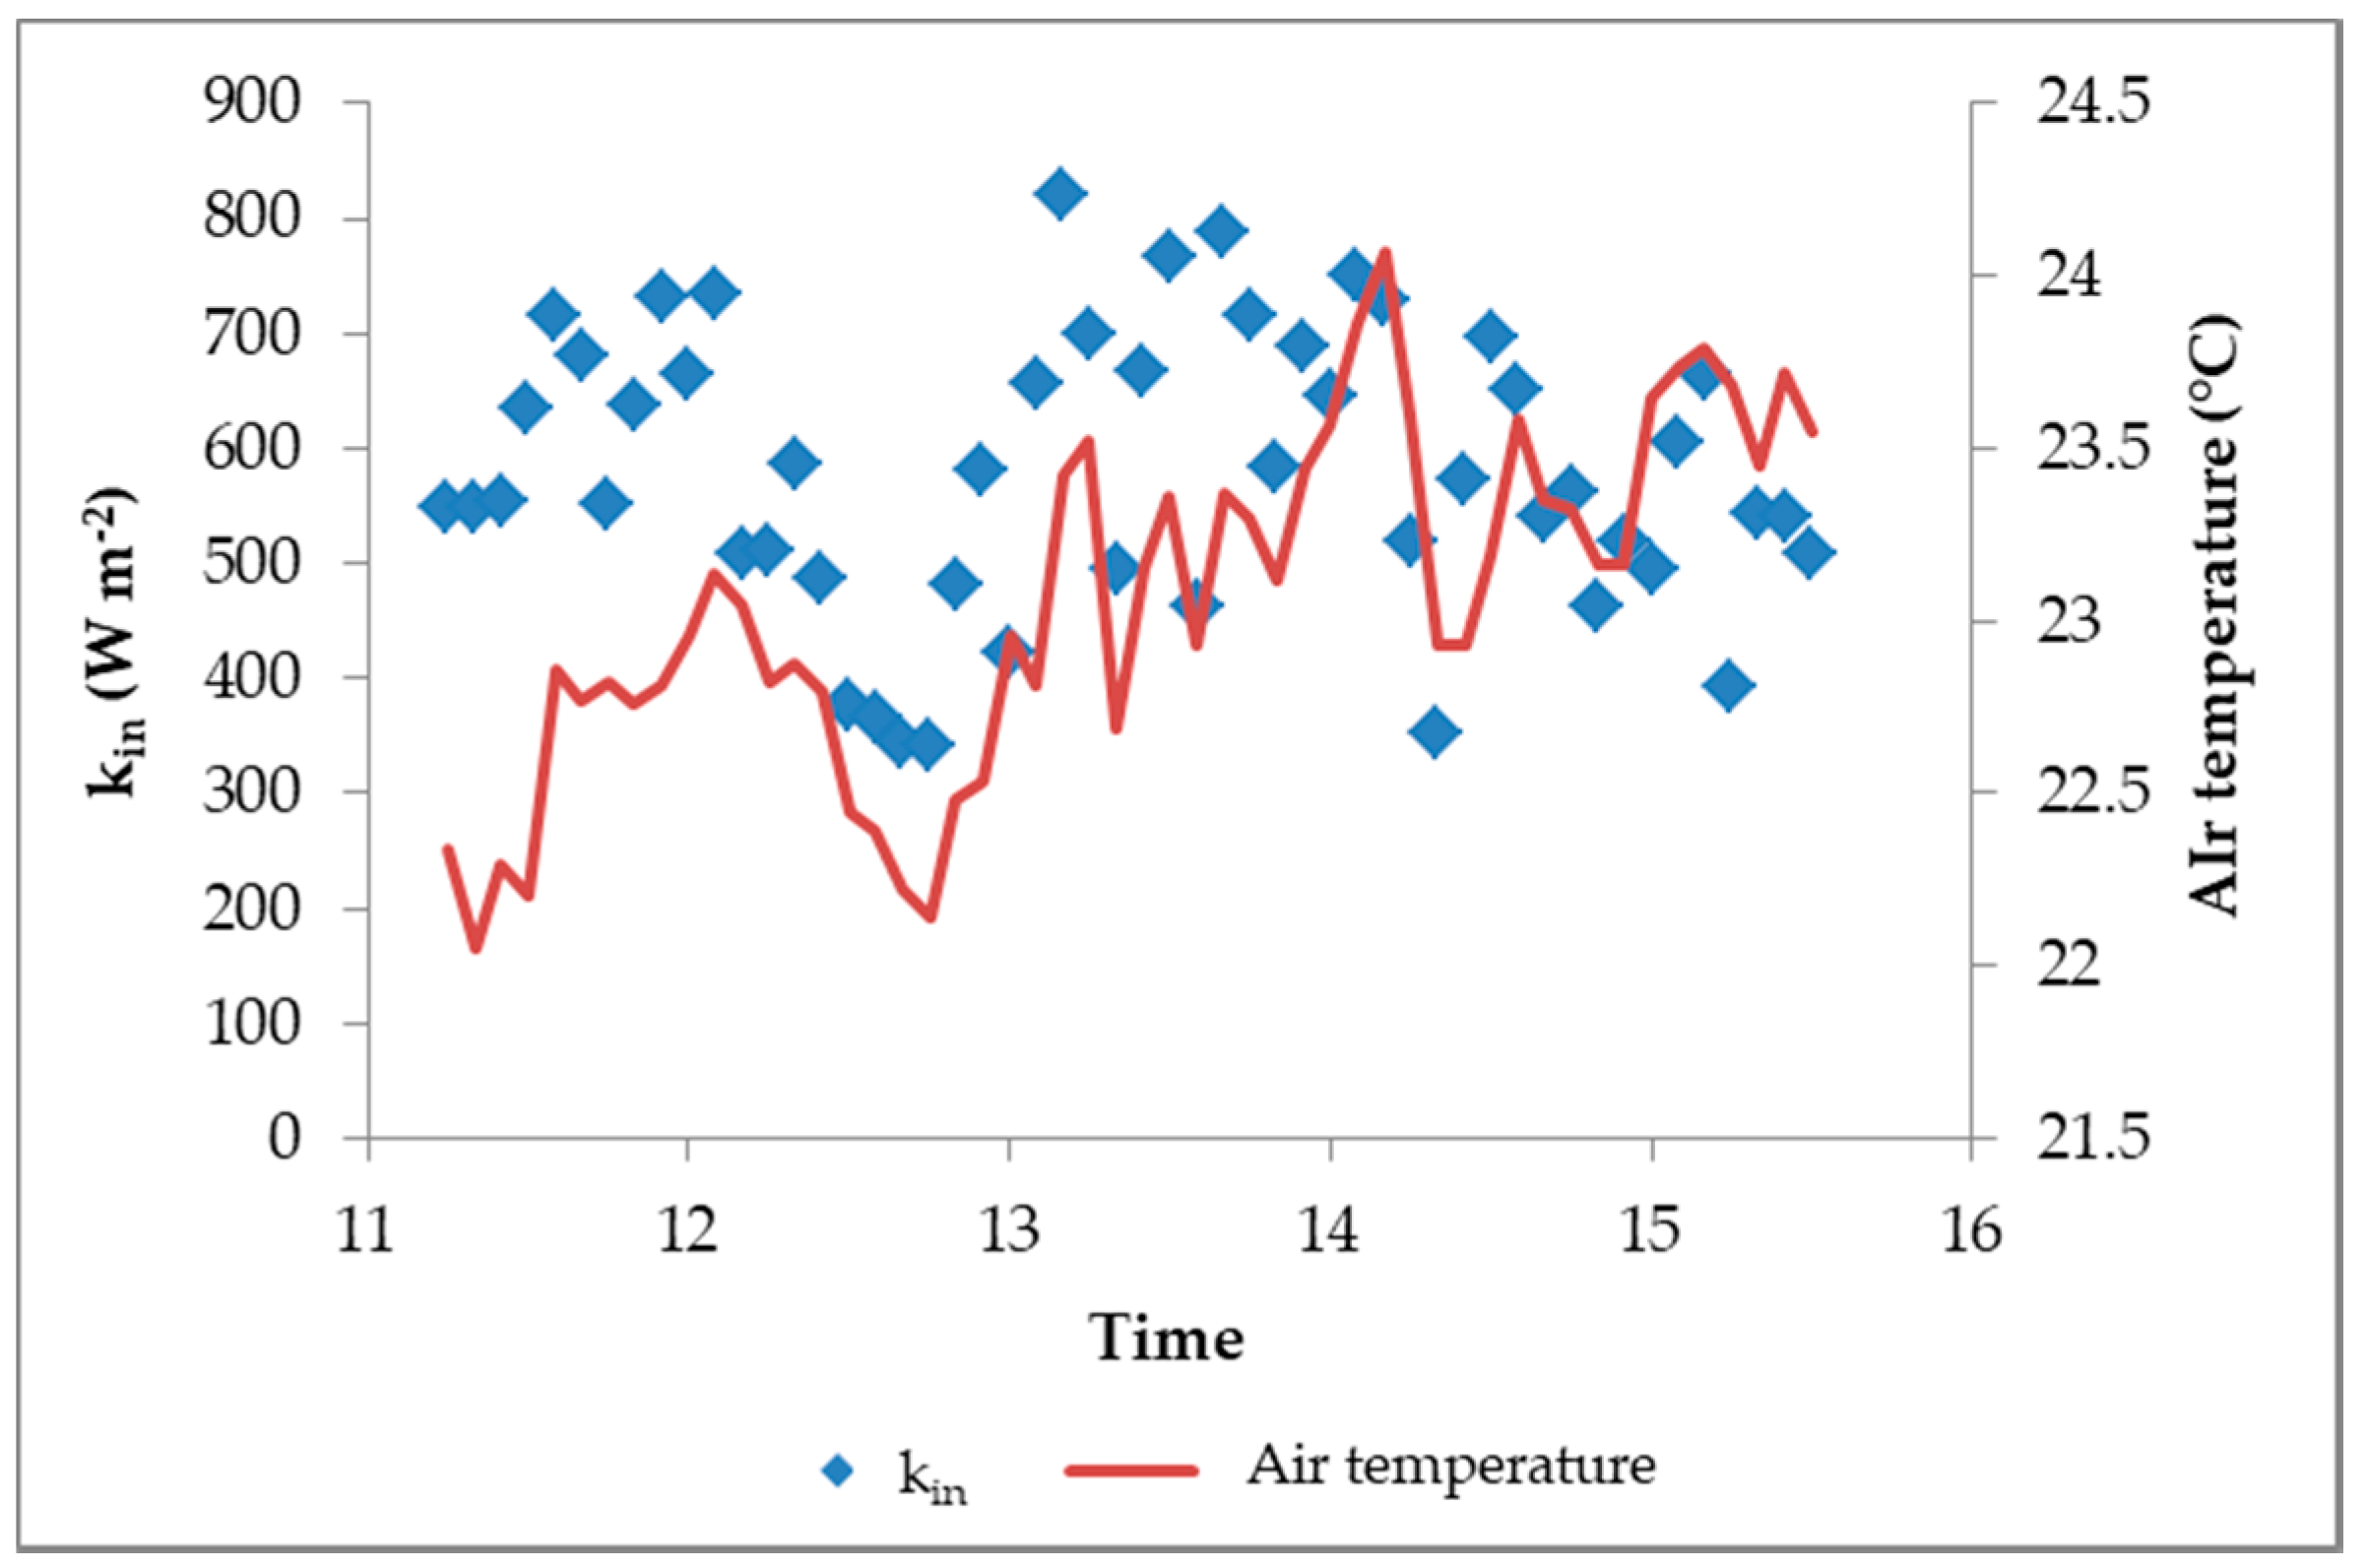
To give a general idea of the air temperature and kin during the analysis period, Figure 5 shows the values of these two variables for a typical day at the reference site. As can be seen, there was a slight increase in temperature throughout the day, with a peak at around 1400. For the kin values, they remained relatively consistent, through there was a fair amount of variation. This variation was likely caused by changes in the surrounding environment (such as the temporary presence of partial cloud cover).
Analysis of the COMFA values will now be presented in order to evaluate and compare the shading strategies. For this analysis, the term “strategy-setting” will be used to indicate the application of one of the shading strategies in one of the settings. For instance, “building-downtown” refers to the building strategy being used at the downtown setting.
3.1. Strategy Effectiveness
A Wilcoxon Rank Sum test determined that each of the strategy-settings caused a statistically significant decrease in the median COMFA value. This indicates that, under conditions similar to what was found in this study, urban spaces which incorporate any of these strategies should provide significant cooling. These results are not that surprising; as stated previously, it has been found that the mean radiant temperature is the main factor in determining the thermal comfort of an individual [8]. More specifically, studies have found that the shade provided by buildings and other structures found in urban settings such as courtyards can provide significant cooling [7,17,19]. Vegetation has also been found to have a strong cooling effect [13,18,35,36,37].
In order to compare the impact of the strategies, the variable being analyzed (such as the COMFA value) needed to be normalized. Thus, the strategy value of the variables was divided by its corresponding reference value. This ratio is termed the “X ratio”, where X is the variable being studied (for example, “COMFA ratio”).
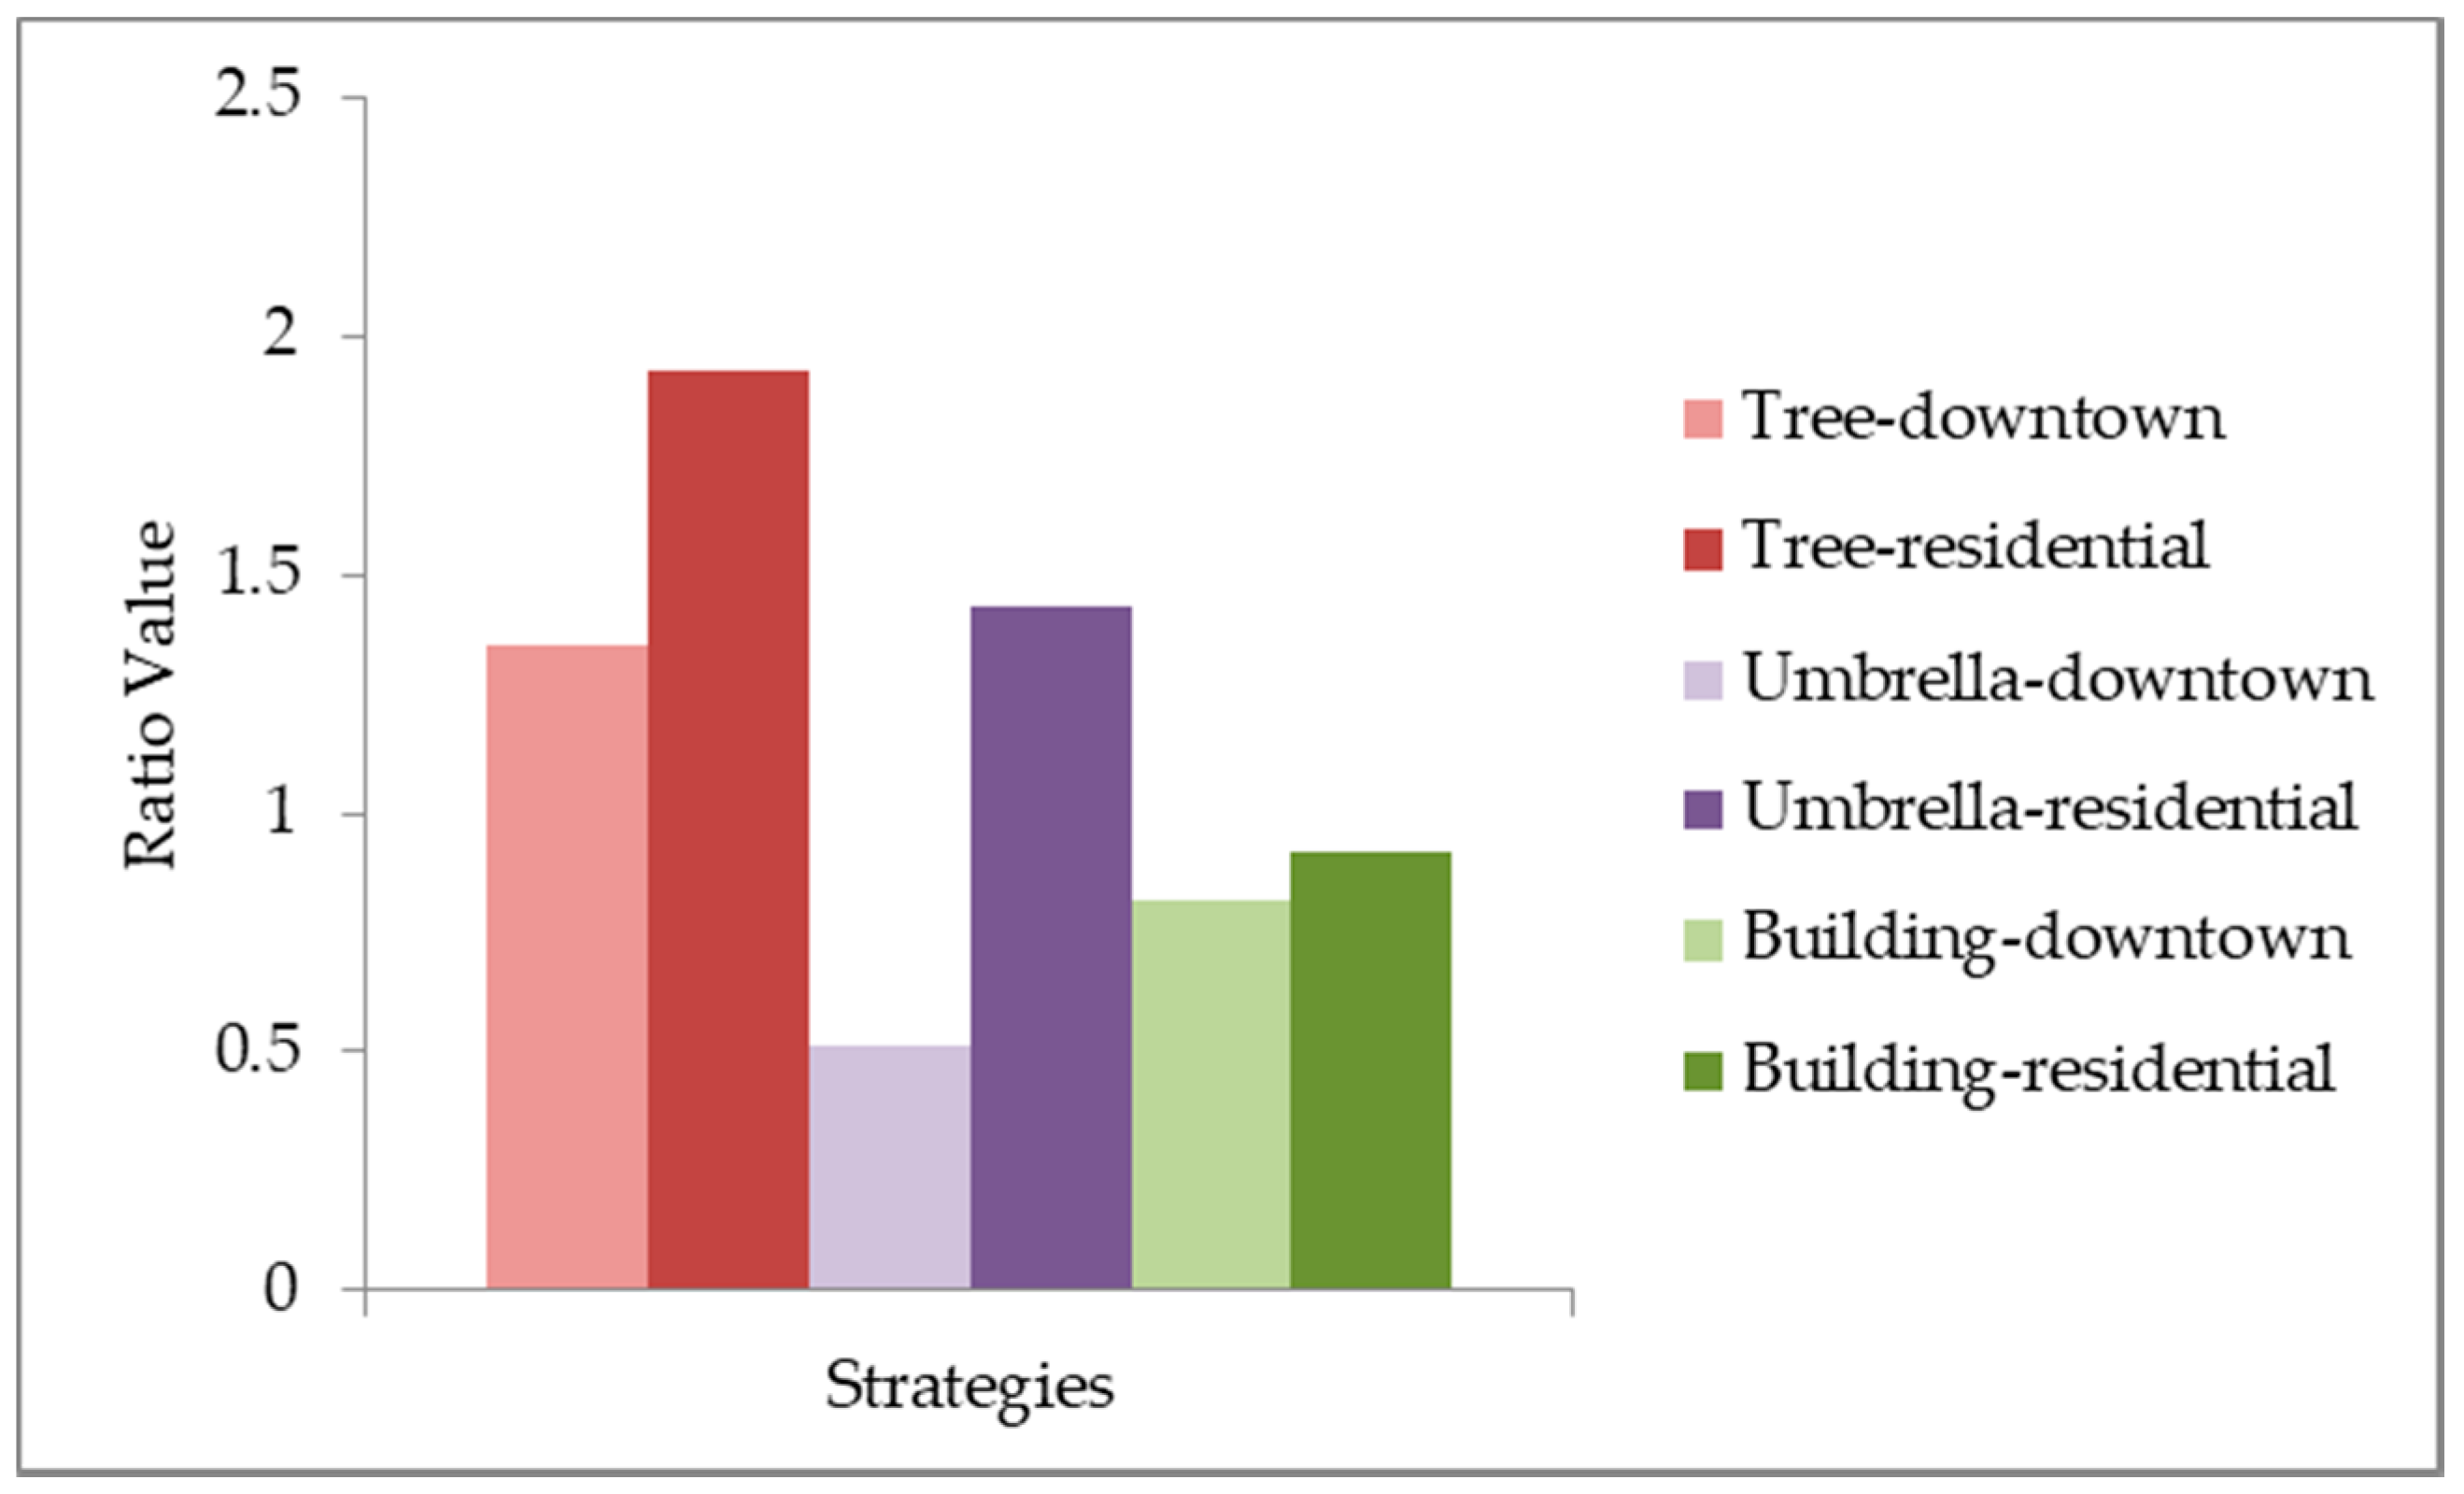
The COMFA ratio can be used to determine how effective a shade strategy is (a lower value indicates a strategy that is more effective). Using the COMFA ratios from each strategy-setting, a Kruskal–Wallis test determined that at least one of these ratios differed from the rest (median ratio values can be found in Table 3), indicating that the cooling caused by each of the strategy-settings was not equal. A series of 2-sample Wilcoxon Rank sum tests were then used to compare the strategy-setting COMFA ratios; the Holm–Bonferroni method was used to control for Type 1 error. In brief, in a multicomparison scenario, the Holm–Bonferroni method ensures that the correct familywise significance level is maintained by adjusting the significance level of the individual comparisons; this adjustment depends on the number and ordering of the comparisons. Overall it was found that all median values differed significantly from each other at a familywise significance level of 0.05. When lowering the significance level to 0.01, the only median values that did not differ significantly were between the tree-residential and umbrella-residential strategies (with a p-value of 0.0169). Taking into account the ordering of the median values shown in Table 3, this indicates that, on a general basis, the building strategy was the most effective at decreasing the COMFA value since, regardless of setting, this strategy had the lowest median COMFA ratio value. The tree strategy was the next most effective and finally the umbrella strategy. This ordering was not surprising; the building strategy blocks out all of the incoming direct shortwave radiation, while both the tree and umbrella strategies only provide partial shade.
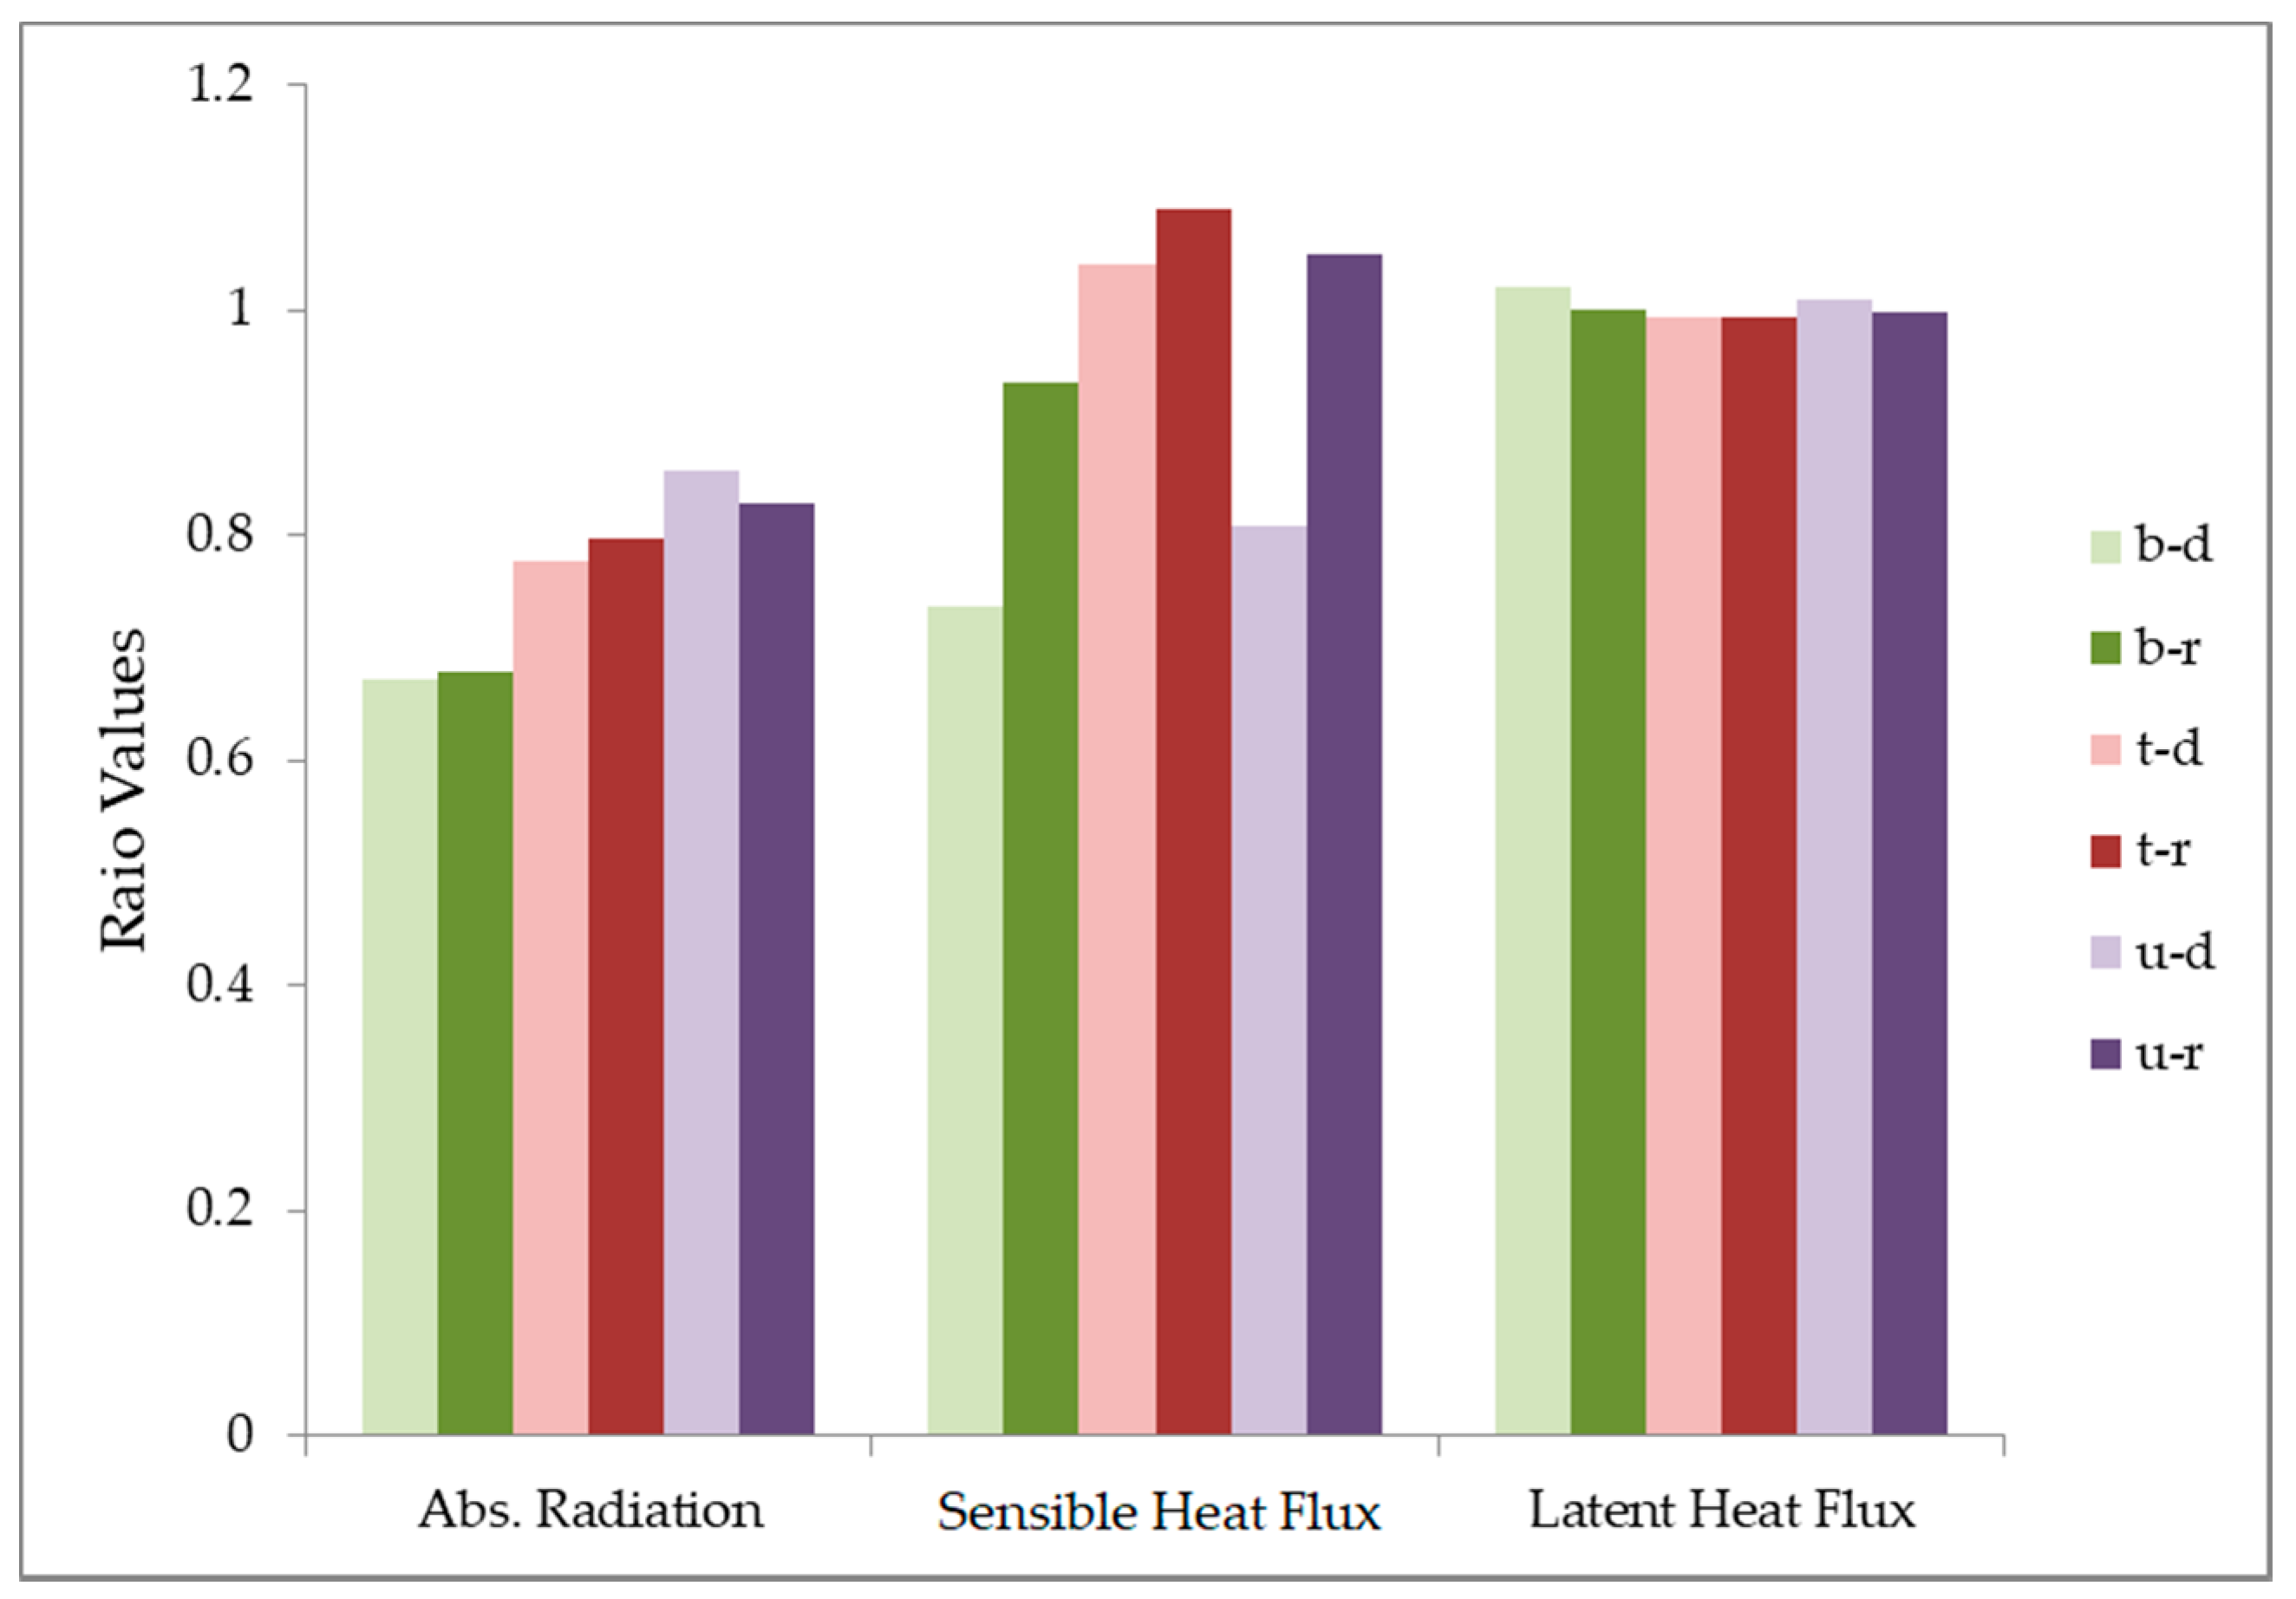
To delve deeper into how each of these strategies affected the human energy budget, an analysis of the various components was undertaken. For this study, the three components that could have been influenced by outside conditions were the latent heat flux, the sensible heat flux, and the absorbed radiation. Figure 6 shows the median ratio for each of these components for each strategy. Absorbed radiation is considered a supplier of energy to the energy budget, while the sensible and latent heat fluxes are considered consumers. Thus, for absorbed radiation, a lower ratio indicates more “cooling”, but for the sensible and latent heat flux a higher ratio indicates more “cooling”.
3.2. Impact on the Latent and Sensible Heat Flux
As can be seen in Figure 6, use of any of the shading strategies in either setting caused very little change in the latent heat flux (all ratios were close to a value of 1). The main driver for the latent heat flux is the difference between the vapor pressure of the skin surface and the vapor pressure of the air. None of the strategies used had a direct impact on the atmospheric vapor pressure. Use of a strategy could have an impact on the skin vapor pressure (through changing the skin temperature), but, evidently, this impact was minimal.
For the sensible heat flux, convective heat loss was greater in the residential setting for all three strategies. The cause for this was likely the higher relative wind speeds found in the residential setting (Figure 7); these changes in wind speeds may be related to microscale differences in the orientation of the buildings and/or of the objects between the two settings. For example, lower wind speeds in the downtown setting of the umbrella strategy could be caused by the fact that the orientation of the buildings funneled the wind in a specific direction that allowed the umbrella to block more of the wind as compared to the residential setting. However, the main thing to note is that the ordering of how effective a strategy-setting was at losing heat through the sensible heat flux differed from the ordering of its overall effectiveness (Figure 6, Table 3).
3.3. Impact on Absorbed Radiation
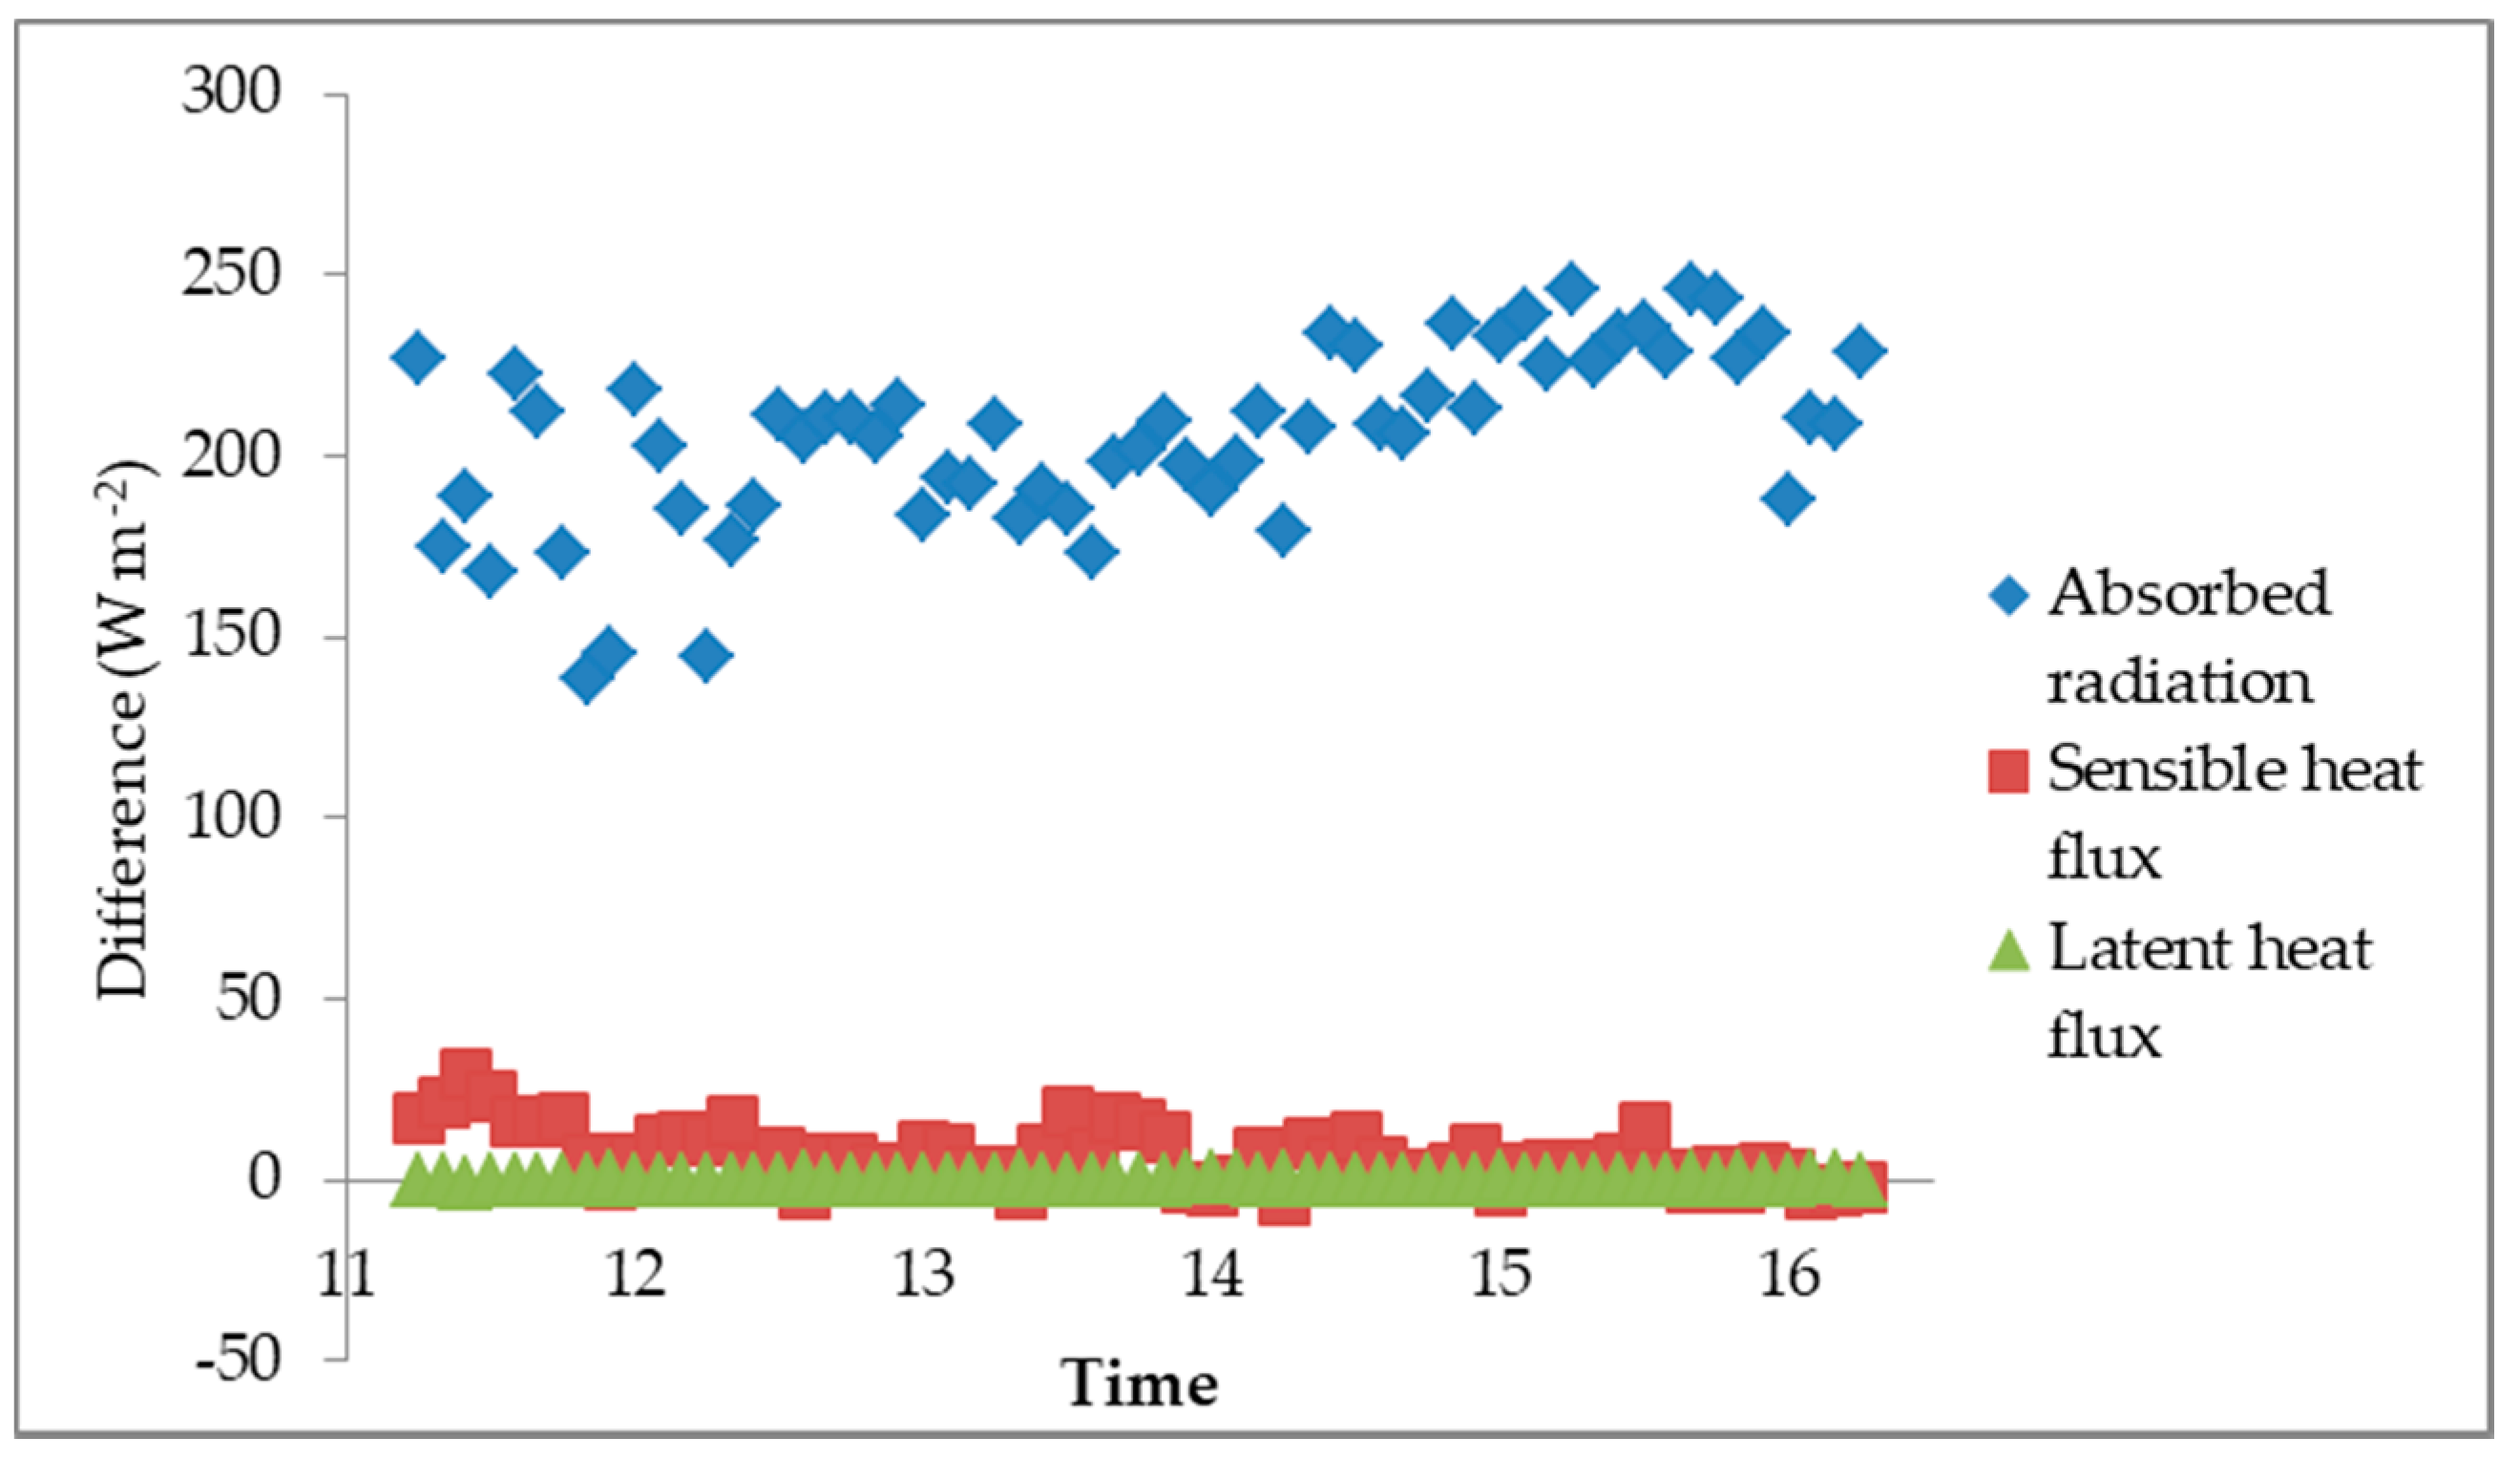
In contrast, the ranking of a strategy-setting’s impact on the absorbed radiation follows the pattern seen in the overall effectiveness of the shading strategy (Figure 6, Table 3). In both cases the building strategy was the most effective, followed by the tree and then the umbrella strategy. In addition, within each strategy, the relative positions of the residential and downtown settings are the same between the absorbed radiation and the overall effectiveness rankings. For instance, in both cases, the downtown site for the building strategy had a lower ratio. This expected close association arose because the strategies had a much larger impact on the absorbed radiation as compared to the other energy budget components. The median decrease in the absorbed radiation caused by all strategies was approximately 139 W m−2, while the median absolute value change in the sensible heat flux caused by all strategies was only approximately 6 W m−2. Figure 8 shows the median decrease for absorbed radiation, sensible heat flux, and latent heat flux for the building strategy in the residential setting during the measurement period; the relative positions of these three variables at all the other strategy-settings were similar. As we can see, the much larger difference values for the absorbed radiation were consistent throughout the day. It should also be noted that the variation is greater in the absorbed radiation as compared to the other two variables. This is likely because of changes in the surrounding environment caused by such factors as thin intermittent cloudiness.
To reinforce the importance of the absorbed radiation term, the COMFA values were recalculated with all of the wind speeds at the reference site set to 1 m s−1 and the wind speeds at the strategy site set to 0.5 m s−1 and then 1.5 m s−1 (Table 4). A comparison of Table 4 with Table 3 shows that there was very little change in the ranking of the cooling efficiencies of the strategies. The only difference was that when the wind speed at the strategy site was set to 0.5 m s−1, the umbrella-residential strategy was more effective than the tree-residential strategy. As mentioned previously, the only difference between two median values that was not significant at the 0.01 significance level was between these two strategies. While admittedly this nonsignificance was small, the difference between the two median values may have been large enough that changing the wind speeds caused the rankings of the two strategies to flip. This finding reinforces the notion of the importance of shortwave radiation in determining the effectiveness of a shading strategy.
3.4. Measurements of Radiation Budget Components
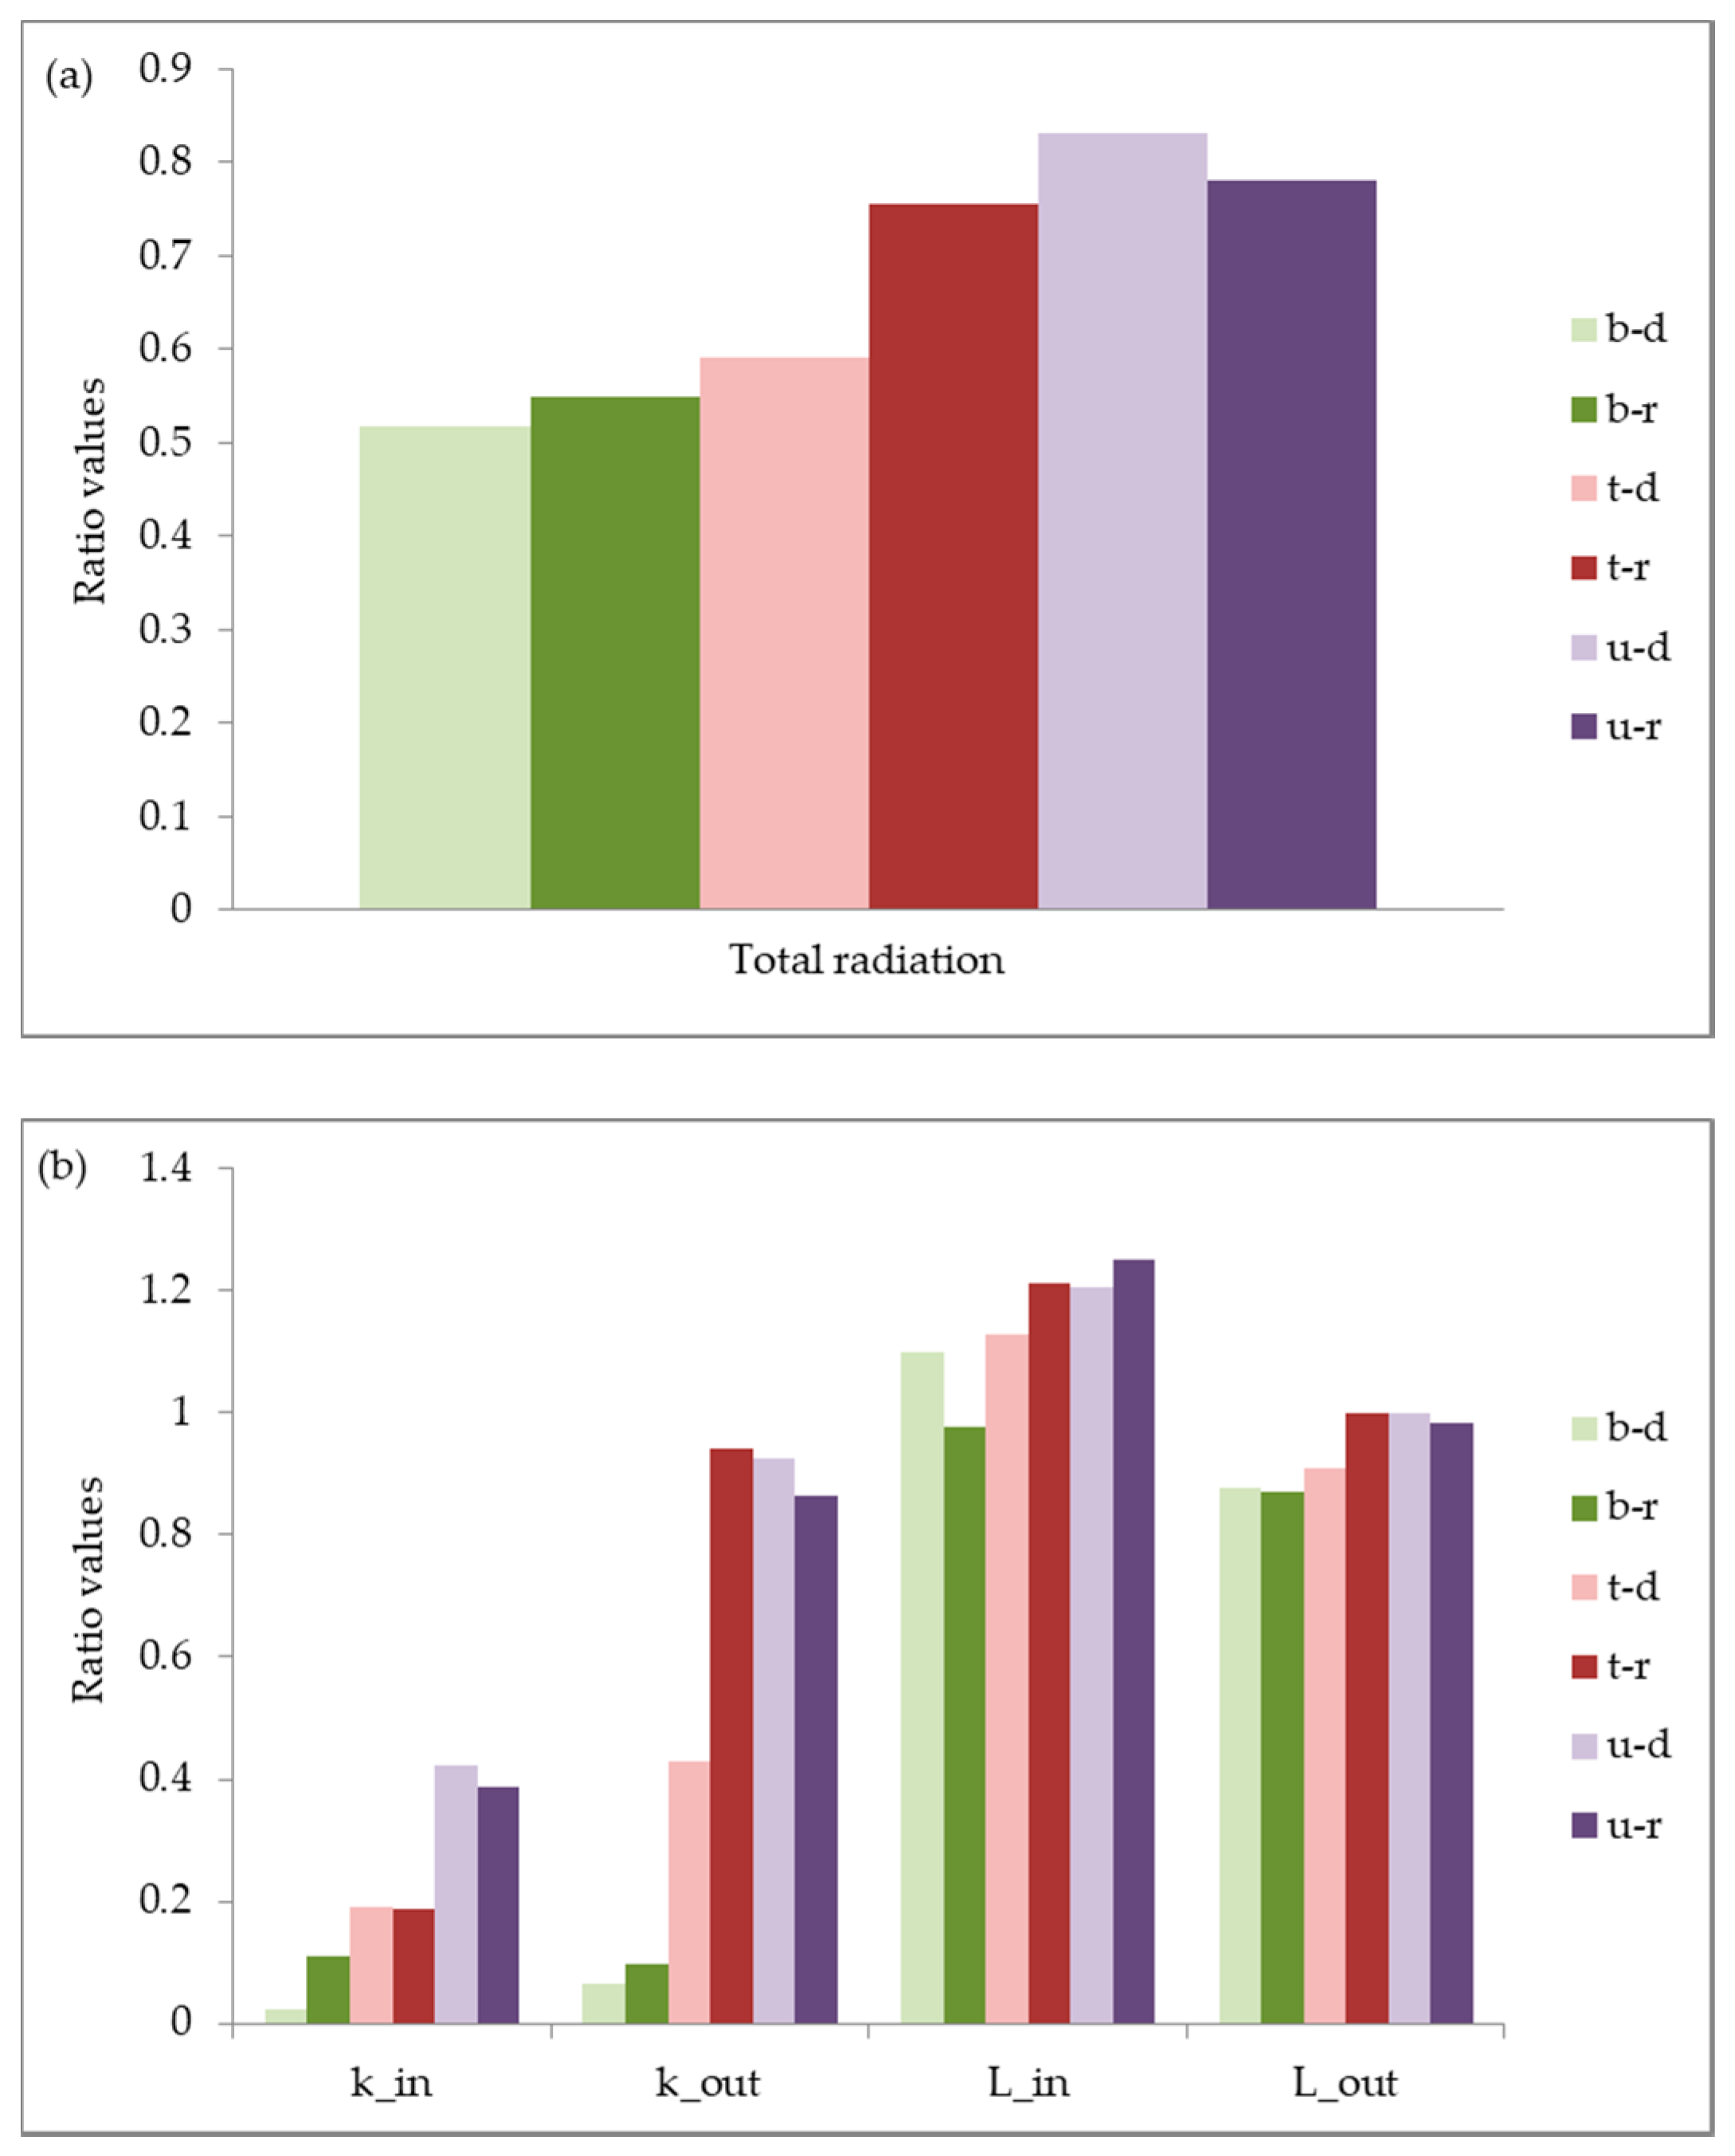
Given the importance of absorbed radiation (particularly shortwave), analysis of the values obtained from the net radiometer may offer some additional insights. While the measurements from the net radiometer were not exactly the same as the amount of radiation that was absorbed by the CRT, because the radiometer sensors were oriented parallel to the ground, they do provide an indication of the amount of incoming longwave and shortwave radiation at the sites. Figure 9a,b show the values obtained from the net radiometers.
The trend for the ratios of the total incoming radiation (the sum of the four values measured by the net radiometer) follows what is seen in the overall effectiveness of the shading strategies; that is, the ratios were lowest for the building strategy, then the tree, and finally the umbrella (Figure 9a, Table 3). Taking a closer look at the individual components measured by the net radiometer, many of these values also follow what is seen in the overall effectiveness (Figure 9b, Table 3). For instance, for kin, the ratio values were lowest for the building strategy, followed by the tree, and then the umbrella strategy. This makes sense as in this study kin mainly consists of incoming direct shortwave radiation (or sunlight).
However, there are also some deviations between the trends seen in the overall effectiveness and the individual radiation components. One is how the Lin value for the building-downtown strategy is similar to the tree-downtown value. This is likely due to the fact that the building-downtown strategy site had a slight overhang over it, increasing the amount of incoming longwave radiation.
A major deviation to note is how kin for the downtown-tree strategy is slightly higher than the residential-tree strategy even though the downtown-tree strategy is more effective. The higher kin value for the tree-downtown strategy was potentially caused by the fact that the shading in this setting was provided by three small trees. In contrast, shade in the residential setting was provided by one larger tree; this resulted in more shade (Figure 3), which would have caused a lower kin value. The reason why the tree-downtown strategy was still more effective was because the other components of absorbed radiation (kout, Lin, and Lout) had a higher value at the residential setting and, therefore, they were able to “counteract” the influence of kin on the overall effectiveness (Figure 9b). Similar to kin, the trends seen in these three components can also be explained by the fact that only one tree was used in the tree-residential strategy. First, the greater shade provided by the tree in the residential setting would have resulted in more incoming longwave radiation and a higher Lin ratio. Second, since there was only one tree present at the residential site, less of the surrounding ground outside the main measurement site was shaded. This would mean that more shortwave would be reflected from the ground, hence the higher kout ratio value. Finally, since more of the shortwave radiation was hitting the surrounding ground, the ground temperature should be slightly higher, resulting in a higher Lout ratio value.
Overall, these results still support the notion that it is the ability of a shading strategy to block out incoming sunlight that has the greatest impact on its effectiveness. However, they also indicate that other components of the absorbed radiation can play an important role.
3.5. Impact of Vegetation
Something to highlight among the results is how the vegetation strategy was less effective than the building strategy. These results contrast with other studies that have found that shade from a tree and shade from a built structure provided similar benefits to the thermal comfort of an individual [5,38]. Along similar lines, many studies have established that the planting of trees and establishment of parks is a very effective way to cool an area and an individual [13,18,35,36,39]. For instance, in the urban canyons of Athens, Greece, increasing the tree coverage from 7.8% to 50% decreased the noon PET by 8.2 °C [36]. The cooling effect of vegetation is attributed to a variety of reasons, including its higher albedo compared with many urban surfaces [40], its ability to evapotranspire [40], and its shading ability [18,36]. Due to these multiple routes of cooling, one would expect a vegetation-based cooling strategy to be more effective than what was seen in this study.
The most likely reason why this high level of effectiveness was not seen is because of the low number of trees present in the tree strategy. In all of the previously mentioned studies, the vegetation consisted of a park or large grouping of trees. In this study, the tree strategy consisted of a single tree in the residential setting and three trees in the downtown setting. Thus, from a conceptual basis, this makes sense since fewer trees will mean less cooling due to evapotranspiration, albedo, and shading. The lack of shading in the tree-downtown strategy is seen in Figure 6 and Figure 9b, where both its absorbed radiation and the shortwave radiation ratios were higher than those of the building strategy. Studies have found that in vegetated areas, a decrease in sky view factor (caused by a denser tree canopy) increases thermal comfort [41,42,43]. However, it should be noted that this relationship is not continuous, as it has been found that at one point an increase in the number of trees will cause a decrease in thermal comfort due to the trees blocking the wind [42,44].
3.6. Differences between Settings
Looking at the effectiveness of the strategy-settings (Table 3), another element that emerged was the minor changes that occurred in strategy ranking between the two settings. Both the building and vegetation strategies were more effective in the downtown site compared with in the residential one. However, for the umbrella strategy this was reversed, with the strategy at the residential site more effective.
Focusing on the building strategy, the main reason why the downtown site was more effective was because of its ability to prevent radiation absorption (Figure 6), specifically kin and kout (Figure 9b). This was likely caused by the “more complete” shading in the downtown setting, as the strategy site was found under a slight overhang of a building. Moving onto the tree strategy, we see that the strategy in the downtown setting was also better at diverting radiation absorption than the residential setting, which explains its increased effectiveness (Figure 6). As stated previously, this was not due to a lower kin ratio value, but due to the lower kout ratio value as well as lower ratio values for both longwave radiation components (Figure 9b). Finally, for the umbrella strategy the residential setting was more effective because of its slightly lower radiation absorption ratio and a much higher sensible heat ratio (Figure 6). As stated earlier, the reason for the higher sensible heat ratio is because of the higher wind speeds experienced for the strategy in the residential setting (Figure 7).
These results indicate how components of the energy budget other than shortwave radiation can have an impact on a strategy’s effectiveness. This was not surprising as other studies have noted that elements such as wind speed and absorbed longwave radiation can have an impact on thermal comfort [45,46,47]. One of the potential implications of these results is that under conditions in which the absorbed shortwave is lower (such as in hot and humid conditions with cloudy skies), the ordering of the effectiveness of these strategies could change.
3.7. Urban Planning and Future Research
In general, urban planners have not taken into account the thermal comfort implications of the design of a city [10]. Given the expected increase in hot conditions caused by climate change, this will likely change. The urban planning implications of this study indicate that providing adequate shade is one strategy that can be used to address this issue. This shading could be in the form of more parks in a city or a greater number of umbrellas and awnings on buildings. This finding is not entirely new, but it reinforces what has been stated in previous studies. Another implication of this study is that while prevention of shortwave radiation absorption is the main factor in increasing thermal comfort, other factors (such as wind speed and longwave radiation absorption) can play a role. This is particularly relevant as it indicates that in conditions when shortwave radiation is low, incorporation of strategies focused on other variables may be needed. A future area of research would be to determine what the exact conditions are that necessitate a certain type of strategy. Related to this, another future area of study is to run a similar in-depth analysis but in a greater variety of settings and configurations than were used in this study. For instance, as touched upon in Section 3.5, the results from the vegetation strategy were influenced by the fact that relatively few trees were used in this study. Given that incorporation of parks is a common strategy in urban planning, analysis of the shading strategy with multiple trees would be useful. Another idea would be to analyze a greater variety of building configurations as it is known that this can influence wind speed and, thus, sensible and latent heat fluxes.
If the finding of the building strategy being the most effective was taken to its logical conclusion, it would indicate that cities should be designed in a way to have deeper urban canyons and, hence, higher density. A future area of research could be to explore in more detail the impact of building cities in this manner. There have been studies that have found that individuals were more thermally comfortable in urban areas with deeper canyons [48]. Similarly, a study of Gothenberg, Sweden, determined that, under clear and warm weather conditions, individuals would be more thermally comfortable in the denser areas of the city [10]. In contrast, it has also been found that an increase in density tends to increase the temperature of the area [49]. This is likely attributed to the fact that in denser areas, there are more built surfaces. Thus, more heat is being stored [50], increasing temperature, particularly at night. In addition, deeper urban canyons tend to decrease wind speed [51], which can also have a large impact on the thermal comfort [9,44] through its influence on convective fluxes.
4. Conclusions
This study found that obtaining shade from an umbrella, tree, and building all provided a significant amount of cooling. More specifically, as shown in Table 3 and Table 4, the building shading strategy was the most effective, followed by the tree shading strategy, and finally the umbrella shading strategy.
Analyzing the impact of each of the strategies on the human energy budget, it was found that the main determinant of this ranking was the strategy’s ability to prevent absorption of shortwave radiation, as indicated in Figure 8 and Figure 9. This was expected—because the measurements were made during sunny conditions, shortwave radiation was the main supplier of energy. However, this study also found that other components of the human energy budget (such as the sensible heat flux or longwave radiation absorption) can also have a noticeable impact on the effectiveness of a strategy. This finding suggests that under conditions where the amount of absorbed solar radiation is lessened, the effectiveness rankings may change.
The results of this study can contribute to the discussion of how urban space design can be used to help populations adapt to the hotter conditions caused by climate change. Many studies have found that the design of urban spaces can have a significant impact on the thermal comfort of individuals [7,38]. Future research in this area could focus on evaluating shading strategies in a greater variety of conditions and investigating the full implications of incorporating certain strategies in an urban environment.
Acknowledgments
The authors would like to thank Robert Brown for his advice on the composition of this journal article, Jon Warland for use of his net radiometers and Karen VanKerkoerle for assistance in the drawing of the figures depicting experimental field sites. Funding for this study came from a Natural Sciences and Engineering Research Council (NSERC) of Canada Discovery Grant and a NSERC of Canada Postgraduate Scholarship–Doctoral.
Author Contributions
In this study: Ivan Lee, Terry J. Gillespie and James A. Voogt conceived and designed the experiments; James A. Voogt provided some instrumentation; Ivan Lee performed the experiments; Ivan Lee analyzed the data; Ivan Lee wrote the paper; Terry J. Gillespie and James A. Voogt provided comments to the paper.
Conflicts of Interest
The authors declare no conflict of interest.
References
- Confalonieri, U.; Menne, B.; Akhtar, R.; Ebi, K.L.; Hauengue, M.; Kovats, R.S.; Revich, B.; Woodward, A. Human health. In Climate Change 2007: Impacts, Adaptation and Vulnerability. Contribution of Working Group II to the Fourth Assessment Report of the Intergovernmental Panel on Climate Change; Parry, M.L., Canziani, O.F., Palutikof, J.P., van der Linden, P.J., Hanson, C.E., Eds.; Cambridge University Press: Cambridge, UK, 2007; pp. 391–431. [Google Scholar]
- Semenza, J.C.; Rubin, C.H.; Falter, K.H.; Selanikio, J.D.; Flanders, W.D.; Howe, H.L.; Wilhelm, J.L. Heat-related deaths during the July 1995 heat wave in Chicago. N. Engl. J. Med. 1996, 335, 84–90. [Google Scholar] [CrossRef] [PubMed]
- Le Tertre, A.; Lefranc, A.; Eilstein, D.; Declercq, C.; Medina, S.; Blanchard, M.; Chardon, B.; Fabre, P.; Filleul, L.; Jusot, J.; et al. Impact of the 2003 heatwave on all-cause mortality in 9 French cities. Epidemiology 2006, 17, 75–79. [Google Scholar] [CrossRef] [PubMed]
- United Nations Department of Economic and Social Affairs/Population Division. World Urbanization Prospects: The 2011 Revision Highlights; United Nations: New York, NY, USA, 2012. [Google Scholar]
- Lee, H.; Holst, J.; Mayer, H. Modification of Human-Biometeorologically Significant Radiant Flux Densities by Shading as Local Method to Mitigate Heat Stress in Summer within Urban Street Canyons. Adv. Meteorol. 2013, 2013, 312572. [Google Scholar] [CrossRef]
- Middel, A.; Häb, K.; Brazel, A.J.; Martin, C.A.; Guhathakurta, S. Impact of urban form and design on mid-afternoon microclimate in Phoenix Local Climate Zones. Landsc. Urban. Plan. 2014, 122, 16–28. [Google Scholar] [CrossRef]
- Taleghani, M.; Kleerekoper, L.; Tenpierik, M.; van den Dobbelsteen, A. Outdoor thermal comfort within five different urban forms in the Netherlands. Build. Environ. 2015, 83, 65–78. [Google Scholar] [CrossRef]
- Vanos, J.K.; Warland, J.S.; Gillespie, T.J.; Kenny, N.A. Review of the physiology of human thermal comfort while exercising in urban landscapes and implications for bioclimatic design. Int. J. Biometeorol. 2010, 54, 319–334. [Google Scholar] [CrossRef] [PubMed]
- Algeciras, J.A.R.; Coch, H.; Pérez, G.D.P.; Years, M.C.; Matzarakis, A. Human thermal comfort conditions and urban planning in hot-humid climates—The case of Cuba. Int. J. Biometeorol. 2016, 60, 1151–1164. [Google Scholar] [CrossRef] [PubMed]
- Lindberg, F.; Thorsson, S.; Rayner, D.; Lau, K. The impact of urban planning strategies on heat stress in a climate-change perspective. Sustain. Cities Soc. 2016, 25, 1–12. [Google Scholar] [CrossRef]
- Aleksandrowicz, O.; Vuckovic, M.; Kiesel, K.; Mahdavi, A. Current trends in urban heat island mitigation research: Observations based on a comprehensive research repository. Urban Clim. 2017, 21, 1–16. [Google Scholar] [CrossRef]
- Shashua-Bar, L.; Tsiors, I.X.; Hoffman, M.E. A modeling study for evaluating passive cooling scenarios in urban streets with trees. Case study: Athens, Greece. Build. Environ. 2010, 45, 2798–2807. [Google Scholar] [CrossRef]
- Shashua-Bar, L.; Pearlmutter, D.; Erell, E. The cooling efficiency of urban landscape strategies in a hot dry climate. Landsc. Urban Plan. 2009, 92, 179–186. [Google Scholar] [CrossRef]
- Lindberg, F.; Holmer, B.; Thorsson, S. SOLWEIG 1.0—Modelling spatial variations of 3D radiant fluxes and mean radiant temperature in complex urban settings. Int. J. Biometeorol. 2008, 52, 697–713. [Google Scholar] [CrossRef] [PubMed]
- Mayer, H.; Höppe, P. Thermal comfort of man in different urban environments. Theor. Appl. Climatol. 1987, 38, 43–49. [Google Scholar] [CrossRef]
- Ng, E.; Cheng, V. Urban human thermal comfort in hot and humid Hong Kong. Energy Build. 2012, 55, 51–65. [Google Scholar] [CrossRef]
- Pearlmutter, D.; Bitan, A.; Berliner, P. Microclimatic analysis of “compact” urban canyons in an arid zone. Atmos. Environ. 1999, 33, 4143–4150. [Google Scholar] [CrossRef]
- Vanos, J.K.; Warland, J.S.; Gillespie, T.J.; Slater, G.A.; Brown, R.D.; Kenny, N.A. Human energy budget modeling in urban parks in Toronto and applications to emergency heat stress preparedness. J. Appl. Meteorol. Clim. 2012, 51, 1639–1653. [Google Scholar] [CrossRef]
- Wong, N.H.; Jusuf, S.K. Study on the microclimate conditions along green pedestrian canyon in Singapore. Archit. Sci. Rev. 2011, 53, 196–212. [Google Scholar] [CrossRef]
- Stewart, I. Redefining the Urban Heat Island. Ph.D. Thesis, University of British Columbia, Vancouver, BC, Canada, October 2011. [Google Scholar]
- Stocco, S.; Canton, M.A.; Correa, E.N. Design of urban green square in dry areas: Thermal performance and comfort. Urban For. Urban Green. 2015, 14, 323–335. [Google Scholar] [CrossRef]
- Correa, E.; Ruiz, M.A.; Canton, A.; Lesino, G. Thermal comfort in forested urban canyons of low building density. An assessment for the city of Mendoza, Argentina. Build. Environ. 2012, 58, 219–230. [Google Scholar] [CrossRef]
- Gaitani, N.; Mihalakakou, G.; Santamouris, M. On the use of bioclimatic architecture principles in order to improve thermal comfort conditions in outdoor spaces. Build. Environ. 2007, 42, 317–324. [Google Scholar] [CrossRef]
- Brown, R.D.; Gillespie, T.J. Estimating outdoor thermal comfort using a cylindrical radiation thermometer and an energy budget model. Int. J. Biometeorol. 1986, 30, 43–52. [Google Scholar] [CrossRef] [PubMed]
- Kenny, N.A.; Warland, J.S.; Brown, R.D.; Gillespie, T.G. Part A: Assessing the performance of the COMFA outdoor thermal comfort model on subjects performing physical activity. Int. J. Biometeorol. 2009, 53, 415–418. [Google Scholar] [CrossRef] [PubMed]
- Kenny, N.A.; Warland, J.S.; Brown, R.D.; Gillespie, T.G. Part B: Revisions to the COMFA outdoor thermal comfort model for the application to subjects performing physical activity. Int. J. Biometeorol. 2009, 53, 429–441. [Google Scholar] [CrossRef] [PubMed]
- Kenny, N.A.; Warland, J.S.; Brown, R.D.; Gillespie, T.G. Estimating the radiation absorbed by a human. Int. J. Biometeorol. 2008, 52, 491–503. [Google Scholar] [CrossRef] [PubMed]
- Historical Climate Data. Available online: http://climate.weather.gc.ca/ (accessed on 30 November 2014).
- Souch, C.A.; Souch, C. The effect of trees on summertime below canopy urban climates: A case study Bloomington, Indiana. J. Arboric. 1993, 19, 303–312. [Google Scholar]
- Oke, T.R. Boundary Layer Climates, 2nd ed.; Methuen: New York, NY, USA, 1987. [Google Scholar]
- Vanos, J.; University of California San Diego, San Diego, CA, USA. Personal communication, 2014.
- Lindberg, F.; Holmer, B. SkyViewFactorCalculator, version 1.1; Goteborg Urban Climate Group, University of Gothenburg: Göteborg, Sweden, 2010. [Google Scholar]
- Matthias, A.D.; Post, D.F.; Accioly, L.; Fimbres, A.; Sano, E.E.; Batchily, A.K. Measurement of albedos for small areas of soil. Soil Sci. 1999, 164, 293–301. [Google Scholar] [CrossRef]
- Harlan, S.L.; Brazel, A.J.; Prashad, L.; Stefanov, W.L.; Larsen, L. Neighborhood microclimates and vulnerability to heat stress. Soc. Sci. Med. 2006, 63, 2847–2863. [Google Scholar] [CrossRef] [PubMed]
- Bowler, D.E.; Buyung-Ali, L.; Knight, T.M.; Pullin, A.S. Urban greening to cool towns and cities: A systematic review of the empirical evidence. Landsc. Urban Plan. 2010, 97, 147–155. [Google Scholar] [CrossRef]
- Shashua-Bar, L.; Tsiors, I.X.; Hoffman, M.E. Passive cooling design options to ameliorate thermal comfort in urban streets of a Mediterranean climate (Athens) under hot summer conditions. Build. Environ. 2012, 57, 110–119. [Google Scholar] [CrossRef]
- Yan, H.; Fan, S.X.; Guo, C.X.; Hu, J.; Dong, L. Quantifying the impact of land cover composition on intra-city air temperature variations at a mid-latitude city. PLoS ONE 2014, 9, e102124. [Google Scholar] [CrossRef] [PubMed]
- Middel, A.; Selover, N.; Hagen, B.; Chhetri, N. Impact of shade on outdoor thermal comfort-a seasonal field study in Tempe, Arizona. Int. J. Biometeorol. 2016, 60, 1849–1861. [Google Scholar] [CrossRef] [PubMed]
- Yan, H.; Fan, S.X.; Guo, C.X.; Wu, F.; Zhang, N.; Dong, L. Assessing the effects of landscape design parameters on intra-city air temperature variability: The case of Beijing, China. Build. Environ. 2014, 76, 44–53. [Google Scholar] [CrossRef]
- Taleghani, M.; Tenpierik, M.; van den Dobbelsteen, A.; Sailor, D.J. Heat in courtyards: A validated and calibrated parametric study of heat mitigation strategies for urban courtyards in the Netherlands. Sol. Energy 2014, 103, 108–124. [Google Scholar] [CrossRef]
- Tan, Z.; Lau, K.K.L.; Ng, E. Urban tree design approaches for mitigating daytime urban heat island effects in a high-density urban environment. Energy Build. 2016, 114, 265–274. [Google Scholar] [CrossRef]
- Morakinyo, T.E.; Lam, Y.F. Simulation study on the impact of tree-configuration, planting pattern and wind condition on street-canyon’s micro-climate and thermal comfort. Build. Environ. 2016, 103, 262–275. [Google Scholar] [CrossRef]
- Norton, B.A.; Coutts, A.M.; Livesley, S.J.; Harris, R.J.; Hunter, A.M.; Williams, N.S.G. Planning for cooler cities: A framework to prioritise green infrastructure to mitigate high temperatures in urban landscapes. Landsc. Urban Plan. 2015, 134, 127–138. [Google Scholar] [CrossRef]
- Hsieh, C.; Jan, F.; Zhang, L. A simplified assessment of how tree allocation, wind environment, and shading affect human comfort. Urban For. Urban Green. 2016, 18, 126–137. [Google Scholar] [CrossRef]
- Acero, J.A.; Herranz-Pascual, K. A comparison of thermal comfort conditions in four urban spaces by means of measurements and modelling techniques. Build. Environ. 2015, 93, 245–257. [Google Scholar] [CrossRef]
- Lai, D.Y.; Guo, D.H.; Hou, Y.F.; Lin, C.Y.; Chen, Q.Y. Studies of outdoor thermal comfort in northern China. Build. Environ. 2014, 77, 110–118. [Google Scholar] [CrossRef]
- Schoetter, R.; Grawe, D.; Hoffmann, P.; Kirschner, P.; Gratz, A.; Schlunzen, K.H. Impact of local adaptation measures and regional climate change on perceived temperature. Meteorol. Z. 2013, 22, 117–130. [Google Scholar] [CrossRef]
- Achour-Younsia, S.; Kharrat, F. Outdoor thermal comfort: Impact of the geometry of an urban street canyon in a Mediterranean subtropical climate—Case study Tunis, Tunisia. Procedia Soc. Behav. Sci. 2016, 216, 689–700. [Google Scholar] [CrossRef]
- Perini, K.; Magliocco, A. Effects of vegetation, urban density, building height, and atmospheric conditions on local temperatures and thermal comfort. Urban For. Urban Green. 2014, 13, 495–506. [Google Scholar] [CrossRef]
- Coutts, A.M.; Beringer, J.; Tapper, N.J. Impact of increasing urban density on local climate: spatial and temporal variations in the surface energy balance in Melbourne, Australia. J. Appl. Meteorol. Clim. 2007, 46, 477–493. [Google Scholar] [CrossRef]
- Yang, F.; Qian, F.; Lau, S.S.Y. Urban form and density as indicators for summertime outdoor ventilation potential: A case study on high-rise housing in Shanghai. Build. Environ. 2013, 70, 122–137. [Google Scholar] [CrossRef]
Figure 1.
Diagram of the downtown setting. Light gray areas indicate vegetative surfaces (such as grass, flowers, and bushes), white surface areas indicate built areas (such as concrete and brick). X is the location of the reference site, X1 is the location of the tree strategy site, X2 is the location of the building strategy site, and X3 is the location of the umbrella strategy site. Diagram is not to scale.

Figure 2.
Diagram of the residential setting. Light gray areas indicate vegetative surfaces (such as grass, flowers, and bushes), white surface areas indicate built areas (such as concrete and brick). X is the location of the reference site, X1 is the location of the tree strategy site, X2 is the location of the building strategy site, and X3 is the location of the umbrella strategy site. Diagram is not to scale.
Figure 3.
Hemispherical up photos taken facing up at each of the strategy and reference sites and approximate sky view factors (SVF). Sky view factors were calculated using the SkyViewFactorCalculator [32].
Figure 3.
Hemispherical up photos taken facing up at each of the strategy and reference sites and approximate sky view factors (SVF). Sky view factors were calculated using the SkyViewFactorCalculator [32].

Figure 4.
Instrument setup for the umbrella strategy.
Figure 5.
Air temperature and kin for the reference site on DOY (day of year) 262. Data points are shown for times when data was analyzed.
Figure 5.
Air temperature and kin for the reference site on DOY (day of year) 262. Data points are shown for times when data was analyzed.

Figure 6.
Median ratio values of the various components of the energy budget caused by a strategy. For the identification of the columns, “d” is the downtown setting, “r” is the residential setting, “b” is the building shade strategy, “t” is the tree shade strategy, and “u” is the umbrella shade strategy.

Figure 7.
Median ratio values in the wind speed for the building, tree, and umbrella strategies.

Figure 8.
Median values of the difference between the strategy and reference site for absorbed radiation, sensible heat flux, and latent heat flux. Values are from the building shading strategy in the residential setting.
Figure 8.
Median values of the difference between the strategy and reference site for absorbed radiation, sensible heat flux, and latent heat flux. Values are from the building shading strategy in the residential setting.

Figure 9.
(a) Median ratio values of the total incoming radiation measured by the net radiometer for each strategy. For the identification of the columns, “d” is the downtown setting, “r” is the residential setting, “b” is the building shade strategy, “t” is the tree shade strategy, and “u” is the umbrella shade strategy; (b) Median ratio values in the various components measured by a net radiometer for each strategy. For the x-axis, “k” refers to incoming shortwave radiation, “L” refers to incoming longwave radiation, “in” refers to measurements made from the upward-facing sensor, “out” refers to measurements made from the downward-facing sensor.


Table 1.
Comfort Formula (COMFA) components and the measured variables needed to calculate each one.
Table 1.
Comfort Formula (COMFA) components and the measured variables needed to calculate each one.
| COMFA Component | Measured Variables |
|---|---|
| Human metabolic energy | Air temperature |
| Radiation absorbed | Air temperature, cylindrical radiation thermometer temperature, wind speed |
| Convective sensible heat flux | Air temperature, wind speed |
| Convective latent heat flux | Atmospheric pressure, vapor pressure, wind speed |
| Longwave radiation emitted | Air temperature, wind speed |
Table 2.
Thermal sensations as applied to the COMFA value.
| COMFA Value (W m−2) | Description |
|---|---|
| ≤−201 | Cold |
| −200 to −121 | Cool |
| −51 to −120 | Slightly cool |
| −50 to 50 | Neutral |
| 51 to 120 | Slightly warm |
| 121 to 200 | Warm |
| ≥201 | Hot |
Table 3.
Median COMFA ratio values for each of the strategy-settings; the strategy-settings are listed from most effective (lowest ratio) to least effective.
Table 3.
Median COMFA ratio values for each of the strategy-settings; the strategy-settings are listed from most effective (lowest ratio) to least effective.
| Strategy-Setting | Median |
|---|---|
| Building-Downtown | 0.281 |
| Building-Residential | 0.343 |
| Tree-Downtown | 0.498 |
| Tree-Residential | 0.548 |
| Umbrella-Residential | 0.589 |
| Umbrella-Downtown | 0.732 |
Table 4.
Median of the COMFA ratios caused by each of the strategy-settings when the wind speed was set at 1 m s−1 at the reference site and either 0.5 m s−1 or 1.5 m s−1 at the strategy site.
Table 4.
Median of the COMFA ratios caused by each of the strategy-settings when the wind speed was set at 1 m s−1 at the reference site and either 0.5 m s−1 or 1.5 m s−1 at the strategy site.
| Strategy-Setting | Median COMFA Ratio Values | |
|---|---|---|
| Wind Speed = 0.5 m s−1 | Wind Speed = 1.5 m s−1 | |
| Building-Downtown | 0.293 | 0.255 |
| Building-Residential | 0.378 | 0.361 |
| Tree-Downtown | 0.497 | 0.556 |
| Tree-Residential | 0.532 | 0.585 |
| Umbrella-Residential | 0.522 | 0.674 |
| Umbrella-Downtown | 0.750 | 0.964 |
© 2018 by the authors. Licensee MDPI, Basel, Switzerland. This article is an open access article distributed under the terms and conditions of the Creative Commons Attribution (CC BY) license (http://creativecommons.org/licenses/by/4.0/).
Share and Cite
MDPI and ACS Style
Lee, I.; Voogt, J.A.; Gillespie, T.J. Analysis and Comparison of Shading Strategies to Increase Human Thermal Comfort in Urban Areas. Atmosphere 2018, 9, 91. https://doi.org/10.3390/atmos9030091
AMA Style
Lee I, Voogt JA, Gillespie TJ. Analysis and Comparison of Shading Strategies to Increase Human Thermal Comfort in Urban Areas. Atmosphere. 2018; 9(3):91. https://doi.org/10.3390/atmos9030091
Chicago/Turabian StyleLee, Ivan, James A. Voogt, and Terry J. Gillespie. 2018. "Analysis and Comparison of Shading Strategies to Increase Human Thermal Comfort in Urban Areas" Atmosphere 9, no. 3: 91. https://doi.org/10.3390/atmos9030091
Note that from the first issue of 2016, this journal uses article numbers instead of page numbers. See further details here.