1. Introduction
The influence of clouds on the Earth’s climate system, weather phenomena, and hydrological cycle is well-investigated [
1,
2,
3,
4,
5]. Cloud microphysics determine cloud albedo in the visible and infrared spectral ranges, cloud lifetime, and precipitation properties [
6]. In all these processes, aerosol particles play a crucial role by acting as cloud condensation nuclei (CCN) for liquid droplets or as ice nucleating particles (INPs) for the formation of ice particles. INPs can trigger ice formation at higher subzero temperatures and can be as small as a few nanometers and range up to several micrometers [
7]. They can be produced by natural processes, such as emissions by forests and volcanoes, as well as by anthropogenic processes, such as burning of wood and fuels [
8,
9,
10]. Desert dust, volcanic ashes, and biological particles (including non-proteinaceous and proteinaceous particles) are known as efficient INPs [
8,
9,
10].
In the atmosphere, ice crystals form through heterogeneous and homogeneous ice nucleation processes. Droplets with diameters of 40 µm can supercool to temperatures below −35 °C until homogeneous ice nucleation occurs [
11]. Parcel studies done by Herbert et al. [
12] showed that the temperature dependence of the homogeneous ice nucleation rate coefficient can have a major impact on the homogeneous freezing temperature. It was found that homogeneous freezing temperatures of −30 °C can occur under certain conditions.
Freezing processes triggered by INPs at higher subzero temperatures are referred as heterogeneous freezing [
13]. INPs have a specific surface area providing an interface which can act as a catalyst, reducing the energy barrier of ice nucleation kinetics [
7,
9,
14]. In the atmosphere, aerosol particles represent such catalysts, triggering the freezing process of supercooled water droplets (i.e., at subzero temperatures).
There are several ways in which atmospheric aerosols are thought to nucleate ice in the atmosphere. (1) In the condensation freezing mode, a particle acts as a CCN at temperatures below the melting point of ice and, afterwards, freezes at the same temperature; (2) In the contact freezing mode, the particle initiates freezing when it collides with a supercooled droplet; (3) The deposition mode involves the growth of ice directly on the INP from the vapor phase; (4) In immersion mode, the INP is already suspended in the droplet before the droplet freezes. Nevertheless, studies summarized by Murray et al. [
7] showed that water saturation is a requirement for ice formation in mixed phase clouds and, therefore, either contact or immersion freezing is dominant. Thermophoretic effects only favor contact nucleation in evaporating droplets and these droplets tend to disappear before they can freeze. Then, immersion freezing is suggested to be the most relevant mode in mixed phase clouds [
15]. The experimental setup in this work, is only focused on immersion freezing mode.
In order to study freezing processes in the laboratory, several experimental approaches have been employed in the past, such as cloud chambers, continuous-flow diffusion chambers, levitation in an electrodynamic balance, acoustic levitation, and different kinds of lab bench droplet-freezing setups [
16]. Lab bench droplet-freezing devices can be distinguished based on their droplet generation technique into four groups (
Table 1): (1) Piezo-driven generator [
17]; (2) generation via micro-pipetting [
18,
19,
20,
21,
22,
23]; (3) flow-focusing generator [
24,
25]; and (4) the generation via shaking of a water-oil emulsion in a vial (herein called the vial-shaking technique) [
14,
26,
27,
28]. Generated volumes range from 4 pL (from the vial-shaking technique), to 0.5 nL (from the flow-focusing generator), and up to 400 µL (from the pipetting technique).
While an increased volume allows the quantification of much smaller values of ice nucleation active surface site density
ns [
22], the temperature range in which ice nucleation experiments can be done becomes restricted. The volume dependence of the homogeneous freezing temperature shifts the freezing temperature of ultrapure water to higher temperatures [
29]. Moreover, contamination of ultrapure water droplets with diameters of >1 mm can cause heterogeneous ice nucleation at higher temperatures of about −20 °C [
22].
Nevertheless, the vial-shaking technique has been used in our laboratory for several years and enables the investigation of ice nucleation activity (INA) of droplets with diameters down to 20 µm (4 pL volume) in a wide temperature range down to −38 °C without any restrictions [
14,
26,
27].
However, several issues can occur in the application of this technique. (1) Droplets show a rather broad size distribution, so a more elaborate analysis as the individual calculation of surface area present in each single droplet, is required [
14,
26,
27]; (2) Contact between droplets can lead to possible droplet–droplet interactions during the freezing process. Frozen droplets can act as INP themselves for yet unfrozen ones (herein called infectious freezing); (3) The interface between droplets and the oil matrix can interfere with the nucleation process. If a hydrophobic INP (e.g., graphene) is immersed in an oil-water mixture, it is possible that the hydrophobic sample gets drawn into the oil phase [
26]. This possibility is especially true during the shaking process when a high kinetic energy is applied, increasing the probability of hydrophobic INPs getting drawn into the oil matrix. This migration can significantly lower the concentration of the INPs in the water droplets. However, a precise quantification of this effect is rather difficult; (4) Partial crystallization and changes in viscosity of the oil matrix due to decreasing temperatures can cause impaired vision. All these issues can cause more labor intensive evaluation and false positive or false negative freezing events [
30].
Our new approach for droplet-freezing experiments aims to reduce these issues as e.g., a nonuniform droplet size distribution, while still providing the ability to create small droplets and to investigate them in a wide temperature range.
2. Description of the New Setup
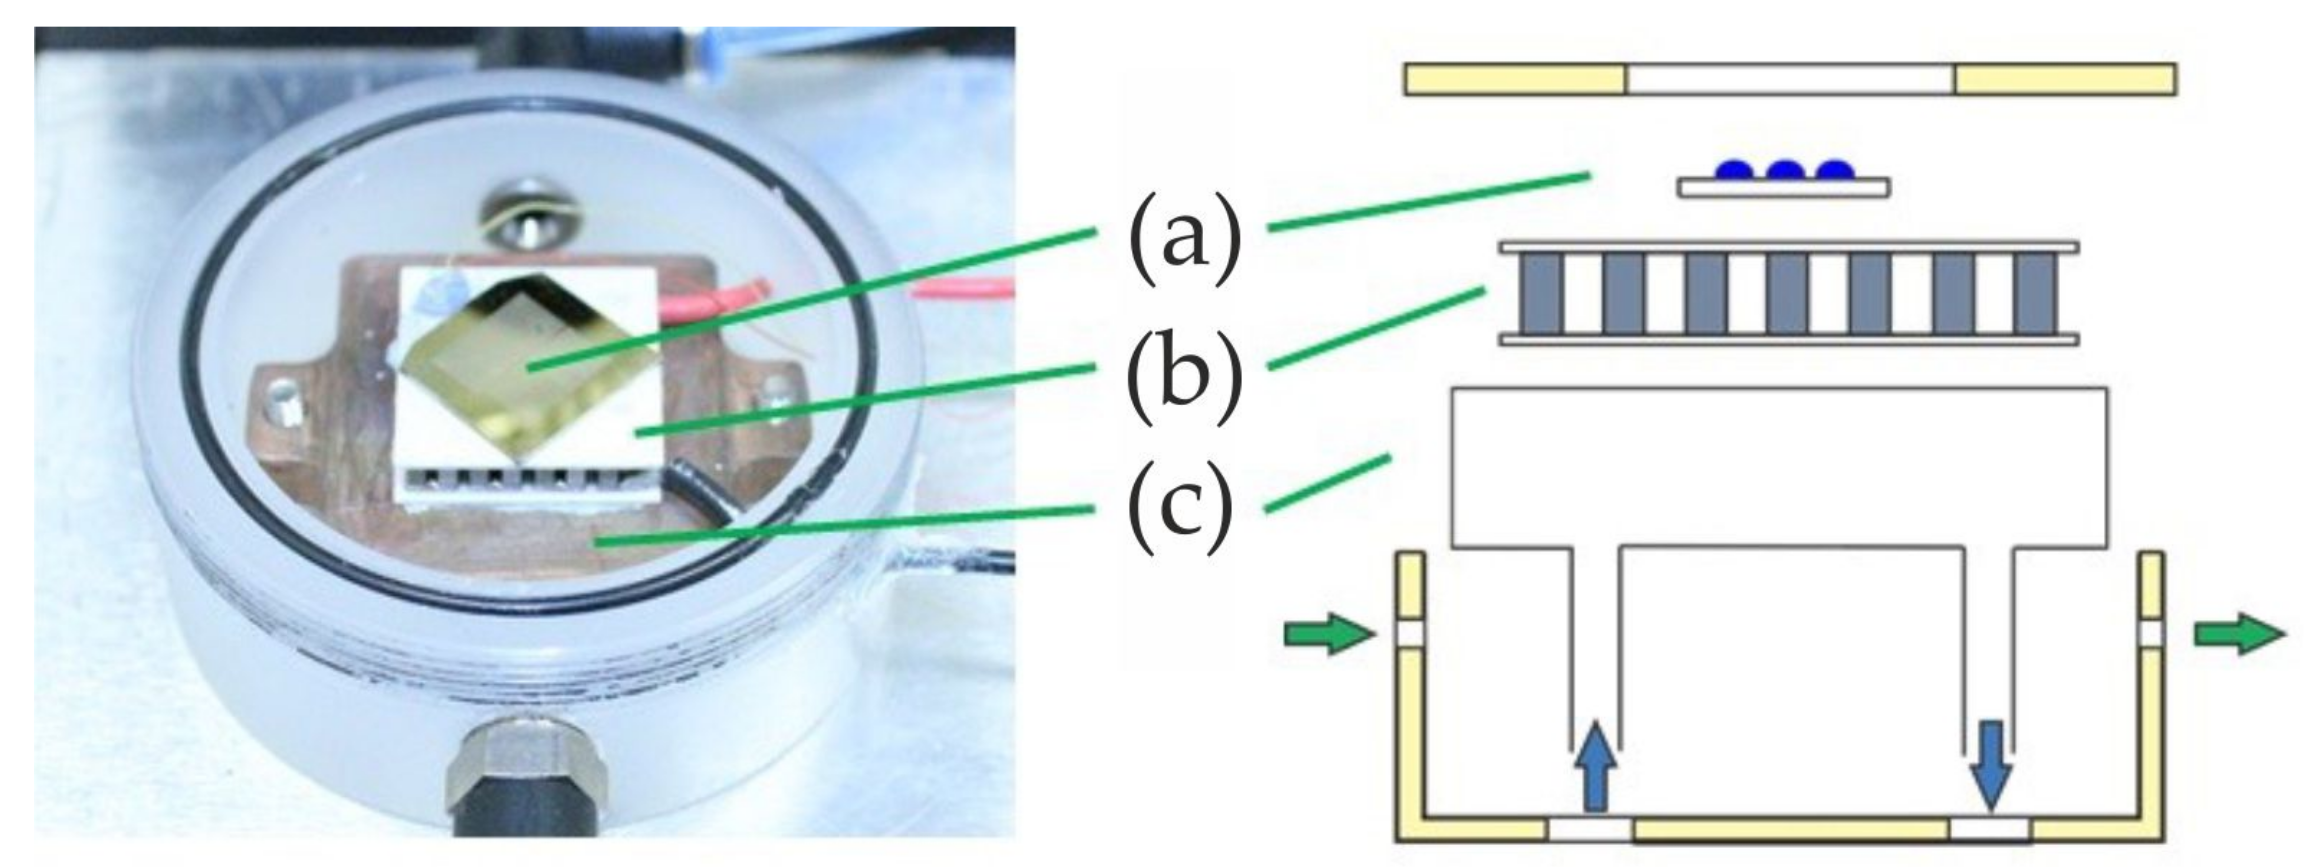
The experimental setup consists of four main parts: (1) the light microscope including a HD camera to observe the freezing experiment; (2) the freezing-cell to cool down the sample; (3) the freezing chip carrying an ensemble of droplets; and (4) a computer to control the cell temperature and cooling rate, as well as to record and evaluate pictures of the freezing droplets.
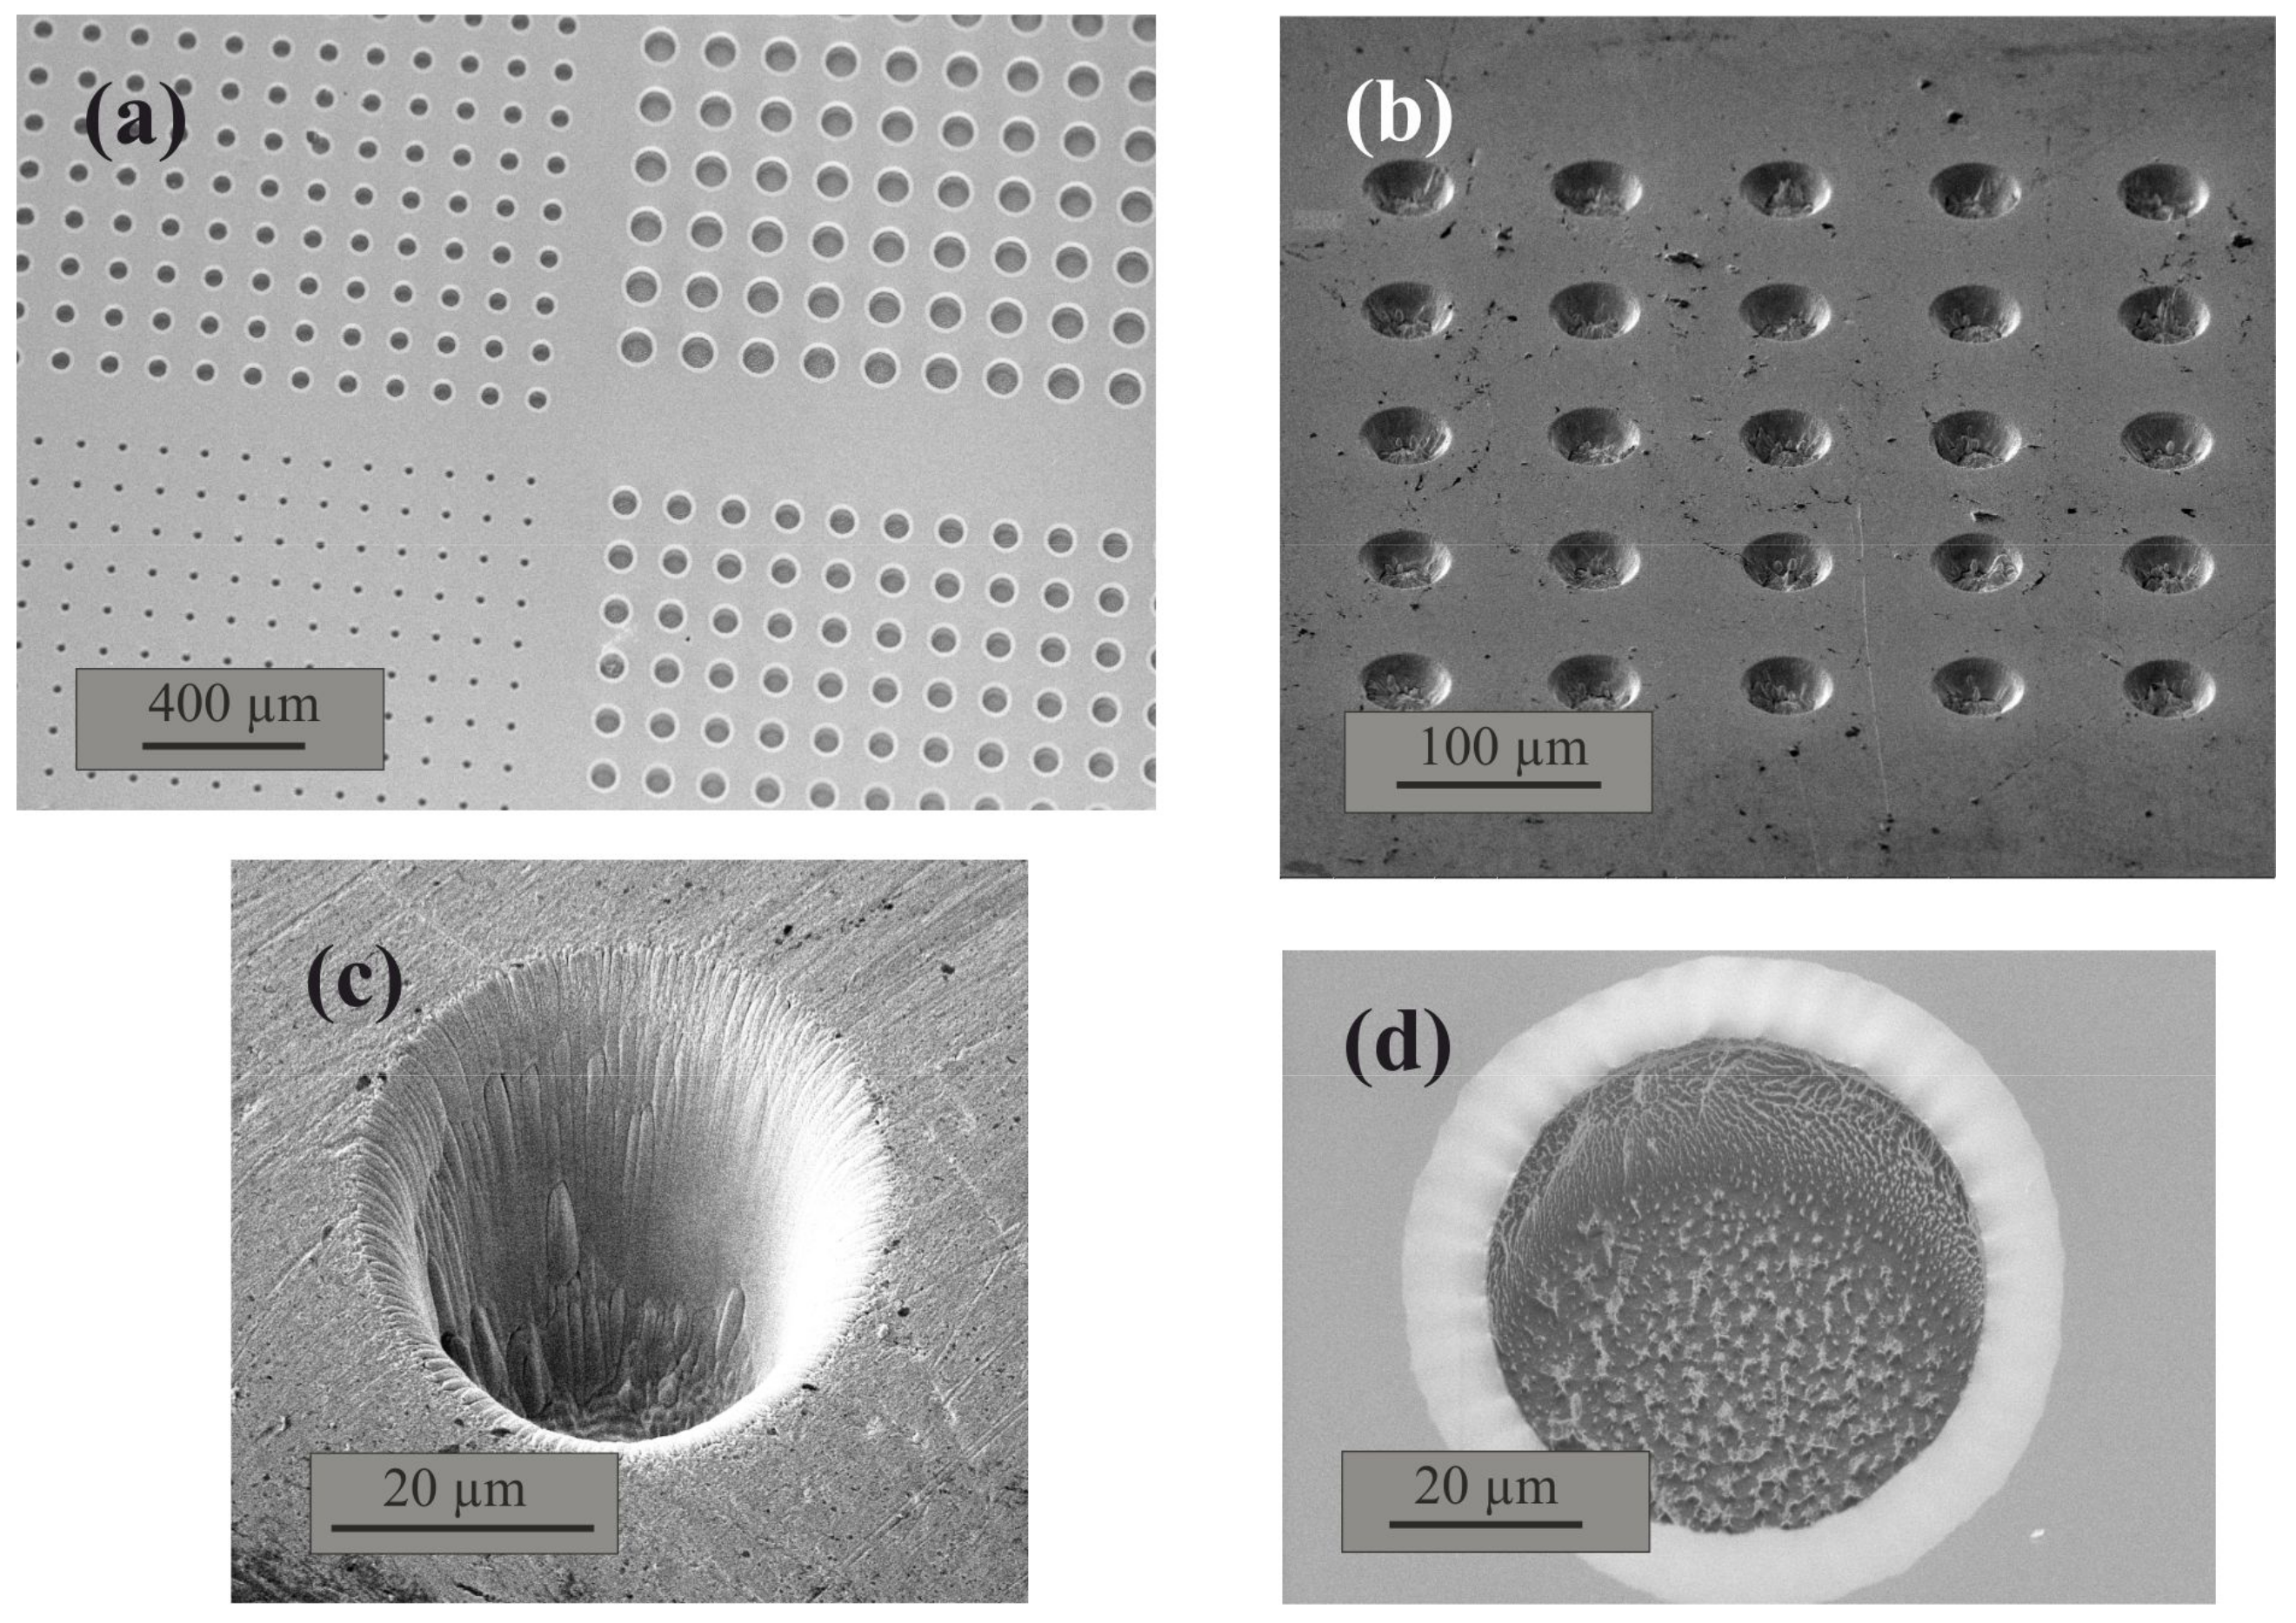
The novel freezing chip was designed from a (15 × 15 × 1) mm silicon plate by etching a pattern of cavities which allows for the creation of isolated droplets with diameters between 20–80 µm (4–30 pL, assuming a spherical shaped water volume). Reactive ion etching (RIE) was carried out with an Oxford Plasmalab 80 (Oxford Instruments plc, UK) with 10 cm
3/min argon and 20 cm
3/min SF
6 used as etching gas. The pattern consists of cavities with defined diameters at defined distances from each other, shown in
Figure 1.
Experiments with ultrapure water revealed a shift of the freezing temperature from −37.5 °C to approximately −20 °C, once the cavity pattern was etched onto the silicon chip. Neither silicon itself nor the roughness of the silicon surface are expected to show for this droplet volume. Peckhaus et al. [
17] found no effect of a smooth silicon substrate on the freezing temperature between −36 °C and −3 °C of spherical droplets with diameters of 107 ± 14 µm. Campbell et al. [
32] showed that neither form of surface roughening of silicon has any effect on the freezing temperature of ultrapure water. Silicon, as well as glass and mica substrates roughened with diamond powders, resulted in freezing temperatures close to the expected homogeneous freezing temperature. Therefore, the observed shift to −20 °C after the etching process seems to be caused by the reaction of the etching agents with the silicon surface, leading to an ice nucleation active compound. For this reason, a gold layer (with a thickness of 500 nm) was sputtered on top of the pattern after the etching process, creating an ice nucleation neutral surface. As an alternative to a gold sputtered silicon plate, a pure gold chip of similar dimensions was ion-milled with a focused ion beam (FIB) to introduce the same kind of pattern. Due to the thermodynamic stability of pure gold, no ice nucleation active compounds were formed on the surface during the introduction of the cavity pattern, and no further treatments of the surface were necessary. If the surface of the gold sputtered silicon plate is damaged and the silicon is exposed, the chip becomes ice nucleation active again. Small scratches on the surface, as well as slight surface irregularities in the cavities, were not found to have any influences on the INA, which is in agreement with Campbell et al. [
32]. Nevertheless, scratches must be avoided to not damage the cavity pattern.
The light microscope is equipped with a 20-fold LWD (long working distance) objective and a 5.0-megapixel USB 3.0 camera (microQ L3CMOS), which is connected to the computer. The custom-built freezing cell is embedded in a hollow polytetrafluorethylene (PTFE, Teflon
®) cylinder with a diameter of 68 mm and a height of 25 mm, which can be sealed hermetically (
Figure 2).
Controlled cooling is performed by a thermoelectric cooler (TEC; i.e., a Peltier element Quick-cool QC-31-1.4-3.7M), connected to a computer-controlled power supply. A water-ice mixture (of approximately 5 °C) is pumped out of a storage tank into a heat exchanger attached to the warm side of the Peltier element with a water pump (EHEIM universal pump). With this set-up, we are able to cool our samples down to −40 °C and below by regulating the electrical current through the TEC. A K-type thermocouple with an associated uncertainty of ±0.4 °C is attached directly on the cold side of the TEC with a thermally conductive adhesive to monitor the temperature. The thermocouple is connected to the computer via a thermocouple measurement device (NI USB- TC01). Two gas connectors on the shell of the freezing cell allow flushing with dry nitrogen. The flushing is done before every experiment to remove humidity and establish a moisture-free atmosphere. Additional slots are available in the shell to insert the thermocouple and the electric connectors for the TEC. The top cover of the cell is removable to introduce the sample and includes a glass window which enables observation of the sample via light microscopy. The cell is placed on a stage directly underneath the objective of the light microscope.
Once the chip is loaded with droplets, it is directly placed on the TEC inside the freezing cell. The field of view, specified by the parameters of the light microscope, enables the observation of about 25 droplets with a center-to-center distance of 100 µm for each experiment. The freezing process can be monitored on the computer screen and is automatically recorded and saved as a video file. Freezing videos are provided under the
Supplementary Information Section (Video S1). They are evaluated automatically by a LabVIEW VI (virtual instrument). During the freezing process, the droplets turn dark because ice shows a different light scattering behavior than liquid water. The first step for evaluating the videos is to manually mark each droplet. Afterwards, the software analyzes the video and determines the time when the droplet turns dark (i.e., freezes). A contrast graph is generated for each droplet, linking the brightness of the droplet to the time, with respect to temperature. This enables the freezing process to be followed (further information is given in the
Supplementary Information Section Figures S1 and S2).
The accuracy of the temperature measurements was determined by measuring the melting points of five different solvents with well-known melting points. The calibration using melting points (under thermodynamic control) rather than freezing points (under kinetic control) is essential due to the underlying nucleation of crystallization [
24]. The melting temperature range was determined visually. A maximum temperature error of ±0.4 °C was found. The results of the measurements are presented in
Table 2. No temperature gradients within the cold stage were observed when using multiple temperature measuring points simultaneously.
3. Materials and Preparation
Four different aerosol types were used to investigate the efficiency of the setup: microcline, birch pollen washing water, juniper pollen, and a Snomax solution. The freezing experiments were carried out in ultrapure water type 1 generated by the MilliQ water purification system, Merck Simplicity® 2012. For each set of experiment, the water was directly taken from the generator and stored in a clear laboratory glass bottle for a maximum time of about 6 h. The temperature control was set to a cooling rate of 2 K/min for all measurements.
Microcline is a naturally occurring mineral and was supplied by Alfa Aesar GmbH & Co. KG. (Karlsruhe, Germany) The composition was determined via X-ray diffraction phase analysis (77% K-feldspar (microcline), 23% Na/Ca-feldspar (albite)). The mineral was freshly milled with a swing mill (Retsch MM400) for 4 min and at 30 swings per second immediately before the experiments. A mean surface area value of 6.6 m2/g was determined using the physical adsorption of gas molecules on solid particles (BET Brunauer–Emmett–Teller technique). Microcline was suspended in ultrapure water (in a concentration of 20 g/L).
The birch pollen sample originated from the Czech Republic and was obtained from Pharmallerga
®. The preparation was carried out as described by Augustin et al. [
34]. One gram of birch pollen was suspended in 20 mL ultrapure water and placed for 12 h in a refrigerator. Afterwards, the suspension was filtered (Macherey-Nagel 640 m), and the pollen washing water was diluted 1:2 with ultrapure water.
Juniper pollen was obtained from Pharmallerga® (Juniperus communis JUNU.0111). Sixty-four milligrams of juniper pollen were suspended in ultrapure water at a concentration of 50 g/L. After 20 h at room temperature, the suspension was directly used for the freezing experiment.
Snomax was obtained from SMI Snow Makers AG. It consists of shredded Pseudomonas syringae, an ice nucleation active bacterium. It was stored at −20 °C for 3 years before the measurements were performed. About 1 mg of Snomax was suspended in ultrapure water to a concentration of 0.5 g/L.
The freezing behavior of all these INPs is well-described in literature, rendering those substances of suitable standard to test the new setup. Their freezing temperatures cover a broad range between −7 °C (Snomax, stored for ≥14 months in a freezer [
19]) and the predicted homogeneous freezing temperature of water at −37 °C [
11]. It shall be mentioned that the usage of standard INPs to show the functionality of measurement techniques and instruments, provides difficulties. Wide spreads of data as shown by Hiranuma et al. [
35] can occur. However, comparing the spread of data in Wex et al. [
36] to Hiranuma et al. [
35], suggests that Snomax of known ageing, is a better choice of standard than, for example, illite NX particles.
Preparation of the Freezing Chip
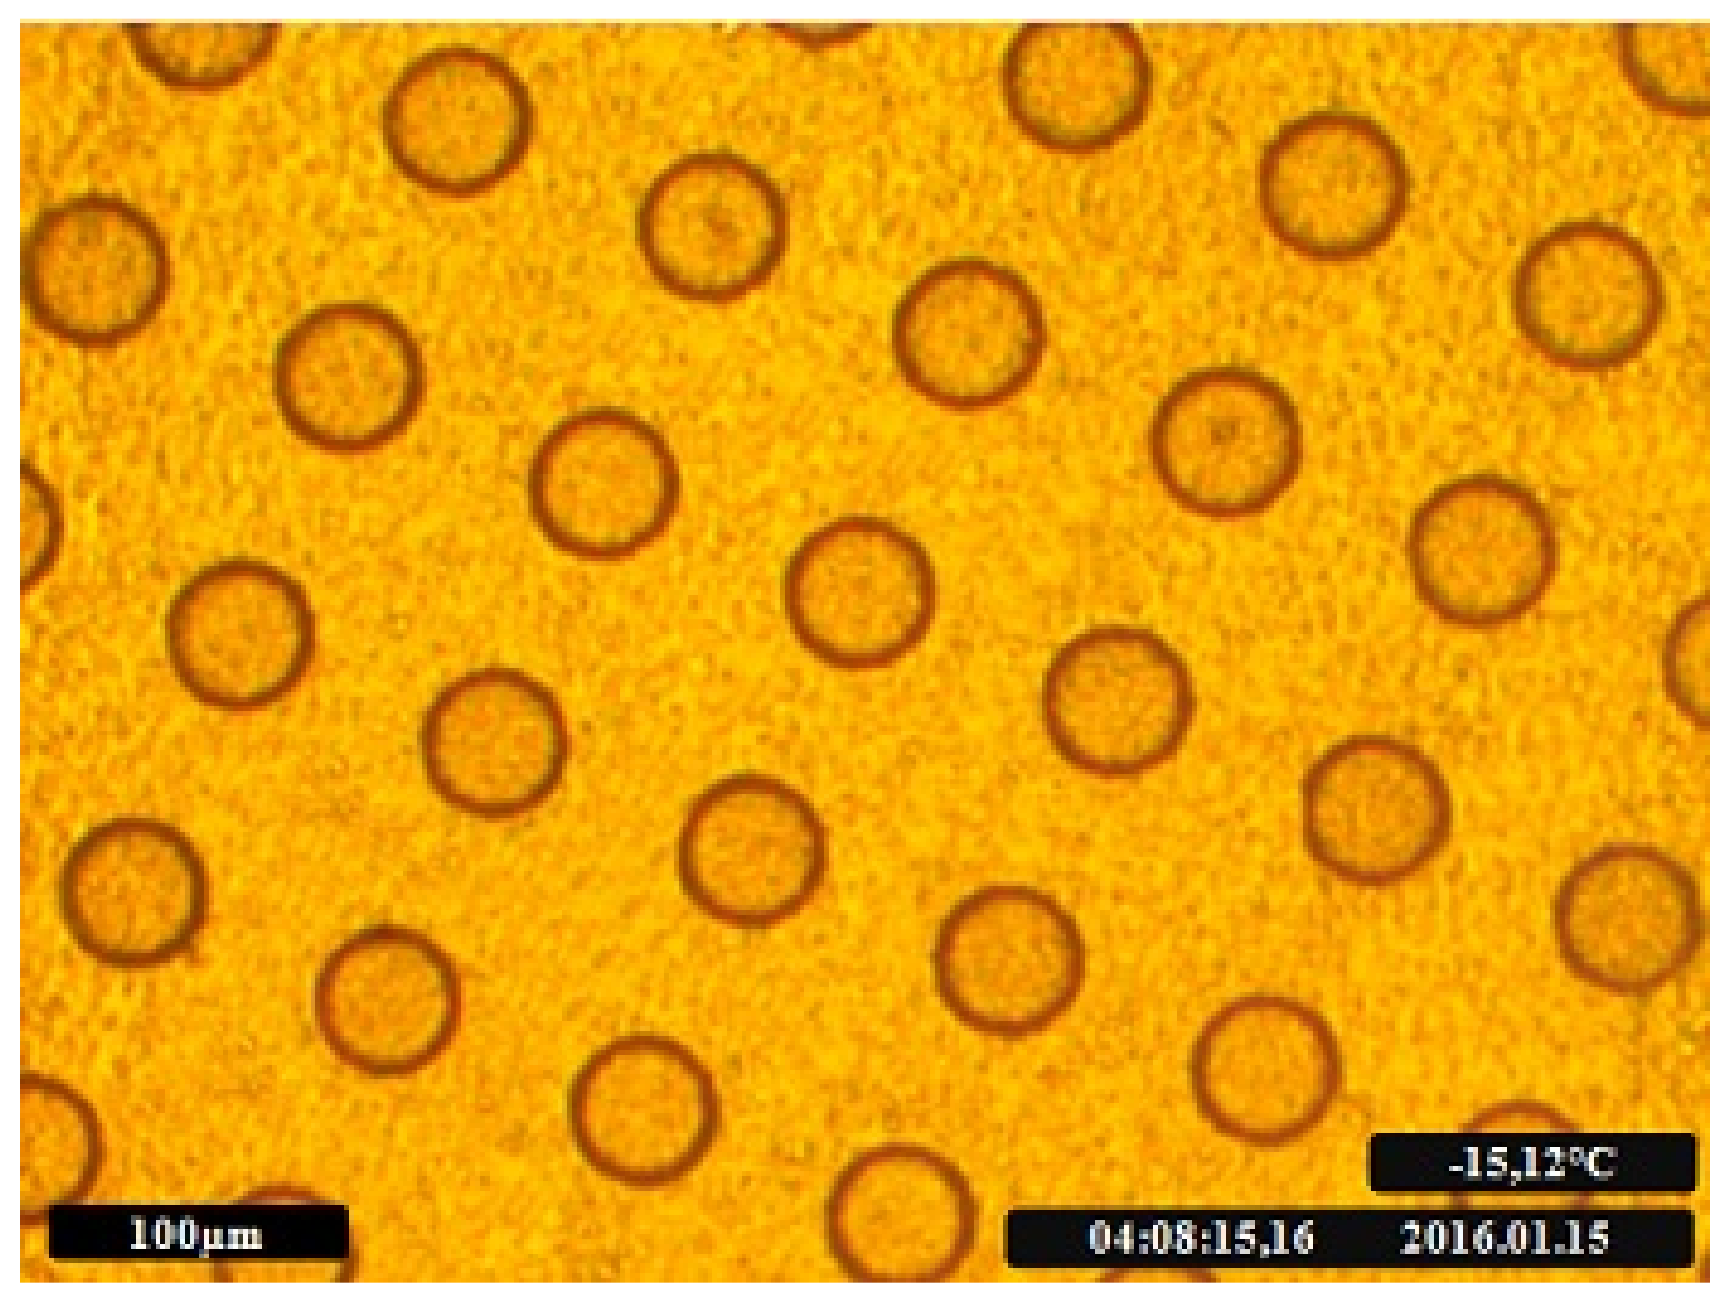
For the sample preparation, we applied a thin film of the suspension on the freezing chip. By placing 2 µL of the sample (i.e., the INPs suspended in ultrapure water) with a pipette on the chip and reabsorbing the suspension into the pipette, a thin film of suspension is applied on the freezing chip. By precooling the chip to approximately 5 °C right before applying the suspension, the liquid between the cavities evaporates while the cavities stay filled. This leads to droplets in the size of the etched cavities, with defined radii and defined distances between the droplets given by the etched pattern. Different droplet sizes can be achieved with different cavity sizes.
Once the cavities are filled, the surface is coated with paraffin oil to prevent the Wegener–Bergeron–Findeisen effect, which occurs when water is present in both liquid and solid phases. This effect would lead to continuous condensation of water vapor on ice while, at the same time, liquid water evaporates until the liquid phase is entirely consumed [
37,
38]. A small droplet of paraffin oil is placed at the center of the plate and spread by putting a microscope plate on top. Using this method, a thin and evenly distributed oil film on top of our chip is obtained. Leading to evenly separated and isolated droplets (
Figure 3).
The chip was cleaned after each measurement by being immersed in acetone/isopropanol (50/50), toluene, and ultrapure water for 20 min each. In certain cases (e.g., Snomax), preheating treatment (150 °C for 1 h) is required to obtain a complete removal of INPs.
4. Results and Discussion
Homogeneous ice nucleation depends on the droplet volume [
29]. By increasing the volume, the chance of forming a critical ice cluster via fluctuation of intermolecular hydrogen bonds is higher. Heterogeneous ice nucleation is dependent on the amount of active surface area at the interface between the INP and water [
39] and has no volume dependence [
40]. The characteristic parameter to describe the ice nucleation activity of INPs is the so-called ice nucleation active surface site density. Equation (1) is based on the assumption that
ns can be assumed to be deterministic [
41] and neglects the time dependence.
N0 is the total number of droplets in the experiment,
NF is the number of frozen droplets at temperature
T, and
s is the particle surface area per droplet. The fraction of frozen droplets, or
fice(
T), is given by
The fraction of frozen droplets fice is multiplied by 100 to illustrate the values in percentage. The ice nucleating activity can be also expressed by referring to the number of active sites per mass of ice nucleating material (nm) instead of the surface area per droplet. This expression is often used when the surface of the investigated INP cannot be accurately quantified.
By increasing the size of droplets from cloud droplet size (diameters of about 10 µm) to about 40 µm, the surface area per droplet for a constant mass fraction of INP in water is increased. Accordingly to Equation (1), this allows the quantification of
ns to smaller values and determination of nucleation efficiencies over a wider range of temperatures than is possible using cloud-sized droplets [
22].
To investigate the comparability of ice nucleation results obtained with the new setup using other experimental techniques, the freezing behavior of the different kinds of INPs was analyzed and compared with the existing literature. For each experiment, 10 measurements were performed. Values of T50, ns, and nm were used to describe the freezing behavior. T50 values describe the temperature at which fice reaches a value of 50, i.e., 50% of the observed droplets are frozen (Equation (1)).
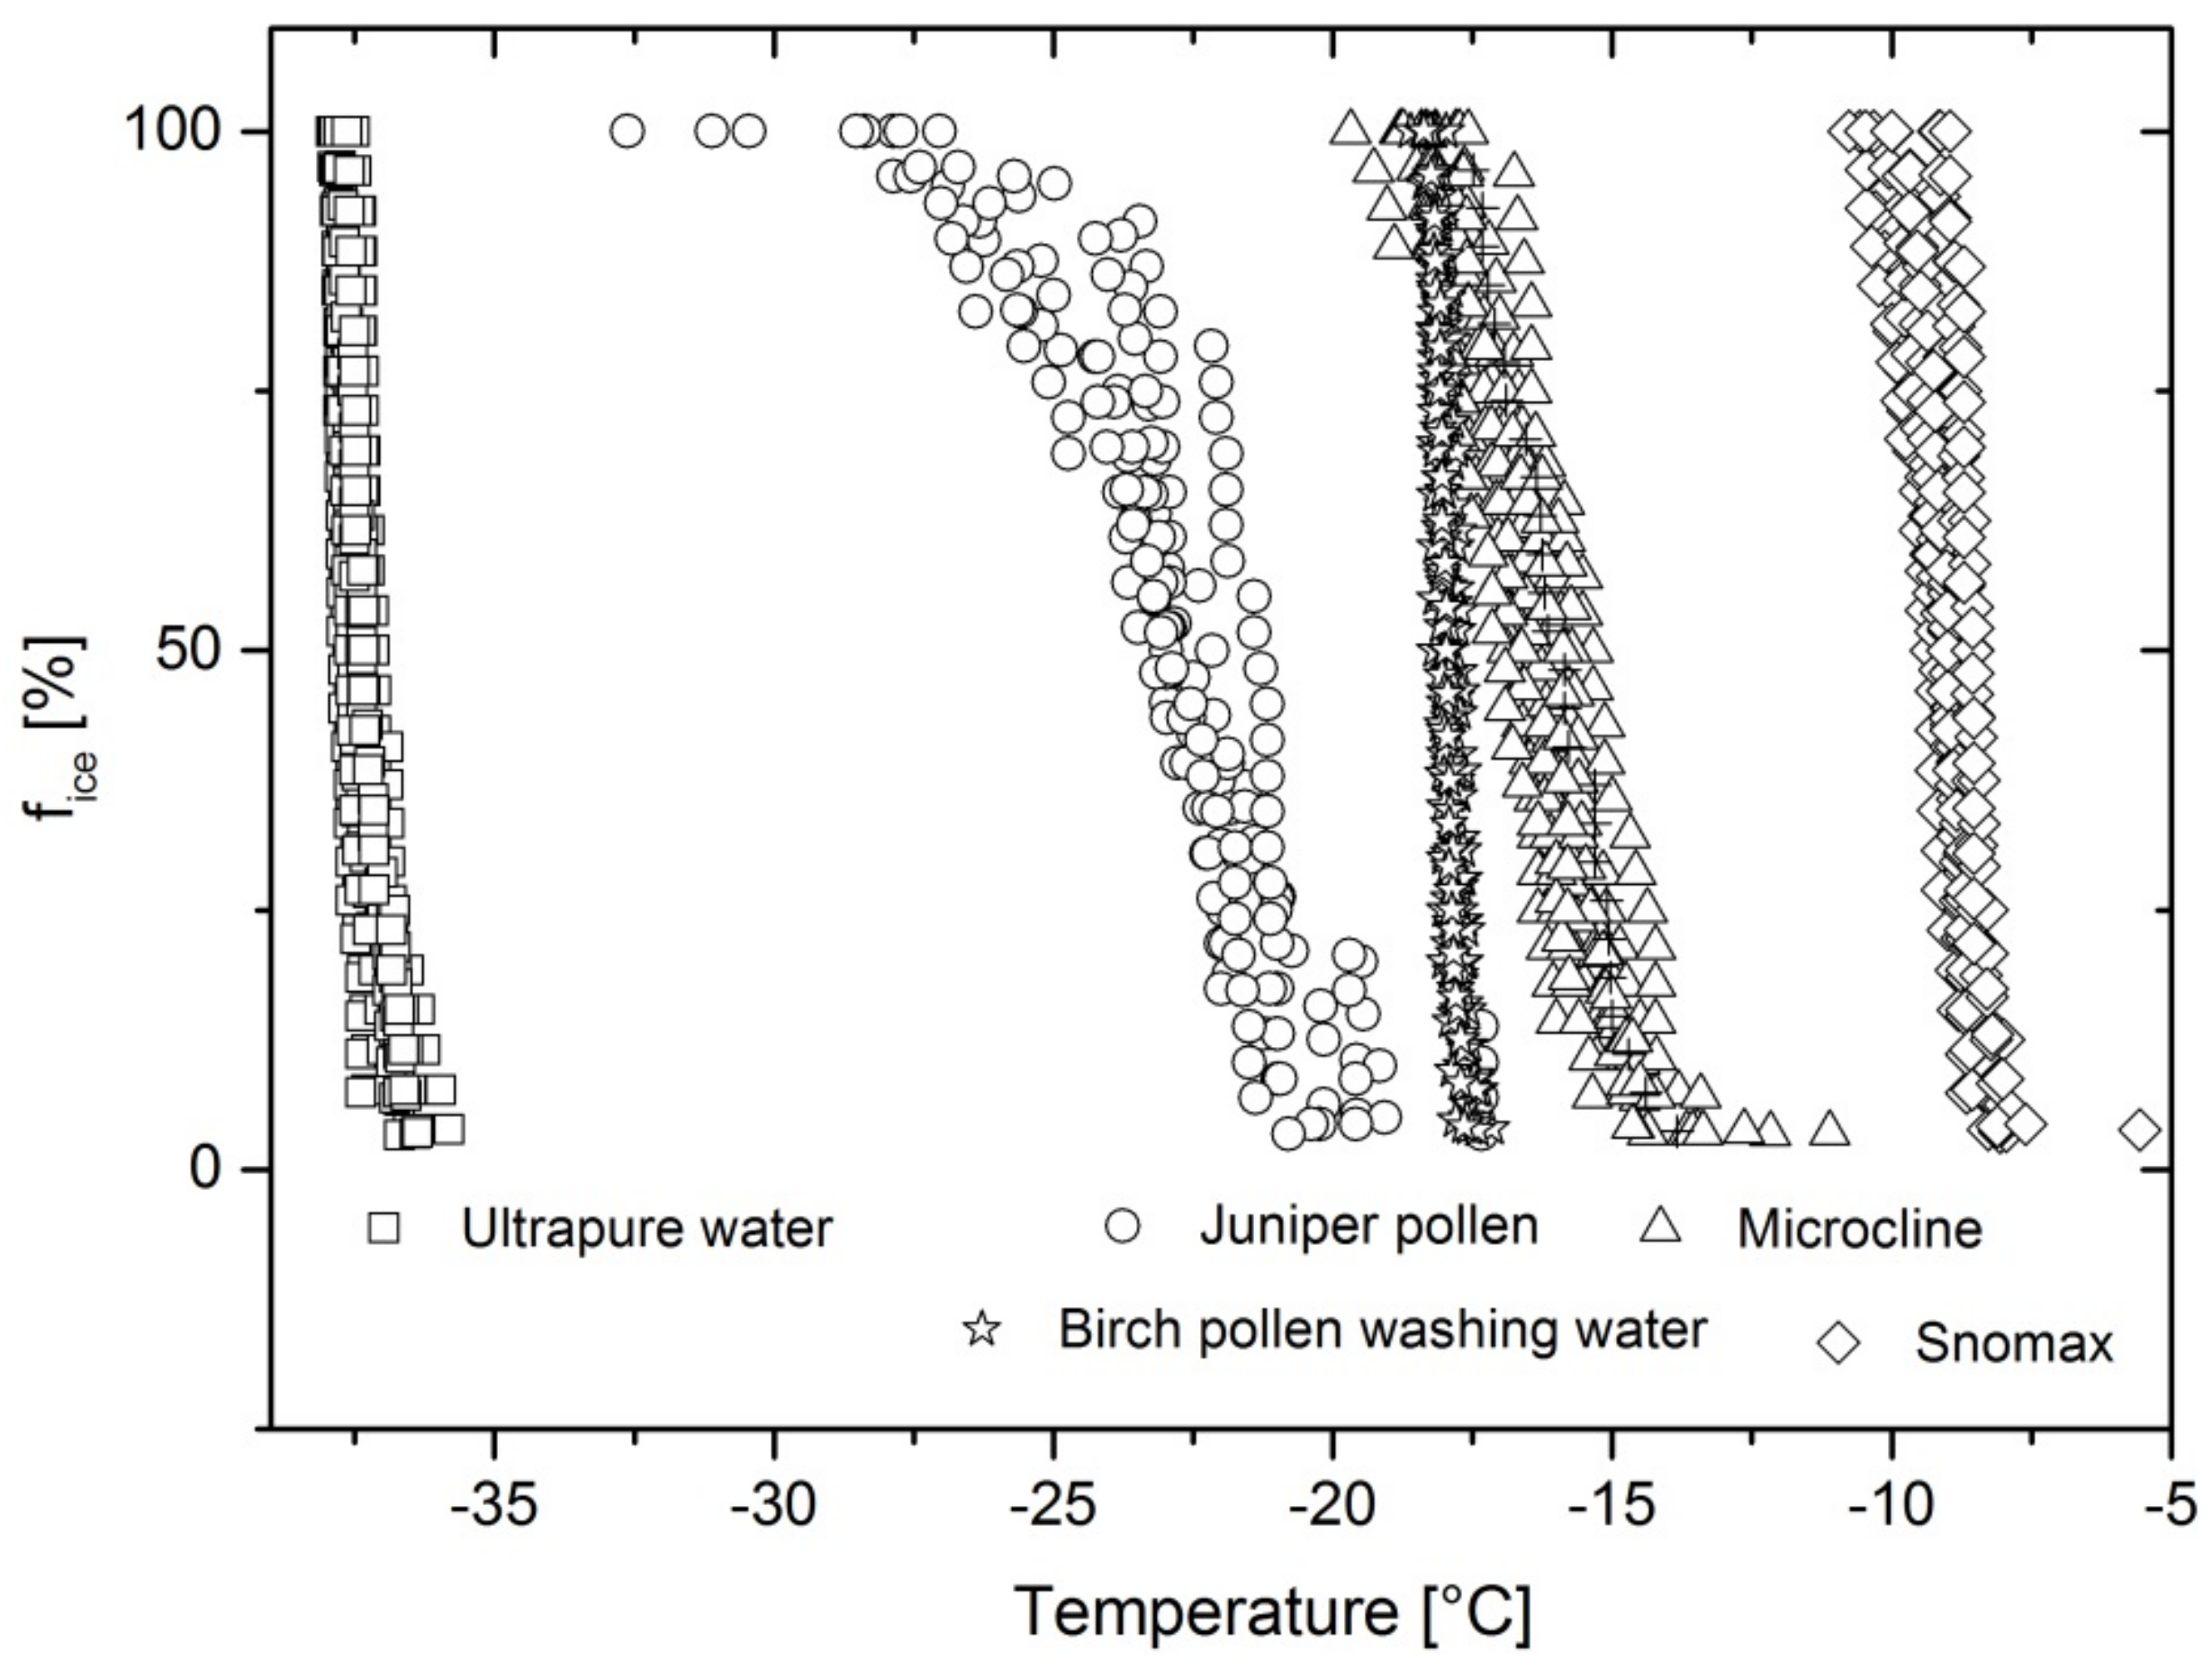
4.1. Freezing Spectra and T50 Values
The chosen aerosol types and ultrapure water were selected to cover a broad freezing temperature range between −7 °C (Snomax, stored for ≥14 months in a freezer [
19]) and the predicted homogeneous freezing temperature of water at −37 °C [
11].
Figure 4 shows the freezing spectra of each investigated INP and ultrapure water. They reveal a
T50 value for microcline of −16.4 °C, birch pollen washing water of −18 °C, juniper pollen of −22.7 °C, Snomax of −8.9 °C, and ultrapure water at −37.5 °C. Ultrapure water, birch pollen washing water, and Snomax freeze within a narrow temperature range of 1 to 2 °C between the first and the last freezing event, while juniper pollen and microcline show a wider freezing range of 8–11 °C.
The homogeneous freezing temperature of water is given by Pruppacher and Klett [
11] for droplets with a diameter of 40 µm as −37 °C. Measurements performed with the freezing chip resulted in an average
T50 value of −37.5 °C. Considering a temperature error of ±0.4 °C, the determined homogeneous freezing temperature is in good agreement.
The reproducibility of freezing experiments indicates that the INPs are evenly distributed in the droplets and concentrations do not vary.
4.2. Ice Nucleation Active Surface/Mass Site Densities
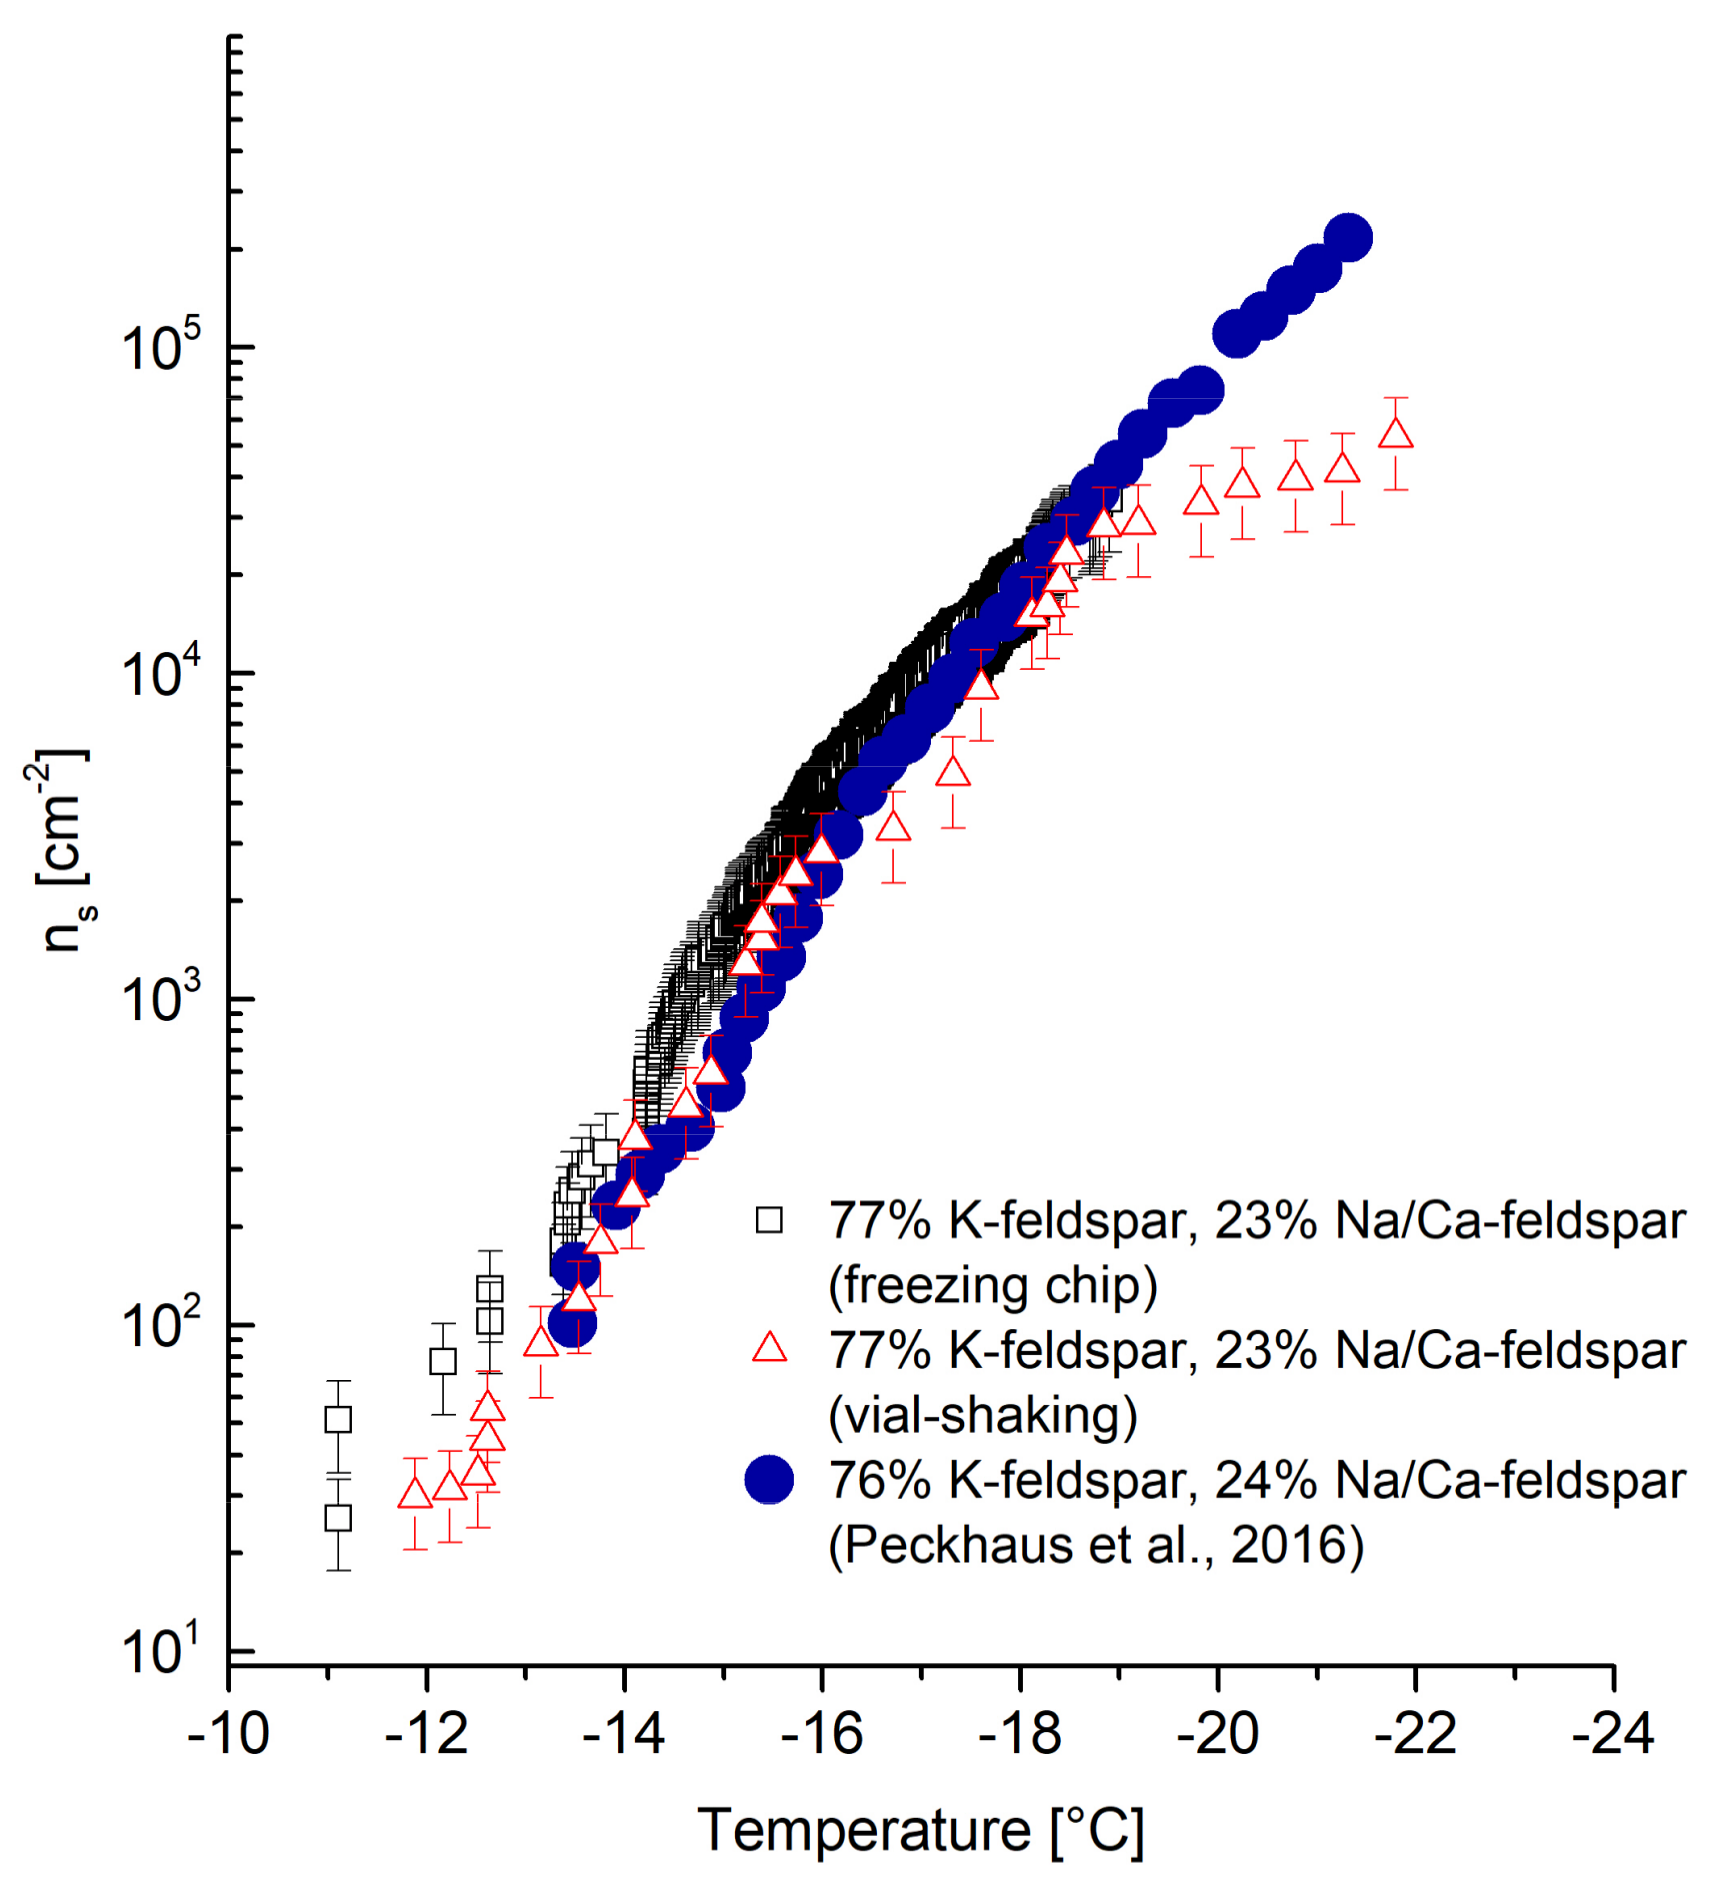
4.2.1. Microcline
The
ns trend of microcline shown in
Figure 5 is in good agreement with data obtained by Peckhaus, et al. [
17]. Partial shifts to higher ns values between −14 °C and −15.5 °C can be seen for freezing-chip-obtained values. Freezing events at temperatures below −12 °C do not agree with Peckhaus et al. [
17]. The deviations are considered to be within an acceptable error range based on the different measurement techniques used by Peckhaus et al. [
17] (Piezo-driven droplet-on-demand generator) and slight differences in the microcline composition. Furthermore, measurements using the vial-shaking technique were performed with the same batch of microcline as for the freezing chip measurements. Deviations at temperatures below −19 °C may occur due to the shaking process reducing the concentration of INP and INA. The data obtained via vial-shaking technique is considered to lie within an acceptable range and demonstrates the reproducibility of data using the freezing chip.
4.2.2. Birch Pollen Washing Water
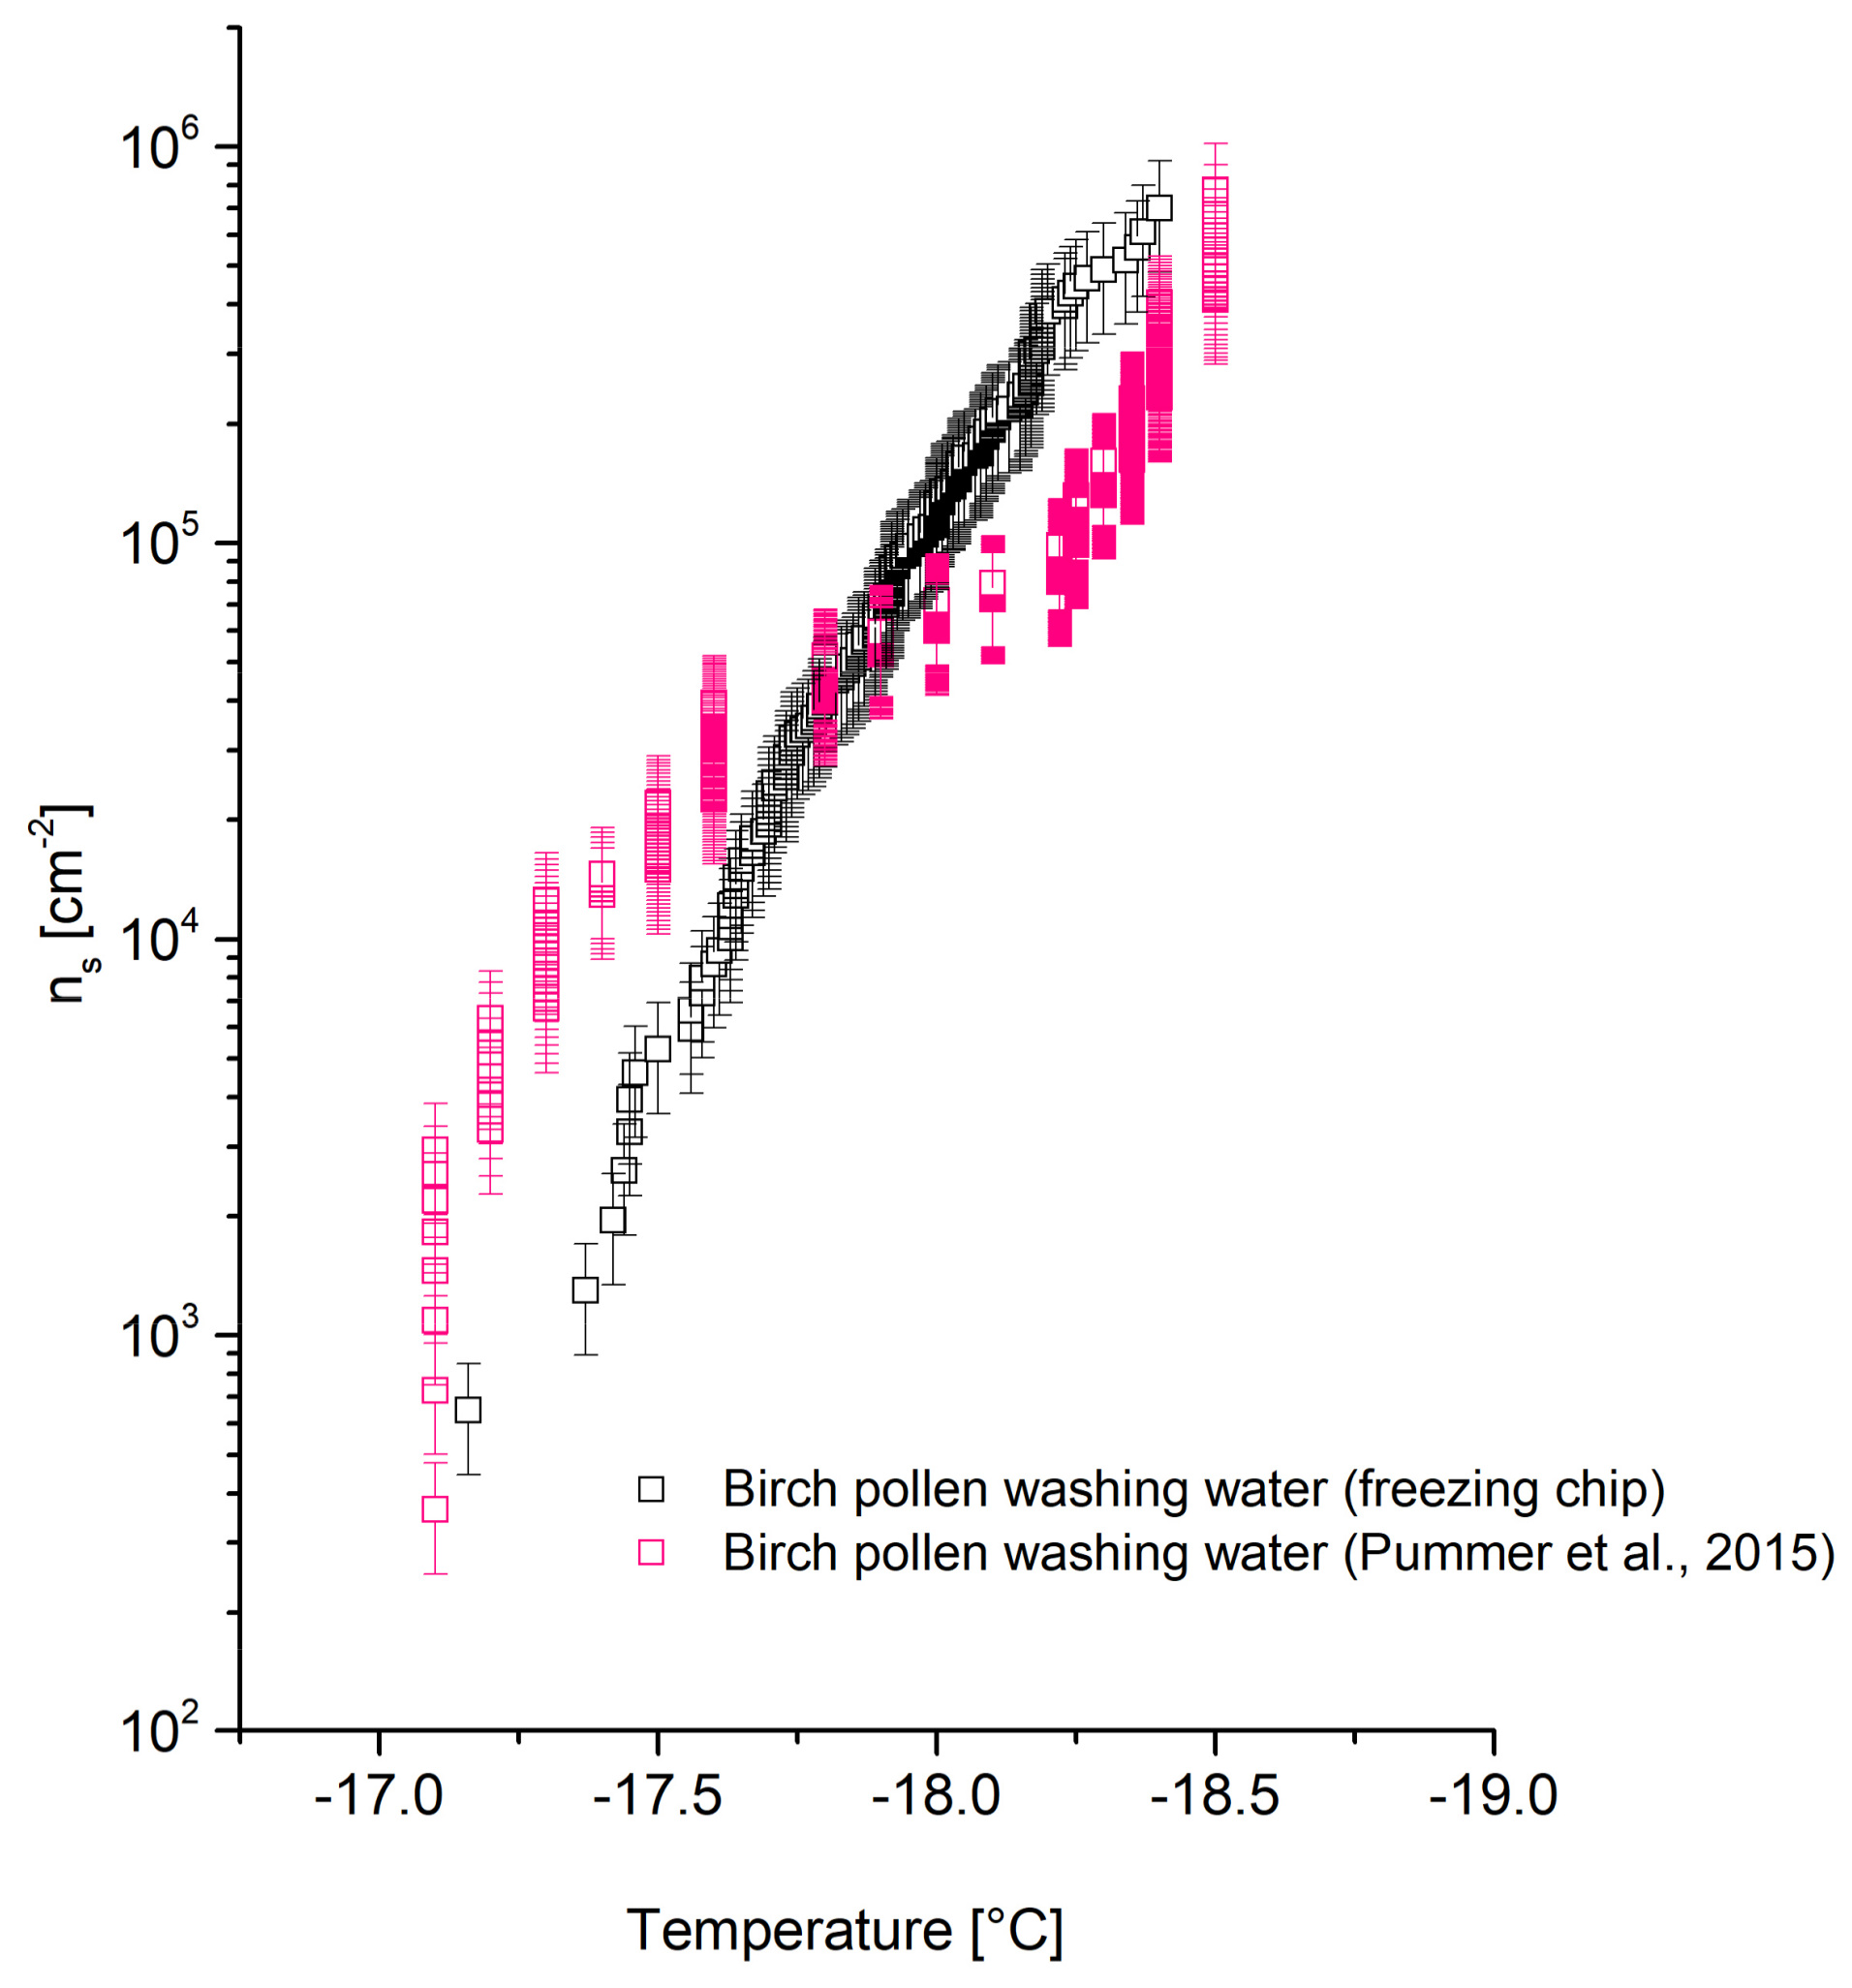
The
ns trend of birch pollen washing water obtained with the freezing chip compared to data by Pummer et al. [
27] is shown in
Figure 6. While the
ns trend found by Pummer et al. [
27] has a step between −17 and −18 °C and the gradient then decreases, a steeper trend has been found in the values obtained with the new method. Pummer et al. [
27] explained the characteristic decrease of the gradient between −17.5 and −18.5 °C by the fact that the INP is scarce or inefficient. Nevertheless, the differences in
ns trends might be accounted by the presence of two types of INPs present in birch pollen washing water. The more efficient one is concentration-dependent since it is reported to be an agglomeration product of smaller polysaccharides [
42]. The vial-shaking process to generate droplets in an oil matrix might reduce the concentration of INPs in the water slightly, leading to less agglomeration. This leads to a decrease of INA and decreased
ns values above −18 °C. Using the freezing chip, no INPs are expected to migrate into the oil cover, keeping the concentration and the INA unchanged. It appears that the
ns values from Pummer et al. [
27] are higher than those from the freezing chip at temperatures above −17.5 °C. This contradicts the assumption of decreased
ns values using a vial-shaking technique, but might originate from the temperature error of ±0.4°C.
Minor deviations below −18 °C might originate from differences in measurement technique and/or the composition of the pollen batch.
4.2.3. Juniper Pollen
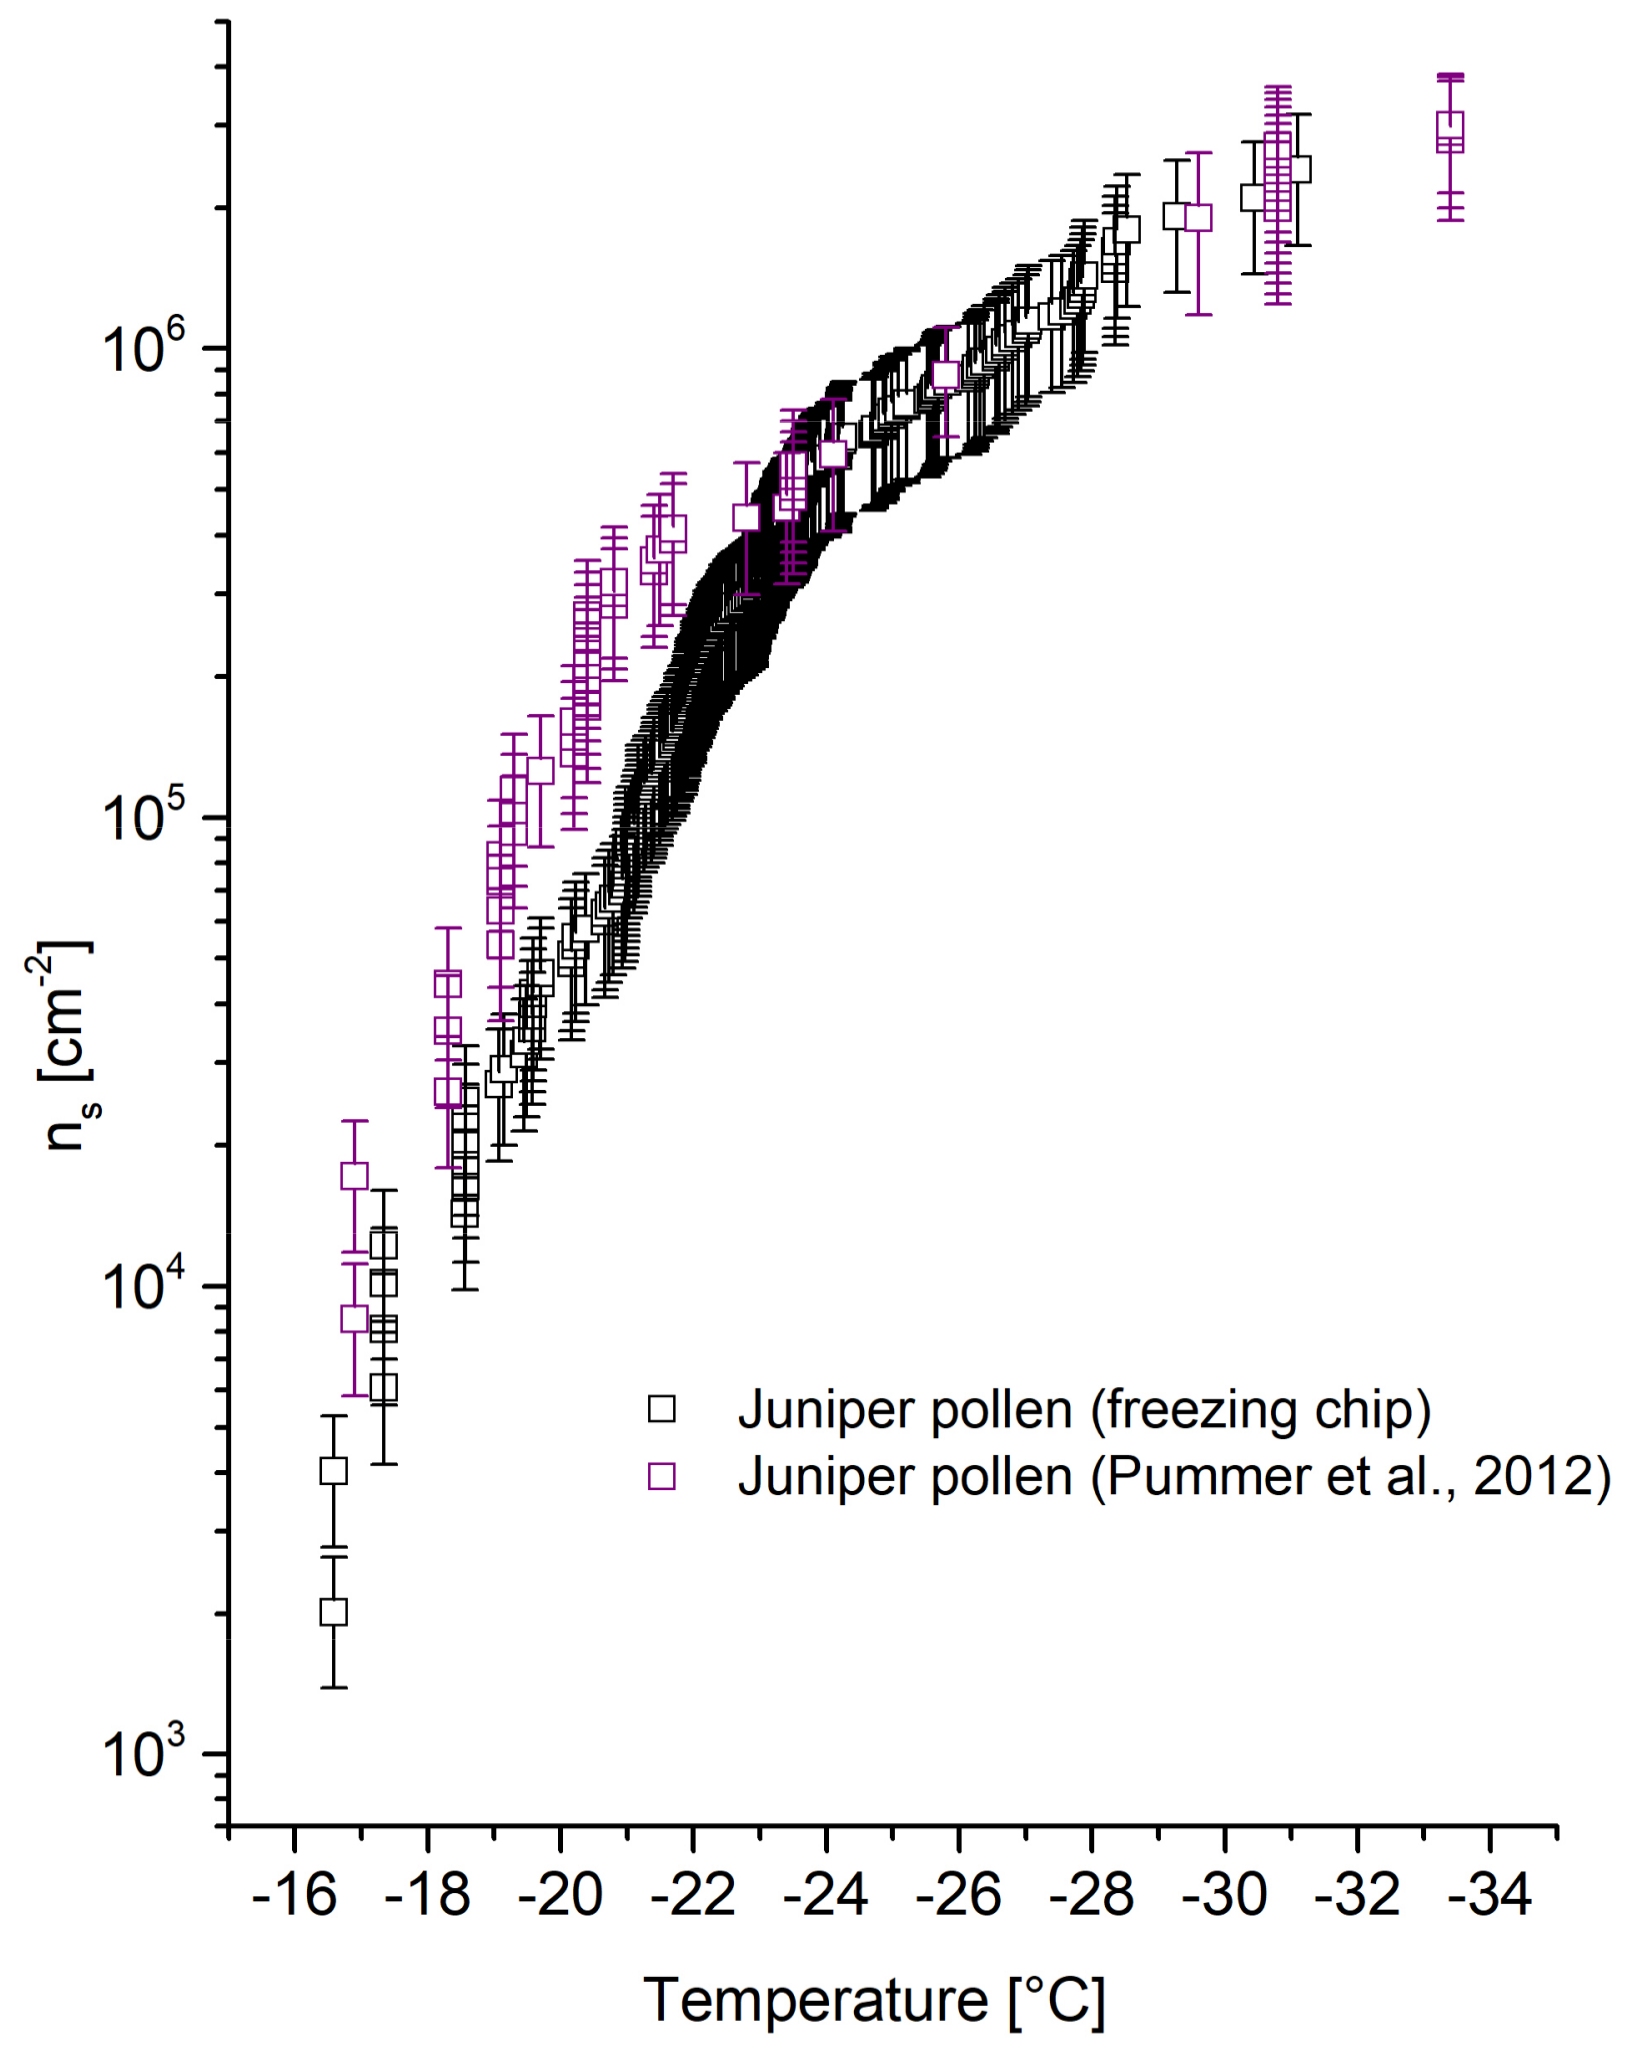
The
ns trend of juniper pollen shown in
Figure 7 is in good agreement with Pummer et al. [
26]. Partial shifts of freezing-chip-obtained
ns values are shown between −19 and −22 °C. The decreased values might be induced due to a different experimental set-up of Pummer et al. [
26] (vial-shaking technique) but are considered to lie within an acceptable range.
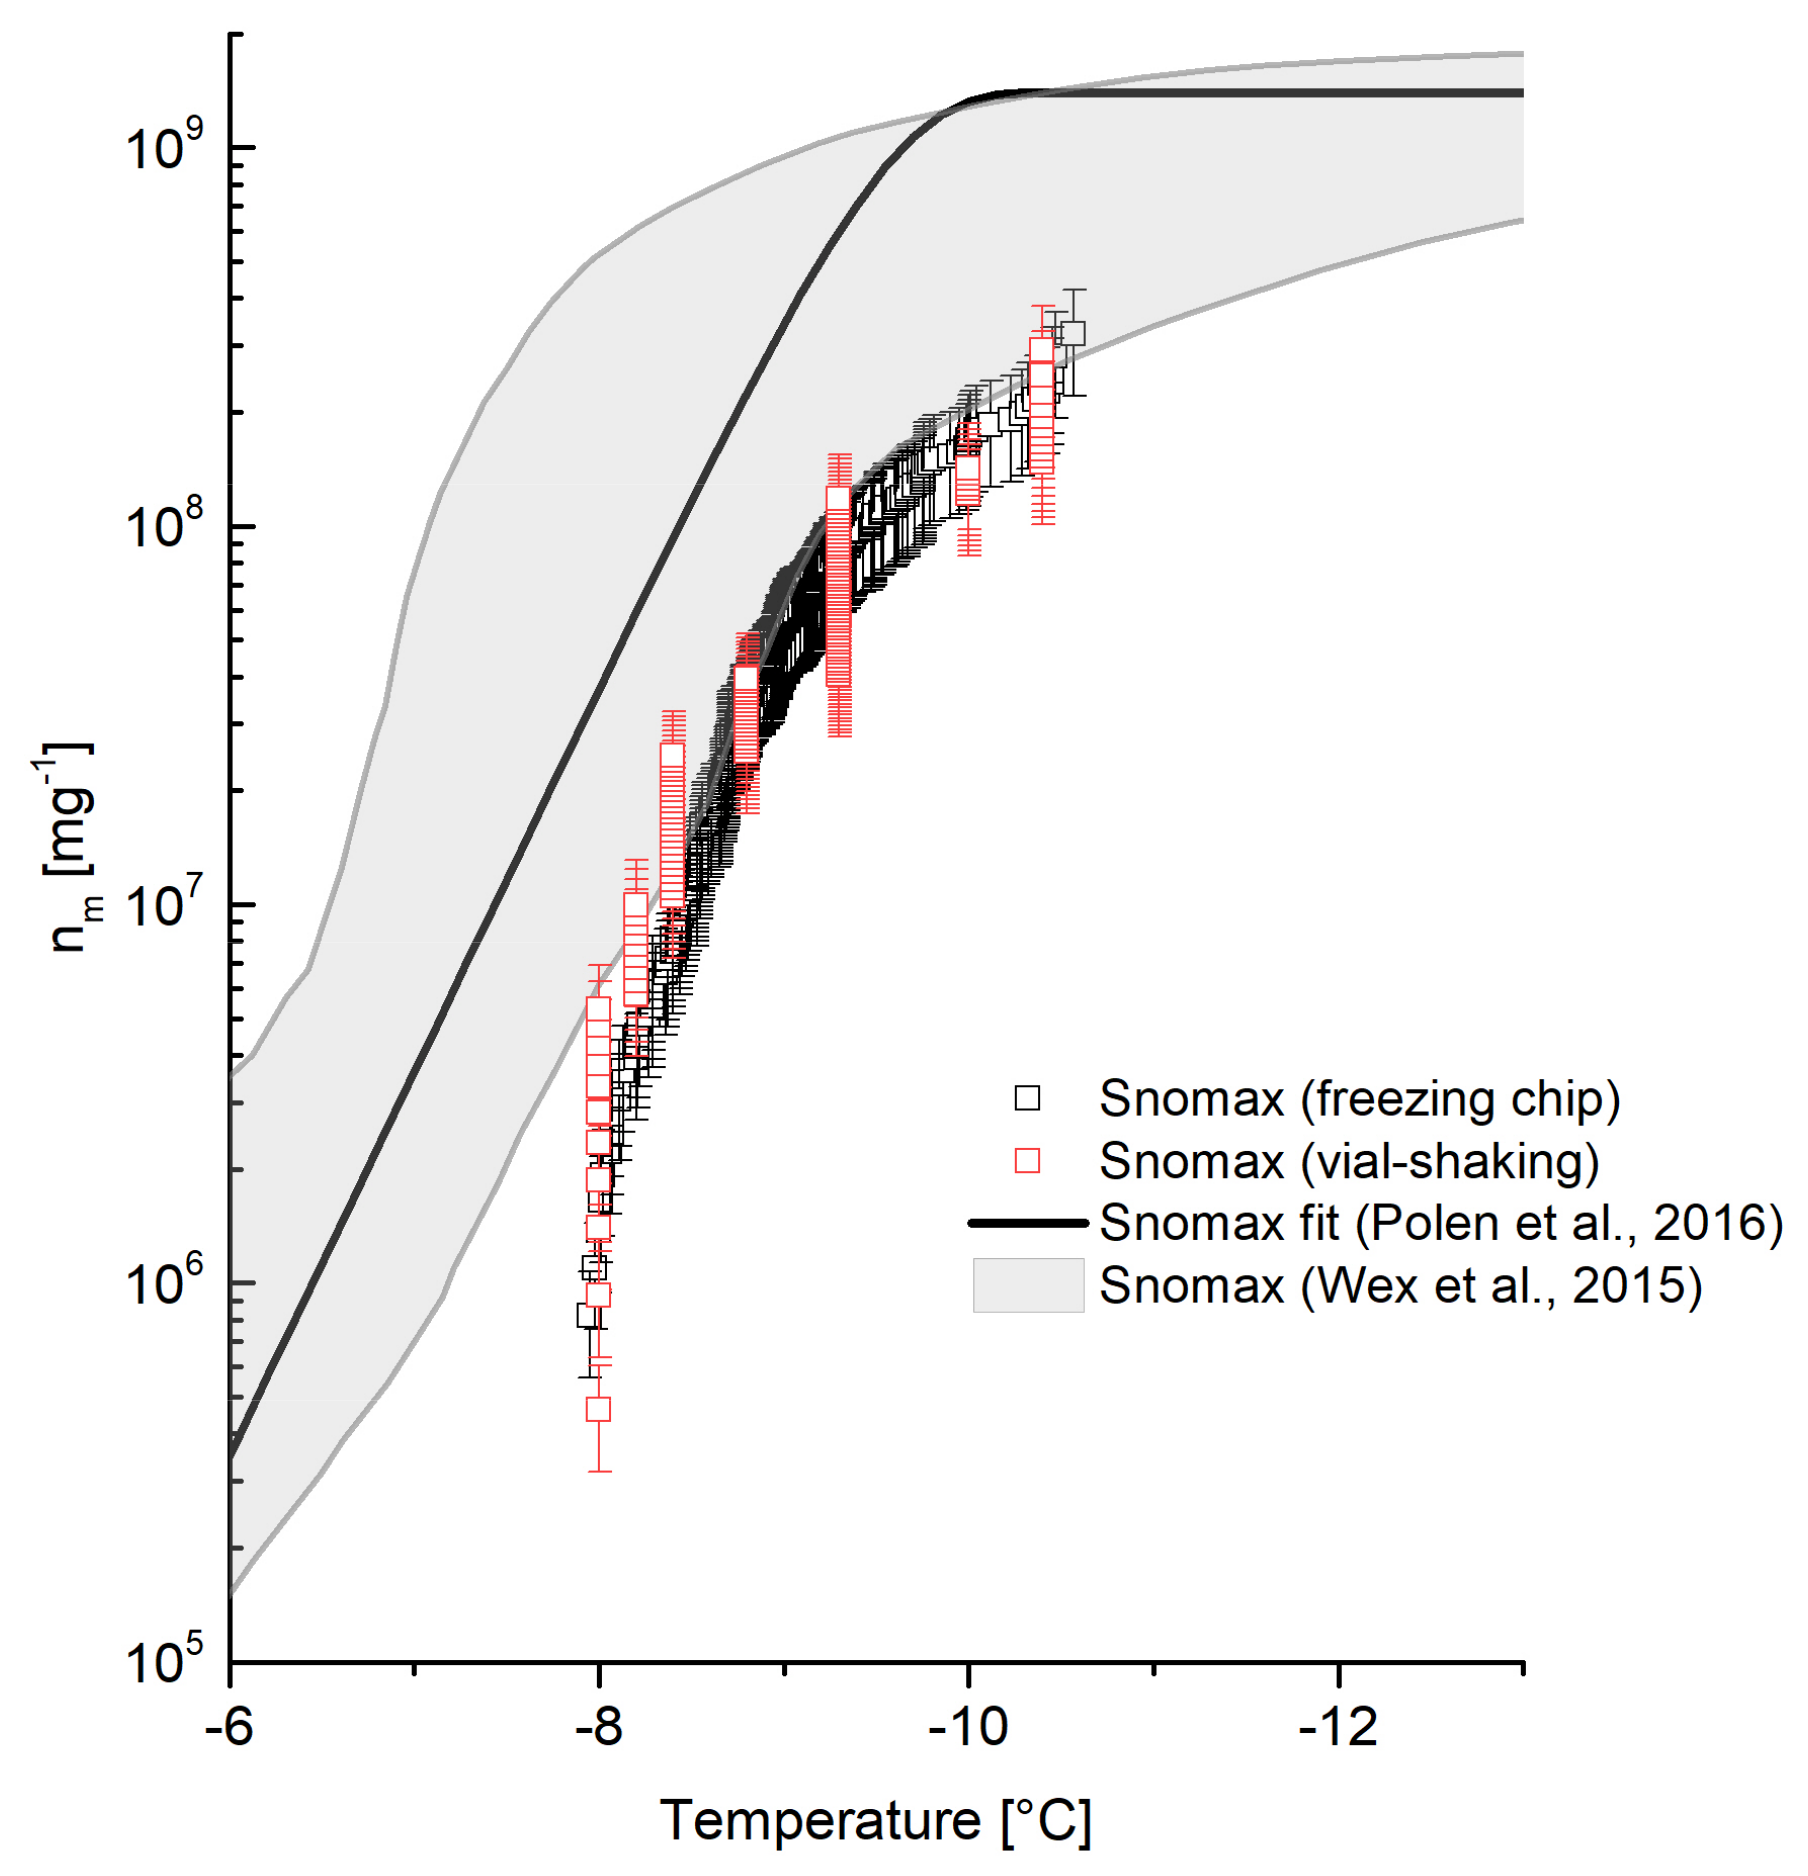
4.2.4. Snomax
Figure 8 shows the obtained
nm values for Snomax using the freezing chip method, exhibiting a shift to decreased
nm values at temperatures above −8.5 °C compared to data published by Wex et al. [
36] and Polen, et al. [
19]. The shift to lower
nm values can be explained by the decomposition of Snomax with a prolonged period of storage [
19]. The more efficient ice nucleating protein of Snomax decomposes even when stored at temperatures below 0 °C, which results in a decrease of INA and decreased freezing temperatures of about −7 °C. At this temperature, a less active but more stable ice nucleus triggers ice formation. Ongoing storage duration and thus decomposition leads to a further decrease of
nm values at higher temperatures. Therefore, the decreased
nm values above −8.5 °C of Snomax which has been stored for three years are considered to be in agreement with published work of Polen et al. [
19] and Wex et al. [
36] who investigated Snomax samples stored up to 14 months. The usage of old Snomax samples as an evaluation standard appears more convenient than fresh samples, since it shows stable
nm values, especially at higher temperatures after a certain degree of decomposition [
19]. Furthermore, measurements using the vial-shaking technique were performed with the equally aged Snomax batch as for the freezing chip measurements. The data obtained via vial-shaking technique is in good agreement with the freezing chip. This agreement demonstrates the reproducibility of data using the freezing chip.
5. Summary
A new technique to generate droplets with diameters in micrometer range was developed to investigate the INA of aerosol particles down to a temperature of −38 °C. By introducing a pattern of cavities on a gold or silicon chip by reactive ion etching and ion milling, the generation of up to 25 droplets with the same well-defined diameters was accomplished. Depending on the size of the cavities, droplets with diameters between 20 and 80 µm can be generated. Due to defined distances between the cavities, generated droplets do not come into direct contact with each other. Since no vial-shaking of an oil-water emulsion is necessary, the risk of migration of aerosol particles into the oil phase is reduced. Oil is only used as a cover to seal the cavities. Therefore, visual disturbances are decreased and the visual evaluation via light microscope is facilitated.
The recording of the freezing process on video files enables reruns and repeatable evaluations. The automatic evaluation via LabVIEW saves time and eliminates the problem of different results arising from varying personal interpretations of manually evaluated microscope pictures. The accuracy of the temperature measurements was determined by measuring the melting points of five different solvents with well-known melting points. A maximum temperature error of ±0.4 °C was determined.
To investigate the comparability of the new setup, the freezing behavior of four different aerosol types (microcline, birch pollen washing water, juniper pollen, and Snomax) and ultrapure water was analyzed and compared with the existing literature. The
T50 value of ultrapure water droplets with 40 µm diameter of −37.5 °C matches the values published by Pruppacher and Klett [
11]. The
ns values of microcline and juniper pollen are consistent with data published by Peckhaus, et al. [
17] and Pummer et al. [
27]. Minor deviations are suggested to originate from differences in measurement technique and/or composition of the microcline.
The
ns trend of birch pollen washing water revealed a steeper trend of values between −17 and −18 °C compared with Pummer et al. [
27]. There are two types of INPs present in birch pollen washing water and the more efficient one is concentration dependent since it is an agglomeration product [
42]. The vial-shaking process to generate droplets in an oil matrix reduces the concentration of INPs in the water slightly, leading to less agglomeration and to a resulting decrease of INA and
ns values above −18 °C. Using the freezing chip, no INPs are expected to migrate into the oil cover. This keeps the concentration and, thus, the INA unchanged. However, minor deviations below −18 °C are suggested to originate from differences in measurement technique and/or composition of the pollen batch.
The
nm trend of Snomax shows a shift to lower values at temperatures below −8.5 °C compared to data published by Wex et al. [
36] and Polen et al. [
19]. Previously studies showed the decomposition of the ice nucleating proteins of Snomax, leading to a decrease of
nm values at higher temperatures [
19]. Thus, it can explain the shift observed in our study. Therefore, the obtained
nm trend of Snomax is considered to be in agreement with published work of Polen et al. [
19] and Wex et al. [
36].
It can be summed up that the new technique reduces occurring issues in the vial-shaking droplet-freezing technique and is capable in reproducing published results. The freezing chip retains the unique advantages of vial-shaking techniques but is additionally capable of eliminating and reducing certain disadvantages related to concentration and droplet size distribution.


