Compositional and Mineralogical Effects on Ice Nucleation Activity of Volcanic Ash
by
 and
and
Kimberly Genareau
1,*, 
Shelby M. Cloer
1,
Katherine Primm
2,
Margaret A. Tolbert
2 and
Taylor W. Woods
1 1
Department of Geological Sciences, The University of Alabama, Box 870338, Tuscaloosa, AL 35487, USA
2
Cooperative Institute for Research in Environmental Sciences, University of Colorado, Box 216, Boulder, CO 80309, USA
*
Author to whom correspondence should be addressed.
Atmosphere 2018, 9(7), 238; https://doi.org/10.3390/atmos9070238
Submission received: 14 April 2018
/
Revised: 17 June 2018
/
Accepted: 18 June 2018
/
Published: 22 June 2018
(This article belongs to the Special Issue Ice Nucleation in the Atmosphere)
Abstract
:Volcanic ash produced during explosive eruptions may serve as ice nuclei in the atmosphere, contributing to the occurrence of volcanic lightning due to tribocharging from ice–ice or ice–ash collisions. Here, different ash samples were tested using deposition-mode and immersion-mode ice nucleation experiments. Results show that bulk composition and mineral abundance have no measurable effect on depositional freezing at the temperatures tested, as all samples have similar ice saturation ratios. In the immersion mode, there is a strong positive correlation between K2O content and ice nucleation site density at −25 °C and a strong negative correlation between MnO and TiO2 content at temperatures from −35 to −30 °C. The most efficient sample in the immersion mode has the highest surface area, smallest average grain size, highest K2O content, and lowest MnO content. These results indicate that although ash abundance—which creates more available surface area for nucleation—has a significant effect on immersion-mode freezing, composition may also contribute. Consequently, highly explosive eruptions of compositionally evolved magmas create the necessary parameters to promote ice nucleation on grain surfaces, which permits tribocharging due to ice–ice or ice–ash collisions, and contribute to the frequent occurrence of volcanic lightning within the eruptive column and plume during these events.
1. Introduction
Volcanic lightning is a common phenomenon during explosive eruptions, and may occur in the near-vent region (Figure 1) or at higher altitudes in the laterally spreading ash plume. These discharge events can vary based on length of the discharge channel, time scale of the flash, and distance from the vent [1,2]. In volcanic columns and plumes, charge generation may result from either fractoemission (i.e., the breaking of particles during magma fragmentation) or tribocharging (i.e., the collision of particles and transfer of charge) [3,4]. The separation of ash particles with opposite charge causes development of an electric field, leading to lightning discharge. “Plume” lightning produces the longest discharge channels and is considered the most similar to thunderstorm lightning, where volcanic ash may act as ice nuclei, leading to tribocharging from ice–ice or ice–ash collisions [2,5,6,7]. Ice collisions can only be an effective charging mechanism once the ash has reached an altitude at which ice nucleation can occur, between the −10 °C and −20 °C isotherms [8,9]. The altitude of isotherms above erupting volcanoes will vary based on the latitude and the meteorological conditions of the day. Remote sensing studies of volcanic lightning have determined the altitude of the −20 °C isotherm during eruptions of Eyjafjallajökull, Iceland (4–5 km) [10]; Sakurajima, Japan (7–8 km) [11]; Calbuco, Chile (9–10 km) [12]; and Shiveluch, Russia (4 km) [13]. These isotherm altitudes fall within the range of many explosive eruption columns, which can vary in height from hundreds of meters to >20 km, depending on eruption intensity. Consequently, ice nucleation may also factor into tribocharging in the near-vent region (Figure 1). Greater explosivity will typically produce a higher eruptive column and plume in addition to a higher proportion of very fine ash-sized (<32 µm) pyroclasts. Thus, understanding the role ash plays in ice nucleation is important for understanding both lightning generation in water-enriched regions of volcanic columns and plumes and also in cumulonimbus clouds developing downwind from volcanic vents following eruptions.
Volcanic ash has long been suggested to influence heterogeneous ice nucleation following explosive eruptions [8,14,15,16,17]. There are three main modes of heterogeneous nucleation [18,19,20], which include (1) depositional nucleation, where ice forms on the surface of a solid particle directly from the vapor phase; (2) immersion freezing, where a solid particle is immersed in a supercooled water droplet and ice nucleation occurs on the particle; and (3) contact freezing, where ice forms from the contact between a supercooled water droplet and a solid particle. Prior to explosive events, and dependent upon bulk composition, H2O may comprise up to 8% of the pre-eruptive magma by mass [8]. At the point of magma fragmentation, ash grains and larger pyroclasts are dispersed in an expanding gas phase where H2O is the dominant volatile, and this dusty gas mixture entrains and heats the ambient air, allowing the convecting eruptive column to ascend to higher altitudes. As it does, the concentration and grain size distribution of ash will progressively change, with coarser particles falling out closer to the vent, and finer particles remaining aloft at greater altitudes and at greater distances within the laterally spreading plume. It should be noted that ash particles will result in overseeding of ice in volcanic plumes [8]. Thus, both formation of graupel and contact freezing will be limited due to a relative lack of supercooled water droplets (compared to typical thunderstorms) and charge will more often be transferred between colliding ash particles, in collisions between ice crystals that have nucleated on ash grains, or between ash and ice. Considering the abundance of free H2O in both the eruptive column and ambient atmosphere, immersion-mode ice nucleation will likely dominate but deposition-mode and contact freezing are still possible. For the purposes of this study, we focus on deposition-mode and immersion-mode freezing that occur at, or above, the −20 °C isotherm (Figure 1).
Mineral dusts (particularly clay minerals) have been shown to be effective ice nucleating particles (INPs) [21,22,23,24,25,26], but determining precisely how composition and mineralogy affect ice nucleation activity (INA) is still up for debate. One study [27] investigated nine abundant minerals (quartz, albite, microcline, calcite, gypsum, montmorillonite, hematite, illite, and kaolinite) commonly found in mineral dust [28] and concluded that kaolinite, illite, and hematite were the most efficient INPs in the depositional mode. In contrast, another study [29] found that K-feldspars, in comparison to Na/Ca feldspars, quartz, calcite, and clay minerals, are the dominant INPs in the immersion mode despite contributing only 3% to the dust mass sampled. More recent studies [30,31,32,33] confirm previous results [29] in which K-feldspars are the most efficient INPs in comparison to other minerals tested, including Na/Ca-feldspars, clay minerals, quartz, calcite, metal sulfates, and metal oxides. Several studies [8,16,17,34,35,36,37,38] have conducted nucleation experiments on volcanic ash, using samples from a limited number of volcanoes; thus, there is ample opportunity to add to the current dataset concerning volcanic ash INA. Because the motivation of this study is to examine the roles of bulk composition and mineral content, these samples are not composed of ash originally formed during explosive eruptions, but ash manufactured from other types of volcanic deposits. “Natural” volcanic ash will have a range of grain sizes and shapes, and will often be coated with soluble salts due to interaction with gases in the volcanic plume. We have manufactured ash through milling and sieving of eruptive deposits to equalize (as best as possible) grain size distributions and grain shapes and focus only on the roles of composition and mineralogy in ice nucleation.
2. Experiments
For the study presented here, volcanic ash samples with different compositions and mineral/glass content were tested in both the deposition and immersion modes using methods outlined below, which follow a previous study [37]. Available facilities did not permit examination of contact freezing, so this method of heterogeneous nucleation is not included here. All samples were collected from their original depositional location and had undergone very little post-depositional alteration, as X-ray diffraction analyses did not show the presence of clay minerals. Sample OB2 originates from the Banco Bonito lava flow that erupted ~50 ka [39,40] from the Valles Caldera in northern New Mexico, USA, and is an obsidian containing spherulites (radial crystals formed within vesicles). Taupo is a large (~30 cm) pumice clast originating from the 1.8 ka Plinian eruption of the Taupo caldera [41,42,43,44] on the North Island of New Zealand. A single pumice clast was utilized from this eruption due to the chemical homogeneity of the magma [45,46] and low crystal content [44]. The three remaining samples (ONW, PINW, and NIW) originate from fall deposits produced during the ~77 ka Lathrop Wells eruption in the Southwestern Nevada Volcanic Field, USA. [47,48,49,50,51]. ONW represents oxidized scoria, PINW represents scoria containing accidental lithics, and NIW represents scoria with all lithics removed (Table S1). Both pumice and scoria are pyroclasts containing vesicles (formerly gas bubbles exsolving from the melt), produced during explosive eruptions. Pumice typically forms from magma with intermediate to high silica content (60–70 wt %) and contains a higher number density of smaller vesicles compared to scoria, which typically forms from magma with lower silica content (<60 wt %) and has a lower number density of relatively larger vesicles. During the explosions that form these pyroclasts, pieces of pre-existing country rock may be incorporated into the erupted material (i.e., accidental lithics).
The volcanic samples were crushed with a hammer and put through a McCrone micronizing agate mill. The ash was then sieved through a 32 µm stainless steel mesh to ensure that the samples could be classified as very fine ash. Mineral/glass abundance was quantified with the JOEL JSM 6010 Plus/LA scanning electron microscope (SEM) using backscattered images of polished grain mounts (Figure S1 and S2) and ImageJ freeware. Mineralogy was determined with the Bruker AXS D8 X-ray diffractometer (XRD), grain size distributions were determined with a Malvern Mastersizer 3000 laser diffraction particle size analyzer (LDPSA), bulk compositions were determined with the Philips Analytical PW2400 X-ray fluorescence (XRF) analyzer, and ash density was measured with a Quantachrome helium pycnometer. All instruments are housed in the Department of Geological Sciences at the University of Alabama.
Deposition-mode and immersion-mode ice nucleation experiments were performed at the University of Colorado at Boulder using established methods [37]. Both experiments were performed using a Nicolet Almega XR Dispersive Raman spectrometer coupled with a Linkam THMS600 environmental cell. The spectrometer was equipped with an Olympus BX-51 optical microscope with 10×, 20×, 50×, and 100× magnification objectives. The temperature of the cold stage in the environmental cell was controlled by a Linkam TMS94 automated temperature controller with an accuracy of 0.15 K. For the deposition-mode ice nucleation experiments, the water partial pressure in the cell was controlled by flowing a mixture of dry and humidified nitrogen over the cold stage. This partial pressure was measured in terms of dew/frost point using a Buck Research CR-1A hygrometer with an accuracy in dew/frost point temperature of 0.15 K. Ice saturation ratios (Sice) were obtained at −48.15 °C, −43.15 °C, and −38.15 °C with the following equation:
where PH2O is the partial pressure of water when the first ice event is observed (Figure S3) and VPice is the equilibrium saturation vapor pressure of ice and water at that temperature in K (T). For the immersion-mode experiments, based on previous methods [37], the ash samples were made into slurries of 0.5, 1.0, and 2.0 wt % ash in water. The slurries were inverted and well mixed immediately before nebulization to ensure that the concentration of ash within the droplets was representative of the weight concentration of ash in the slurry. These samples were then nebulized, a drop of silicone fluid was placed on the center of the disc to ensure the ash being analyzed was immersed in water for the remainder of the experiment, and the sample was immediately placed in the environmental cell. Frozen fractions (FF) were visually determined from −20 °C to −50 °C by recording a video of the particles during the range of temperatures (Video S1) at a cooling rate of 10 °C per minute, counting the number of particles that froze at 30 second increments (i.e., every 5 °C), and using the following equation:
where nice(T) is the number of frozen droplets at temperature T and n is the number of frozen droplets at the lowest temperature reached in the experiments (−50 °C), which is well below the freezing temperature for homogeneous ice nucleation (−39.55 °C) [52]. Each sample was examined four or five times, except for PINW, which was examined twice. There were several tens of nebulized particles in each of the analyzed videos.
Sice(T) = PH2O/VPice(T)
FF(T) = nice(T)/n
The ice nucleation active surface site density (ns) was calculated from the frozen fraction using the following equation [37]:
where SAp is the surface area per particle. The SAp was determined through the surface area of the bulk ash sample (SA) and average particle grain size, both measured with the LDPSA, and the density of the bulk sample (ρ) as measured with the helium pycnometer using the equation
where V is volume of the ash particle calculated from the average particle diameter.
ns = −[ln(1−FF)/SAp]
SAp = V × ρ × SA
3. Results
3.1. Sample Characteristics
The five samples consist of two derived from eruptions of rhyolitic magmas and three derived from an eruption of basaltic magma, representing a wide range of eruptive styles. Bulk compositional analyses can be found in Table 1. Minerals identified by X-ray diffraction (XRD) within the samples include the following: (1) OB2 contains quartz, albite, actinolite, and magnetite (Figure S4); (2) Taupo contains albite, quartz, magnetite, and orthoclase (Figure S5); (3) NIW contains albite, magnetite, forsterite, ilmenite, enstatite, and anorthite (Figure S6); (4) ONW contains albite, magnetite, ilmenite, forsterite, augite, and enstatite (Figure S7); and (5) PINW contains albite, anorthite, magnetite, enstatite, forsterite, and a sodium hydrate (Figure S8). Because the presence of amorphous glass in volcanic samples may affect an accurate determination of mineral percentages using XRD data, scanning electron microscope (SEM) analyses were used to quantify mineral/glass abundance (Table 2). SEM analyses of polished grain mounts using backscattered electron imaging revealed blocky ash grains with a consistent aspect ratio of ~0.5 for all samples, and provided the relative proportions of the different mineral phases and amorphous glass (Figure S1 and S2). OB2 and Taupo are dominated by glass (>90% of image area), while the three Lathrop Wells samples contain lesser amounts of glass (16–22%) and various other minerals (Fe-oxides, olivine, pyroxene), including plagioclase feldspar and magnetite (Table 2). Laser diffraction particle size analyses revealed that all samples have a similar grain size distribution (Figure 2A), comparable surface areas, and similar average particle diameters, although OB2 has the largest of the former and the smallest of the latter among all five samples. Figure 2B presents the relevant values used to calculate the SAp with Equation (4).
3.2. Deposition-Mode Ice Nucleation Activity
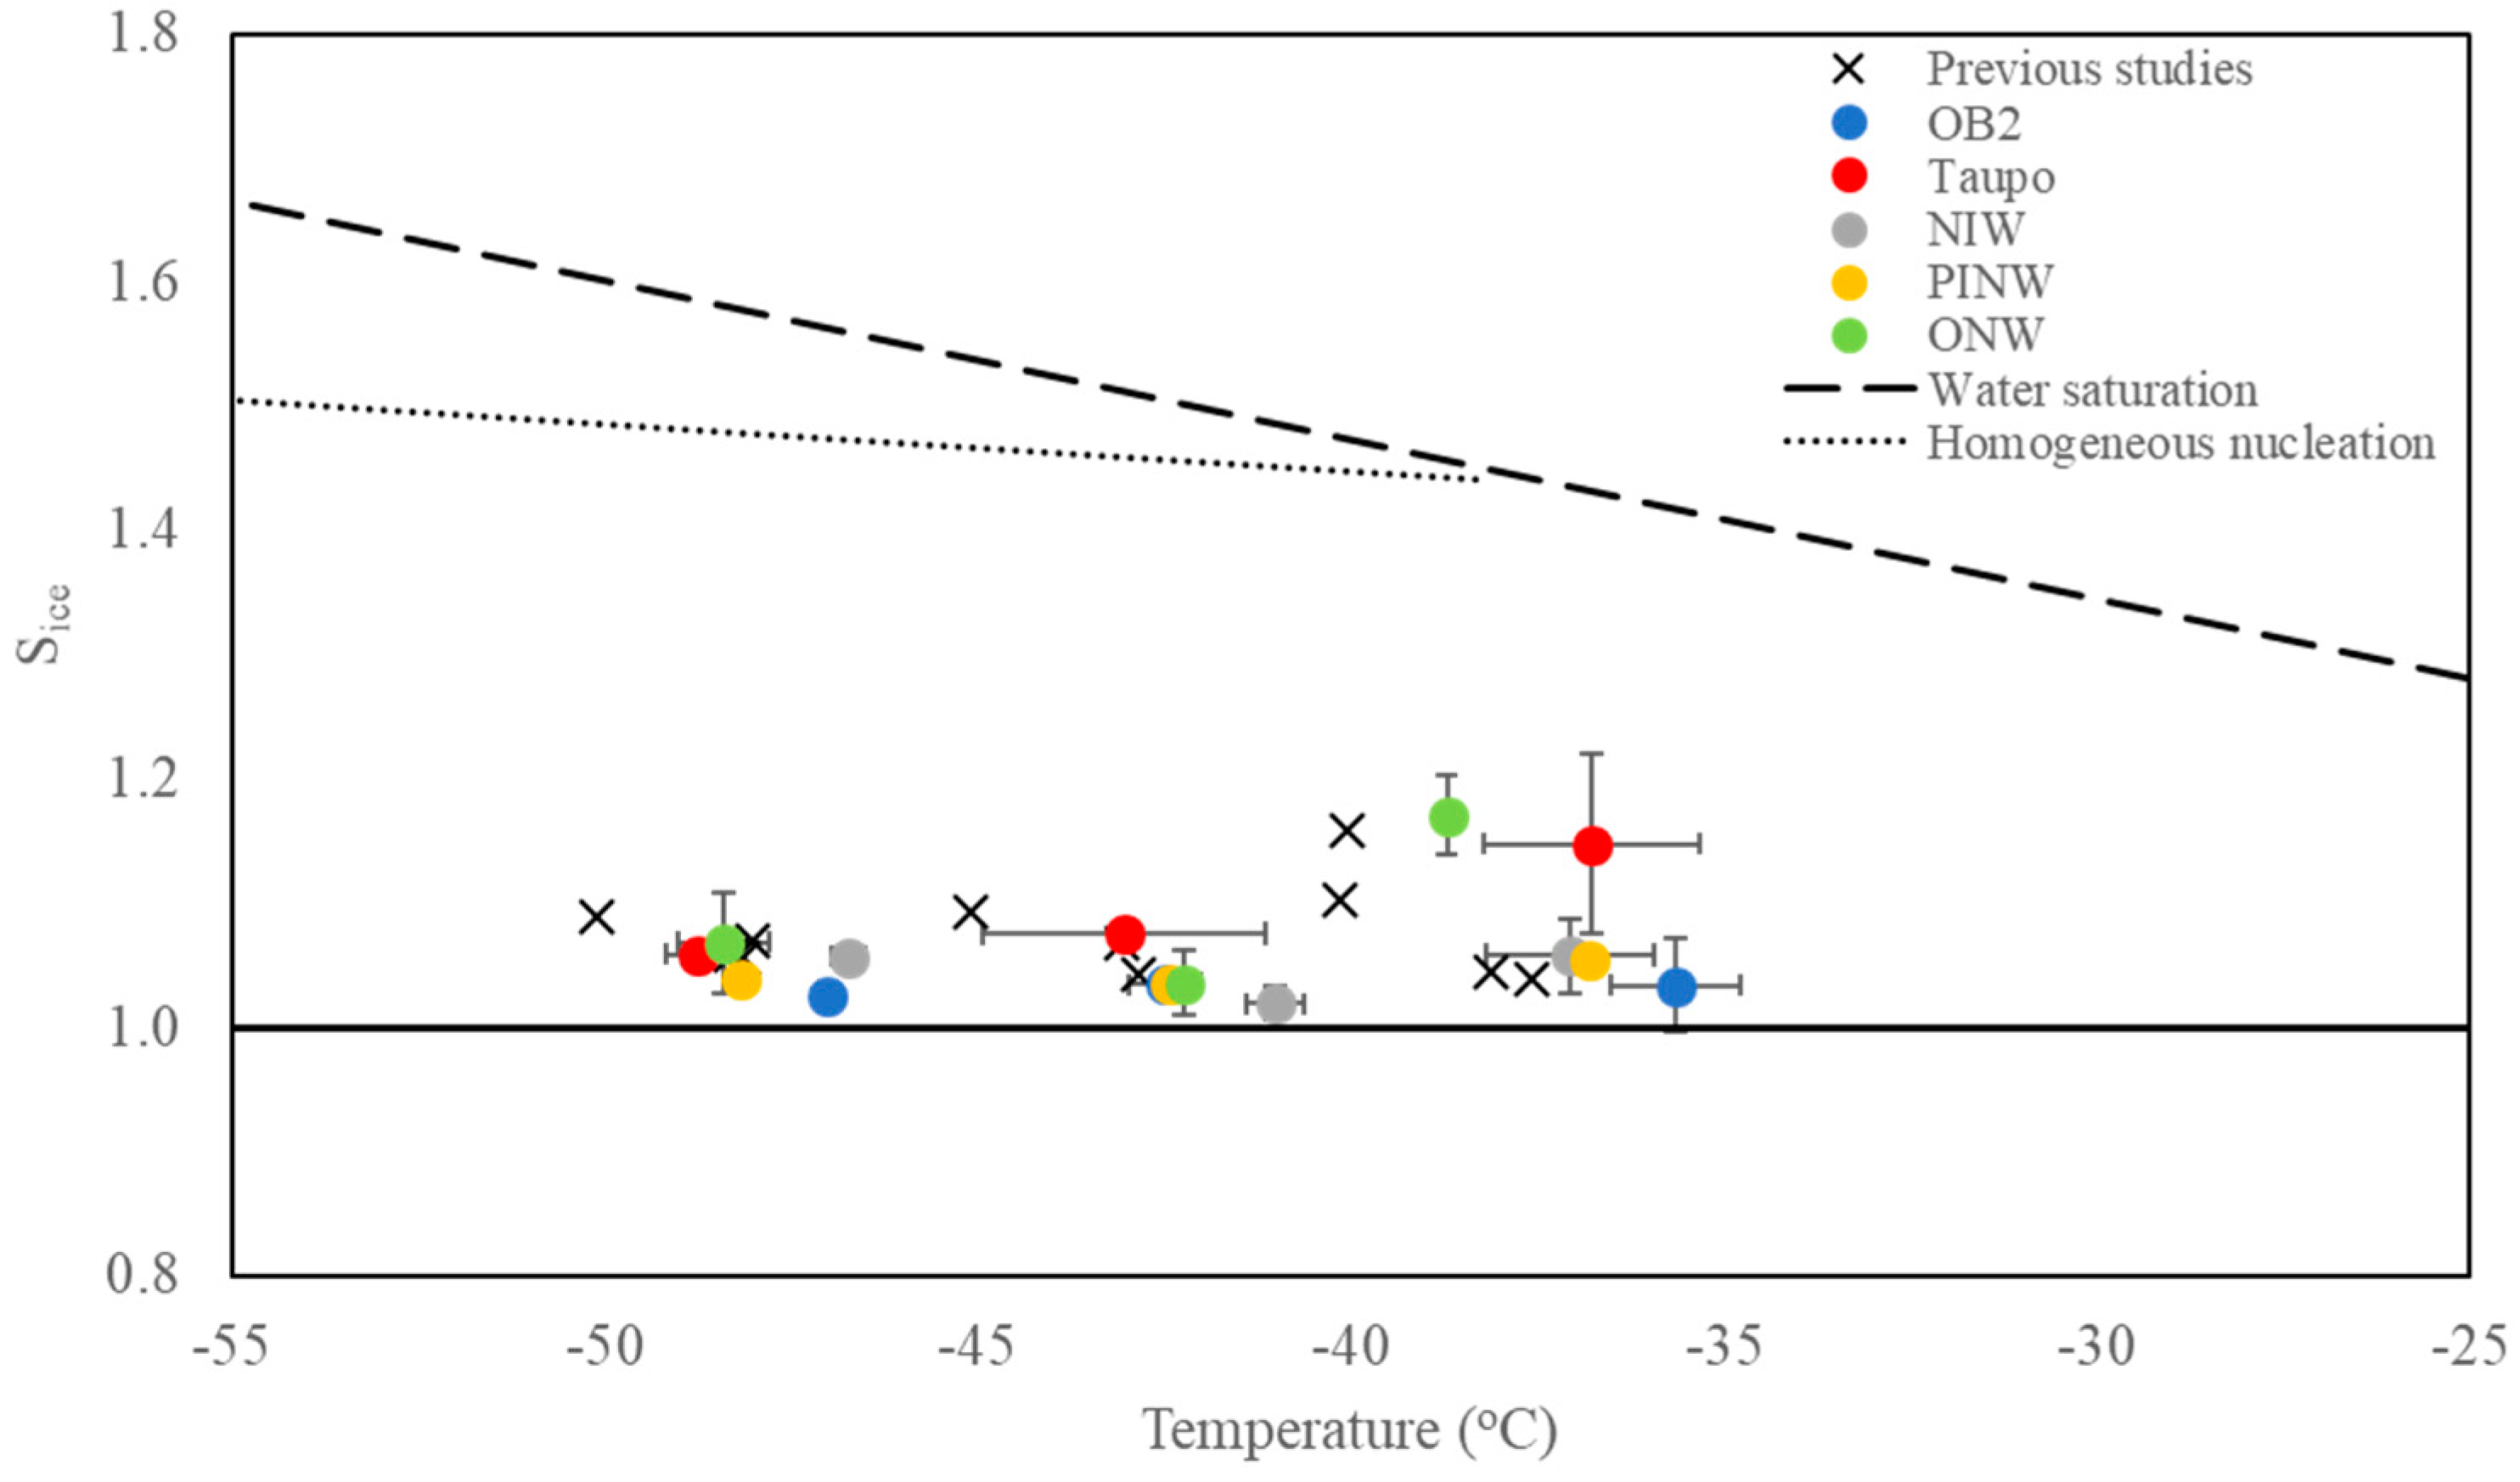
There is no measurable correlation observed between ice saturation ratio (Sice) and mineralogy, or between Sice and bulk composition of the five ash samples at the temperatures investigated. As shown in Figure 3, all samples have similar Sice values (1.02–1.07) in the depositional mode despite having different compositions and mineral/glass contents. Also shown in Figure 3 are deposition mode results from previous studies examining volcanic ash samples that spanned a range of compositions from basalt (~50 SiO2 wt %) to andesite (~60 SiO2 wt %) to rhyolite (~70 SiO2 wt %). It is clear that despite differences in bulk composition, mineral/glass abundance, and mineral phases, depositional ice nucleation on ash is efficient, with similar Sice values close to 1.0. Two samples—ONW and Taupo—require slightly higher ice saturations to nucleate at the highest temperature, but these values are within the error of all other samples (Figure 3). All Sice values from the present study can be found in Table S2.
3.3. Immersion-Mode Ice Nucleation Activity
Results from the immersion-mode freezing reveal that the rhyolitic samples nucleate ice at higher temperatures compared to the basaltic samples, and, in general, frozen fractions of samples increase with higher wt % ash (Figure 4; Table S3A–C) due to increased available surface area. OB2 initiates ice nucleation at −20 °C for the 2.0 wt % ash slurry and at −25 °C for both the 0.5 and 1.0 wt % ash slurries. OB2 also has the highest specific surface area (928.5 m2/kg) of all the samples (Figure 2B). Taupo initiates ice nucleation at −25 °C in both the 1.0 and 2.0 wt % ash slurries. PINW initiates ice nucleation at −25 °C in the 1.0 wt % ash slurry, and the remaining samples (NIW, ONW) initiate ice nucleation at lower temperatures (−30 °C). Larger droplets (>60 μm), which contain more ash particles, have higher frozen fractions than smaller droplets (5–60 μm) at all temperatures investigated (Video S1). Table S3A–C present all frozen fractions calculated from video analyses for the total number of droplets (Table S3A), droplets between 5 and 60 µm in diameter (Table S3B), and droplets >60 µm in diameter (Table S3C). Nucleation events could not be observed in all of the smaller droplets at the lowest temperatures, even though they likely occurred. Because of this, frozen fractions presented in Table S3B do not always reach a value of 1 at temperatures below that for homogeneous freezing.
The average ice nucleation active surface site density (ns) values calculated with Equation (3) are shown in Figure 5. Also shown is their relationship to the volcanic ash parameterization curve determined by a previous study [55]. The samples used here generally follow the parameterization, except at the highest temperature (−20 °C) where OB2 shows a value approximately two orders of magnitude higher than that predicted by the trend. OB2 has the highest ns value at all temperatures examined, even when compared to Taupo, which is also a rhyolite. The basalt samples (NIW, ONW, PINW) show comparable ns values to one of the rhyolite samples (Taupo), but are lower compared to the other (OB2). Because this calculation removes the effects of droplet size and ash concentration, each sample is plotted multiple times using the same symbol. All ns values can be found in Table S4.
There is no quantifiable relationship observed between ns values and mineral/glass contents of ash samples. Correlations were found by plotting ns values calculated from the immersion freezing experiments with certain major element oxides. K2O has a strong positive correlation (R2 = 0.85) with ns values at −25 °C (Figure 6), but this correlation progressively diminishes with decreasing temperature. There are moderate to strong negative correlations between both decreasing MnO content (Figure 7) and decreasing TiO2 content (Figure 8) with increasing ns values at temperatures from −30 to −40 °C. Correlations are best for MnO at −30 °C and for TiO2 at −35 °C but MnO appears to have a stronger relationship with ns values compared to TiO2 at some temperatures. No correlations could be observed at −20 °C because only one sample (OB2) nucleated ice at this temperature.
4. Discussion
4.1. Deposition-Mode Ice Nucleation Activity
Depositional freezing experiments in this study were conducted in the same laboratory, utilizing the same instruments and procedures as previous work on volcanic ash [37]; thus, the results presented here are directly comparable. In this previous study [37], three ash samples were tested in both deposition mode and immersion mode and it was suggested that the presence of Na/Ca feldspars dictates the efficiency of depositional ice nucleation, for it was shown that all three samples were efficient INPs (Sice = 1.05 ± 0.01) over the same range of temperatures examined here. Feldspar minerals, specifically orthoclase and plagioclase, have previously been shown to be efficient depositional INPs when compared to mineral dust originating from Arizona and the Mojave Desert [30]. Findings in this study support this, as all five samples contain plagioclase based on XRD results (Figures S4–S8). Other deposition-mode experiments conducted on volcanic ash attribute improved INA to the presence of a crystallographic structure [34], yet two of the samples used here (OB2 and Taupo) are dominated by amorphous glass and show similar values to samples containing higher mineral contents. Thus, results presented here indicate that differences in mineral/glass abundance do not affect depositional INA at the limited range of temperatures investigated (Figure 3). However, there may be a bulk compositional effect at higher temperatures. Mechanical grinding of the grains may alter sites for ice formation and increase INA [31,37,38], and this may explain the deposition mode results, since all samples were mechanically milled to homogenize grain shape and size prior to the experiments. However, this apparent efficiency may simply result from all of the surface area available on which ice can nucleate (i.e., overseeding [8]), suggesting that all ash samples used here have similar values due to their similar surface areas.
4.2. Immersion-Mode Ice Nucleation Activity
Efficiency of immersion INPs has previously been attributed to particle mineralogy. Kaolinite is found to be efficient in the immersion mode using the cold stage method [55,56]. K-feldspars and quartz were found to be the two most efficient immersion INPs in mineral dust even though they were found in low weight percentages in samples [29]. In studies of volcanic ash, immersion INA has been either attributed to quartz [37], Na-feldspar [38], or K-feldspars [57]. These previous studies focus on the roles of particular minerals instead of bulk chemical composition, yet volcanic ash can contain many different elements present in an amorphous glass phase in addition to those existing in a crystallographic structure. SEM examination confirms that both OB2 and Taupo are dominated by amorphous glass (>90%) which likely contains some quartz and feldspar (with similar backscatter coefficients to the glass) as OB2 was originally an obsidian and Taupo was a crystal-poor pumice clast. Representative backscattered SEM images of all samples can be found in Figures S1 and S2. XRD analyses confirm that both samples contain albite, a plagioclase feldspar, and only Taupo contains orthoclase, a K-feldspar. All samples utilized for these experiments contain various amounts of plagioclase feldspar and magnetite (the latter of which routinely contains Ti). OB2 nucleates ice at the highest temperature (−20 °C; Table S3A–C), has an ns value above the volcanic ash parameterization at this temperature, and consistently has the highest ns value at all temperatures investigated (Figure 5). OB2 also has the highest surface area and the smallest average grain size compared to the other samples (Figure 2B). However, OB2 also contains the highest amount of K2O and the lowest amount of MnO (Table 1), suggesting that composition may also play a role.
4.3. Compositional Effects
Correlations between ns values and particular oxide abundances may relate to the charge density and size of cations and their differing abilities to promote the crystallization of ice on ash surfaces. K+, due to its similar ionic radius to OH− (1.33 Å) [58] and low charge density, is highly reactive with H2O and may more easily coordinate with the ice crystal structure [31], contributing to ice nucleation. Smaller ions with higher charge densities, such as Mn2+ and Ti4+, may not fit as well into the ice crystal structure [31], inhibiting ice nucleation. The correlations observed here are much stronger for MnO than for TiO2 and K2O, but these correlations are strongest at different temperatures for the different oxides. At higher temperatures (−25 °C), the presence of K+ appears to promote ice nucleation on the rhyolitic ash. Conversely, the smaller transition metal cations, Mn2+ and Ti4+, may simultaneously inhibit ice nucleation, but this latter effect is more significant at lower temperatures (−35 to −30 °C). Because X-ray fluorescence (XRF) measures only the bulk percentage of elements, these results cannot determine how different oxidation states of the transition metals may be contributing. For many silicate magmas, as composition evolves from basalt to rhyolite, bulk K2O content will increase as MnO and TiO2 contents decrease. OB2 contains the highest amount of K2O (4.21 wt %), lowest amount of MnO (0.05 wt %), and second lowest amount of TiO2 (0.36 wt %), and is the only sample to nucleate at the highest temperature examined (−20 °C). Ash with much higher K2O content (>>10 wt %) may display more efficient behavior compared to our samples, since previous studies have shown K-feldspars to be efficient nuclei in the immersion mode [29,57].
A recent study [33] attributed the INA of K-feldspar minerals to defects on the crystal surface. Grain surface defects may also contribute to the results presented here, as the pre-experimental milling procedure was utilized to effectively homogenize grain size and shape, and potentially created a number of surface defects on existing minerals in the ash. The sample with the highest ns at all temperatures (OB2) contained very few minerals and was dominated by glass, which lacks a crystallographic structure, suggesting that the lack of crystal structures may promote efficiency of ice nucleation in a comparable way to surface defects on minerals. However, Taupo was another sample tested with a high glass content, and it had lower ns values than OB2 at all temperatures examined. Surface area of ash available for nucleation will of course be a significant factor, as the sample with the largest surface area and smallest average grain size (OB2) consistently has the highest ns value and was the only sample to nucleate ice at the highest temperature (−20 °C). OB2 also had the highest amount of K2O. Samples that nucleated at −25 °C included OB2 and the samples with the second highest and third highest bulk amounts of K2O (Taupo and PINW; Table 1).
4.4. Lightning Generation in Volcanic Plumes
During explosive volcanic eruptions, the fragmentation efficiency of the magma (i.e., how well the magma is broken apart) is dictated by explosion energy and controls the proportion of very fine ash generated. The altitude in the atmosphere to which that ash ascends is controlled by explosion energy and the size and density of the particles. Finer ash will reach higher altitudes and may eventually reach the appropriate isotherm to allow ice nucleation. The study of volcanic lightning is still in its infancy, but it is hypothesized that plume lightning may result from triboelectrification due to ice–ash or ice–ice particle collisions [2,5,6]. The generation of electricity in thunderstorms is largely through the noninductive ice–ice charging mechanism (e.g., [59,60,61]), and a similar process is likely occurring in volcanic plumes, where ash results in an overseeding of ice crystals [8]. As ash concentrations in plumes may be up to 1000 cm−3 [37], a higher abundance of smaller ash particles will increase the likelihood of ice nucleation. Highly explosive, very fine ash-producing eruptions are sometimes driven by the sudden decompression of H2O-saturated, silica-rich magmas with bulk compositions and mineral phases similar to those of OB2 and Taupo (which are both sourced from highly explosive, caldera-forming volcanic centers). These results suggest that ash enriched in K2O will promote nucleation at higher temperatures compared to ash enriched in MnO and TiO2. These findings support previous observations which indicate that larger explosions are more likely to produce lightning than smaller explosions [5] and that the height of the eruption column will correlate with the number of lightning discharges [7,10], as larger explosions create more ash particles of smaller sizes and are sometimes sourced from magmas with evolved compositions. There are many other characteristics of volcanic plumes that may contribute to lightning generation that cannot be constrained by the study presented here, as the relationship between INA and volcanic ash composition represents only one aspect of the processes involved. In addition to a better constraint of volcanic lightning generation, results of this study may be relevant for studies of ice nucleation, lightning generation, and climate effects during preindustrial times following large-scale explosive volcanic eruptions.
5. Conclusions
The results presented here pose important implications for volcanic ash INA, and, subsequently, hydrometeor formation and lightning generation following explosive eruptions. Since the samples utilized were mechanically milled prior to experiments to best homogenize grain size and shape, relationships between INA and composition/mineralogy were determined. In the deposition mode, there is no significant difference in ice saturation ratios between samples of different compositions over the range of temperatures investigated, as all display values close to 1.0. In the immersion mode, results indicate that more ash and finer particles create more available surface area, increasing the likelihood for ice nucleation. Additionally, if volcanic ash generally behaves like the samples used here, then higher K2O and lower MnO and TiO2 could promote ice nucleation at higher temperatures than that required for homogeneous nucleation. Consequently, highly explosive eruptions of compositionally evolved magmas create the very fine ash particles necessary to promote ice nucleation on grain surfaces, which permits tribocharging due to ice–ice or ice–ash collisions, and contributes to the frequent occurrence of volcanic lightning within the eruptive column and plume during these events.
Supplementary Materials
The following are available online at https://www.mdpi.com/2073-4433/9/7/238/s1. Table S1. Sample information. Figure S1. Backscattered electron images of polished ash grain mounts from the Lathrop Wells samples. Figure S2. Backscattered electron images of polished ash grain mounts from the Valles Caldera and Taupo samples. Figure S3. Photographs of ice nucleation on ash grains during deposition-mode experiments. Figure S4. X-ray diffraction spectra of sample OB2. Figure S5. X-ray diffraction spectra of sample Taupo. Figure S6. X-ray diffraction spectra of sample NIW. Figure S7. X-ray diffraction spectra of sample ONW. Figure S8. X-ray diffraction spectra of sample PINW. Table S2. Calculated Sice values. Table S3A–C. Immersion mode results. Table S4. Calculated ice nucleation site density values. Video S1. Example of one complete immersion-mode ice nucleation experiment.
Author Contributions
K.G. provided samples and wrote the manuscript. S.M.C., K.P., and T.W.W. conducted the experiments, M.A.T. provided laboratory facilities.
Acknowledgments
This work was funded by the National Science Foundation (NSF) grants AGS 1444384 and EAR 1536486 (K.G.).
Conflicts of Interest
The authors declare no conflict of interest. The founding sponsors had no role in the design of the study; in the collection, analyses, or interpretation of data; in the writing of the manuscript, and in the decision to publish the results.
References
- Thomas, R.J.; Krehbiel, P.R.; Rison, W.; Edens, H.E.; Aulich, G.D.; Winn, W.P.; McNutt, S.R.; Tytgat, G.; Clark, E. Electrical activity during the 2006 Mount St. Augustine volcanic eruptions. Science 2007, 315, 1097. [Google Scholar] [CrossRef] [PubMed]
- Thomas, R.J.; McNutt, S.R.; Krehbiel, P.R.; Rison, W.; Aulich, G.; Edens, H.E.; Tytgat, G.; Clark, E. Lightning and Electrical Activity during the 2006 Eruption of Augustine Volcano. Available online: https://pubs.usgs.gov/pp/1769/chapters/p1769_chapter25.pdf (accessed on 17 June 2018).
- Gilbert, J.S.; Lane, S.J.; Sparks, R.S.J.; Koyaguchi, T. Charge measurements on particle fallout from a volcanic plume. Nature 1991, 349, 598–600. [Google Scholar] [CrossRef]
- James, M.R.; Wilson, L.; Lane, S.J.; Gilbert, J.S.; Mather, T.A.; Harrison, R.G.; Martin, R.S. Electrical charging of volcanic plumes. Space Sci. Rev. 2008, 137, 399–418. [Google Scholar] [CrossRef]
- McNutt, S.R.; Williams, E.R. Volcanic lightning: Global observations and constraints on source mechanisms. Bull. Volcanol. 2010, 72, 1153–1167. [Google Scholar] [CrossRef]
- Arason, P.; Petersen, G.N.; Bjornsson, H. Observations of the altitude of the volcanic plume during the eruption of Eyjafjallajokull, April–May 2010. Earth Syst. Sci. Data 2011, 3, 9–17. [Google Scholar] [CrossRef]
- Behnke, S.A.; Thomas, R.J.; McNutt, S.R.; Schneider, D.J.; Krehbiel, P.R.; Rison, W.; Edens, H.E. Observations of volcanic lightning during the 2009 eruption of Redoubt Volcano. J. Volcanol. Geotherm. Res. 2013, 259, 214–234. [Google Scholar] [CrossRef]
- Durant, A.J.; Shaw, R.A.; Rose, W.I.; Mi, Y.; Ernst, G.G.J. Ice nucleation and overseeding of ice in volcanic clouds. J. Geophys. Res. Atmos. 2008, 113. [Google Scholar] [CrossRef] [Green Version]
- Van Eaton, A.R.; Muirhead, J.D.; Wilson, C.J.; Cimarelli, C. Growth of volcanic ash aggregates in the presence of liquid water and ice: An experimental approach. Bull. Volcanol. 2012, 74, 1963–1984. [Google Scholar] [CrossRef]
- Behnke, S.A.; Thomas, R.J.; Edens, H.E.; Krehbiel, P.R.; Rison, W. The 2010 eruption of Eyjafjallajökull: Lightning and plume charge structure. J. Geophys. Res. Atmos. 2014, 119, 833–859. [Google Scholar] [CrossRef]
- Cimarelli, C.; Alatorre-Ibargüengoitia, M.A.; Aizawa, K.; Yokoo, A.; Díaz-Marina, A.; Iguchi, M.; Dingwell, D.B. Multiparametric observation of volcanic lightning: Sakurajima Volcano, Japan. Geophys. Res. Lett. 2016, 43, 4221–4228. [Google Scholar] [CrossRef] [Green Version]
- Van Eaton, A.R.; Amigo, Á.; Bertin, D.; Mastin, L.G.; Giacosa, R.E.; González, J.; Valderrama, O.; Fontijn, K.; Behnke, S.A. Volcanic lightning and plume behavior reveal evolving hazards during the April 2015 eruption of Calbuco volcano, Chile. Geophys. Res. Lett. 2016, 43, 3563–3571. [Google Scholar] [CrossRef]
- Firstov, P.P.; Akbashev, R.R.; Holzworth, R.; Cherneva, N.V.; Shevtsov, B.M. Atmospheric electric effects during the explosion of Shiveluch volcano on November 16, 2014. Izv. Atmos. Ocean. Phys. 2017, 53, 24–31. [Google Scholar] [CrossRef]
- Isono, K.; Komabayasi, M.; Ono, A. Volcanoes as a source of atmospheric ice nuclei. Nature 1959, 183, 317–318. [Google Scholar] [CrossRef]
- Hobbs, P.V.; Fullerton, C.M.; Bluhm, G.C. Ice nucleus storms in Hawaii. Nat. Phys. Sci. 1971, 230, 90–91. [Google Scholar] [CrossRef]
- Fornea, A.P.; Brooks, S.D.; Dooley, J.B.; Saha, A. Heterogeneous freezing of ice on atmospheric aerosols containing ash, soot, and soil. J. Geophys. Res. Atmos. 2009, 114. [Google Scholar] [CrossRef] [Green Version]
- Seifert, P.; Ansmann, A.; Gross, S.; Freudenthaler, V.; Heinold, B.; Hiebsch, A.; Mattis, I.; Schmidt, J.; Schnell, F.; Tesche, M.; et al. Ice formation in ash-influenced clouds after the eruption of the Eyjafjallajökull volcano in April 2010. J. Geophys. Res. Atmos. 2011, 116. [Google Scholar] [CrossRef] [Green Version]
- Vali, G. Nucleation terminology. Bull. Am. Meteorol. Soc. 1985, 66, 1426–1427. [Google Scholar]
- Pruppacher, H.R.; Klett, J.D. Microphysics of Clouds and Precipitation, 2nd ed.; Kluwer Academic Publishing: Dordrecht, The Netherlands, 1997. [Google Scholar]
- Vali, G.; DeMott, P.J.; Möhler, O.; Whale, T.F. A proposal for ice nucleation terminology. Atmos. Chem. Phys. 2015, 15, 10263–10270. [Google Scholar] [CrossRef]
- Mason, B.J.; Maybank, J. Ice-nucleating properties of some natural mineral dusts. Q. J. R. Meteorol. Soc. 1958, 84, 235–241. [Google Scholar] [CrossRef]
- Roberts, P.; Hallett, J. A laboratory study of the ice nucleating properties of some mineral particulates. Q. J. R. Meteorol. Soc. 1968, 94, 25–34. [Google Scholar] [CrossRef]
- Knopf, D.A.; Koop, T. Heterogeneous nucleation of ice on surrogates of mineral dust. J. Geophys. Res. Atmos. 2006, 111. [Google Scholar] [CrossRef] [Green Version]
- Möhler, O.; Field, P.R.; Connolly, P.; Benz, S.; Saathoff, H.; Schnaiter, M.; Wagner, R.; Cotton, R.; Krämer, M.; Mangold, A.; et al. Efficiency of the deposition mode ice nucleation on mineral dust particles. Atmos. Chem. Phys. 2006, 6, 3007–3021. [Google Scholar] [CrossRef] [Green Version]
- Marcolli, C.; Gedamke, S.; Peter, T.; Zobrist, B. Efficiency of immersion mode ice nucleation on surrogates of mineral dust. Atmos. Chem. Phys. 2007, 7, 5081–5091. [Google Scholar] [CrossRef] [Green Version]
- Broadley, S.L.; Murray, B.J.; Herbert, R.J.; Atkinson, J.D.; Dobbie, S.; Malkin, T.L.; Condliffe, E.; Neve, L. Immersion mode heterogeneous ice nucleation by an illite rich powder representative of atmospheric mineral dust. Atmos. Chem. Phys. 2012, 12, 287–307. [Google Scholar] [CrossRef] [Green Version]
- Zimmermann, F.; Weinbruch, S.; Schütz, L.; Hofmann, H.; Ebert, M.; Kandler, K.; Worringen, A. Ice nucleation properties of the most abundant mineral dust phases. J. Geophys. Res. Atmos. 2008, 113. [Google Scholar] [CrossRef] [Green Version]
- Claquin, T.; Schulz, M.; Balkanski, Y.J. Modeling the mineralogy of atmospheric dust sources. J. Geophys. Res. Atmos. 1999, 104, 22243–22256. [Google Scholar] [CrossRef] [Green Version]
- Atkinson, J.D.; Murray, B.J.; Woodhouse, M.T.; Whale, T.F.; Baustian, K.J.; Carslaw, K.S.; Dobbie, S.; O’Sullivan, D.; Malkin, T.L. The importance of feldspar for ice nucleation by mineral dust in mixed-phase clouds. Nature 2013, 498, 355–358. [Google Scholar] [CrossRef] [PubMed] [Green Version]
- Yakobi-Hancock, J.D.; Ladino, L.A.; Abbatt, J.P.D. Feldspar minerals as efficient deposition ice nuclei. Atmos. Chem. Phys. 2013, 13, 11175–11185. [Google Scholar] [CrossRef] [Green Version]
- Zolles, T.; Burkart, J.; Häusler, T.; Pummer, B.; Hitzenberger, R.; Grothe, H. Identification of ice nucleation active sites on feldspar dust particles. J. Phys. Chem. A 2015, 119, 2692–2700. [Google Scholar] [CrossRef] [PubMed]
- Peckhaus, A.; Kiselev, A.; Hiron, T.; Ebert, M.; Leisner, T. A comparative study of K-rich and Na/Ca-rich feldspar ice-nucleating particles in a nanoliter droplet freezing assay. Atmos. Chem. Phys. 2016, 16, 11477–11496. [Google Scholar] [CrossRef]
- Kiselev, A.; Bachmann, F.; Pedevilla, P.; Cox, S.J.; Michaelides, A.; Gerthsen, D.; Leisner, T. Active sites in heterogeneous ice nucleation—The example of K-rich feldspars. Science 2017, 355, 367–371. [Google Scholar] [CrossRef] [PubMed]
- Kulkarni, G.; Nandasiri, M.; Zelenyuk, A.; Beranek, J.; Madaan, N.; Devaraj, A.; Shutthanandan, V.; Thevuthasan, S.; Varga, T. Effects of crystallographic properties on the ice nucleation properties of volcanic ash particles. Geophys. Res. Lett. 2015, 42, 3048–3055. [Google Scholar] [CrossRef] [Green Version]
- Hoyle, C.R.; Pinti, V.; Welti, A.; Zobrist, B.; Marcolli, C.; Luo, B.; Höskuldsson, Á.; Mattsson, H.B.; Stetzer, O.; Thorsteinsson, T.; et al. Ice nucleation properties of volcanic ash from Eyjafjallajökull. Atmos. Chem. Phys. 2011, 11, 9911–9926. [Google Scholar] [CrossRef] [Green Version]
- Gibbs, A.; Charman, M.; Schwarzacher, W.; Rust, A.C. Immersion freezing of supercooled water drops containing glassy volcanic ash particles. GeoResJ 2015, 7, 66–69. [Google Scholar] [CrossRef]
- Schill, G.P.; Genareau, K.; Tolbert, M.A. Deposition and immersion-mode nucleation of ice by three distinct samples of volcanic ash. Atmos. Chem. Phys. 2015, 15, 7523–7536. [Google Scholar] [CrossRef] [Green Version]
- Mangan, T.P.; Atkinson, J.D.; Neuberg, J.W.; O’Sullivan, D.; Wilson, T.W.; Whale, T.F.; Neve, L.; Umo, N.S.; Malkin, T.L.; Murray, B.J. Heterogeneous ice nucleation by soufriere hills volcanic ash immersed in water droplets. PLoS ONE 2017, 12. [Google Scholar] [CrossRef] [PubMed]
- Toyoda, S.; Goff, F.; Ikeda, S.; Ikeya, M. ESR dating of quartz phenocrysts in the El Cajete and Battleship Rock Members of Valles Rhyolite, Valles Caldera, New Mexico. J. Volcanol. Geotherm. Res. 1995, 67, 29–40. [Google Scholar] [CrossRef]
- Reneau, S.L.; Gardner, J.N.; Forman, S.L. New evidence for the age of the youngest eruptions in the Valles caldera, New Mexico. Geology 1996, 24, 7–10. [Google Scholar] [CrossRef]
- Walker, G.P. The Taupo pumice: Product of the most powerful known (ultraplinian) eruption? J. Volcanol. Geotherm. Res. 1980, 8, 69–94. [Google Scholar] [CrossRef]
- Wilson, C.J.N. The Taupo eruption, New Zealand I. General aspects. Philos. Trans. R. Soc. Lond. A 1985, 314, 199–228. [Google Scholar] [CrossRef]
- Wilson, C.J.N. Stratigraphy, chronology, styles and dynamics of late quaternary eruptions from Taupo volcano, New Zealand. Philos. Trans. R. Soc. Lond. A 1993, 343, 205–306. [Google Scholar] [CrossRef]
- Houghton, B.F.; Carey, R.J.; Cashman, K.V.; Wilson, C.J.; Hobden, B.J.; Hammer, J.E. Diverse patterns of ascent, degassing, and eruption of rhyolite magma during the 1.8 ka Taupo eruption, New Zealand: Evidence from clast vesicularity. J. Volcanol. Geotherm. Res. 2010, 195, 31–47. [Google Scholar] [CrossRef]
- Dunbar, N.W.; Kyle, P.R. Lack of volatile gradient in the Taupo plinian-ignimbrite transition: Evidence from melt inclusion analysis. Am. Mineral. 1993, 78, 612–618. [Google Scholar]
- Sutton, A.N.; Blake, S.; Wilson, C.J. An outline geochemistry of rhyolite eruptives from Taupo volcanic centre, New Zealand. J. Volcanol. Geotherm. Res. 1995, 68, 153–175. [Google Scholar] [CrossRef]
- Fleck, R.J.; Turrin, B.D.; Sawyer, D.A.; Warren, R.G.; Champion, D.E.; Hudson, M.R.; Minor, S.A. Age and character of basaltic rocks of the Yucca Mountain region, southern Nevada. J. Geophys. Res. Solid Earth 1996, 101, 8205–8227. [Google Scholar] [CrossRef]
- Heizler, M.T.; Perry, F.V.; Crowe, B.M.; Peters, L.; Appelt, R. The age of Lathrop Wells volcanic center: An 40Ar/39Ar dating investigation. J. Geophys. Res. Solid Earth 1999, 104, 767–804. [Google Scholar] [CrossRef]
- Valentine, G.A.; Krier, D.; Perry, F.V.; Heiken, G. Scoria cone construction mechanisms, Lathrop Wells Volcano, Southern Nevada, USA. Geology 2005, 33, 629–632. [Google Scholar] [CrossRef]
- Valentine, G.A.; Perry, F.V. Decreasing magmatic footprints of individual volcanoes in a waning basaltic field. Geophys. Res. Lett. 2006, 33. [Google Scholar] [CrossRef] [Green Version]
- Genareau, K.; Valentine, G.A.; Moore, G.; Hervig, R.L. Mechanisms for transition in eruptive style at a monogenetic scoria cone revealed by microtextural analyses (Lathrop Wells Volcano, Nevada, USA). Bull. Volcanol. 2010, 72, 593–607. [Google Scholar] [CrossRef]
- Broto, F.; Clausse, D. A study of the freezing of supercooled water dispersed within emulsions by differential scanning calorimetry. J. Phys. C 1976, 9. [Google Scholar] [CrossRef]
- Koop, T.; Luo, B.; Tsias, A.; Peter, T. Water activity as the determinant for homogeneous ice nucleation in aqueous solutions. Nature 2000, 406, 611–614. [Google Scholar] [CrossRef] [PubMed]
- Steinke, I.; Möhler, O.; Kiselev, A.; Niemand, M.; Saathoff, H.; Schnaiter, M.; Skrotzki, J.; Hoose, C.; Leisner, T. Ice nucleation properties of fine ash particles from the Eyjafjallajökull eruption in April 2010. Atmos. Chem. Phys. 2011, 11, 12945–12958. [Google Scholar] [CrossRef] [Green Version]
- Murray, B.J.; Broadley, S.L.; Wilson, T.W.; Atkinson, J.D.; Wills, R.H. Heterogeneous freezing of water droplets containing kaolinite particles. Atmos. Chem. Phys. 2011, 11, 4191–4207. [Google Scholar] [CrossRef] [Green Version]
- Pinti, V.; Marcolli, C.; Zobrist, B.; Hoyle, C.R.; Peter, T. Ice nucleation efficiency of clay minerals in the immersion mode. Atmos. Chem. Phys. 2012, 12, 5859–5878. [Google Scholar] [CrossRef] [Green Version]
- Harrison, A.D.; Whale, T.F.; Carpenter, M.A.; Holden, M.A.; Neve, L.; O’Sullivan, D.; Vergara Temprado, J.; Murray, B.J. Not all feldspars are equal: A survey of ice nucleating properties across the feldspar group of minerals. Atmos. Chem. Phys. 2016, 16, 10927–10940. [Google Scholar] [CrossRef] [Green Version]
- Amis, E.; Hinton, J.F. Solvent Effects on Chemical Phenomena; Academic Press: New York, NY, USA, 1973. [Google Scholar]
- Takahashi, T. Riming electrification as a charge generation mechanism. J. Atmos. Sci. 1978, 35, 1536–1548. [Google Scholar] [CrossRef]
- Jayaratne, E.; Saunders, C.P.R.; Hallett, J. Laboratory studies of the charging of soft hail during ice crystal interactions. Q. J. R. Meteorol. Soc. 1983, 109, 609–630. [Google Scholar] [CrossRef]
- Saunders, C.P.R.; Bax-Norman, H.; Emersic, C.; Avila, E.E.; Castellano, N.E. Laboratory studies of the effect of cloud conditions on graupel/crystal charge transfer in thunderstorm electrification. Q. J. R. Meteorol. Soc. 2006, 132, 2653–2673. [Google Scholar] [CrossRef] [Green Version]
Figure 1.
Photograph of near-vent lightning at Colima volcano, Mexico (courtesy of Martin Rietze). Heterogeneous ice nucleation will occur on volcanic ash particles between the −10 °C and −20 °C isotherm [8,9], the latter of which is the highest temperature examined in this study using both deposition-mode and immersion-mode experiments. Based upon remote sensing studies of volcanic lightning, the −20 °C isotherm occurs at an altitude ranging from 4 to 10 km [10,11,12,13]. Scale to the left side of the figure does not reflect the true height of the eruption column.

Figure 2.
Grain size distributions of samples determined from laser diffraction particle size analysis (LDPSA). (A) Original volcanic deposits were mechanically milled and sieved to homogenize grain size and shape. All five samples are classified as very fine ash (<32 μm) with a dominant mode between 5 and 20 μm. (B) Relevant properties of ash samples used to calculate particle surface areas (SAp). Surface area and average size of ash grains were determined from LDPSA measurements (average of 5 measurements), and ash bulk density was determined using helium pycnometry (average of 10 measurements). The particle diameter represents the D (3,2) value (the surface area mean) in the size distribution. The LDPSA assumes a spherical shape for particles.
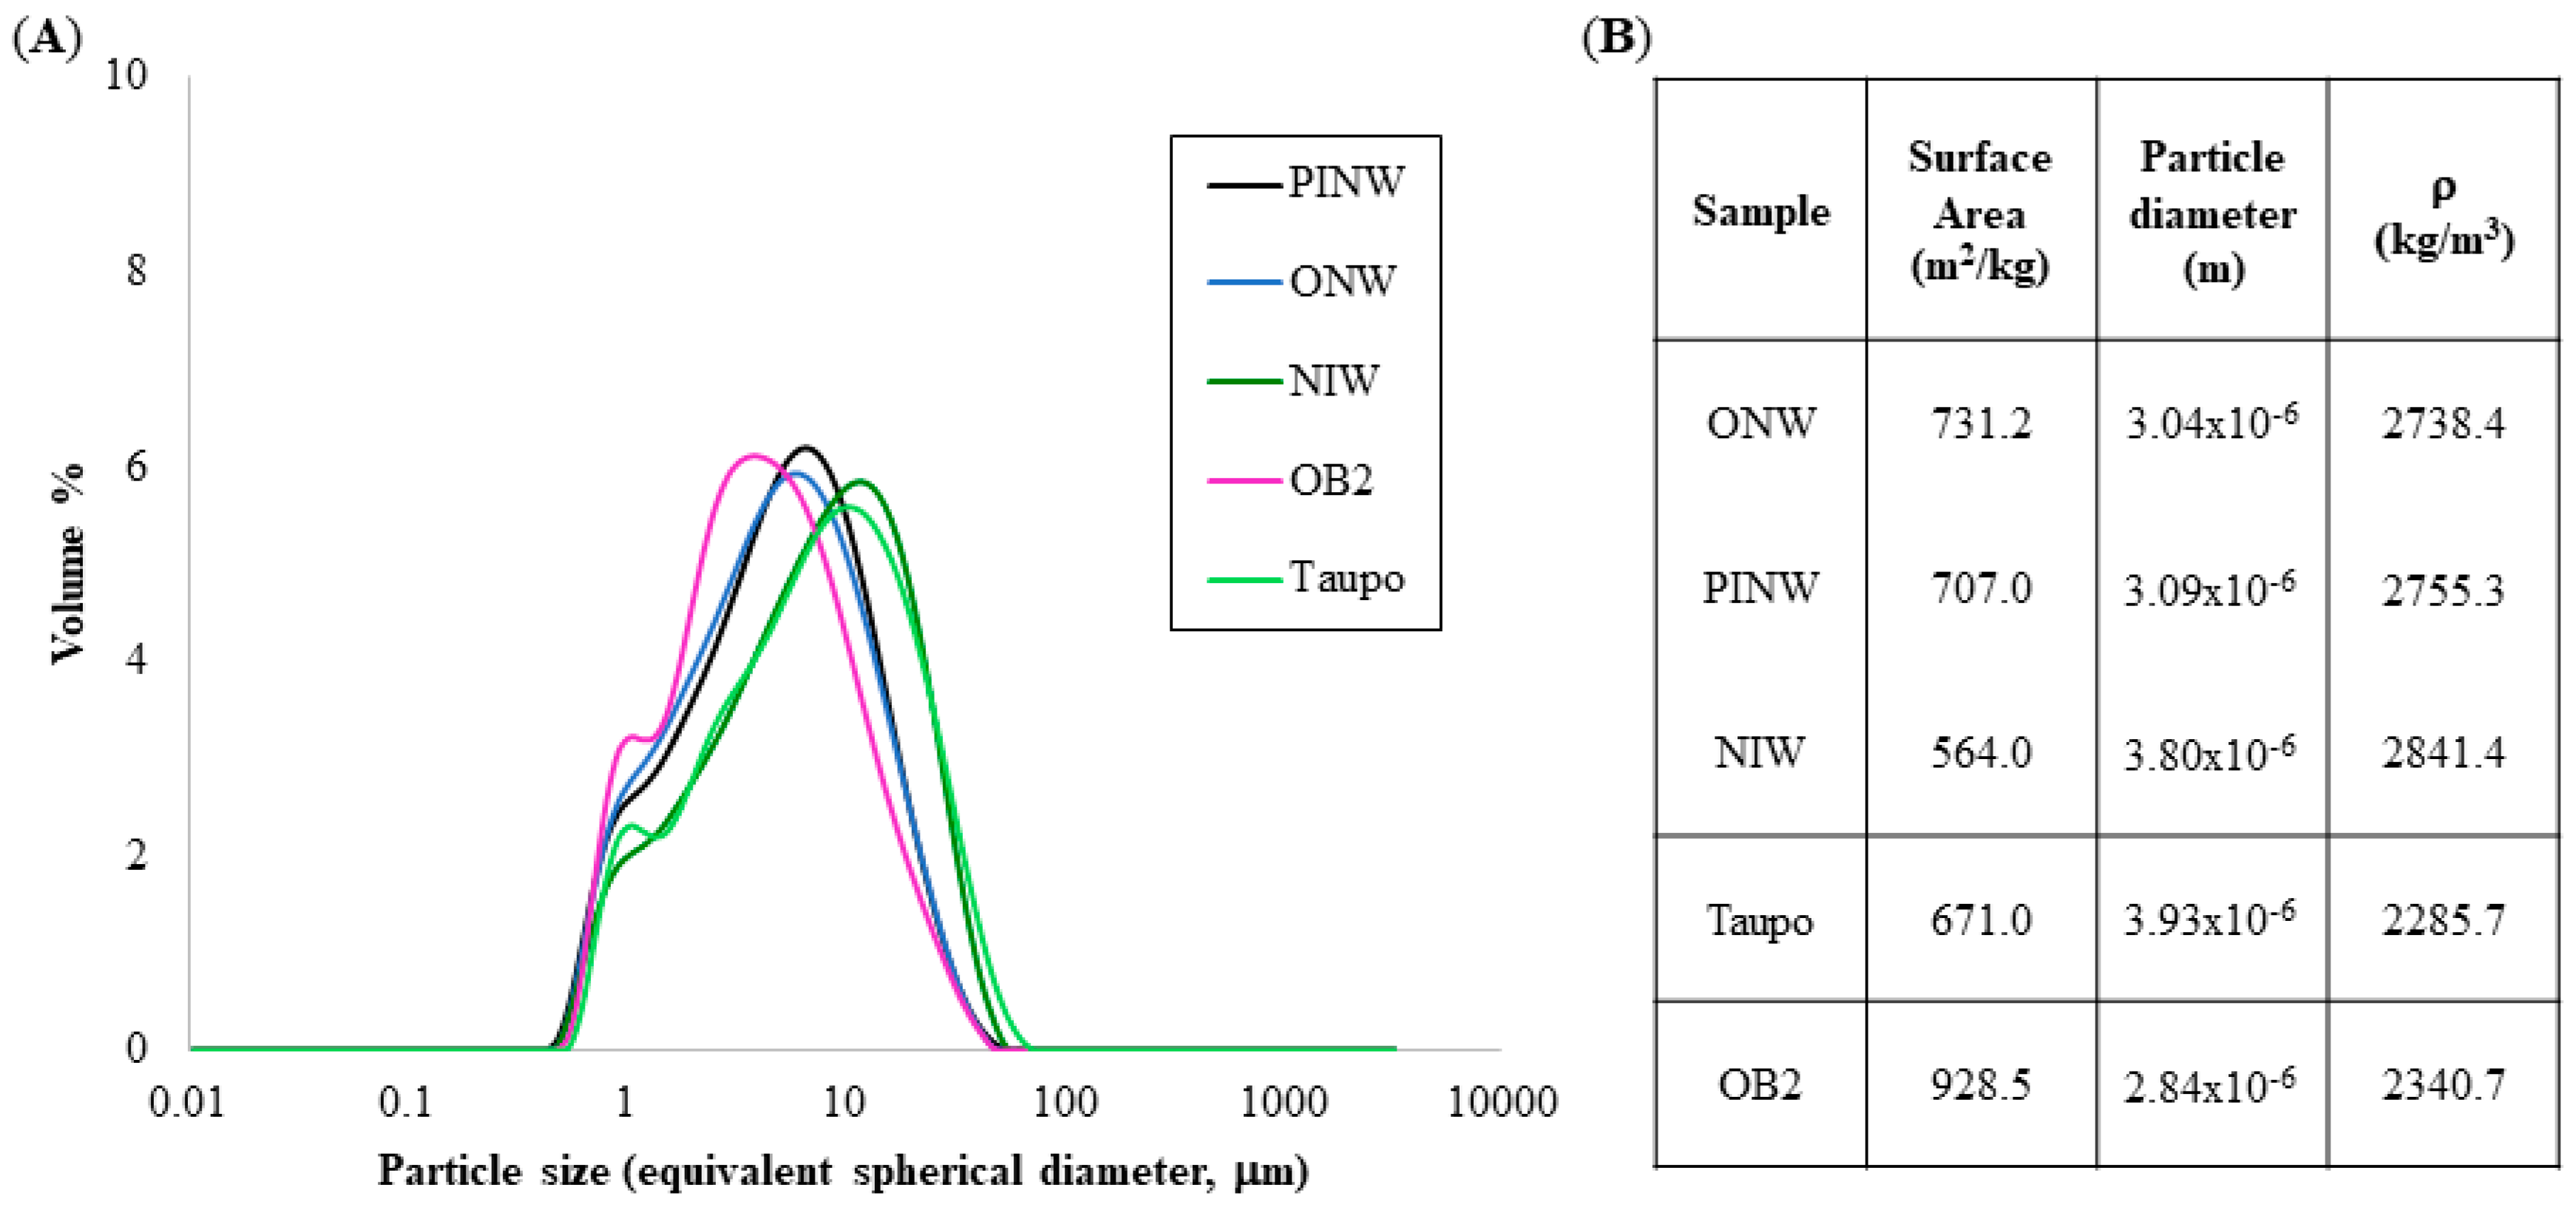
Figure 3.
Ice saturation ratio (Sice) as a function of temperature for deposition-mode experiments. The closer Sice is to 1.0, the more efficient the sample is at nucleating ice. Colored circles are averages from three experiments for each sample analyzed in this study. The dashed and solid lines represent water and ice saturation, respectively. The dotted line represents homogeneous ice nucleation of pure water [53]. “X” symbols denote previous deposition-mode nucleation studies conducted on ash samples from other volcanoes, including Eyjafjallajökull, (Iceland) [34,54], Volcàn Fuego (Guatemala), Taupo (New Zealand), and Soufrière Hills (Montserrat) [37]. Combined with the deposition-mode data obtained here, results of all studies indicate that volcanic ash grains are efficient ice nucleating particles (INPs) at the temperatures examined regardless of bulk composition or mineral content.

Figure 4.
Results of immersion-mode experiments. Frozen fractions are shown as a function of temperature for the three slurries containing different proportions of ash. OB2 is the only sample that nucleates ice at −20 °C. For all temperatures examined, the 2 wt % ash slurry consistently has a higher frozen fraction due to the higher surface area available for nucleation.

Figure 5.
Ice nucleation active site density (ns), calculated from the frozen fraction in immersion-mode experiments and measured ash properties. The curve represents a previous parameterization for volcanic ash [55]. OB2 consistently has the highest ns value at all temperatures investigated.
Figure 5.
Ice nucleation active site density (ns), calculated from the frozen fraction in immersion-mode experiments and measured ash properties. The curve represents a previous parameterization for volcanic ash [55]. OB2 consistently has the highest ns value at all temperatures investigated.

Figure 6.
Relationship between ice nucleation active site density (ns) and the bulk K2O content of ash samples. There is a strong linear correlation at −25 °C which progressively decays with decreasing temperature, indicating that K2O may help promote ice nucleation at temperatures well below that for homogeneous nucleation. Each data point represents the average of the three different slurry concentrations, which are themselves average values for the multiple measurements, and error bars indicate the standard deviation.

Figure 7.
Linear relationship between the ice nucleation active site density (ns) calculated from results of immersion-mode experiments with the bulk MnO content of ash samples. Correlations are generally stronger at −30 to −35 °C and are weaker at higher and lower temperatures. Each data point represents the average of the three different slurry concentrations, which are themselves average values for the multiple measurements, and error bars indicate the standard deviation.

Figure 8.
Linear relationship between the ice nucleation active site density (ns) calculated from results of immersion-mode experiments with the bulk TiO2 content of ash samples. The correlation is strongest at −35 °C and weaker at both higher and lower temperatures. Each data point represents the average of the three different slurry concentrations, which are themselves average values for the multiple measurements, and error bars indicate the standard deviation.


Table 1.
Bulk sample compositions. X-ray fluorescence analyses of ash, showing the proportions of major/minor element oxides in the bulk sample. Each value is a normalized average from five separate measurements, with a standard deviation of <3% of the value. Based upon SiO2 content, OB2 and Taupo are classified as rhyolites and the Lathrop Wells samples (NIW, ONW, PINW) are classified as trachybasalts.
| Major Elements | OB2 | Taupo | NIW | ONW | PINW |
|---|---|---|---|---|---|
| SiO2 | 73.05 | 73.48 | 48.43 | 49.12 | 49.29 |
| TiO2 | 0.36 | 0.32 | 1.89 | 1.90 | 1.98 |
| Al2O3 | 13.74 | 13.81 | 16.22 | 17.14 | 17.09 |
| Fe2O3 | 2.23 | 2.58 | 11.92 | 11.36 | 11.51 |
| MnO | 0.05 | 0.10 | 0.19 | 0.18 | 0.18 |
| MgO | 0.70 | 0.37 | 7.04 | 5.73 | 5.68 |
| CaO | 1.64 | 1.77 | 8.07 | 8.46 | 7.96 |
| Na2O | 3.94 | 4.72 | 3.38 | 3.22 | 3.40 |
| K2O | 4.21 | 2.78 | 1.70 | 1.73 | 1.87 |
| P2O5 | 0.08 | 0.06 | 1.16 | 1.16 | 1.05 |
| Total | 100 | 100 | 100 | 100 | 100 |
Table 2.
Average mineral/glass contents of samples. Backscattered electron images, obtained with the scanning electron microscope, were used to quantify the percent area of minerals and amorphous glass in polished epoxy mounts using ImageJ freeware. Due to similar backscatter coefficients, glass and feldspar percentages (Glass + Fds) were analyzed simultaneously in the rhyolite samples (OB2 and Taupo) and pyroxene + olivine percentages (Pyx + Olv) were analyzed simultaneously in the basalt samples (NIW, ONW, PINW). Uncertainties are based upon the standard deviation of the average for the total number of images analyzed (20–25 for each sample). The two-dimensional analyses of the samples are assumed to represent the three-dimensional values, as the grains are randomly oriented and >1000 grains per sample were examined to provide an accurate representation.
| Sample | Fds (%) | Glass + Fds (%) | Pyx + Olv (%) | Fe-oxides (%) | Total Minerals (%) |
|---|---|---|---|---|---|
| Taupo | 99.43 ± 1.74 | 0.57 ± 1.74 | 0.57 ± 1.74 | ||
| OB2 | 99.59 ± 0.45 | 0.41 ± 0.45 | 0.41 ± 0.45 | ||
| NIW | 76.64 ± 4.20 | 16.67 ± 4.89 | 5.82 ± 2.72 | 0.86 ± 0.73 | 83.33 ± 4.89 |
| ONW | 67.93 ± 4.61 | 19.20 ± 5.07 | 9.02 ± 4.39 | 3.85 ± 2.70 | 80.80 ± 5.07 |
| PINW | 70.50 ± 6.99 | 22.06 ± 7.06 | 6.17 ± 2.71 | 1.28 ± 0.71 | 77.94 ± 7.06 |
© 2018 by the authors. Licensee MDPI, Basel, Switzerland. This article is an open access article distributed under the terms and conditions of the Creative Commons Attribution (CC BY) license (http://creativecommons.org/licenses/by/4.0/).
Share and Cite
MDPI and ACS Style
Genareau, K.; Cloer, S.M.; Primm, K.; Tolbert, M.A.; Woods, T.W. Compositional and Mineralogical Effects on Ice Nucleation Activity of Volcanic Ash. Atmosphere 2018, 9, 238. https://doi.org/10.3390/atmos9070238
AMA Style
Genareau K, Cloer SM, Primm K, Tolbert MA, Woods TW. Compositional and Mineralogical Effects on Ice Nucleation Activity of Volcanic Ash. Atmosphere. 2018; 9(7):238. https://doi.org/10.3390/atmos9070238
Chicago/Turabian StyleGenareau, Kimberly, Shelby M. Cloer, Katherine Primm, Margaret A. Tolbert, and Taylor W. Woods. 2018. "Compositional and Mineralogical Effects on Ice Nucleation Activity of Volcanic Ash" Atmosphere 9, no. 7: 238. https://doi.org/10.3390/atmos9070238
Note that from the first issue of 2016, this journal uses article numbers instead of page numbers. See further details here.