Article

Analysis of Drought Vulnerability Characteristics and Risk Assessment Based on Information Distribution and Diffusion in Southwest China

1
College of Water Resource and Hydropower, Sichuan University, Chengdu 610065, China
2
State Key Laboratory of Hydraulics and Mountain River Engineering, Sichuan University, Chengdu 610065, China
*
Authors to whom correspondence should be addressed.
Atmosphere 2018, 9(7), 239; https://doi.org/10.3390/atmos9070239
Submission received: 5 April 2018 / Revised: 17 June 2018 / Accepted: 18 June 2018 / Published: 22 June 2018

Abstract

:
Drought vulnerability characteristics and risk assessment form the basis of drought risk management. In this study, the standardized precipitation index (SPI) and drought damage rates (DDR) were combined to analyze drought vulnerability characteristics and drought risk in Southwest China (SC). The information distribution method was applied to estimate the probability density of the drought strength (DS) and the two-dimensional normal information diffusion method was used to construct the vulnerability relationships between DS and drought damage (DD). The risk was then evaluated by combining the probability function of the DS and the DD vulnerability curve. The results showed that the relationship between the DS and the DD was nonlinear in SC and its provinces. With the increase in DS, the degree of DD increased gradually, stabilized, or decreased toward the end. However, the vulnerability characteristics of the different provinces varied widely due to multiple risk-bearing bodies and abilities to resist disasters. The risk values obtained across the range of time scales of the SPI were not significantly different. The yielding probabilities will be reduced for the crop area by 10%, 30%, and 70% due to drought. Compared to a normal year in SC, the probability values were 16.04%, 10.29%, and 2.70%, respectively. These results have the potential to provide a reference for agricultural production and drought risk management.

1. Introduction

Natural disasters are increasing at an alarming rate worldwide [1,2]. Droughts are one of the most severe natural disasters and are characterized by a slow development, long duration, vast affected areas, and high severity [3]. Furthermore, droughts are expected to become more severe and frequent. This is expected to lead to more water demand, rapid population growth, global climate change, and a limited water supply [4]. To confirm the impact of drought in the future, the governments of various countries have implemented large numbers of engineering-based and non-engineering-based disaster mitigation actions [5,6,7,8]. However, uninformed mitigation actions will lead to the misuse of human, material, and financial resources, which are contrary to the original goal of mitigation [9]. To avoid the misuse of resources, the drought disaster assessment is an important method for scientific and systematic analysis of disaster risk. It is a key process in the formation of disaster prevention and mitigation policies.
Droughts have disastrous characteristics and can damage vast areas even though it is very difficult to predict the exact time that a drought event will begin [10]. Drought management has typically focused on analyzing drought risk and assessing drought vulnerability. Drought vulnerability represents the foreseeable consequences of a drought damage (DD) event based on drought hazard factors. The drought risk can be defined as the “probability of occurrence of a drought damage event in a given period of time.”
Agricultural drought damage is the result of a combination of a precipitation shortage and the vulnerability of the agricultural production system. The degree of vulnerability can magnify or lessen disaster damage [11]. Due to an increasing severity of agricultural drought risks, research on drought vulnerability has also been increasing [11,12,13,14]. Wilhelmi and Wilhite [12] conducted a geographic information system-based agricultural drought vulnerability study by considering key factors such as soil and land use, irrigated cropland, and agro-climatic data. Shahid and Behrawan [11] introduced a systematic three-step methodology for a meteorological drought risk assessment framework that incorporates hazards and vulnerability, which was widely used in many regions of the world. Kim et al. [8] mapped the drought risk for 229 administrative districts across South Korea using a drought hazard index, which was based on the precipitation probability and its association with droughts. In addition, a vulnerability index was proposed to reflect seven socioeconomic consequences of drought. Rajsekhar et al. [13] performed drought vulnerability assessments in Texas by considering various socioeconomic factors. He et al. [14,15] analyzed the characteristics of agricultural drought hazards and risks in China using the framework introduced by Shahid and Behrawan [13]. Some studies [16,17] also improved the weighting scheme for vulnerability assessments via methods such as the analytic hierarchy process. This is due to the vulnerability index used in previous studies to assign equal weight to all the indices, which may not adequately reflect the impact of droughts. Most previous studies have considered physical/structural indicators and socioeconomic factors when assessing regional drought vulnerability while others focused on the selection and weight calculations of drought vulnerability indices based on historical data. Few studies have been performed on the vulnerability curve (also called the hazard–damage curve). The vulnerability curve can reflect the crop yield response to drought in terms of the physical properties of the crop, which is more important for guiding agricultural production [18,19,20,21,22,23]. However, case studies using historical data may be limited if long-term observational data are not available. For this reason, the technology of fuzzy information optimization processing with “information distribution” and “information diffusion” as its core is an emerging data processing technology, which is presented and developed by Huang and Moraga [24]. The object of fuzzy information optimization processing is incomplete information especially fuzzy information with a small sample. Information diffusion can compensate for the deficiency in sample information and can change a traditional data set into a fuzzy set by optimizing the use of the sample [24,25,26]. A small sample of historical data was processed by “information distribution” and “information diffusion” methods to construct the vulnerability curve between hazard and damage in this study.
Drought identification is a prerequisite for drought risk analysis. Based on the nature of water shortages, droughts can be classified into the following four types: meteorological, hydrological, agricultural, and socioeconomic. Meteorological droughts are related to weather especially abnormal precipitation deficits. Agricultural droughts are related to soil moisture deficiencies and poor water resources management while hydrological droughts are associated with abnormal groundwater and lake deficits. In addition, d socio-economic droughts are associated with an insufficient supply to meet the demand of some economic good along with the above three types of drought (i.e., meteorological, hydrological, and agricultural drought) [27,28,29]. Among these types, meteorological droughts occur more frequently and regularly than the other three drought types and normally trigger other types of drought [30,31,32]. Therefore, meteorological drought monitoring is significant for the early warning and risk management of water resources as well as in agricultural production [32]. Most researchers have analyzed meteorological drought risks [33,34,35,36] characterized by meteorological drought indices. Among these indices, the Standardized Precipitation Index (SPI) developed by Mckee et al. [33] is a representative index for drought analysis and has been widely used because of its simplicity. This index is based solely on rainfall and is not affected adversely by topography. Another primary advantage of SPI is its variable time scales [35,36]. However, drought events are multivariate phenomena that involve interactive physical linkages including natural and socioeconomic factors. A few researchers have established the relationship between meteorological droughts and agricultural drought damage, which is more meaningful for actual agricultural production [11,12,14,17,19,20]. Based on the information distribution and diffusion methods, both meteorological factors including precipitation and socio-economic factors, which constitute the agricultural drought damage indices, were considered in this study to analyze drought vulnerability characteristics and improve drought risk assessment in Southwest China (SC).
Following the introduction, the remaining parts of this paper are organized as follows. Section 2 describes the study area, database, and methodologies. Section 3 presents the main results including the vulnerability relationship between the meteorological drought strength (DS) and agricultural drought damage, and the results of the drought risk assessment. Section 4 contains a discussion and analysis of the results in this study. Finally, the primary conclusions are given in Section 5.

2. Study Area, Data, and Methods
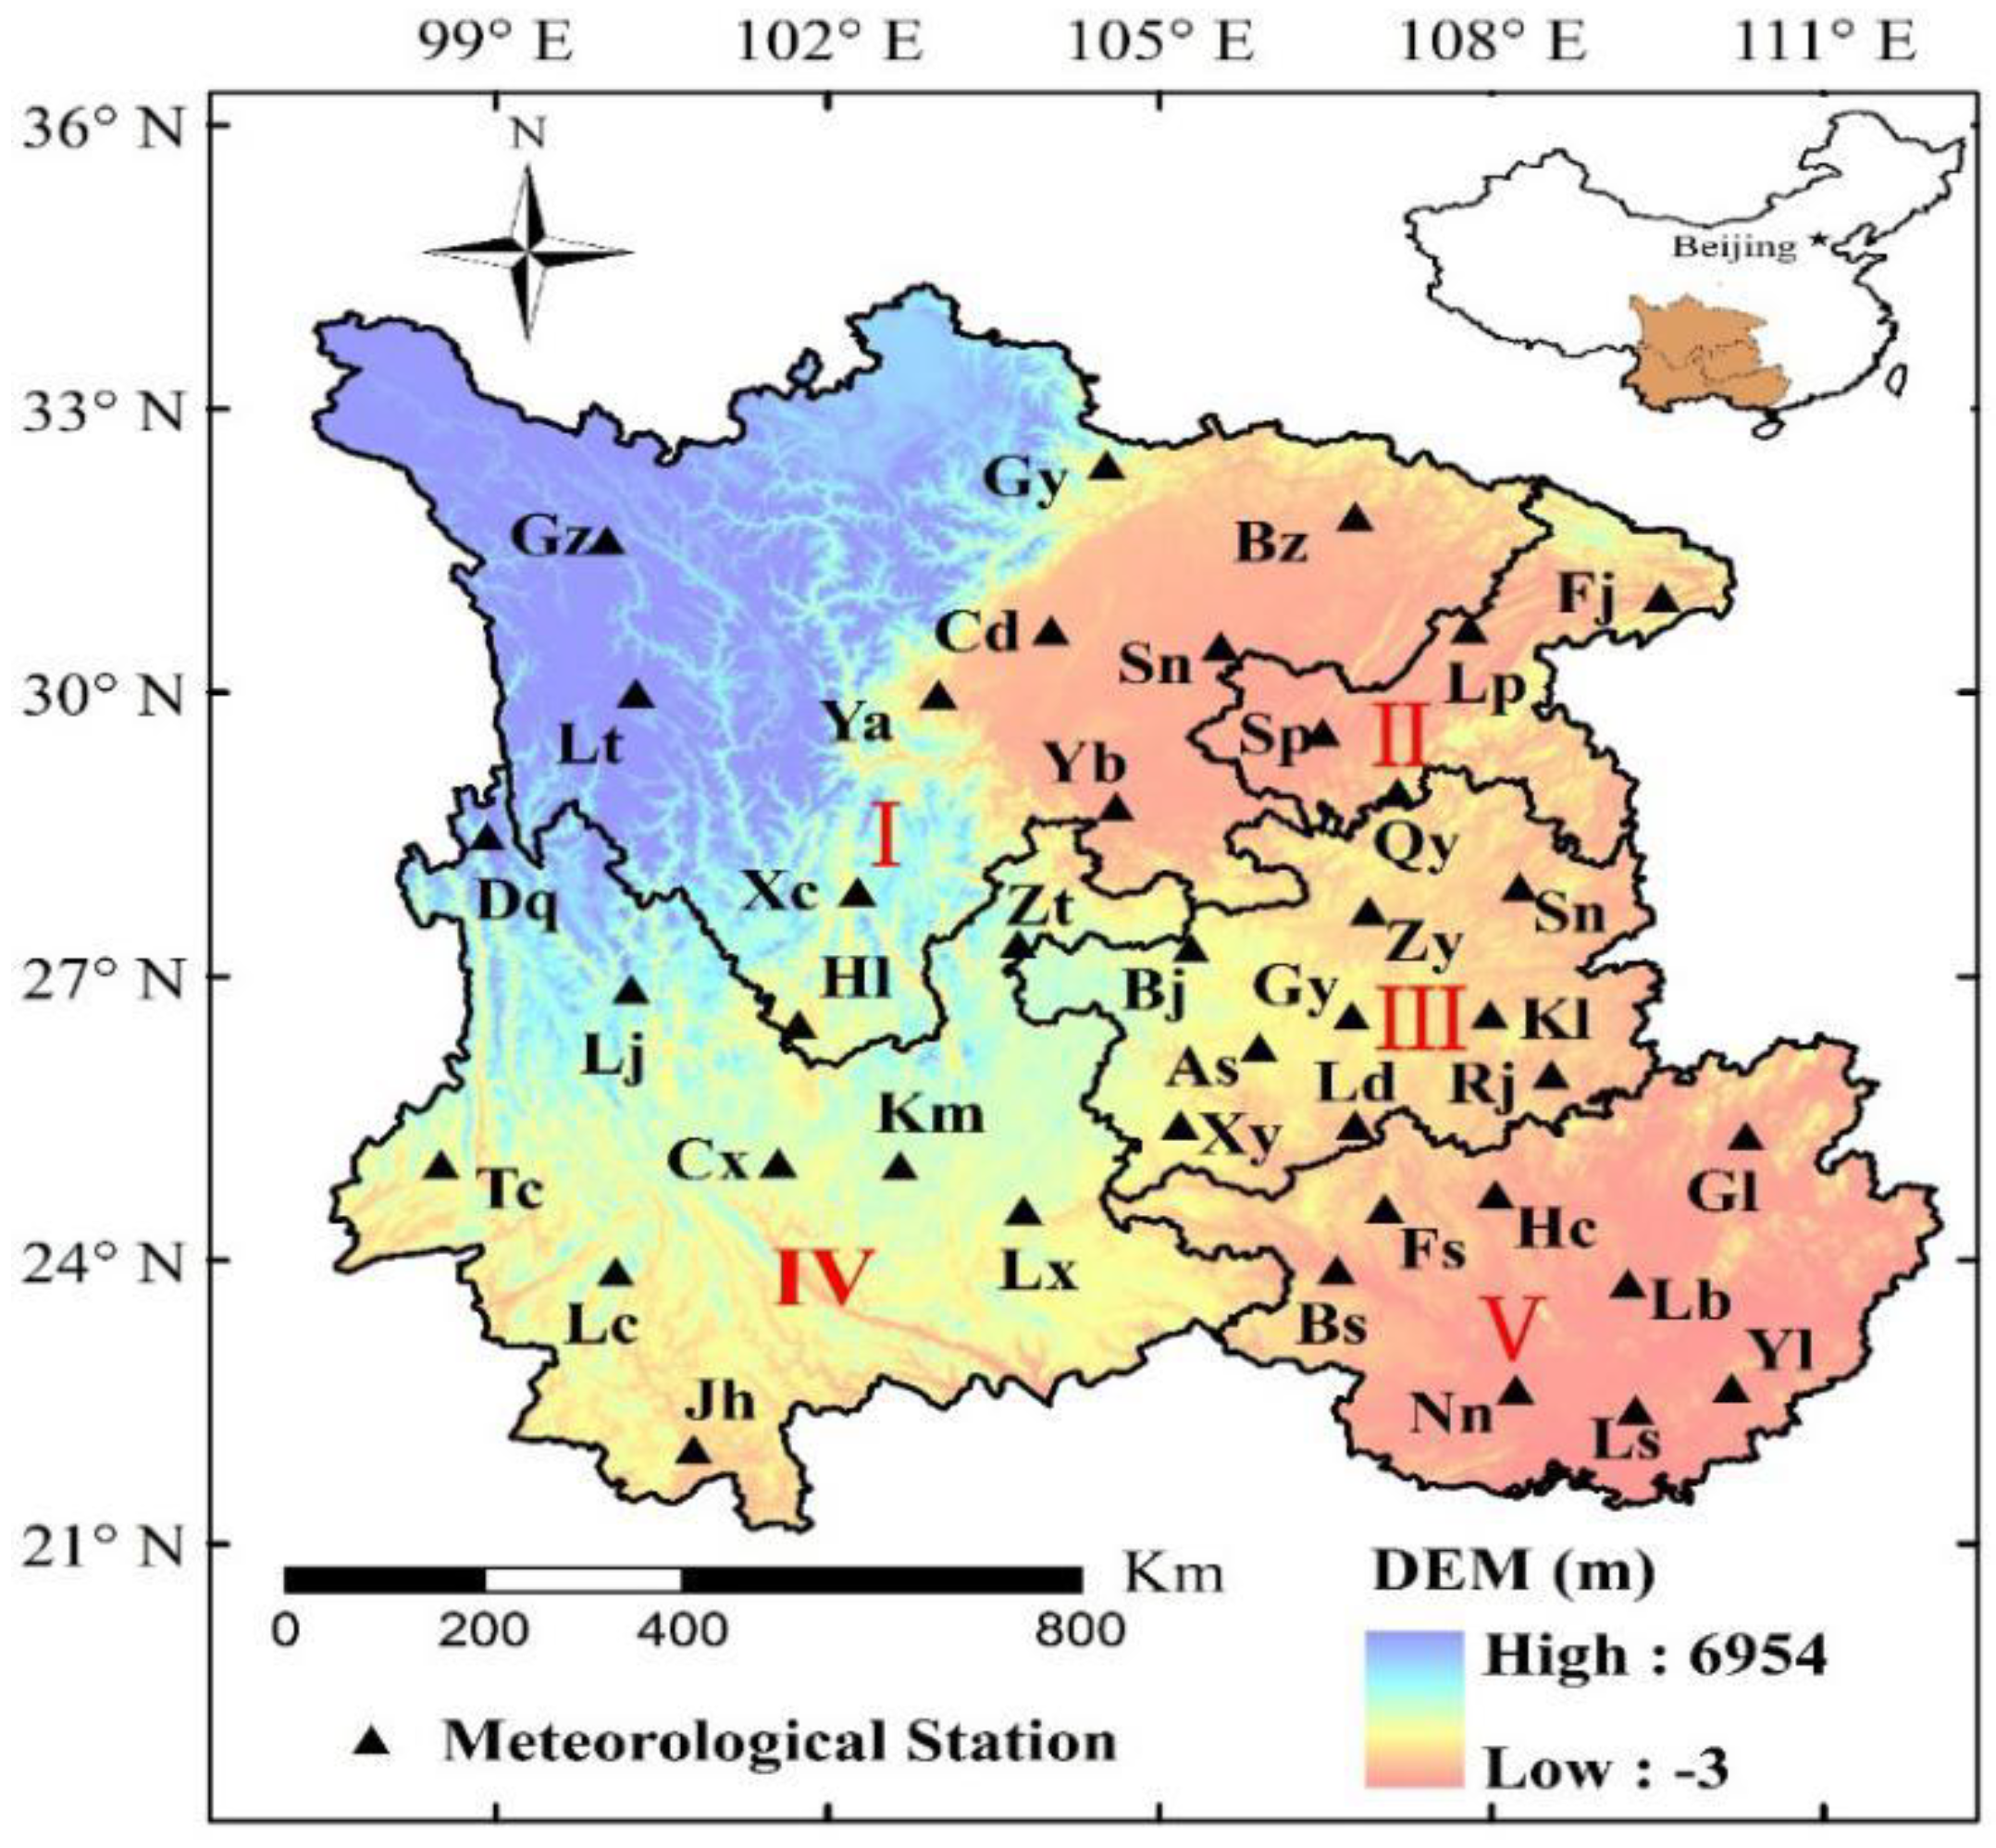
2.1. Study Area

Southwest China (SC), which covers an area of approximately 1.23 million km2 or 12.9% of China’s total area, lies between latitudes 20°54’ N and 34°19’ N and longitudes 91°21’ E and 112°04’ E. SC includes five provinces, which are called Sichuan (I), Chongqing Municipality (II), Guizhou (III), Yunnan (IV), and the Guangxi Zhuang Autonomous Region (V), which is illustrated in Figure 1.
The elevation of SC decreases from the west to the east. The study area is dominated by a humid and semi-humid subtropical monsoon climate with cold, dry winters and hot, humid summers. The annual mean temperature and precipitation from 1961–2015 were 16.7 °C and 965 mm, respectively. The spatiotemporal distribution of precipitation is uneven in the study area. The northwest has the lowest annual precipitation and the southeast has the highest annual precipitation. Most precipitation falls during the monsoon season. Therefore, water resources are sufficient for agricultural use from May to October but inadequate from November to April [37]. The primary soil texture in the study area is clay and loam. The soil layer is very thin. In some areas, its maximum depth is only 10 centimeters, which results in an insufficient water storage capacity. Increased air temperature and decreased relative humidity have affected SC in recent years [38,39,40,41], which indicates an increase in evapotranspiration in the study area and results in decreased soil moisture. Over the past 10 years, drought disasters in SC have occurred frequently and their severity has intensified [42]. For example, from May to September 2006, a severe drought disaster occurred and affected nearly 30 million people. From 2009 to 2011, the precipitation in Yunnan and southern Sichuan continuously decreased [43].

2.2. Data

In this study, meteorological stations were selected according to the following criteria: the time series had to be long enough to obtain statistically significant results in trend analyses and the missing data from one station had to be equal to or less than 0.1%. The stations are sparsely distributed in the western part of the Sichuan Province and there are relatively few agricultural production activities in these regions. Therefore, this factor had little effect on our study [14,15]. We selected 40 representative meteorological stations, as shown in Figure 1 and Table 1. The data used in this study include monthly precipitation at each station, a drought-induced area (referring to the area where the crop yields were reduced by at least 10% due to drought relative to normal yields), a drought-affected area, lost harvest area (referring to the area where the crop yields were reduced by at least 30% and 70%, respectively, relative to normal yields because of drought), and the planting area in each province of Southwest China. The monthly precipitation data for the 40 meteorological stations during the 1960–2015 period were obtained from the China Meteorological Data Sharing Service System (http://cdc.cma.gov.cn/home.do). The drought-induced area, the drought-affected area, the planting area data from 1960 to 2015 (with data missing for 1964–1970), and the lost harvest area data from 1983 to 2015 for each province were acquired from the Chinese Planting Information Network-Natural Disaster Database (http://zzys.agri.gov.cn/zaiqing.aspx). The data for Chongqing are limited because the municipality was separated from Sichuan in 1997 as a municipal city. To ensure the consistency of the data, Chongqing was considered part of Sichuan in this study.

2.3. Methods

2.3.1. Drought Damage Indices

Drought damage (DD) is a possibility under certain drought intensities, which is usually determined by the frequency and intensity of a drought. The first step is to determine an index system that can reasonably evaluate the severity of a drought. Drought damage rates (DDR) including the drought-induced rate (I1), the drought-affected rate (I2), and the lost harvest rate (I3) of crops are used in this study [30,40,44]. The formulas for calculating these indices are below.
I1 = A1/A
I2 = A2/A
I3 = A3/A
where A1, A2, and A3 represents the drought-induced area, the drought-affected area, and the lost harvest area, respectively, and A is the planting area.

2.3.2. Meteorological Drought Indices

The SPI, which describes the change in precipitation by the gamma probability density function, can reflect a drought situation at different time scales and in different areas. The SPI has been widely used to characterize drought. The detailed calculation process for the SPI was described by Lloyd-Hughes and Saunders [45]. Generally, there are six timescales including SPI1, SPI3, SPI6, SPI9, SPI12, and SPI24 (1-month, 3-month, 6-month, 9-month, 12-month, and 24-month accumulation periods). However, the time scales most closely correspond with the DD in SC and its provinces are not clear. Therefore, the SPI at all six timescales were taken into consideration to choose the appropriate time scale and analyze drought vulnerability characteristics and risk. The DDR were taken for each province as a unit and the SPI for each province was calculated below.
X = i = 1 n x i / n
where X is the average of SPI for each province, xi is the annual SPI value calculated at different time scales, and n is the number of stations in each province.
The definition of DS can be obtained using Equation (5) below.
F = i = 1 D X i
where F = {f1, f2,……, fn} is the DS and D is the drought duration (DU), which is the number of months SPI values are lower than the drought threshold S. Xi is the SPI value that is lower than S. The range of the drought threshold S is shown in Table 2. However, S usually considers only the meteorological factor and ignores DD when defining drought levels. Therefore, the S has been redefined in this study. The correlation between the DS/DU and I1, I2, and I3 is calculated separately when S = [−2.0, −1.9, −1.8, ……, −0.1,0] and S will be the drought disaster threshold when the correlation coefficient at its maximum [46,47].

2.3.3. Information Distribution and Diffusion Methods

Fuzzy mathematics is a mathematical method used to study unclear phenomena. The information distribution method using the fuzzy transition information can improve the accuracy of the results when compared to a traditional histogram-based method. Information diffusion is a set-valued fuzzy mathematical processing method that can change single-valued samples into set-valued samples. The purpose of information diffusion is to identify the maximum amount of useful information needed to improve the accuracy of risk recognition when the sample information is insufficient [24,25,44,48].

Information Distribution Method

Let F = {f1, f2, fi, …, fn} be a sample where fi is a sample point. The appropriate interval length ∆ is selected according to the maximum and minimum F and is used to generate the monitoring point space U = {u1, u2, uj, …, um},(uj+1uj = ∆), which corresponds to F where uj is called a monitoring point. In f i F , u j U , we distribute the information carried by fi to uj using the information distribution shown in Equations (6)–(8) in order to obtain qij.
m = 1.87 × ( n 1 ) 2 / 5
Δ = ( f max f min ) / m
q i j = { 1 | f i u j | Δ | f i u j | Δ , i = 1 , 2 , , n ; j = 1 , 2 , , m 0 o t h e r s
where n is the sample number. We obtain the distribution of U as determined by fi.
Let
Q j = i = 1 n q i j
All distribution information Qj can be obtained from the monitoring point uj, which is called the primary information distribution of F on U.
p j = Q j n
Therefore, we can employ Equation (10) to estimate the probability of a drought disaster in magnitude uj.
P = { p ( u 1 ) , p ( u 2 ) , p ( u 3 ) , , p ( u m ) } = { p 1 , p 2 , p 3 , , p m }
In the two-dimensional normal information diffusion method, assuming that W is the data set of the meteorological drought index f and socio-economic drought index y, the causal relationship is shown in Equation (12).
W = { ( f 1 , y 1 ) , ( f 2 , y 2 ) , , ( f n , y n ) }
The appropriate interval lengths ∆f and ∆y are selected according to the requirement for generating the input and output monitoring space, respectively.
T = { t 1 , t 2 , , t m }
V = { v 1 , v 2 , , v t }
With ( f i , y i ) W , t j T , v k V , we diffuse the information carried by W to (tj, vk) to obtain μijk by using the two-dimensional normal information diffusion, which is shown in Equation (15) below.
μ i j k = 1 2 π h f h y exp ( ( f i t j ) 2 2 h f 2 ( y i v k ) 2 2 h y 2 )
where h is called the normal diffusion coefficient, which is calculated by Equation (16).
h = { 0.8416 ( b a ) m = 5 0.5690 ( b a ) m = 6 0.4560 ( b a ) m = 7 0.3860 ( b a ) m = 8 0.3662 ( b a ) m = 9 0.2986 ( b a ) m = 10 2.6851 ( b a ) / ( n 1 ) m 11
where b = max { f i } 1 i n , a = min 1 i n { f i } when calculating the coefficient hf; while b = max { y i } i i n , and a = min { y i } i i n when hy is calculated.
Let
Q j k = i = 1 n μ i j k
The original information matrix Q can be calculated using Equations (15)–(17).
Q = { Q 11 Q 1 t Q m 1 Q m t }
The columns in Q are normalized to generate a fuzzy relation R whose physical significance represents the fuzzy relation between the meteorological drought index f and the socioeconomic drought index y. The fuzzy information matrix R is the risk model constructed in this paper.
{ s k = max 1 j m Q j k r j k = Q j k / s k R = { r j k } m × t
A dependent variable can be obtained according to the independent variable input. Therefore, the fuzzy set μf0(tj) can be obtained by inputting f0 into Equation (20) below.
μ f 0 ( t j ) = { 1 | f 0 t j | / Δ f | f 0 t j | Δ f 0 o t h e r s
The output fuzzy set μy0(vk) can be obtained by multiplying the fuzzy set μf0(tj) and the fuzzy matrix R.
μ y 0 ( v k ) = 1 j m μ f 0 ( t j ) × r j k k = 1 , 2 , , t
A specific value y0 can be obtained by substituting fuzzy set μy0(vk) into Equation (22) below.
y 0 = 1 k t μ y 0 ( v k ) × v k 1 k t μ y 0 ( v k )
A fuzzy matrix can be constructed to reflect the causal relationship between f and y using the two-dimensional diffusion method. The corresponding dependent variable can be obtained if we substitute different independent variables so that the causal relationship between the small samples becomes somewhat more accurate during the analyses of insufficient samples. The detailed calculation procedures were given in Appendix A.

2.3.4. Vulnerability and Risk Evaluation

When conducting a risk assessment, a common basic pattern is as follows: R = HD [11,13,14], where R is the risk, H is the function that describes the risk source, D is the vulnerability function that describes the risk-bearing bodies (referring to crop in this study), and ‘•’ is a synthesis rule. When the analyzed risk is expressed as the expected value of the damage, the index system is described by the ‘damage’ D, and the “probability” H. The ‘•’ indicates multiplication. The simplest solution is to calculate the area surrounded by the probability density curve, the disaster damage curve, and abscissa axis, which is shown in Figure 2.
The area can be calculated using Equation (23) below.
R = p ( x ) f ( x ) d x
where P(x) is the probability density function of the hazard factor and f(x) is the disaster damage function. When its probability distribution is discrete, R can be expressed by the equation below.
R = i = 1 n p ( u i ) f ( u i )

3. Results

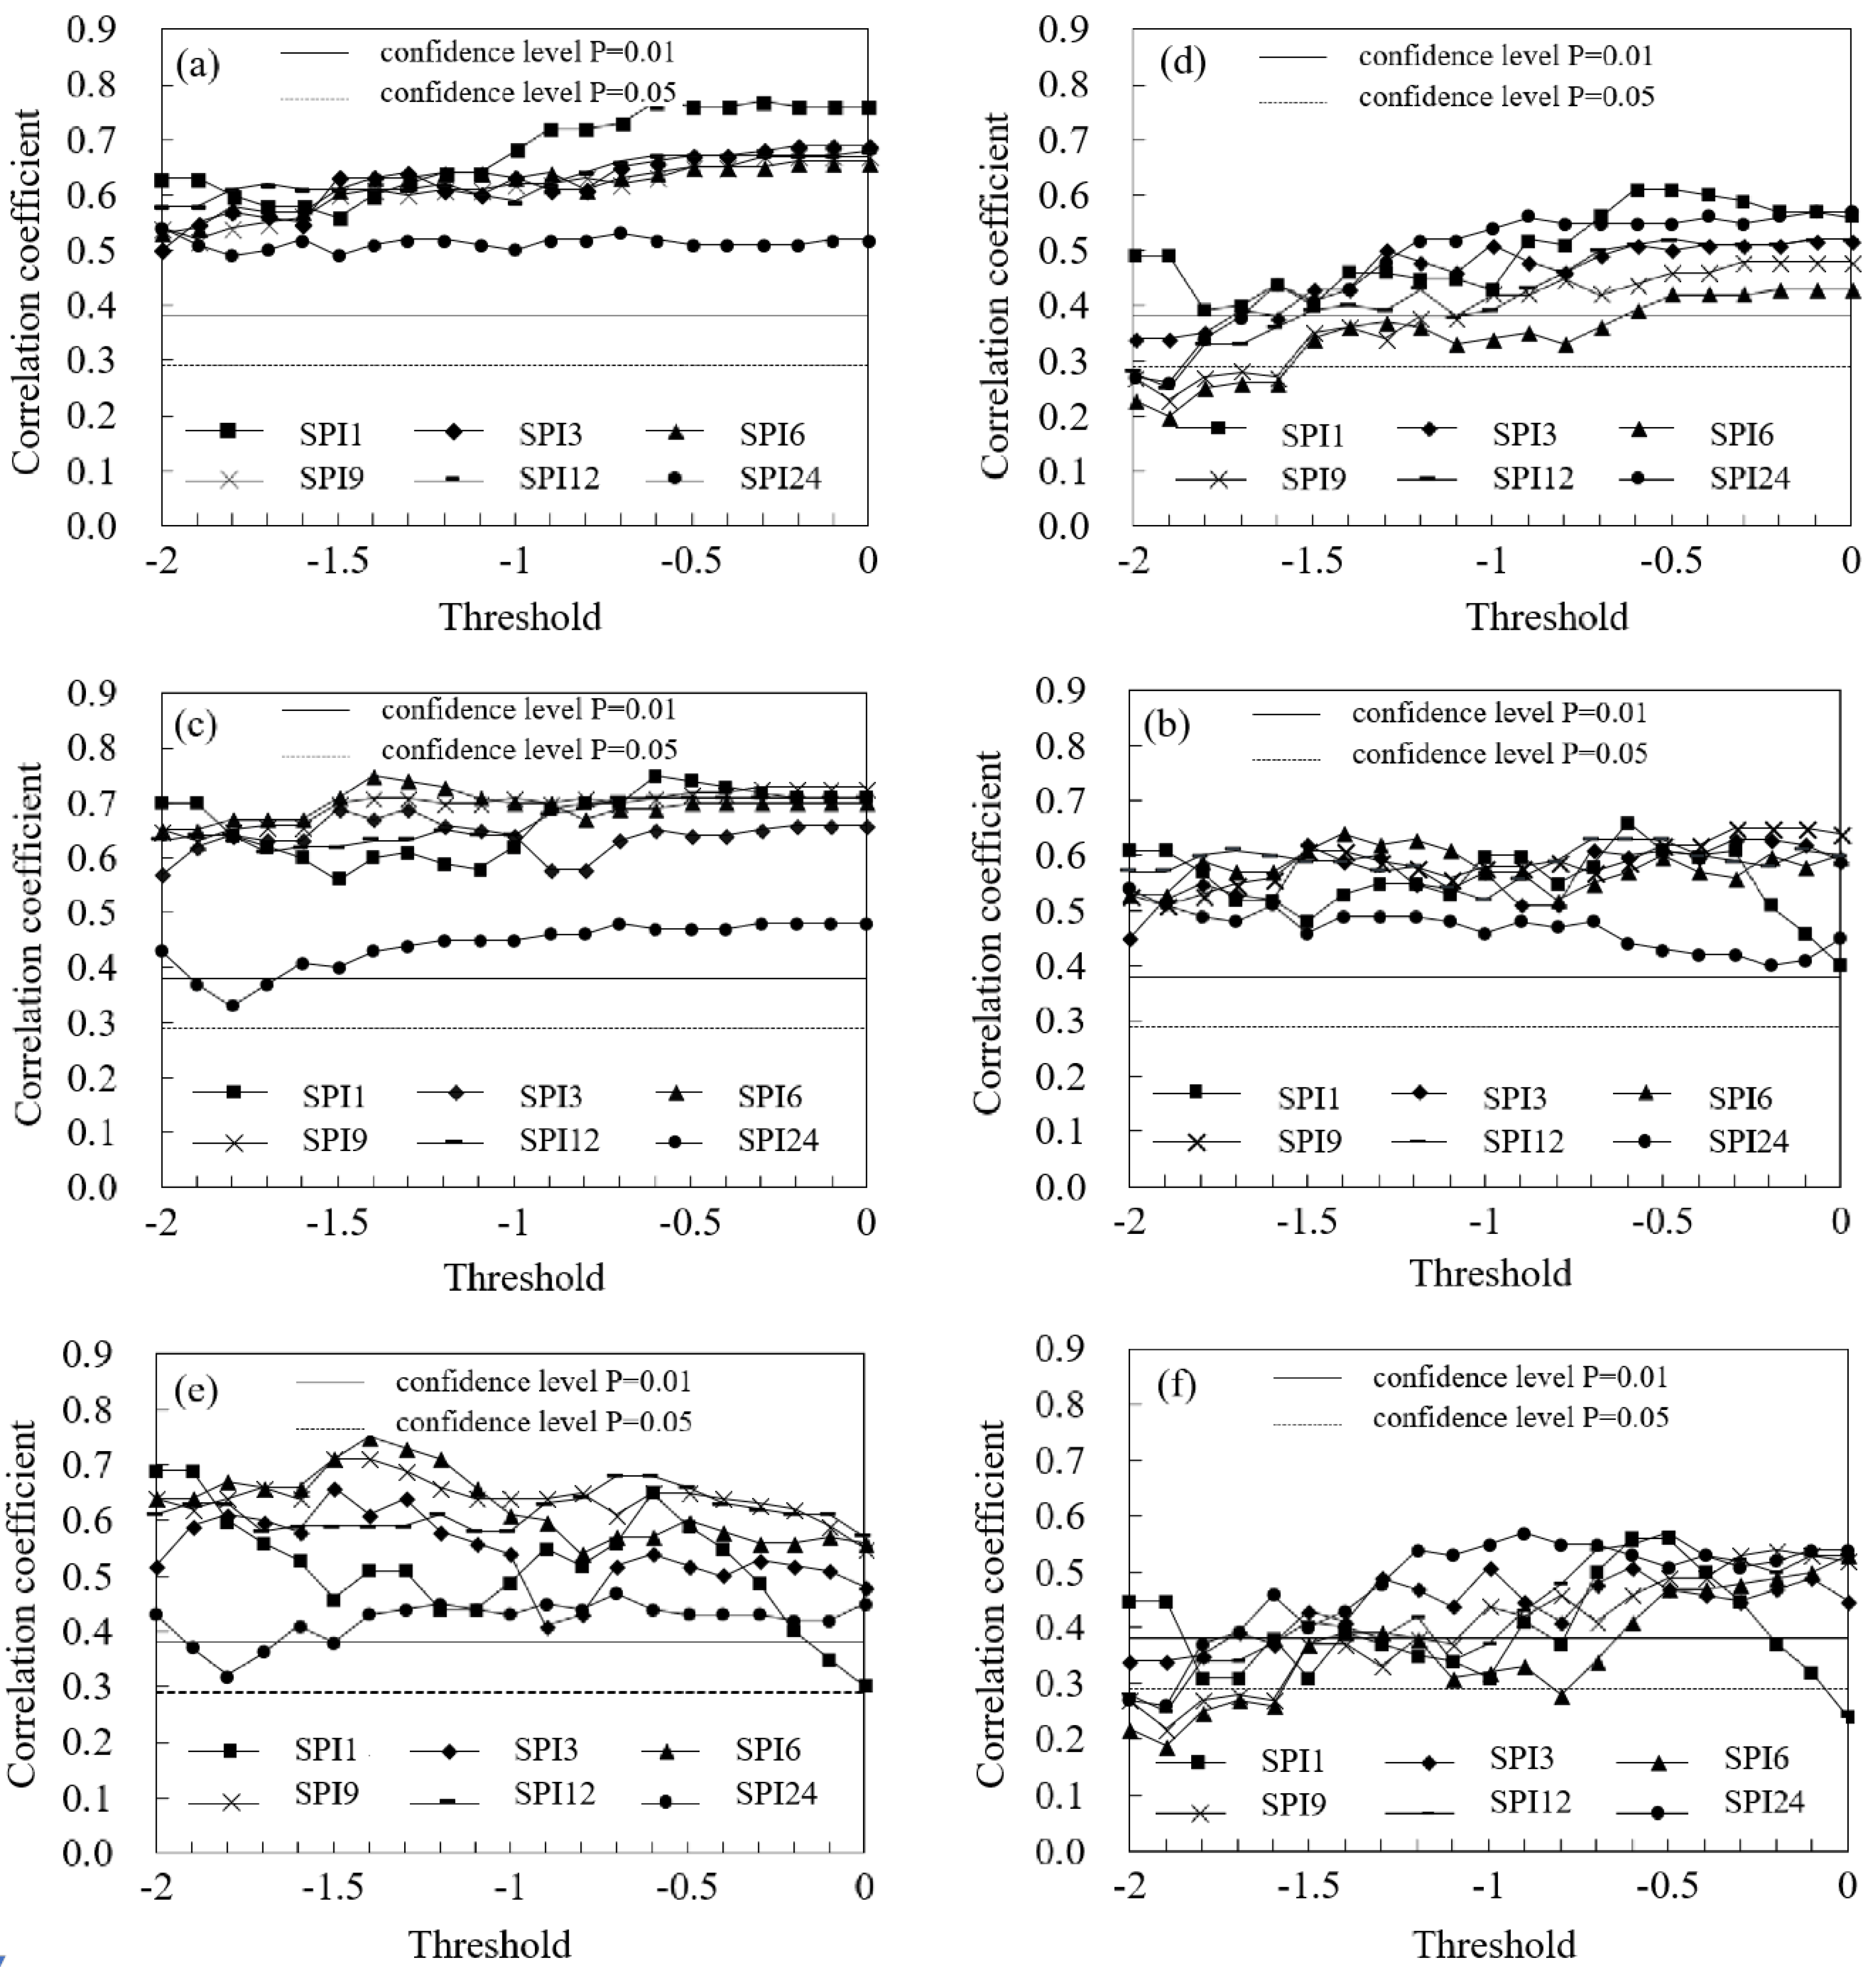
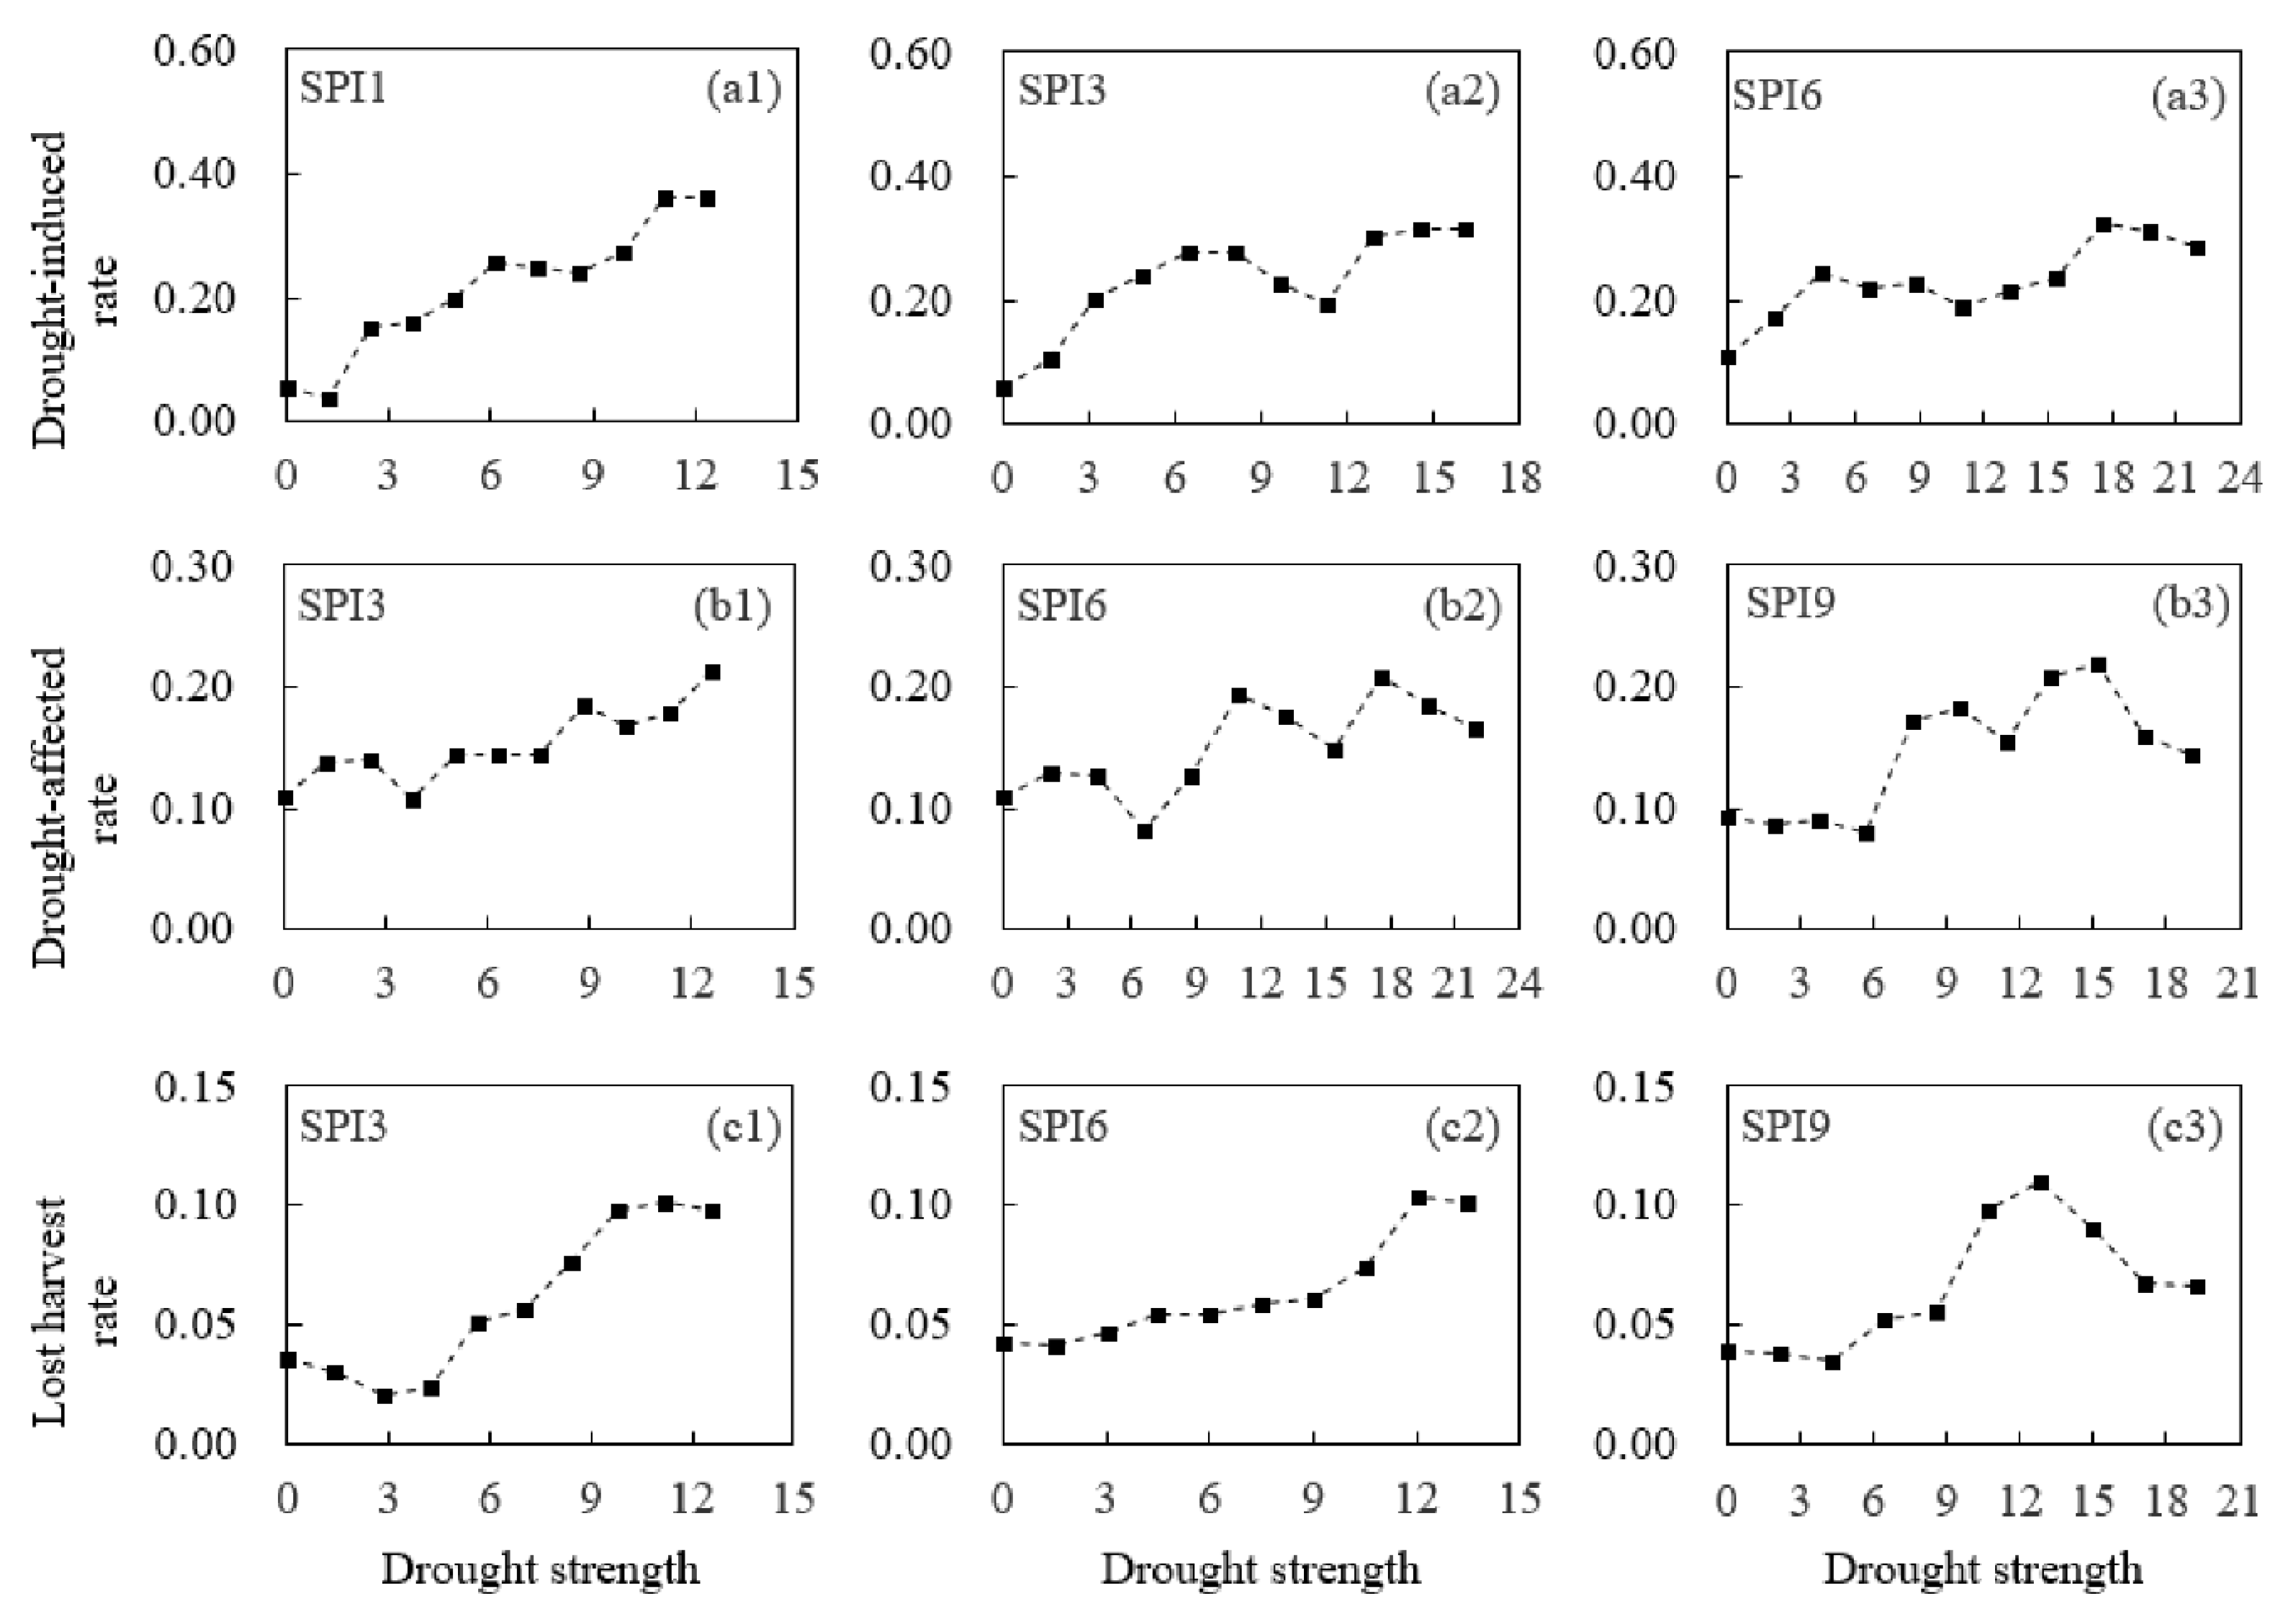
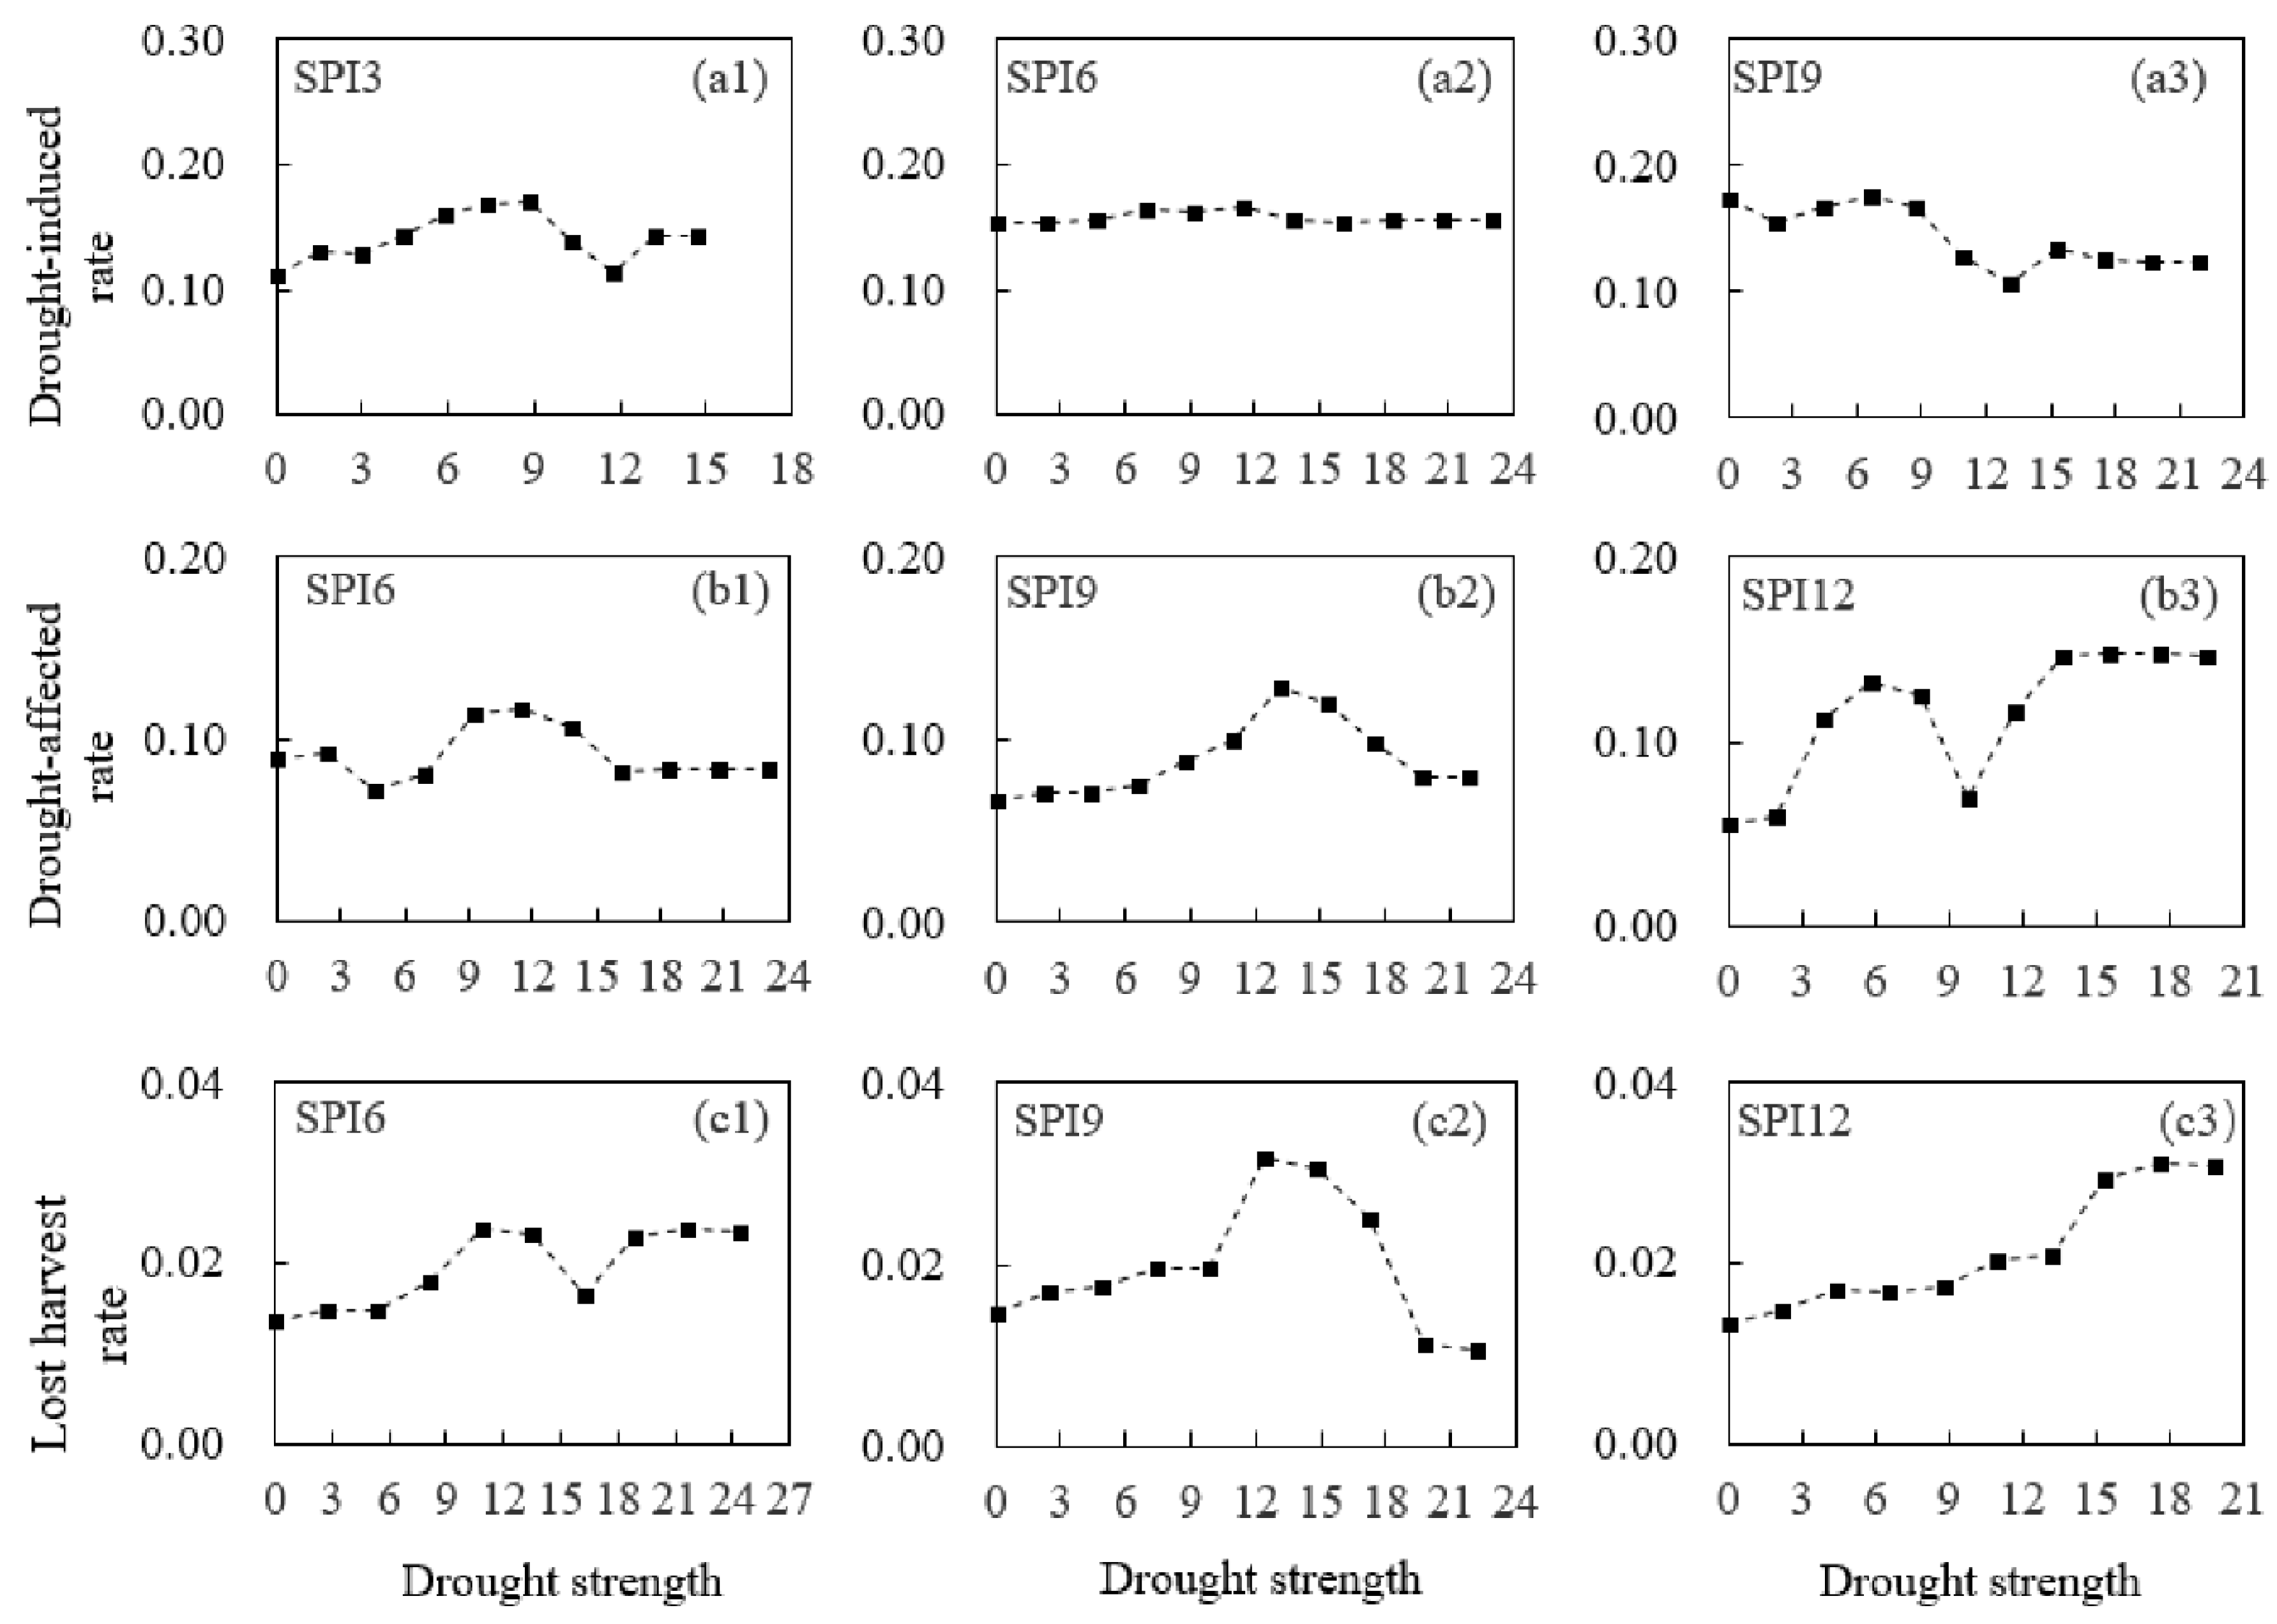
3.1. Correlation Analysis between Drought Strength and Drought Damage Rates

The correlations between DS/DU and I1, I2, and I3 in the Guangxi Province are shown as an example in Figure 3. The correlation coefficients between DU and I1, I2, and I3 show high fluctuation while the correlation coefficients between DS and I1, I2, and I3 have a lower fluctuation. The correlation coefficients between DS and I1, I2, and I3 are higher than those between DU and I1, I2, and I3. This difference is due to DS being the cumulative value of the SPI, which is lower than the threshold value S. This is shown in Equation (2), which can also reflect DU to a certain extent. Therefore, DS is more suitable than DU as an index of meteorological drought.
The drought rank threshold defined by SPI in Table 2 considers only precipitation. However, DD was affected by other factors in addition to meteorological factors. In considering meteorological factors and socio-economic factors, the drought-caused threshold is redefined according to the correlation between DS and DDR, which is different from the traditional definition method. To ensure the stability and reliability of the drought vulnerability characteristics with respect to risk, three timescales of SPI and the thresholds corresponding to the maximum correlation between DS and DDR were selected in this study.
The thresholds and SPI for SC and its provinces are shown in Table 3. Taking Guangxi as an example, SPI1, SPI3, and SPI6 were selected when analyzing drought characteristics and risk when crops were under drought-induced, drought-affected, and lost harvest conditions, respectively. The threshold for when crops are under drought-induced conditions, defined with a value of SPI1, is –0.4 in Guangxi. The threshold for when crops are under drought-affected conditions, which is defined with a value of SPI3, is –1.4. In addition, the threshold when crops are in the lost-harvest condition, which is defined with a value of SPI6, is –1.4. Generally, the smaller the SPI value is, the greater the probability of a severe drought, but the results shown in Table 3 are not completely consistent with previous conclusions. The major reason for this inconsistency is that DS is the cumulative value of SPI, which is less than the threshold S. DS is related not only to the value of SPI but also with the number of SPI values below S. However, the most suitable time scale and threshold do show differences due to regional differences, drought types, crop species, and management needs.

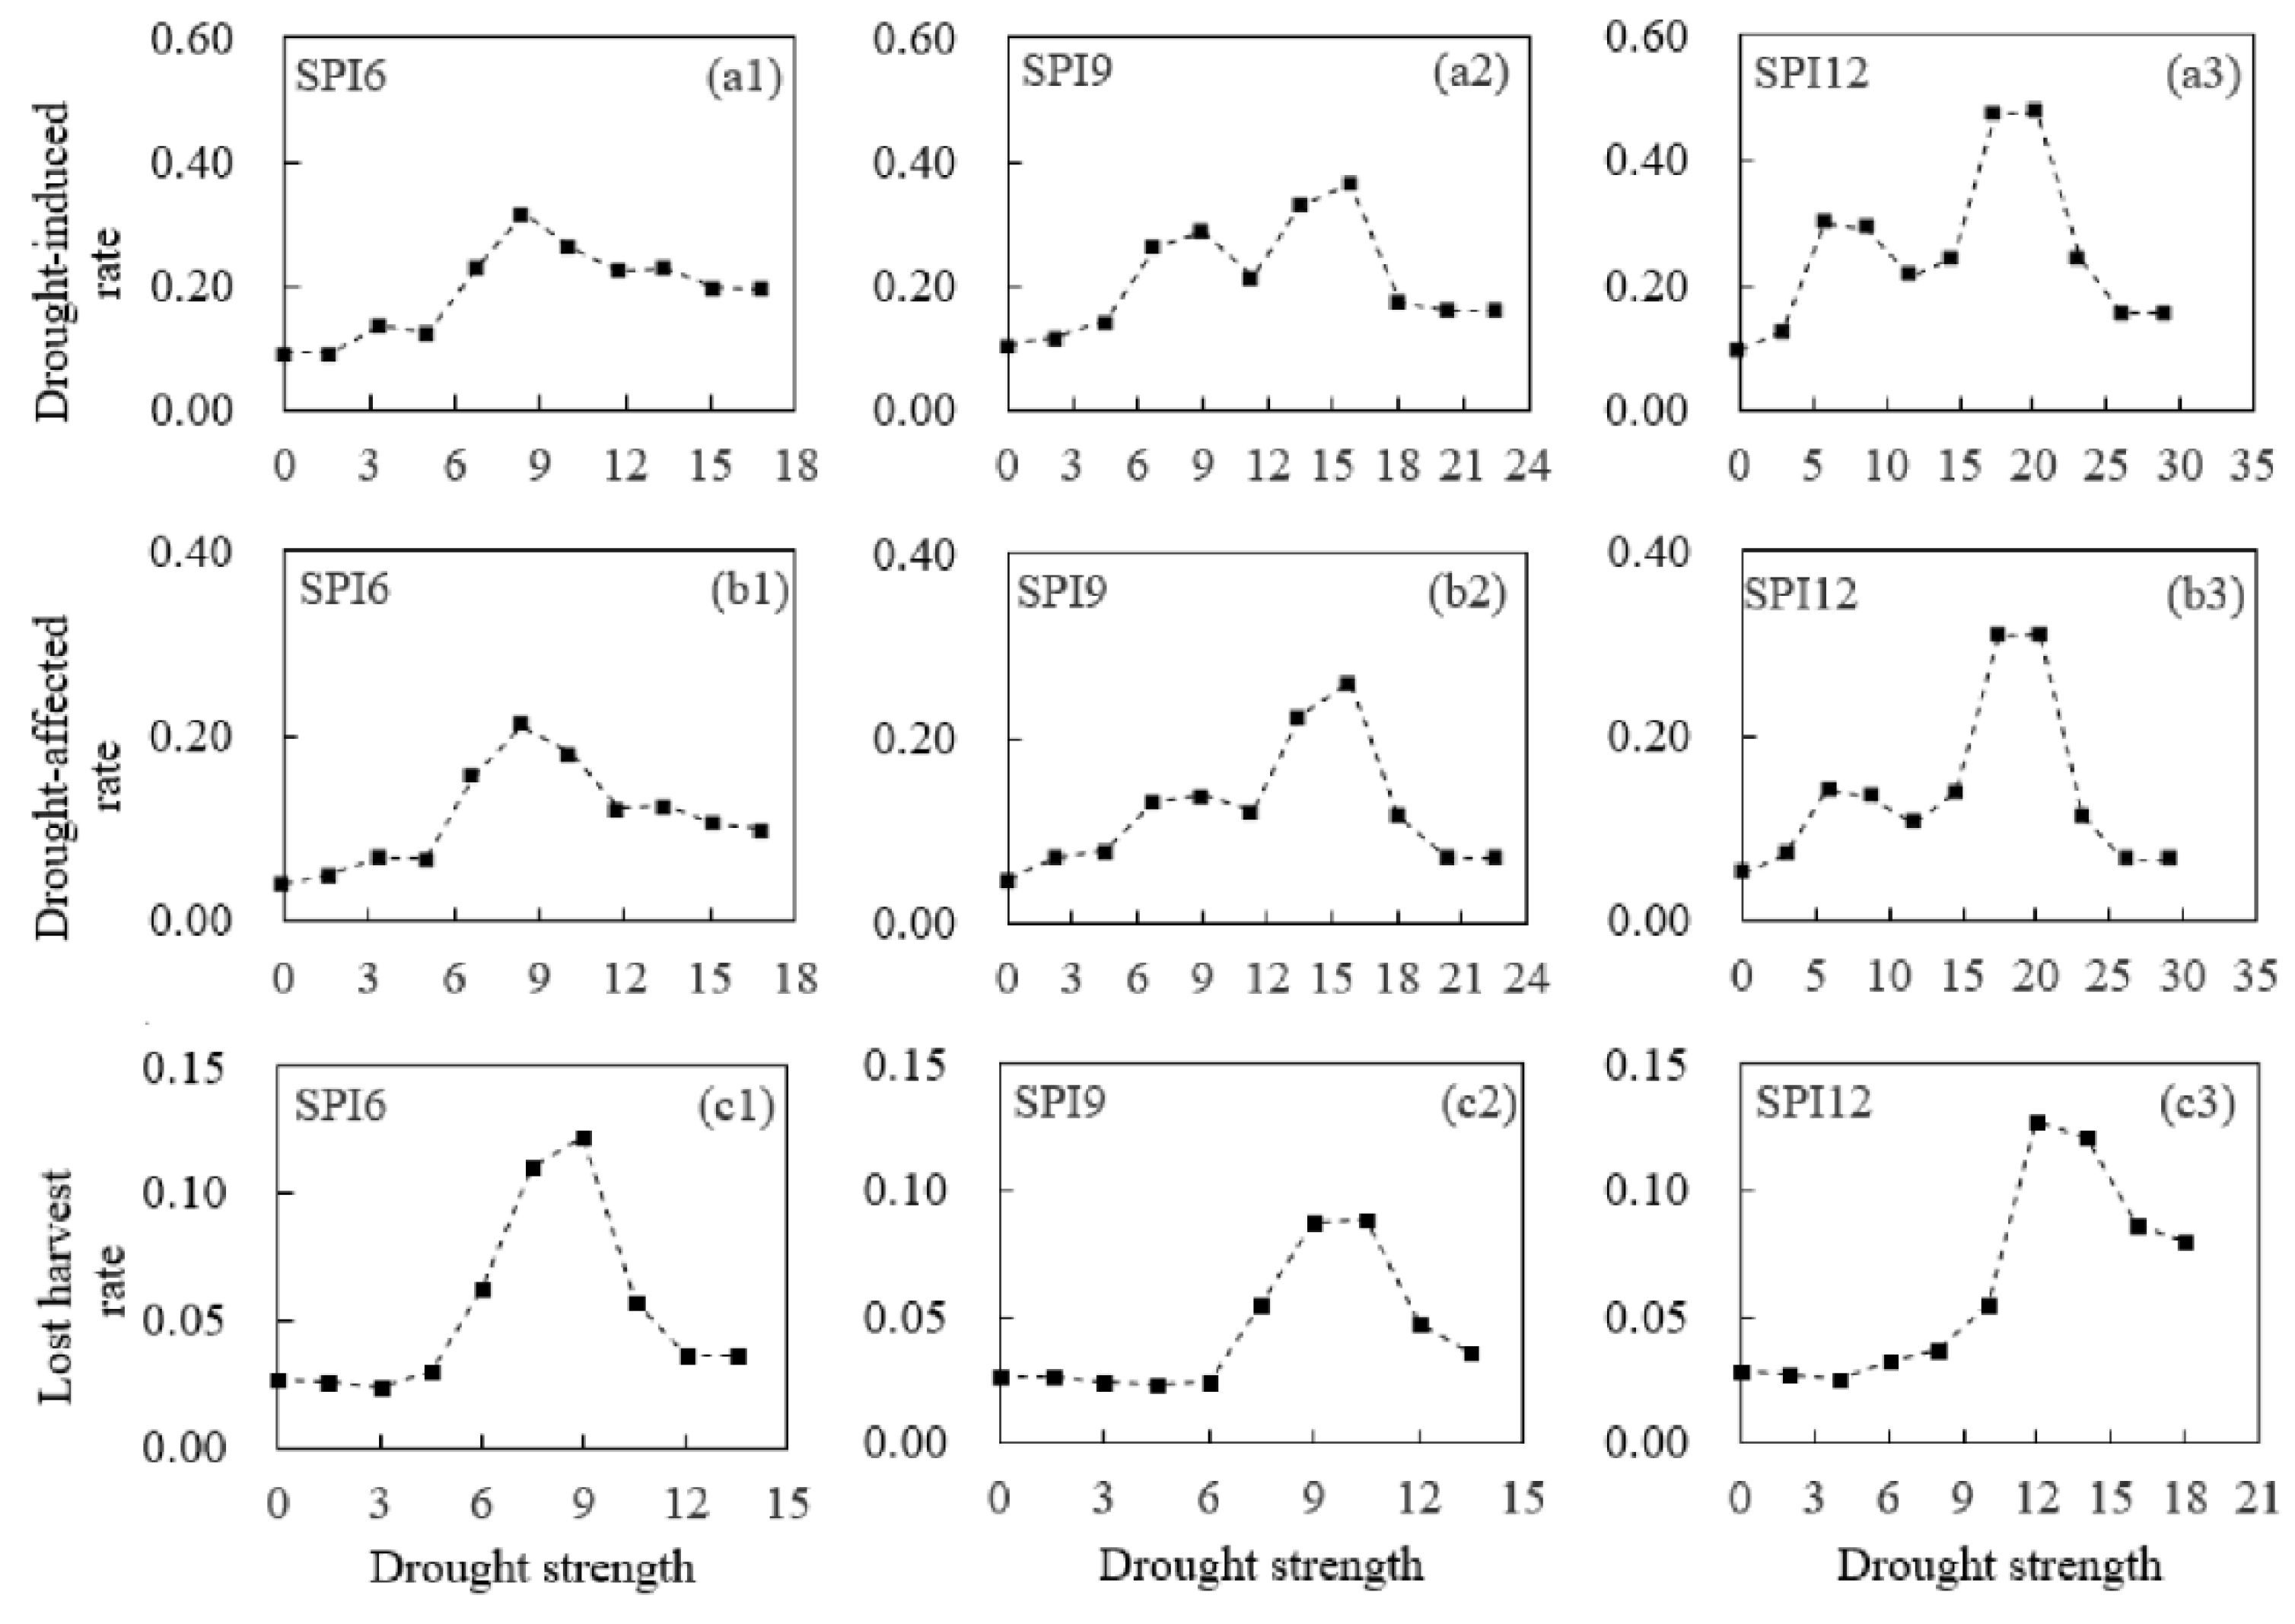
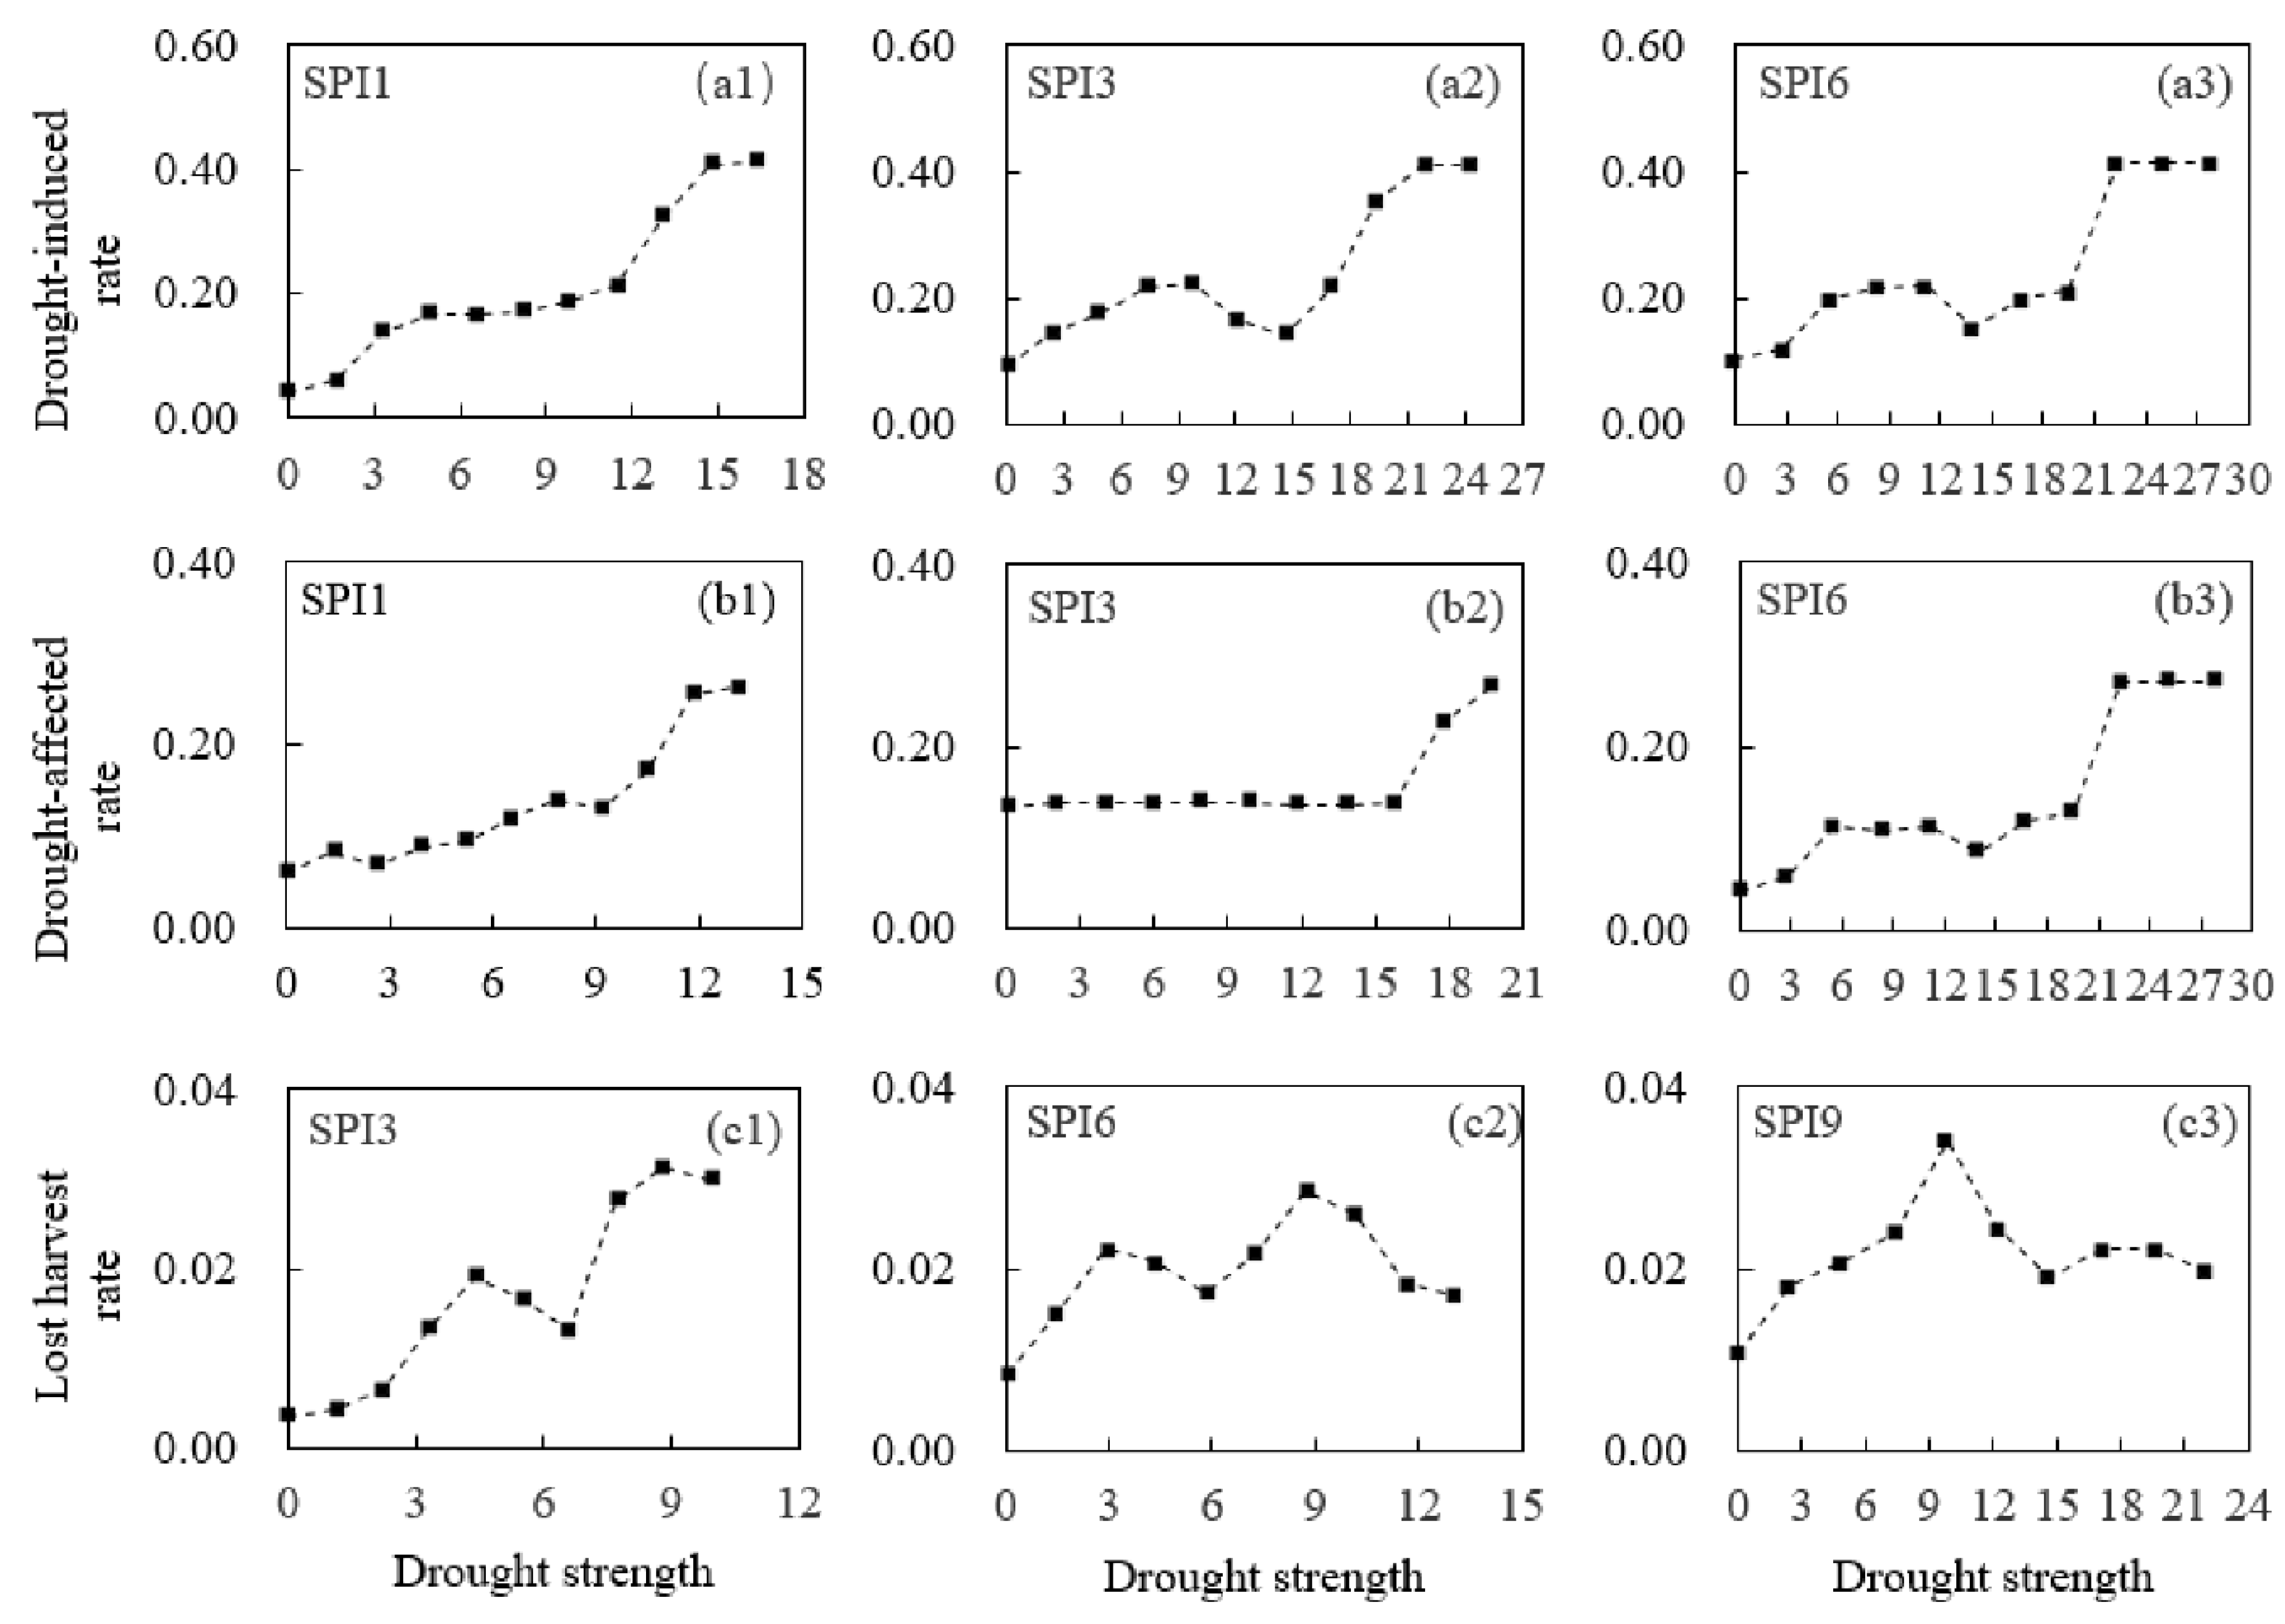
3.2. The Vulnerability Relationship between Drought Strength and Drought Damage in Southwest China and Its Provinces

In this study, we employed the information distribution and diffusion method to analyze the vulnerability relationship between DS and DD. Taking Sichuan Province as an example (Figure 4), SPI3 was chosen to construct the vulnerability relationship between DS and DDR and the S1 was 0.1 (see Table 3). The annual DS was calculated using Equation (2) as follows: F = (f1, f2, …, f48) = (4.57, 5.23, …, 4.10). The number of the asymptotic optimization interval m was 9, which is calculated according to Equation (6). The interval length ∆ obtained using Equations (6) and (7) was 1.506. The I1 values in the Sichuan Province were ranked from low to high and the two control points were added at their respective ends to blur the histogram boundary. The starting point of the soft construct histogram was 0, the interval was 1.506, and the end point was 15.06. Therefore, we obtained 11 DS control points {u1, u2, u3, …, u11}. The frequency of the DS control points can be obtained according to Equations (9)–(11). The frequency is approximately considered as a probability in certain cases where P = {p(u1), p(u2), p(u3), …, p(u11)} = {0.031, 0.119, 0.241, …, 0.006}. Theoretically, the greater the number of monitoring points in information diffusion, the better the effect. However, the results exhibit little differences between 50, 60, 80, and 100. The more monitoring intervals, the greater the computational complexity. Therefore, we selected 50 monitoring intervals, i.e., 51 monitoring points. The information matrix Q, which reflects the causal relationship between DS and DDR, was obtained according to Equations (15)–(18). The normalized information matrix R was obtained by normalizing Q according to Equation (19). The corresponding output values {y1, y2, …, y11} were obtained by substituting the input values {u1, u2, u3, …, u11} and the 11 points were connected to a poly line, which can reflect the vulnerability relationship between DS and DDR. The result is shown in Figure 4a. The vulnerability relationships between DS and DDR in Sichuan, Guangxi, Guizhou, Yunnan, and SC are shown in Figure 4, Figure 5, Figure 6, Figure 7 and Figure 8.
In Figure 4, the abscissa indicates DS and the ordinate indicates DDR. The relationship between DS and DDR should be analyzed using a nonlinear method rather than a simple linear regression method because of the diversity of the disaster-caused factors and risk-bearing bodies. DDR increases with an increase in the DS in the Sichuan Province and there is a local fluctuation. As the DS continues to increase, DDR no longer increases significantly and even decreases. These results were consistent with those of a previous study. Yang et al. [43] found that the drought damage no longer increased significantly. Yet, the greatest increase in severe drought was observed in Southwestern China. He et al. [44] note that, although wheat productivity has increased, droughts are expected to become more severe under climate change in SC. This increase may be due to people storing water through an agricultural water conservancy project that uses precipitation forecasts to prevent the occurrence of agricultural drought or adopting drought-resistance measures. However, apparent differences in drought vulnerability characteristics between provinces may be due to water shortages, difficulty in accessing available irrigation, and other factors. I1 increased significantly in Guangxi DS (Figure 5) and Guizhou (Figure 6) while no significant increase was observed in Sichuan (Figure 4). I1 was approximately 0.2 even when the DS was small in Sichuan. However, DDR was low when DS was high in other provinces, which indicates that the ability in Sichuan to resist severe droughts is strong while the ability to resist a minor drought is weak. I2 in Sichuan and Guangxi was stable when DS was small. It increased rapidly with increasing DS and stabilized when the DS reached a certain value. I2 increased gradually when DS increased in Guizhou and Yunnan and decreased rapidly after the DS reached a certain value in Yunnan (Figure 7). I3 values in Guizhou and Yunnan were the highest among the provinces, which indicates that the agricultural production system is frail under severe drought in these two provinces. Improved water and crop management, the augmentation of the water supply with additional sources, intensified watershed and local planning, and water conservation are necessary for drought impact mitigation in the two provinces. However, DDR in Yunnan decreased rapidly when compared to Guizhou, which may indicate a clear effect (the decreased DDR) that measures are taken to resist the spread of the drought. The results show that the relationship between the DS and the DDR is nonlinear in SC and its provinces. DS can be calculated based on the predicted meteorological data, the specific DDR can be obtained by substituting the DS into the information matrix R, and the output can then be predicted.
Figure 4, Figure 5, Figure 6, Figure 7 and Figure 8 show that the vulnerability characteristics of the same DDR at different time scales have only slight differences, which indicates that the vulnerability results calculated in this study are stable.

3.3. Drought Damage Risk Evaluation

R = i = 1 11 P ( u i ) F ( u i )
where P(ui) is the probability of DS, which has been obtained with Equation (11) and F(ui) is the vulnerability relationship between DS and the DDR. The results of the DD risk evaluation based on different time scales in SC and its provinces are shown in Table 4.
The average drought damage risk values R ˜ 1 , R ˜ 2 , and R ˜ 3 can be obtained by averaging the drought damage risk evaluations based on different time scales in Southwest China and its provinces. The results are shown in Table 5.
R1, R2, and R3 represent the risk values when the crop yields are reduced by more than 10%, 30%, and 70%, respectively, i.e., the possibility that the crop is under drought-induced conditions, drought-affected conditions, or lost harvest conditions, respectively. The risk value obtained based on the different time scales of SPI are nearly identical, which indicates that the results are stable. The R ˜ 1 in Sichuan and Guizhou are 19.67% and 19.11%, respectively, which is higher than those in Yunnan and Guangxi where the values are 16.76% and 15.43%, respectively. The R ˜ 2 in Sichuan has the maximum value of 12.80% while the values in Guizhou, Guangxi, and Yunnan are 11.74%, 10.04%, and 9.17%, respectively. The maximum probability of crops under lost harvest conditions is 4.36% in Guizhou, followed by Yunnan at 3.31%, Sichuan at 2.04%, and Guangxi at 1.60%. The R ˜ 1 , R ˜ 2 , and R ˜ 3 in SC were 16.14%, 10.69%, and 2.70%, respectively.
Table 5 shows that the R ˜ 1 and R ˜ 2 in Sichuan and Guizhou are similar while the R ˜ 3 in Guizhou is distinctly higher than that in Sichuan. The reason for this finding can be seen in Figure 4 and Figure 7, which shows that the drought-resistance ability of Sichuan is stronger than that of Guizhou. DD does not increase continually with an increase in DS and does stop when I3 is approximately 0.05 while DD increases with an increase in DS until I3 is approximately 0.10 in the Guizhou Province.

4. Discussion

When forecasting droughts and its effects, the time scales should be fully considered [49,50]. The most suitable time scale for monitoring drought may vary due to regional differences, drought types, differences in the regional cropping system, and major food crop phenology [49,51]. The SPI at short time scales (3-month, 6-month, and 9-month) are closely related to agricultural production because they indicate the water content of the vegetation and the soil moisture conditions. The SPI at longer time scales (24-month and 36-month) can better reflect the reservoir storage capacity and groundwater level, which is considered a hydrological drought index [52]. However, the SPI computed over long time scales may not be an adequate indicator of agricultural drought conditions [53,54]. Higher correlations between DD and DS calculated at shorter time scales for SPI were obtained in this study. Therefore, shorter time scales of SPI were used for defining droughts.
A major outcome of this study is the construction of vulnerability relationships between the DS and DD. The relationship between DS and DD was found to be nonlinear. If regional precipitation can be predicted accurately, then regional food production can be estimated by combining the vulnerability curve, which will be more accurately compared to the assumptions of linearity. Furthermore, the regional agricultural production efficiency can be maximized by adjusting the distribution of irrigation water resources according to regional vulnerability characteristics, which will be beneficial to a number of stakeholders such as disaster management, agricultural organizations, and development/planning authorities. This will improve their understanding on the impact of droughts.
Drought risk assessment is of great significance for the prevention of disasters and the reconstruction of disasters. The drought risk assessed in this study is lower than that of previous studies [55,56,57]. Human factors (including irrigation, artificial rainfall, and other agricultural activities) that may prevent the spread of drought were considered when analyzing the DD risk. This result differed from previous research, which primarily considered meteorological data for risk assessments in SC. In this study, the R ˜ 1 and R ˜ 2 in Sichuan and Guizhou were slightly higher than those in Yunnan and Guangxi. This is due to Sichuan and Guizhou being located in Northern SC where the annual average rainfall is less than that in Southern SC, according to the Compilation Committee of the Climatological Atlas of the People’s Republic of China [3]. R ˜ 3 in Guizhou and Yunnan was distinctly higher than that in the other provinces. There may be other factors in addition to rainfall that influence these DD results. The terrain of the Guangxi and western part of Sichuan is dominated by alluvial plains covered by deep soils. The terrain of the Yunnan and Guizhou provinces is dominated by mountains and plateaus that have a thin soil layer weathered by rocks. This leads to lower soil moisture storage and an aggravated water shortage. However, it is difficult to construct a large water conservancy project because of the poor geology and limited available technology. Inadequate water conservation facilities may be the primary reason for the occurrence of severe droughts in Yunnan and Guizhou.
Although drought variations can be influenced by a number of factors, changes in precipitation and evapotranspiration are believed to be the most important factors. The precipitation in SC has decreased significantly in the summer, the autumn, and the winter due to the influence of West Pacific subtropical temperatures and South Asia’s high temperatures [55], which led to reduced soil moisture storage. Corresponding to decadal precipitation anomalies, an increase in the air temperature and a decrease in relative humidity were found in SC in recent years [37,38,39], which led to higher evapotranspiration in the study area. Increasing evapotranspiration during the 21st century would result in higher plant water consumption and reduced soil moisture [58,59]. Concerted effort at a political and institutional level would most certainly help build capacity and reduce agricultural vulnerability to potentially more severe drought impacts. Therefore, the administrative departments of SC are expected to focus on severe and extreme droughts during their decision-making in relation to drought prevention and management under climate change. Although drought severity has increased and may increase further, DD may not increase if we develop irrigation, construct water conservation facilities, and improve breeding along with other effective agricultural management techniques over time [49].
The information diffusion method used in this study was based on the two-dimensional normal diffusion function, which reflects a uniform diffusion process but there may be asymmetric diffusion under practical applications. In addition, the causal relationship between DD and DS will vary because the ability of human beings to regulate natural resources will improve and effective drought use management should change the damage characteristics as farmers adjust over time. Moreover, the drought hazard risk will also alter as climate change in Southwest China proceeds. Factors affecting the causal relationship between DS and DD risk will need to be updated based on the latest data.

5. Conclusions

Agricultural drought damage is the result of a precipitation shortage and the vulnerability of the agricultural production system to that shortage. The degree of drought vulnerability can magnify or lessen disaster damage. This study considers the vulnerability aspect while assessing drought risk and analyzes the vulnerability in SC based on DS and DDR. To improve the accuracy of the results, the drought disaster threshold S was redefined by the correlation between DS, which was calculated by SPI at different time scales and DDR. This is more applicable to the study area. Afterward, the probability of different DS values was obtained with the information distribution method and the vulnerability relationship between DS and DDR was constructed with the information diffusion method. The results showed that DDR gradually increased in line with an increase in DS during the early stages of drought. Subsequently, local fluctuation occurred and, finally, DDR stabilized or even decreased. However, vulnerability characteristics differed among the provinces due to different risk-bearing bodies and the ability to resist disasters.
Drought risk values in SC and its provinces at different DDR were calculated. The frequency of drought does not differ significantly among the southwestern provinces. The probability that crops are under drought-induced conditions in the Sichuan and Guizhou regions is approximately 20%, which is greater than that in Yunnan and Guangxi, which have a probability of approximately 15%. The maximum probability that crops are under lost-harvest conditions is 4.36% in Guizhou, followed by 3.31% in Yunnan, 2.04% in Sichuan, and 1.60% in Guangxi. The probabilities that crop yields will be reduced by more than 10%, 30%, and 70% in SC are 16.14%, 10.69%, and 2.70%, respectively.
The vulnerability of the relationship between DS and DDR constructed in this study has an explicit physical meaning. Therefore, the results seem to be realistic. Both disaster-causing factors and the actual DD are considered, which avoids the one-dimensional sequence error and improves the drought risk assessment results compared to those calculated using only a meteorological factor. The results can affect agricultural production and production forecasts, water resource management, and other activities.

Author Contributions

All authors were involved in designing and discussing the study. S.J. and R.Y. undertook the data analysis and drafted the manuscript. N.C. and L.Z. revised the manuscript and edited the language. C.L. collected required data. All authors have read and approved the final manuscript.

Funding

This research was funded by the National Key Research and Development Program of China (No. 2016YFC0400206), the National Key Technology R&D Program of China (No. 2015BAD24B01), and the National Natural Science Foundation of China (41271045). The APC was funded by the National Natural Science Foundation of China (41271045).

Acknowledgments

We would like to thank the National Climatic Centre of the China Meteorological Administration for providing the climate database used in this study. We also thank the anonymous reviewers and editors of this paper for their very helpful comments and suggestions.

Conflicts of Interest

The authors declare no conflict of interest.

Appendix A. Information Distribution and Diffusion Methods

clear all
clc
%%
U1 = load(‘U1.txt’);
X = load(‘X.txt’);
delta = 2.14 (variable);
n = size(X,2);
l = size(U1,2);
for i = 1:n
    for j = 1:l
        if abs(X(1,i) − U1(1,j))< = delta
            q(i,j) = 1 − abs(X(1,i) − U1(1,j))/delta;
        else q(i,j) = 0;
        end
    end
end
for j = 1:l
    Q(1,j) = sum(q(:,j));
    P(1,j) = Q(1,j)/n;
end
%%
Y = load(‘Y.txt’);
U = load(‘U.txt’);
V = load(‘V.txt’);
n = size(Y,2);
m = size(U,2);
t = size(V,2);
for i = 1:n
    for j = 1:m
        for k = 1:t
            hx1 = max(X(1,:));
           hx2 = min(X(1,:));
           hx = 2.6851*(hx1 − hx2)/(n − 1);
           hy1 = max(Y(1,:));
            hy2 = min(Y(1,:));
            hy = 2.6851*(hy1 − hy2)/(n − 1);
            u(j,k,i) = 1/(2*pi*hx*hy)*exp((−(U(1,j) − X(1,i))^2/(2*hx^2)) − (V(1,k) − Y(1,i))^2/(2*hy^2));
        end
    end
end
for j = 1:m
    for k = 1:t
        Q(j,k) = sum(u(j,k,:));
    end
end
%%
s = max(Q’);
for j = 1:m
    for k = 1:t
        R(j,k) = Q(j,k)/s(1,k);
    end
end
%%
delta2 = 0.36;
for i = 1:l
    for j = 1:m
        if abs(U1(1,i) − U(1,j))< = delta2
            ux(i,j) = 1 − abs(U1(1,i) − U(1,j))/delta2;
        else ux(i,j) = 0;
        end
    end
end
%%
uy = ux*R;
%for i = 1:l
%    for j = 1:m
%        for k = 1:t
%            R1(j,k) = ux(i,j)*R(j,k);
%            uy(i,j) = sum(R1(j,:));
%        end
%    end
%end
%%
for i = 1:l
    for k = 1:t
        y1(i,k) = uy(i,k)*V(1,k);
    end
end
for i = 1:l
    y0(1,i) = sum(y1(i,:))/sum(uy(i,:));
end
		

References

  1. Frankenberg, E.; Sikoki, B.; Sumantri, C.; Suriastini, W.; Thomas, D. Education, vulnerability, and resilience after a natural disaster. Ecol. Soc. 2013, 18, 16. [Google Scholar] [CrossRef] [PubMed]
  2. Balica, S.F.; Douben, N.; Wright, N.G. Flood vulnerability indices at varying spatial scales. Water Sci. Technol. 2009, 60, 2571–2580. [Google Scholar] [CrossRef] [PubMed]
  3. Hao, L.; Zhang, X.Y.; Liu, S.D. Risk assessment to China’s agricultural drought disaster in county unit. Nat. Hazards 2012, 61, 785–801. [Google Scholar] [CrossRef]
  4. Fontaine, M.M.; Steinemann, A.C. Assessing vulnerability to natural hazards: Impact-based method and application to drought in Washington state. Nat. Hazards Rev. 2009, 10, 11–18. [Google Scholar] [CrossRef]
  5. Yu, I.; Lee, T.; Kim, L.H.; Jeong, S. Development of natural disaster risk map as reflected in flood, wind and snow in Ulsan City. Desalin. Water Treat. 2017, 63, 455–462. [Google Scholar] [CrossRef]
  6. Debortoli, N.S.; Camarinha, P.I.M.; Marengo, J.A.; Rodrigues, R.R. An index of Brazil's vulnerability to expected increases in natural flash flooding and landslide disasters in the context of climate change. Nat. Hazards 2017, 86, 557–582. [Google Scholar] [CrossRef]
  7. Fan, G.F.; Zhang, Y.; He, Y.; Wang, K. Risk assessment of drought in the Yangtze River Delta based on natural disaster risk theory. Discrete Dyn. Nat. Soc. 2017, 2017, 5682180. [Google Scholar] [CrossRef]
  8. Kim, H.; Park, J.; Yoo, J.; Kim, T.W. Assessment of drought hazard, vulnerability, and risk: A case study for administrative districts in South Korea. J. Hydro-Environ. Res. 2015, 9, 28–35. [Google Scholar] [CrossRef]
  9. Wang, K.; Feng, G.L.; Zeng, Y.X.; Wang, X.J. Analysis of stable components in the extended-range forecast for the coming 10–30 days in winter 2010 and 2011. Chin. Phys. B 2013, 22, 570–577. [Google Scholar] [CrossRef]
  10. Carrao, H.; Naumann, G.; Barbosa, P. Global projections of drought hazard in a warming climate: A prime for disaster risk management. Clim. Dyn. 2018, 50, 2137–2155. [Google Scholar] [CrossRef]
  11. Shahid, S.; Behrawan, H. Drought risk assessment in the western part of Bangladesh. Nat. Hazards 2008, 46, 391–413. [Google Scholar] [CrossRef]
  12. Wilhelmi, O.V.; Wilhite, D.A. Assessing vulnerability to agricultural drought: A Nebraska case study. Nat. Hazards 2002, 1, 37–58. [Google Scholar] [CrossRef]
  13. Rajsekhar, D.; Singh, V.P.; Mishra, A.K. Integrated drought causality, hazard, and vulnerability assessment for future socioeconomic scenarios: An information theory perspective. J. Geophys. Res. Atmos. 2015, 13, 6346–6378. [Google Scholar] [CrossRef]
  14. He, B.; Lu, A.F.; Wu, J.J.; Zhao, L.; Liu, M. Drought hazard assessment and spatial characteristics analysis in China. J. Geogr. Sci. 2011, 2, 235–249. [Google Scholar] [CrossRef]
  15. He, B.; Wu, J.J.; Lu, A.F.; Cui, X.F.; Zhou, L.; Liu, M.; Zhao, L. Quantitative assessment and spatial characteristic analysis of agricultural drought risk in China. Nat. Hazards 2013, 66, 155–166. [Google Scholar] [CrossRef]
  16. Cheng, J.; Tao, J.P. Fuzzy Comprehensive Evaluation of Drought Vulnerability Based on the Analytic Hierarchy Process—An Empirical Study from Xiaogan City in Hubei Province. Agric. Agric. Sci. Procedia 2010, 1, 126–135. [Google Scholar] [CrossRef]
  17. Wu, J.J.; He, B.; Lu, A.F.; Zhou, L.; Liu, M.; Zhao, L. Quantitative assessment and spatial characteristics analysis of agricultural drought vulnerability in China. Nat. Hazards 2011, 3, 785–801. [Google Scholar] [CrossRef]
  18. Monterroso, A.; Conde, C. Exposure to climate and climate change in Mexico. Geomat. Nat. Hazards Risk. 2015, 6, 272–288. [Google Scholar] [CrossRef]
  19. Pogson, M.; Hastings, A.; Smith, P. Sensitivity of crop model predictions to entire meteorological and soil input datasets highlights vulnerability to drought. Environ. Model. Softw. 2012, 29, 37–43. [Google Scholar] [CrossRef] [Green Version]
  20. Burke, E.J.; Brown, S.J. Regional drought over the UK and changes in the future. J. Hydrol. 2010, 394, 471–485. [Google Scholar] [CrossRef]
  21. Antwi-Agyei, P.; Fraser, E.D.G.; Dougill, A.J.; Stringer, L.C.; Simelton, E. Mapping the vulnerability of crop production to drought in Ghana using rainfall, yield and socioeconomic data. Appl. Geogr. 2012, 32, 324–334. [Google Scholar] [CrossRef]
  22. Jayanthi, H.; Husak, G.J.; Funk, C.; Magadzire, T.; Chavula, A.; Verdin, J.P. Modeling rain-fed maize vulnerability to droughts using the standardized precipitation index from satellite estimated rainfall—Southern Malawi case study. Int. J. Disaster Risk Reduct. 2013, 4, 71–81. [Google Scholar] [CrossRef]
  23. Wang, Z.Q.; He, F.; Fang, W.H.; Liao, Y.F. Assessment of physical vulnerability to agricultural drought in China. Nat. Hazards 2013, 67, 645–657. [Google Scholar] [CrossRef]
  24. Huang, C.F.; Moraga, C. Extracting fuzzy if-then rules by using the information matrix technique. J. Comput. Syst. Sci. 2005, 70, 26–52. [Google Scholar] [CrossRef]
  25. Huang, C.F. Principle of information diffusion. Fuzzy Sets Syst. 1997, 91, 69–90. [Google Scholar]
  26. Chang, J.X.; Li, Y.Y.; Wang, Y.M.; Yuan, M. Copula-based drought risk assessment combined with an integrated index in the Wei River basin, China. J. Hydrol. 2016, 540, 824–834. [Google Scholar] [CrossRef]
  27. Zarei, A.R.; Moghimi, M.M.; Mahmoudi, M.R. Analysis of changes in spatial pattern of drought using RDI index in south of Iran. Water Resour. Manag. 2016, 30, 3723–3743. [Google Scholar] [CrossRef]
  28. Tan, C.P.; Yang, J.P.; Li, M. Temporal-Spatial Variation of Drought Indicated by SPI and SPEI in Ningxia Hui Autonomous Region, China. Atmosphere 2015, 6, 1399–1421. [Google Scholar] [CrossRef] [Green Version]
  29. Woli, P.; Jones, J.W.; Ingram, K.T. Assessing the agricultural reference index for drought (ARID) using uncertainty and sensitivity analyses. Agron. J. 2013, 101, 150–160. [Google Scholar] [CrossRef]
  30. Karim, Z.; Iqbal, M.A. Impact of Land Degradation in Bangladesh: Changing Scenario in Agricultural Land Use; Bangladesh Agricultural Research Center (BARC): Dhaka, Bangladesh, 2001. [Google Scholar]
  31. Zhou, Y.T.; Xiao, X.M.; Zhang, G.L.; Wagle, P.; Bigain, R.; Dong, J.W.; Jin, C.; Basara, J.B.; Anderson, M.C.; Hain, C. Quantifying agricultural drought in tallgrass prairie region in the US Southern Great Plains through analysis of a water-related vegetation index from MODIS images. Agric. For. Meteorol. 2017, 246, 111–122. [Google Scholar] [CrossRef]
  32. Zhang, A.Z.; Jia, G.S. Monitoring meteorological drought in semiarid regions using multi-sensor microwave remote sensing data. Remote Sens. Environ. 2013, 134, 12–23. [Google Scholar] [CrossRef]
  33. McKee, T.B.; Doeskin, N.J.; Kleist, J. The relationship of drought frequency and duration to time scales. In Proceedings of the 8th Conference on Applied Climatology, Anaheim, CA, USA, 17–22 January 1993; American Meteor Society: Anaheim, CA, USA, 1993; pp. 179–184. [Google Scholar]
  34. Palmer, W.C. Meteorological Drought; Research Paper No. 45; US Department of Commerce Weather Bureau: Washington, DC, USA, 1965.
  35. Liu, M.X.; Xu, X.L.; Sun, A. Decreasing spatial variability in precipitation extremes in Southwestern China and the local/large-scale influencing factors. J. Geophys. Res. Atmos. 2015, 120, 6480–6488. [Google Scholar] [CrossRef]
  36. Bonaccorso, B.; Cancelliere, A.; Rossi, G. Probabilistic forecasting of drought class transitions in Sicily (Italy) using Standardized Precipitation Index and North Atlantic Oscillation Index. J. Hydrol. 2015, 526, 136–150. [Google Scholar] [CrossRef]
  37. Fan, Z.X.; Thomas, A. Spatiotemporal variability of reference evapotranspiration and its contributing climatic factors in Yunnan Province, SW China, 1961–2004. Clim. Chang. 2013, 116, 309–325. [Google Scholar] [CrossRef]
  38. Wang, Z.L.; Xie, P.W.; Lai, C.G.; Chen, X.H.; Wu, X.S.; Zeng, Z.Y.; Li, J. Spatiotemporal variability of reference evapotranspiration and contributing climatic factors in China during 1961–2013. J. Hydrol. 2017, 544, 97–108. [Google Scholar] [CrossRef]
  39. Yao, Y.J.; Zhao, S.H.; Zhang, Y.H.; Jia, K.; Liu, M. Spatial and Decadal Variations in Potential Evapotranspiration of China Based on Reanalysis Datasets during 1982–2010. Atmosphere 2014, 5, 737–754. [Google Scholar] [CrossRef] [Green Version]
  40. Wang, J.; Fang, F.; Zhang, Q.; Wang, J.S.; Yao, Y.B.; Wang, W. Risk evaluation of agricultural disaster impacts on food production in Southern China by probability density method. Nat. Hazards 2016, 83, 1605–1634. [Google Scholar] [CrossRef]
  41. Ayantobo, O.O.; Li, Y.; Song, S.B.; Yao, N. Spatial comparability of drought characteristics and related return periods in mainland China over 1961–2013. J. Hydrol. 2017, 550, 549–567. [Google Scholar] [CrossRef]
  42. Shi, P.; Wu, M.; Qu, S.M.; Jiang, P.; Qiao, X.Y.; Chen, X.; Zhou, M.; Zhang, Z.C. Spatial Distribution and Temporal Trends in Precipitation Concentration Indices for the Southwest China. Water Resour. Manag. 2015, 29, 3941–3955. [Google Scholar] [CrossRef]
  43. Yang, P.; Xiao, Z.N.; Yang, J.; Liu, H. Characteristics of clustering extreme drought events in China during 1961–2010. Acta Meteorol. Sin. 2013, 27, 186–198. [Google Scholar] [CrossRef]
  44. Xie, Z.T.; Xu, J.P.; Deng, Y.F. Risk analysis and evaluation of agricultural drought disaster in the major grain-producing areas, China. Geomat. Nat. Hazards Risk 2016, 7, 1691–1706. [Google Scholar] [CrossRef]
  45. Lloyd-Hughes, B.; Saunders, M.A. A drought climatology for Europe. Int. J. Climatol. 2002, 22, 1571–1592. [Google Scholar] [CrossRef] [Green Version]
  46. Wang, W.X.; Zuo, D.D.; Feng, G.L. Analysis of the drought vulnerability characteristics in northeast China based on the theory of information distribution and diffusion. Acta Phys. Sin. 2014, 63, 229201. (In Chinese) [Google Scholar]
  47. Wang, Y.F.; Chen, X.W.; Chen, Y.; Liu, M.B.; Gao, L. Flood/drought event identification using an effective indicator based on the correlations between multiple time scales of the Standardized Precipitation Index and river discharge. Theor. Appl. Climatol. 2017, 128, 159–168. [Google Scholar] [CrossRef]
  48. Huang, C.F. An intertemporal general equilibrium asset pricing model—The case of diffusion information. Econometrica 1987, 55, 117–142. [Google Scholar] [CrossRef]
  49. Potop, V.; Boroneant, C.; Mozny, M.; Stepanek, P.; Skalak, P. Observed spatiotemporal characteristics of drought on various time scales over the Czech Republic. Theor. Appl. Climatol. 2014, 115, 563–581. [Google Scholar] [CrossRef]
  50. Shahabfar, A.; Eitzinger, J. Spatio-Temporal Analysis of Droughts in Semi-Arid Regions by Using Meteorological Drought Indices. Atmosphere 2013, 4, 99–112. [Google Scholar] [CrossRef]
  51. Vicente-Serrano, S. Differences in Spatial Patterns of Drought on Different Time Scales: An Analysis of the Iberian Peninsula. Water Resour. Manag. 2006, 20, 37–60. [Google Scholar] [CrossRef]
  52. He, D.; Wang, J.; Pan, Z.H.; Dai, T.; Wang, E.L.; Zhang, J.P. Changes in wheat potential productivity and drought severity in Southwest China. Theor. Appl. Climatol. 2017, 130, 477–486. [Google Scholar] [CrossRef]
  53. Seiler, R.A.; Hayes, M.J.; Bressan, L. Using the standardized precipitation index for flood risk monitoring. Int. J. Climatol. 2002, 22, 1365–1376. [Google Scholar] [CrossRef] [Green Version]
  54. Merabti, A.; Martins, D.S.; Meddi, M.; Pereira, L.S. Spatial and Time Variability of Drought Based on SPI and RDI with Various Time Scales. Water Resour. Manag. 2018, 32, 1087–1100. [Google Scholar] [CrossRef]
  55. Liu, Z.C.; Lu, G.H.; He, H.; Wu, Z.Y.; He, J. Understanding atmospheric anomalies associated with seasonal pluvial-drought processes using Southwest China as an example. J. Geophys. Res. Atmos. 2017, 122, 12210–12225. [Google Scholar] [CrossRef]
  56. Yan, Z.Q.; Zhang, Y.P.; Zhou, Z.H.; Han, N. The spatio-temporal variability of droughts using the standardized precipitation index in Yunnan, China. Nat. Hazards 2017, 88, 1023–1042. [Google Scholar] [CrossRef]
  57. Kim, K.; Wang, M.C.; Ranjitkar, S.; Liu, S.H.; Xu, J.C.; Zomer, R.J. Using leaf area index (LAI) to assess vegetation response to drought in Yunnan province of China. J. Mt. Sci. 2017, 14, 1863–1872. [Google Scholar] [CrossRef]
  58. Zhang, C.; Tang, Q.H.; Chen, D.L.; Li, L.F.; Liu, X.C.; Cui, H.J. Tracing changes in atmospheric moisture supply to the drying Southwest China. Atmos. Chem. Phys. 2017, 17, 10383–10393. [Google Scholar] [CrossRef] [Green Version]
  59. Zhang, M.J.; He, J.Y.; Wang, B.L.; Wang, S.J.; Li, S.S.; Liu, W.L.; Ma, X.N. Extreme drought changes in Southwest China from 1960 to 2009. J. Geogr. Sci. 2013, 23, 3–16. [Google Scholar] [CrossRef]
Figure 1. Location of Southwest China (top) and its topography (bottom, units: m) and the spatial distributions of the meteorological stations in the five provinces.
Atmosphere 09 00239 g001
Figure 2. Risk analysis diagram.
Atmosphere 09 00239 g002
Figure 3. The correlations between drought strength (DS)/drought duration (DU) and drought damage rates (DDR) in Guangxi province. (a) The correlation between DS and the drought-induced rate (I1). (b) The correlation between DU and the drought-induced rate (I1). (c) The correlation between DS and the drought-affected rate (I2). (d) The correlation between DU and the drought-affected rate (I2). (e) The correlation between DS and the lost harvest rate (I3). (f) The correlation between DU and the lost harvest rate (I3). The broken line indicates a confidence level of P = 0.05 and the solid line indicates a confidence level of P = 0.01.
Atmosphere 09 00239 g003
Figure 4. The vulnerability relationships between drought strength (DS) and drought damage rates (DDR) in the Sichuan Province. (a1,a2,a3) represent the vulnerability relationship between DS calculated by SPI3, SPI6, and SPI9 and the drought-induced rate (I1), (b1,b2,b3) represent the vulnerability relationship between DS and the drought-affected (I2), and (c1,c2,c3) represent the vulnerability relationship between DS and the lost harvest rate (I3).
Atmosphere 09 00239 g004
Figure 5. The vulnerability relationships between drought strength (DS) and drought damage rates (DDR) in the Guangxi Province. (a1,a2,a3) represent the vulnerability relationship between DS calculated by SPI1, SPI3, and SPI6 and the drought-induced rate (I1), respectively. (b1,b2,b3) represent the vulnerability relationship between DS calculated by SPI1, SPI3, and SPI6 and the drought-affected rate (I2), respectively. (c1,c2,c3) represent the vulnerability relationship between DS calculated by SPI3, SPI6, and SPI9 and the lost harvest rate (I3), respectively.
Atmosphere 09 00239 g005
Figure 6. The vulnerability relationships between drought strength (DS) and drought damage rates (DDR) in the Guizhou Province. (a1,a2,a3) represent the vulnerability relationship between DS calculated by SPI1, SPI3, and SPI6 and the drought-induced rate (I1), respectively. (b1,b2,b3) represent the vulnerability relationship between DS calculated by SPI3, SPI6, and SPI9 and the drought-affected rate (I2), respectively. (c1,c2,c3) represent the vulnerability relationship between DS calculated by SPI3, SPI6, and SPI9 and the lost harvest rate (I3), respectively.
Atmosphere 09 00239 g006
Figure 7. The vulnerability relationships between drought strength (DS) calculated by SPI6, SPI9, and SPI12 and drought damage rates (DDR) in the Yunnan Province. (a1,a2,a3) represent the vulnerability relationship between DS and the drought-induced rate (I1). (b1,b2,b3) represent the vulnerability relationship between DS and the drought-affected rate (I2), respectively. (c1,c2,c3) represent the vulnerability relationship between DS and the lost harvest rate (I3), respectively.
Atmosphere 09 00239 g007
Figure 8. The vulnerability relationships between drought strength (DS) and drought damage rates (DDR) in the Yunnan Province. (a1,a2,a3) represent the vulnerability relationship between DS calculated by SPI3, SPI6, and SPI9 and the drought-induced rate (I1), respectively. (b1,b2,b3) represent the vulnerability relationship between DS calculated by SPI6, SPI9, and SPI12 and the drought-affected rate (I2), respectively. (c1,c2,c3) represent the vulnerability relationship between DS calculated by SPI6, SPI9, and SPI12 and the lost harvest rate (I3), respectively.
Atmosphere 09 00239 g008
Table 1. Geographic characteristics of the stations used in this study.
ProvinceStationLatitudeLongitudeElevation (m)
YunnanDq28°29’98°55’3319
Tc25°01’98°30’1655
Cx25°02’101°33’1824
Km25°00’102°39’1887
Ln23°53’100°05’1502
Jh22°00’100°47’582
Zt27°21’103°43’1950
Lj26°52’100°13’2392
Lx24°32’103°46’1704
GuangxiHc24°42’108°02’260
Bs23°54’106°36’174
Nn22°38’108°13’122
Lb23°45’109°14’85
Gl25°19’110°18’164
Fs24°33’107°02’485
Yl22°39’110°10’82
Ls22°25’109°18’67
GuizhouXy25°26’105°11’1379
As26°15’105°54’1431
Bj27°18’105°17’1511
Zy27°42’106°53’844
Gy26°35’106°44’1224
Kl26°36’107°59’720
Rj25°58’108°32’286
Ld25°26’106°46’440
Sn27°57’108°15’416
Sichuan Gy32°26’105°51’514
Ya29°59’103°00’628
Cd30°40’104°01’506
Yb28°48’104°36’341
Xc27°54’102°16’1591
Hl26°39’102°15’1787
Bz31°52’106°46’418
Sn30°30’105°33’355
Lt30°00’100°16’3949
Gz31°37’100°00’3394
ChongqingFj31°01’109°32’300
Lp30°41’107°48’455
Spb29°35’106°28’259
Qy28°50’108°46’664
Table 2. Drought rank of the SPI.
RankLight DroughtMedium DroughtDroughtSevere Drought
SPI[−0.99, 0][−1.00, −1.49][−1.50, −1.99][≤−2.00]
Table 3. The thresholds corresponding to the maximum correlation between DS calculated by different time scales of SPI values and DDR in Southwest China (SC) and its provinces.
Areas SPI1SPI3SPI6SPI9SPI12SPI24
S1 −0.1−0.3−0.1
SichuanS2 −1.0−0.9−0.9
S3 −0.7−0.9−1.0
S1−0.3−0.1−0.1
GuangxiS2−0.6−1.4−1.4
S3 −1.5−1.4−1.5
S1−0.4−0.4−0.3
GuizhouS2 −1.4−1.3−1.6
S3 −1.6−1.9−1.8
S1 −0.1−0.1−0.1
YunnanS2 −0.1−0.6−0.6
S3 −2.0−1.9−1.0
S1 −0.9−0.9−0.7
SCS2 −1.0−0.7−1.0
S3 −1.1−0.7−1.0
Note: S1, S2, and S3 represents the thresholds when the crops were under drought-induced, drought-affected, and lost harvest conditions, respectively.
Table 4. Drought damage risk evaluation based on different time scales for SPI in Southwest China (SC) and its provinces (%).
Areas SPI1SPI3SPI6SPI9SPI12SPI24
R1 18.6122.4417.96
SichuanR2 12.7413.1712.48
R3 2.091.992.03
R114.2216.2615.82
GuangxiR28.3113.768.06
R3 1.531.671.59
R118.8719.4419.01
GuizhouR2 12.6412.3910.19
R3 3.874.794.43
R1 15.6416.7117.93
YunnanR2 9.189.398.94
R3 3.333.293.32
R1 15.3216.6716.44
SCR2 10.1111.6110.14
R3 2.782.672.66
Table 5. Average drought damage risk evaluation in Southwest China (SC) and its provinces (%).
AreasSichuanGuangxiYunnanGuizhouSC
R ˜ 1 19.6715.4316.7619.1116.14
R ˜ 2 12.8010.049.1711.7410.62
R ˜ 3 2.041.603.314.362.70

