The Fingerprint of Climate Change and Urbanization in South Korea
by
 , , ,
, , ,
Won-Ho Nam
1,2,3 ,
,
Guillermo A. Baigorria
1,†,
Eun-Mi Hong
4,
Taegon Kim
5,*,
Yong-Sang Choi
6 and
Song Feng
7 1
School of Natural Resources, University of Nebraska-Lincoln, Lincoln, NE 68583, USA
2
Department of Bioresources and Rural Systems Engineering, Hankyong National University, Anseong 17579, Korea
3
Institute of Agricultural Environmental Science, Hankyong National University, Anseong 17579, Korea
4
School of Natural Resources and Environmental Science, Kangwon National University, Chuncheon 24341, Korea
5
Institute on the Environment, University of Minnesota, Saint Paul, MN 55108, USA
6
Department of Environmental Science and Engineering, Ewha Womans University, Seoul 03760, Korea
7
Department of Geosciences, University of Arkansas, Fayetteville, AR 72701, USA
*
Author to whom correspondence should be addressed.
†
Current Address: Department of Research and Development, Next Season Systems, Lincoln, NE 68506, USA
Atmosphere 2018, 9(7), 273; https://doi.org/10.3390/atmos9070273
Submission received: 18 May 2018
/
Revised: 2 July 2018
/
Accepted: 14 July 2018
/
Published: 17 July 2018
(This article belongs to the Special Issue Urban Climate)
Abstract
:Understanding long-term changes in precipitation and temperature patterns is important in the detection and characterization of climate change, as is understanding the implications of climate change when performing impact assessments. This study uses a statistically robust methodology to quantify long-, medium- and short-term changes for evaluating the degree to which climate change and urbanization have caused temporal changes in precipitation and temperature in South Korea. We sought to identify a fingerprint of changes in precipitation and temperature based on statistically significant differences at multiple-timescales. This study evaluates historical weather data during a 40-year period (1973–2012) and from 54 weather stations. Our results demonstrate that between 1993–2012, minimum and maximum temperature trends in the vicinity of urban and agricultural areas are significantly different from the two previous decades (1973–1992). The results for precipitation amounts show significant differences in urban areas. These results indicate that the climate in urbanized areas has been affected by both the heat island effect and global warming-caused climate change. The increase in the number of rainfall events in agricultural areas is highly significant, although the temporal trends for precipitation amounts showed no significant differences. Overall, the impacts of climate change and urbanization in South Korea have not been continuous over time and have been expressed locally and regionally in terms of precipitation and temperature changes.
1. Introduction
Recent decades have seen a rising awareness of climate change, largely the result of improved understanding of long-term changes in climatic processes at different temporal and spatial scales [1,2]. Many studies on shifts in extreme climate events have been conducted over the past decade and most of them showed changes in extreme precipitation and temperature variability in different global regions, with the warm temperature indices witnessing significant upward trends [3,4,5]. Global warming has been neither spatially nor seasonally homogeneous worldwide [6]. Therefore, it is of interesting to investigate observations of recent climate trends at regional scales to evaluate specific changes in meteorological elements on a smaller scale [7,8]. Previous studies have profiled evidence of significant shifts in climate in analyzing observational climate variable records from North America [9,10], Europe [11], China [5] and East Asia [12].
Regional climate trends can be very different from the global average and may more accurately be described in terms of shifts in the circulation and interaction of the atmosphere and ocean, in addition to other climate system components [13,14,15]. The Intergovernmental Panel on Climate Change (IPCC) highlighted a need for more specific information about climate change on regional and local scales, because understanding temporal trends of climate variability is fundamental for comprehensive environmental assessments at regional and/or national scales [16]. Therefore, further studies of the changes that occur in spatial and temporal trends of meteorological elements at regional scales are needed to better identify and understand possible problems and/or the benefits of climate change patterns and further inform future impact assessments.
One of the processes that influences local temperature and precipitation is urbanization [17,18]. IPCC reports also provide examples of a link between urbanization-related human activities and an increased incidence of extreme precipitation and temperature events [14]. It has been reported that temperature increases measured in urban districts are higher than increases in other regions, like suburbs and rural areas, a phenomenon known as urban heat islands [19,20,21]. Choi et al. showed that the indirect relationship between long-term variations in precipitation and aerosol concentrations are associated with regional climate variations and increased industrialization emissions in China [22]. These findings suggest that further investigation is needed to determine how the combination of urbanization and climate change impact long-term temperature and precipitation trends.
Recent research into changes in precipitation and temperature in South Korea may be categorized as either studies of annual mean increases [23,24] or of the number of severe events [25]. A shift in mean climate conditions, such as a change in temperature distributions, could lead to a corresponding change in climate extremes [26]. By analyzing historical data trends, for example, observed annual mean temperatures, shows a warming trend in South Korea of 0.23 °C per decade during the period between 1954 and 1999 and the data also indicate positive trends in both maximum and minimum temperatures for all seasons [27]. Though several studies have used historical temperature and precipitation data to analyze climate change in South Korea, research has mostly focused on precipitation changes during the summer season [28]. Variations in temperature and precipitation during the winter and spring seasons are also important, however, given their close association with spring droughts [29].
Several questions came to the fore as we considered how to investigate South Korean climate data for evidence of precipitation and temperature trends. For example, while evidence shows that climate change and urbanization have affected temporal trends in precipitation and temperature, we sought to understand when and where the climate change began [30]. The purpose of this study is to help answer questions such as these by focusing on trends for specific meteorological elements. Its objectives are (1) to identify and quantify shifts in temperature and precipitation in South Korea over monthly and annual timescales; and (2) to apply a statistically robust method of evaluating temporal changes in precipitation and temperature.
2. Materials and Methods
2.1. Study Area
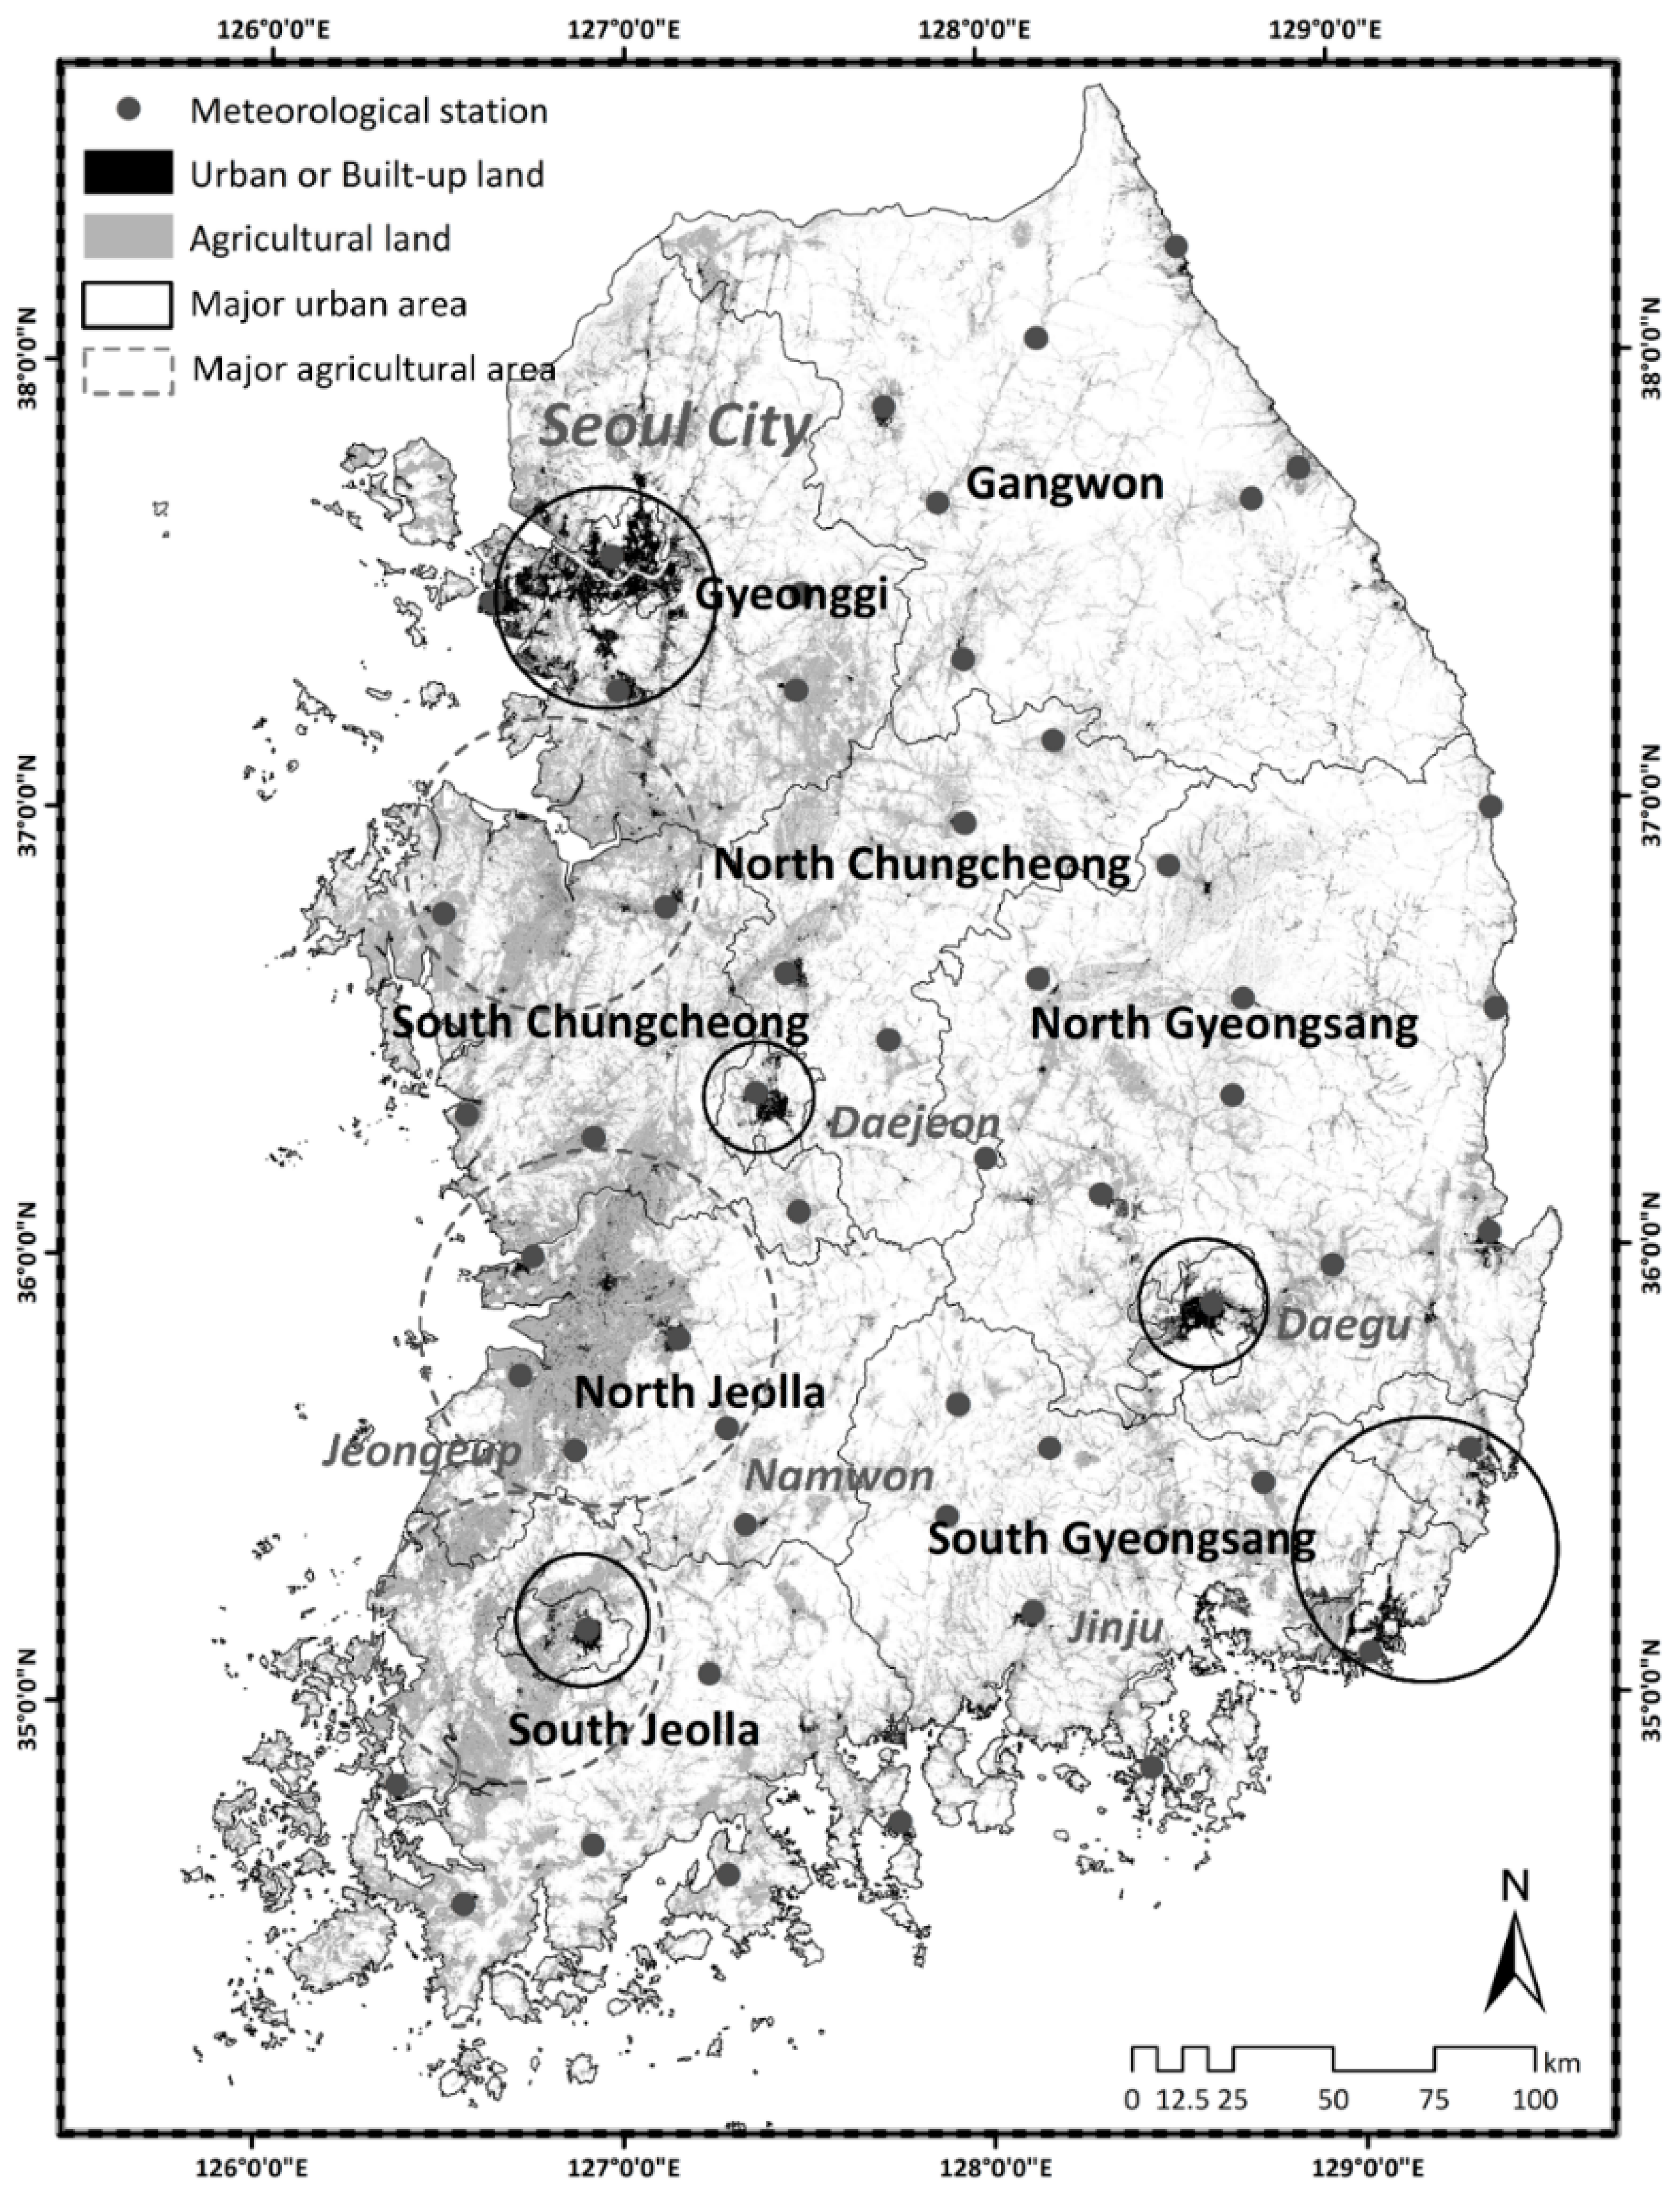
The study area is the Korean Peninsula. It is located in East Asia, between China and Japan (35°50′ N, 127°00′ W) and is surrounded by the Yellow Sea on the west, the Korea Strait on the south and the East Sea on the east. Land use in the study area is mainly forest (66.8%) and agricultural (21.5%), with large urban areas (3.4%) in the northwest and southeast regions. Agricultural areas are located mostly in the mid- and southwest regions and are dominated by paddy and upland farming, as shown in Figure 1. Because of its complex mountain terrain, the Korean Peninsula’s climate experiences complex spatial and temporal variability. Climatologically, the annual maximum precipitation in Korea is typically recorded during the summer rainy season from late June to July, which is strongly controlled by the East Asian summer monsoon system. The high intensity of precipitation is primarily due to torrential rain events and typhoons. Another factor that affects the precipitation intensity is the strong influence of the Pacific subtropical high pressure between mid-August and mid-September, which lasts for approximately 3 or 4 weeks and is known as the fall rainy season. Except in the dry region of South Korea, which has less than 1000 mm of precipitation, many parts of South Korea receive between 1200 mm and 1400 mm of precipitation, which is slightly above the worldwide average. The annual mean precipitation in South Korea is approximately 1300 mm. The range of seasonal average temperature is from 6.6 °C (winter) to 16.6 °C (summer). According to the observations of the Korea Meteorological Administration (KMA), the annual average temperature is 10–15 °C. The maximum temperature occurs in July and August, when the average temperature ranges from 24–27 °C and the minimum temperature ranges from −6 to 3 °C in January.
2.2. Meteorological Data
For this research, station-based daily meteorological data were secured from the KMA. Since the early 1960s, the number of observation stations operated by the KMA has steadily increased to a current total of 76 and the quality of meteorological data has become more reliable. Two criteria were used to select observation stations for use in this study: (1) a station must have had been keeping records for more than 40 years; and (2) a station was excluded if more than 10% of its data was incomplete for any month of record. All data were then reviewed for missing values and errors. Following this review, the final database of selected meteorological stations included 54 stations and their climate data from 1973 to 2012. Three variables were included in each station’s data set: precipitation, minimum temperature and maximum temperature. The precipitation data included the number of precipitation events and precipitation totals.
2.3. Statistical Analysis of Climate
Statistical analyses were conducted to identify areas where the mean and variance of any of the meteorological data differed significantly over time, in other words, those areas that were affected by urbanization and climate change. Methods of analysis involved (1) reviewing spatio-temporal variations of meteorological elements over consecutive periods of time; (2) seeking significant changes in meteorological variables between periods of time; and (3) identifying possible explanations for the changes in temperature and precipitation, to include increases that may have resulted from climate change and urbanization. The 4-decade historical record was divided into three time period groupings: group I—20 years (relatively long-term); group II—10 years (middle-term); and group III—5 years (relatively short-term). Group I was then further divided into two 20-year periods. Group II was divided into four 10-year periods. And finally, group III was divided into eight periods of five years each. Because significant climate changes have occurred throughout the time series review, such analysis was necessary to identify statistically-significant differences between two or more periods within a given group.
Statistical analyses were performed using two approaches: (1) statistically significant differences between the meteorological elements were assessed for each time period within each of the three groups; and (2) specific temporal periods and spatial areas were identified, in which the mean and variance of the meteorological elements were significantly different in each group [30]. The statistical analyses to compare differences between periods within each group were performed using the variance F-test statistic (ANOVA F-test statistic) [31]. The ANOVA F-test is appropriate for comparing means and variances of a continuous variable in two or more comparison groups (between and within groups) [32]. The first step in the ANOVA F-test is to evaluate the assumption of homogeneity of variance, where the null hypothesis assumes no difference between each of the group members’ variances. The Levene’s test for equality of variances takes advantage of the fact that classical ANOVA procedures for comparing means assume a normal distribution and are robust to violations of the assumption of homogeneity of variance [33].
The ANOVA F-test was applied to look for statistically significant differences in precipitation and temperature among different periods in each time group. The probability value (p-value) was assessed using the F distribution table (α = 0.01 and α = 0.05) [31]. In statistics, Duncan’s Multiple Range Test is a post hoc test to measure specific differences between pairs of means. [34]. When significant differences occurred, Duncan’s Multiple Range Tests were performed for each period in groups II and III, which were then compared to the latest recorded periods of group II (2003–2012) and group III (2008–2012).
Each map area was evaluated by comparing the latest periods of record (2003–2012 in group II and 2008–2012 in group III) to the prior periods. The interpolation method used was inverse distance weighting (IDW) with a grid cell size of 500 m × 500 m, using a minimum of three neighbor points and a maximum of four neighbor points and a distance powered to five. The IDW, which is a commonly preferred method for interpolation of precipitation [35]. With this method, the value at each interpolated location is estimated as a linear combination of surrounding observations, with the weights being inversely proportional to the distance between the observations and the interpolated location [36]. In this study, the selection of the interpolation parameters was made after utilizing a trial and error iterative method to replicate a sample of manually drawn isolines.
3. Results and Discussion
3.1. Analysis of Annual Climate Changes
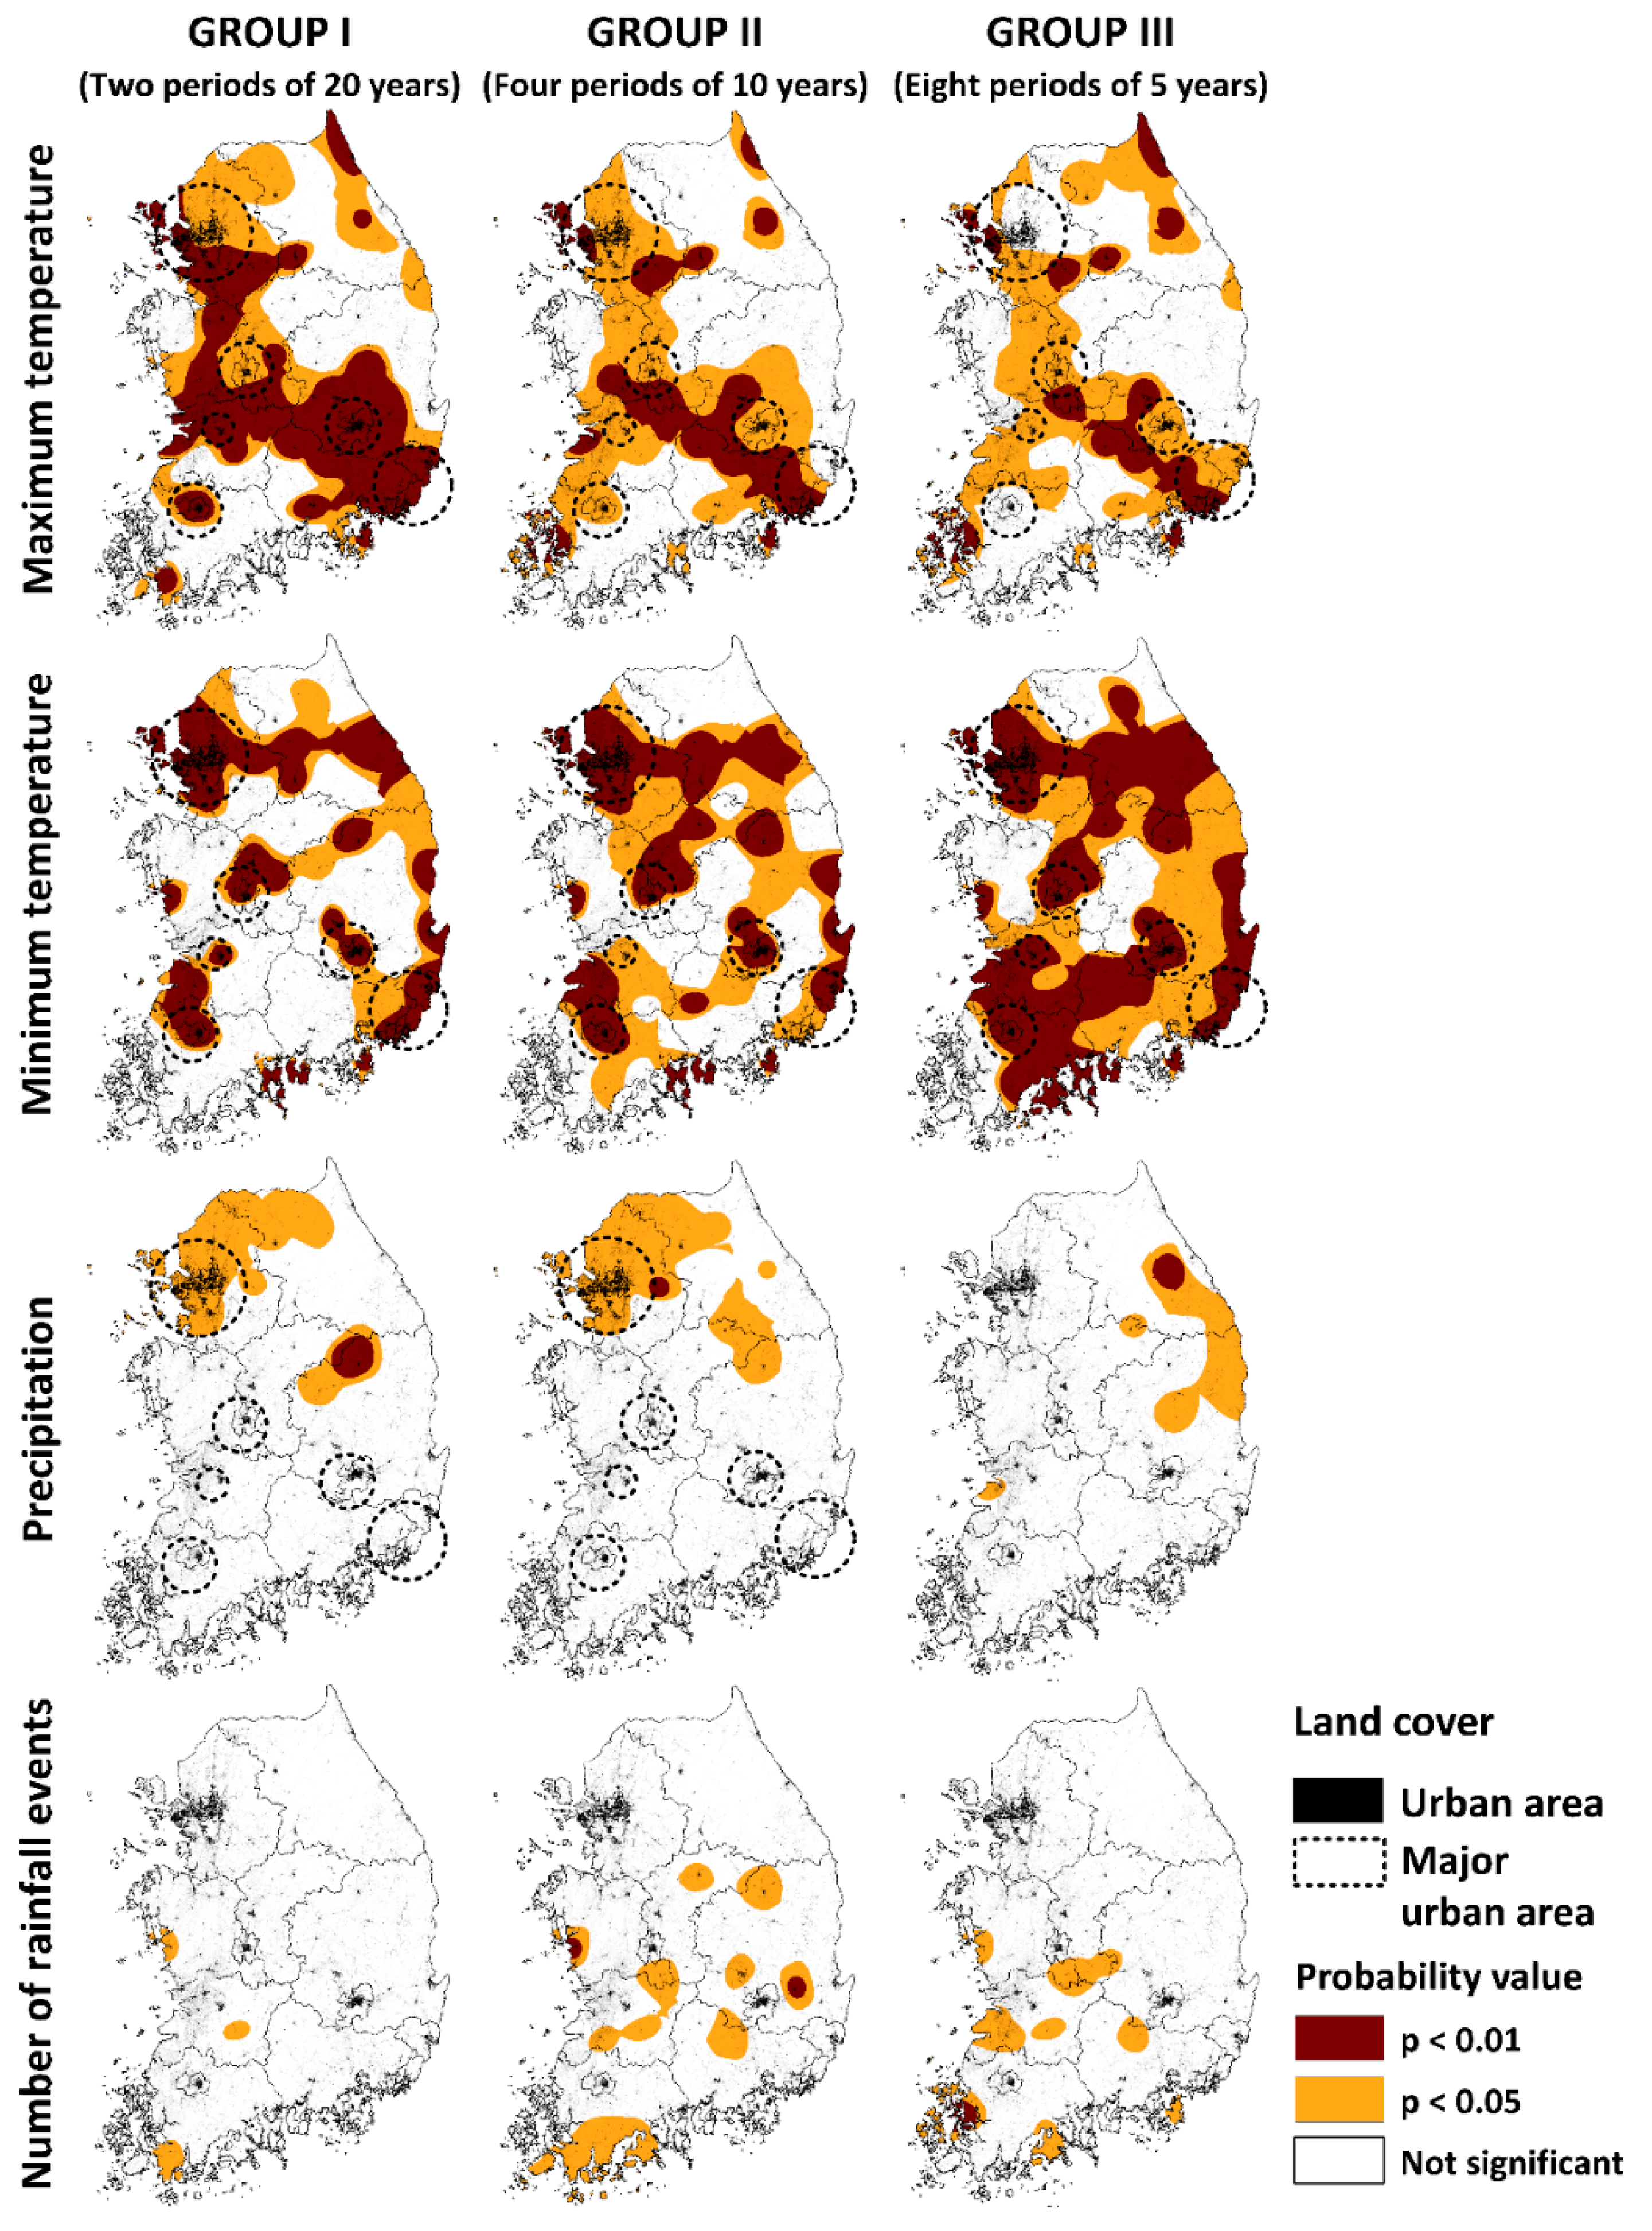
Figure 2 shows the spatial distribution of p-values for each annual meteorological element, according to the group represented. Areas with significant differences in maximum temperature in groups I and II were identified in the northwest (urban), central (agricultural) and southeast (urban) regions. The areas where significant differences in maximum temperature existed were widely distributed in a central–southeast direction for all groups. An analysis of annual minimum temperature showed significant differences in temporal trends for all groups in the vicinity of the urban areas in the northwest, southeast and southwest regions. Spatially, significant differences in minimum temperature were identified in all regions except the central regions in group III. Significant differences in precipitation amounts were found for small areas in the northwest region (urban area corresponding to Seoul) in groups I and II and significant differences in the number of rainfall events were identified for small areas in the central and southwest regions (agricultural areas) in groups II and III.
The results showed that between 1993 and 2012, annual temperatures in urban areas were significantly different compared with the previous 20 years (1973–1992). For groups II and III, the results were mostly similar to those obtained for group I. However, changes in precipitation amounts were identified only in highly urbanized areas corresponding to Seoul and its surroundings. The results show that urbanization might also affect precipitation downwind of the urban areas. It is well established that (1) precipitation anomalies exist within and around cities; (2) that precipitation tends to increase downwind from urban heat islands [37]; and (3) that increases in aerosol concentrations, caused by industrialization, affect long-term variations in precipitation [22]. Further, the heat island effect is not limited to the urban areas, so it can influence large areas [38,39]. Our results indicate that the identified changes in precipitation are likely the result of the urban heat island effect overlapping with global warming in South Korea during the rapid period of urbanization-industrialization [40].
3.2. Timing and Location of Annual Climate Changes
Figure 3 shows the spatial distribution of p-values for each annual meteorological element in comparison to the most recent 10-year period (2003–2012). The results for maximum temperature show that highly-significant differences occurred in the central and southeast regions for the first decade (1973–1982) and in the southeast region for the second decade (1983–1992). There were no significant differences for the third decade (1993–2002).
The maps of minimum temperature show that urban areas in the northwest, southwest and southeast regions had highly-significant differences in minimum temperature during the first and second decades. The minimum temperature change affected a larger area and showed greater significant differences than the maximum temperature change. Statistically-significant changes in minimum temperature continued in the central regions until the third decade.
Maps of precipitation amounts show that areas in the northern regions, associated with the rapid development of Seoul, had highly-significant differences in precipitation amounts during the first decade. However, there were no significant differences identified during the second and third decades. Rainfall event maps indicate that only parts of the northern and southeast regions had significant differences in the number of rainfall events during the third decade, in comparison with the most recent period.
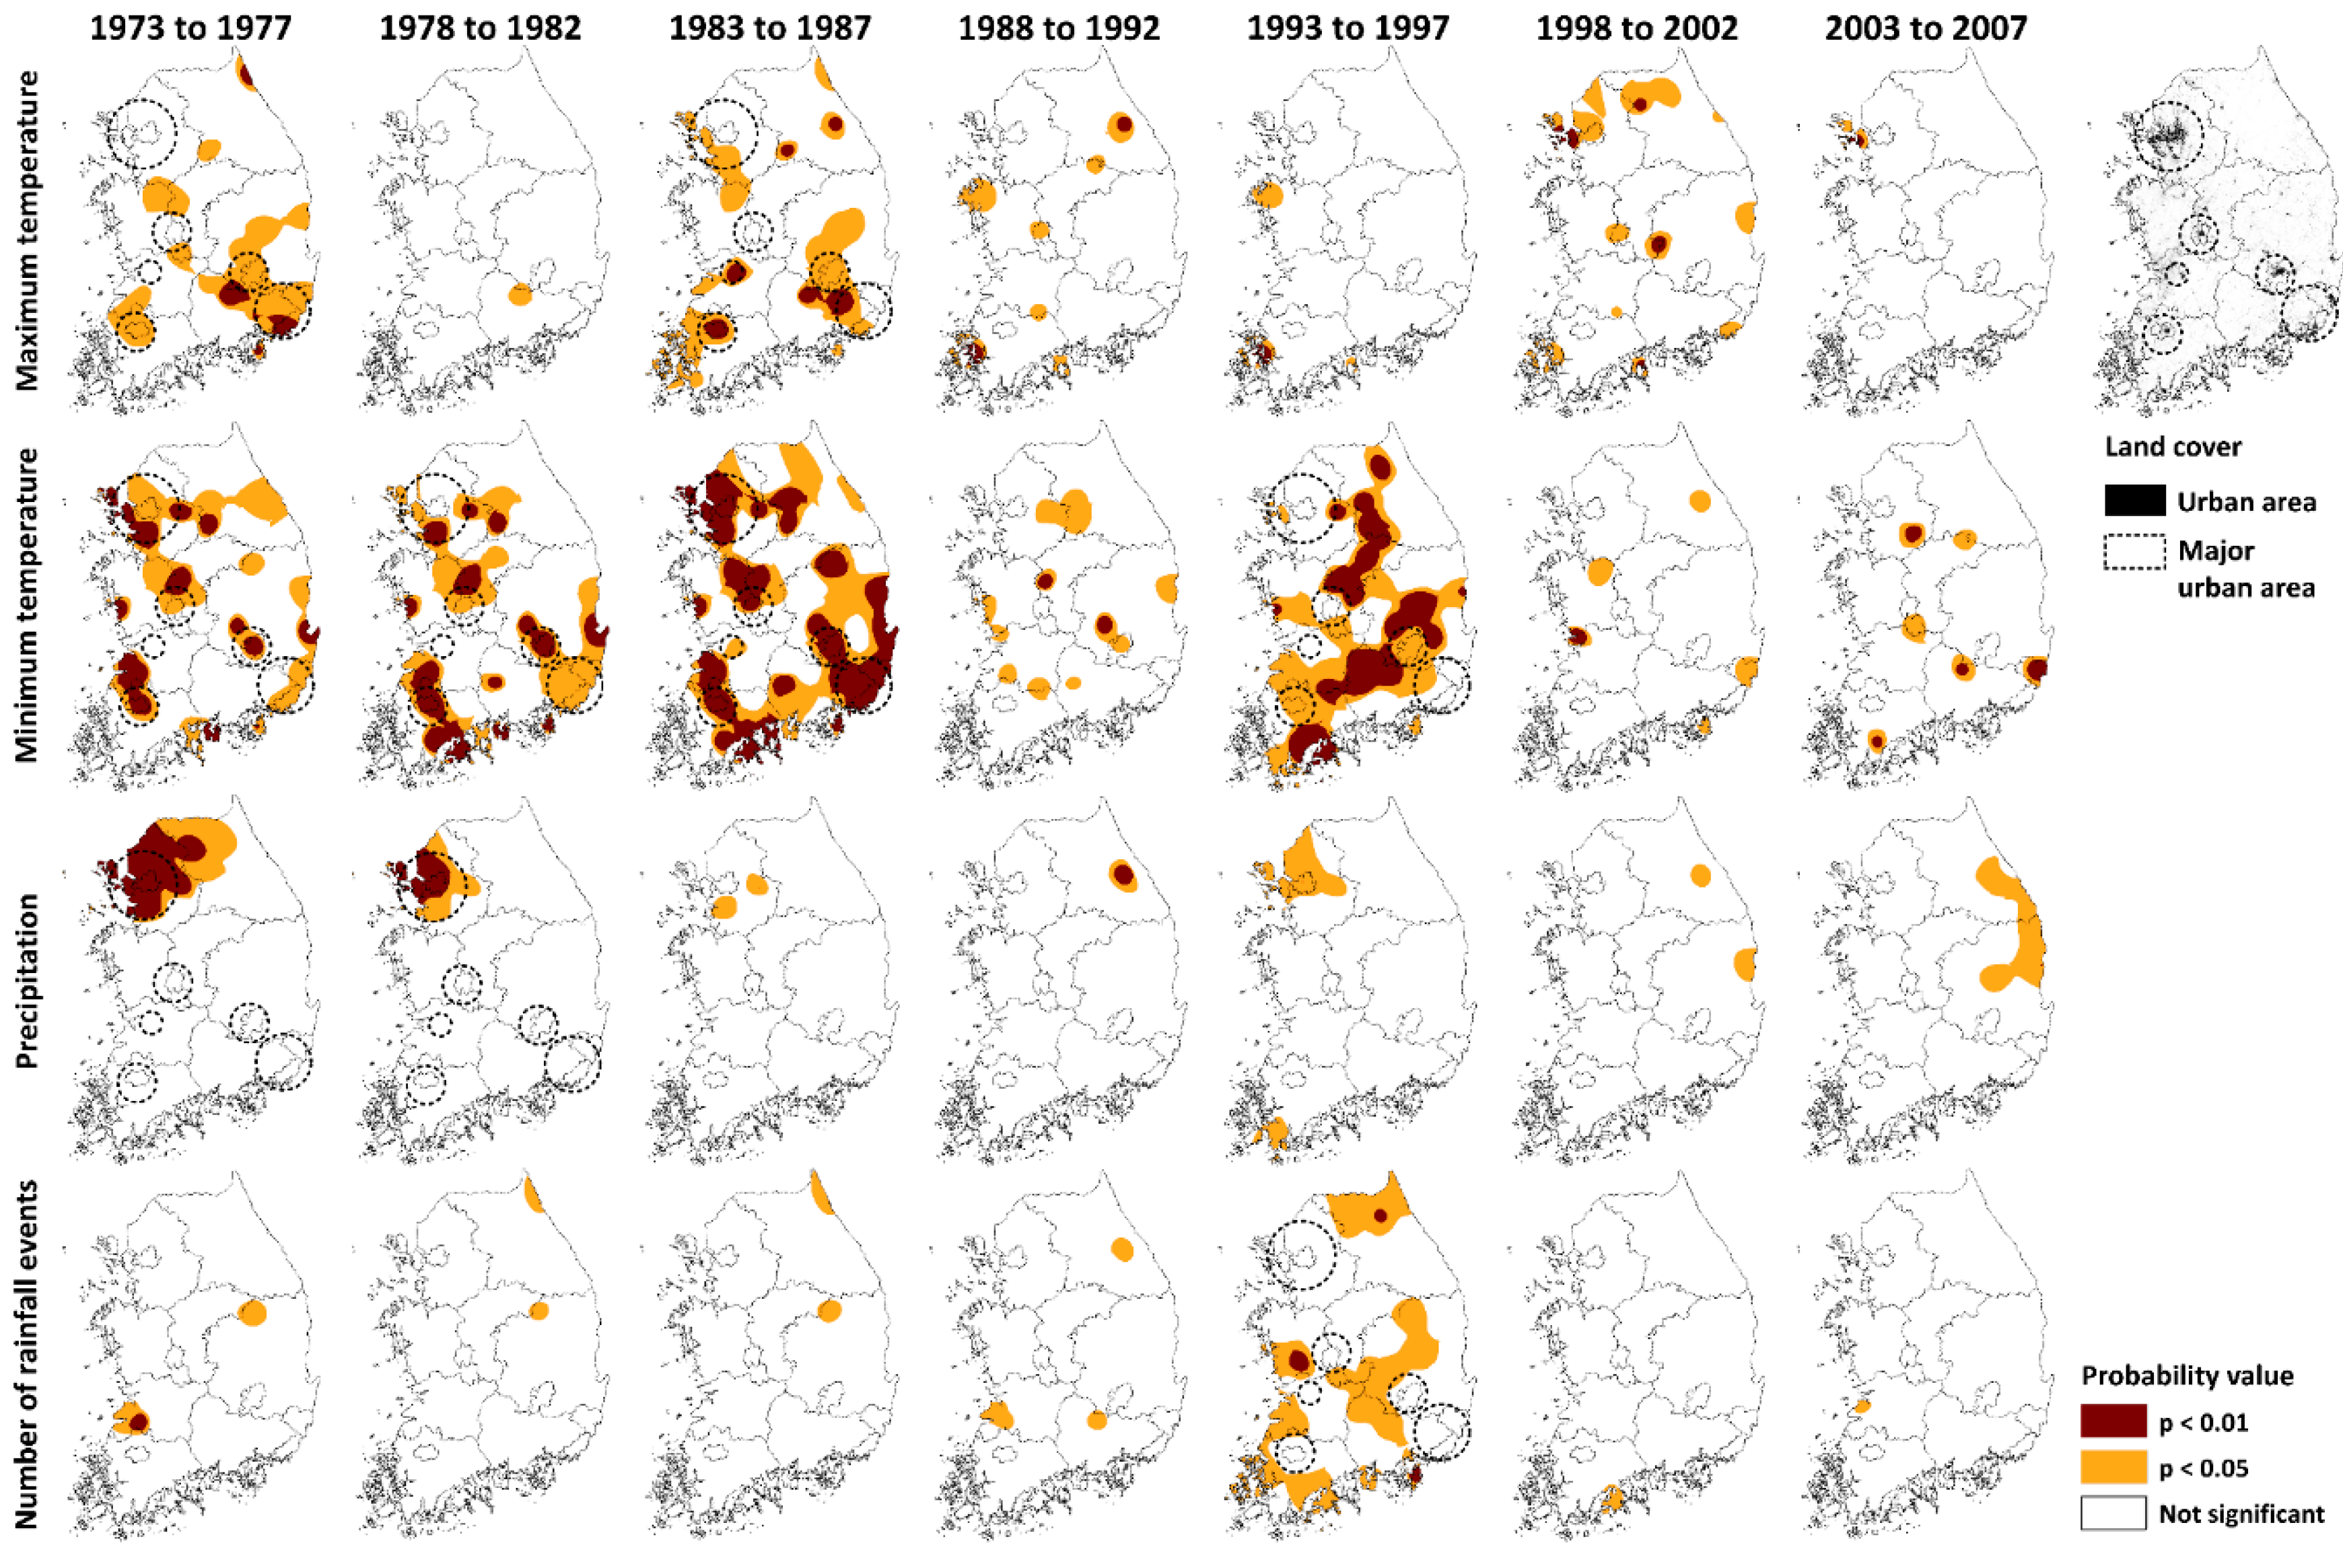
Figure 4 shows the significant differences in maximum temperature for the southeast regions during the first (1973–1977) and third (1983–1987) 5-year periods compared with the latest period (2008–2012). Maps of minimum temperature indicate significant changes in parts of the northwest and southwest regions during the first, second and third 5-year periods. Highly-significant differences in minimum temperature were identified for the third 5-year period (1983–1987) in the southeast region and the fifth 5-year period (1993–1997) in the central and south regions. Overall, minimum temperatures have been constantly increasing at a rate of 0.06 °C per decade during the past 35 years. Compared to these results, global temperatures have increased by 0.2 °C every decade over the last 30 years, beginning in the late 1970s [23]. Areas where significant differences in precipitation amounts occurred during the first and second 5-year periods were identified in the northwest region (an urban area corresponding to Seoul). One of these results is that significant differences in minimum temperature during the fourth 5-year period (1988–1992) were identified in comparison with the third 5-year period (1983–1987) and significant differences in precipitation during the third 5-year period (1983–1987) were identified in comparison with the second 5-year period (1978–1982). It is well known that South Korean temperatures increased in 1988–1989 and that precipitation totals increased in the late 1970s.
Table 1 shows a comparison of temporal changes in minimum and maximum temperatures and precipitation between urban and agricultural regions. With respect to the urban regions, changes in the temperatures increased during the latest decade (2003–2012) from 0.7 to 0.94 °C (4.1 to 5.3%) and from 1.08 to 1.54 °C (13.6 to 18.0%) compared to the first decade (1973–1982). Changes in precipitation amounts in these regions during the latest decade (2003–2012) increased from 17.0 to 44.5% compared with the first decade. Specifically, precipitation amounts in Seoul increased by 24.8% (1983–1992), 27.4% (1993–2002) and 44.5% (2003–2012) compared with the first decade (1973–1982). In contrast, changes to the maximum and minimum temperatures in the agricultural regions shows increases of only 0.42 to 0.71 °C (2.2 to 3.9%) and 0.29 to 0.73 °C (4.5 to 9.7%) respectively. Changes in the precipitation amounts in these regions ranged from 8.5 to 11.7% (Table 1).
Table 2 summarizes the population change for three urban areas and three agriculture areas between 1966 and 2015. Population data of each urban area for the period of 1966–2015 were used for estimating the degree of urbanization. The population increase was biggest in Seoul, 6.8 million from 1966 to 1990. making it a mega city of 10 million. The smallest increase was found in almost agriculture areas. Jeongeup (Agriculture area) showed population decrease during this period, while Daejeon (Urban area) was the biggest in population change.
The results show that there were highly-significant differences between the changes in temperature (especially the minimum temperature) and precipitation amounts in urban and agricultural areas, which indicate that urbanization significantly contributed to temperature and precipitation increases, as evidenced by the link between temperature increases and the growth of urban areas. Several studies on climate change over South Korea have identified urbanization as having an effect on the rising temperature due to global warming, which further reinforces our findings [39,40].
We identified different changes in temporal trends for each meteorological element affected by urbanization and climate change over the past four decades. The maximum temperature changes were observed to be significantly different during 1973–1982 and 1983–1992 as compared with the latest period (2003–2012), while there was no change from 1993–2002 to the latest period. The average increase of the maximum temperature in the region where significant differences were observed during the first and second decades was 0.8 °C (27 stations where significant differences occurred) and 0.6 °C (21 stations), respectively, compared to the latest period. While minimum temperature changes decreased over time, they were also continuously significant until the third decade. The average increases in the minimum temperature in regions where significant differences occurred were 1.1 °C during the first decade (37 stations), 0.9 °C during the second decade (29 stations) and 0.7 °C during the third decade (19 stations). Precipitation amounts were significantly different only during the first decade and no change was observed during the second and third decades. The average increase in precipitation amounts during the first decade in the regions where significant differences were noted was 340 mm (15 stations). The average increase in the number of rainfall events during the third decade was 13 days (17 stations).
Given these results, this research shows that climate change on the South Korean Peninsula has not been continuous since the 1970s. According to the data on maximum temperatures and precipitation, there has been relatively little climate change over the past two decades, while the number of precipitation events was different only in the third decade of the study period. By contrast, when examining minimum temperatures, climate change did occur continuously during the period of this study.
3.3. Analysis of Monthly Climate Changes
p-values were calculated for the monthly statistics based on the group represented. These values were significantly different for each period. The spatial distributions of p-values for the monthly meteorological elements are not shown. The p-value results for group I indicate that significant differences in maximum temperature occurred in February, March and September. The minimum temperature results indicate that parts of the northwest and southeast regions exhibited significant differences in temporal trends in May, June and September, primarily around urban areas. Significant differences in the precipitation amounts in May occurred in small areas in the southeast region. However, highly-significant changes in the number of rainfall events were identified in part of the southwest region in February and August, primarily in the vicinity of agricultural areas.
For groups II and III, temporal trend analysis generally showed similar seasonal and regional results to those of group I. Significant differences in maximum temperature were observed in part of the northeast region and part of the southeast region during February (group II) and March (group III). Group II and III changes in minimum temperature indicated highly-significant differences in parts of the northwest and southeast regions near urban areas during May, June and September. Additionally, group II and III agricultural areas in some parts of the central and southwest regions showed significant differences in minimum temperature during May, June and September. Significant differences in precipitation amounts were observed only in the northwest and central regions during July in group II. Significant differences in the number of group II and III rainfall events were observed primarily in agricultural areas in parts of the southern region during September.
We observed that the temporal trends for monthly maximum or minimum temperatures in all groups had significant differences in February–March, May–June and September, which are transition months between seasons (spring and fall). However, the results for the monthly precipitation amounts did not indicate any significant changes in the temporal trends, except in May in group I and in July in group II. The results for the number of monthly precipitation events indicated highly-significant differences (increases) in the temporal trends for agricultural areas in August and September, although the temporal trends for the precipitation amounts showed no significant differences. A higher number of precipitation events with the same total amount of rainfall per month indicates a decrease in the intensity of the rainfall events in the region. This can be favorable to agriculture in that it reduces the length of dry periods, which decreases water stress for the crops.
3.4. Timing and Location of Monthly Climate Changes
Table 3 shows the results of Duncan’s Multiple Range Tests, focusing on monthly meteorological elements, that were significantly different for 10-year periods compared with the latest period (2003–2012). All of the regions in the study showed highly-significant differences in maximum temperature during the first decade (1973–1982), with the exception of small areas in the southwest and central regions from February to May and small areas in the central and southeast regions from September to November. The average increase in the maximum temperatures for all the meteorological stations in the regions showing significant differences during the first and second decades were 1.9 °C and 2.1 °C in February, 1.3 °C and 1.0 °C in May and 0.9 °C and 1.1 °C in September, respectively, compared with the most recent period.
The minimum temperature shifts indicated that in parts of the northwest and southeast regions (urban areas) and the central and southwest regions (agricultural areas) there were highly-significant differences in May, June and September during the first decade, as compared to the most recent decade. Significant differences in the minimum temperature were observed across the entire country in September. Additionally, significant differences in the minimum temperature were detected for the northwest and southeast regions in May during the second decade (1983–1992) and the central and south regions in September during the third decade (1993–2002). The average increases in the minimum temperature for meteorological stations that had significant differences during the first, second and third decades were 1.4 °C, 1.0 °C and 1.0 °C in May; 1.1 °C, 1.0 °C and 0.9 °C in June; and 2.1 °C, 1.4 °C and 1.7 °C in September, respectively, compared with the latest period.
Significant differences in precipitation totals and rainfall events were only observed for the third decade. Significant differences in precipitation amounts were observed in parts of the southern regions during January and in the central region during July and October. During January, parts of the northwest region showed statistically-significant changes in the number of rainfall events, whereas, for the central and south regions, changes were observed in July and September. The only area with an overlap in significant differences in both precipitation amounts and number of rainfall events was the central region during the month of July.
Table 4 shows changes in precipitation and rainfall events in group II compared with the latest period. The average increase in precipitation amounts during the third decade was 137 mm in July. By contrast, precipitation amounts decreased on average 13 mm in January and 29 mm in October. The average increase in the number of rainfall events during the third decade was approximately 4 days in July, while the number of rainfall events decreased on average approximately 2 days in January and October.
As relates to the results of Duncan’s tests of monthly meteorological elements in the group III periods compared with the latest period (2008–2012), which are shown in Table 5, significant differences in maximum temperature were identified for the central and southwest regions in May between 1973–1977. Significant differences in the maximum temperature were identified for the southern regions in September between 1978–1992. Minimum temperature fluctuations were observed to be significantly different for parts of the northwest and southwest regions in May during the period between 1973–1997. Changes in minimum temperature were significantly different for the southwest region in June between 1973–1987. The entire country indicated highly-significant differences in changes in the minimum temperature in September during 1978–1982 and 1993–1997. Significant differences in precipitation amounts were identified only for the southern regions in October from 1988 to 1992. Significant differences in the number of rainfall events were identified for the southwest region in September between 1993–1997.
The results further show that significant differences in temperature occurred from May to June and in September from 1973–1992, compared with temperatures in 2008–2012. The results for precipitation indicate significant differences in September-October over the time period 1988–1997. The changes in temporal trends for temperature and precipitation occurred locally in the southern regions in transitional months between seasons (spring and fall), likely because of climate change. Urban areas in the northwest and southeast regions of South Korea witnessed statistically-significant changes in temporal trends for monthly temperatures in May, June and September during the first two decades (1973–1982 and 1983–1992), primarily due to the heat island effect. However, changes in monthly precipitation were statistically significant only for January, July and October during the third decade (1993–2002) compared with the latest period (2003–2012).
4. Conclusions
This study reviewed South Korean precipitation and temperature variations related to climate change and urbanization over different time periods. Overall, our findings demonstrate that statistically-significant changes have taken place since the 1970s. Results related to maximum and minimum temperatures show that highly-significant variations have occurred in and around urban and agricultural areas over the past 20 years (1993–2012), as compared with the previous two decades (1973–1992). Our analysis of temperature data also indicated that the climate in urbanized areas has been influenced by the urban heat island effect and affected by climate change related to global warming. As relates to precipitation events, our results indicated significant differences in urban areas, with a highly-significant increase in the number of rainfall events in agricultural areas. Precipitation totals showed no significant differences between 1993–2002 and 2003–2012.
Our findings also identified patterns in temporal trends related to the different meteorological elements. Maximum temperature changes were found to be significantly different between 1973–1992; no change was observed between 1993–2002 and latest period, 2003–2012. Although the intensity of temperature shifts decreased over time, minimum temperature changes were statistically significant until the period of 1993–2002. Also, changes in precipitation totals were statistically significantly during the period from 1973–1982, while the number of precipitation events was significantly different between 1993–2002.
In conclusion, the impacts of climate change in South Korea have not been continuous over time but instead expressed locally and regionally in terms of changes in precipitation and temperature. Construction of a high-resolution, grid-based climatology dataset for South Korea would aid future research related to climate change and urbanization in South Korea and allow for a focus on composite analysis and a more structured comparison and analysis of climate changes occurring in urban, forest and agricultural regions.
Author Contributions
Data curation, E.-M.H. and T.K.; Investigation, Y.-S.C.; Methodology, W.-H.N. and G.A.B.; Resources, E.-M.H. and Y.-S.C.; Software, T.K.; Visualization, T.K.; Writing—Original Draft, W.-H.N.; Writing—Review & Editing, Y.-S.C. and S.F.
Funding
This research was supported by the National Research Foundation of Korea (NRF) grant funded by the Korea government (MSIT; Ministry of Science and ICT) (No. NRF-2017R1C1B5015897) and Korea Institute of Planning and Evaluation for Technology in Food, Agriculture, Forestry and Fisheries (IPET) through Advanced Production Technology Development Program, funded by Ministry of Agriculture, Food and Rural Affairs (MAFRA) (316022-03-1-HD040).
Acknowledgments
This research was developed under the auspices of the Robert B. Daugherty Water for Food Institute (WFI) and the CropClimate Initiative.
Conflicts of Interest
The authors declare no conflicts of interest. The views expressed in this paper are those of the authors and do not necessarily reflect the views of NRF, WFI, IPET, MAFRA or any of its sub-agencies.
References
- Mann, M.E.; Bradley, R.S.; Hughes, M.K. Global-scale temperature patterns and climate forcing over the past six centuries. Nature 1998, 392, 779–787. [Google Scholar] [CrossRef]
- Jones, P.D.; New, M.; Parker, D.E.; Martin, S.; Rigor, I.G. Surface air temperature and its changes over the past 150 years. Rev. Geophys. 1999, 37, 173–199. [Google Scholar] [CrossRef] [Green Version]
- Feng, S.; Hu, Q. Changes in the agro-meteorological indicators in the contiguous United States: 1951–2000. Theor. Appl. Climatol. 2004, 78, 247–264. [Google Scholar] [CrossRef]
- Fan, Z.X.; Brauning, A.; Thomas, A.; Li, J.B.; Cao, K.F. Spatial and temporal temperature trends on the Yunnan Plateau (Southwest China) during 1961–2004. Int. J. Climatol. 2011, 31, 2078–2090. [Google Scholar] [CrossRef]
- Ren, G.; Zhou, Y. Urbanization effect on trends of extreme temperature indices of national stations over Mainland China, 1961–2008. J. Clim. 2014, 27, 2340–2360. [Google Scholar] [CrossRef]
- Jones, P.D.; Hulme, M. Calculating regional climatic time series for temperature and precipitation: Methods and illustrations. Int. J. Climatol. 1996, 16, 361–377. [Google Scholar] [CrossRef]
- Scheneider, S.H. Detecting climatic change signals: Are there any “fingerprints”? Science 1994, 263, 341–347. [Google Scholar] [CrossRef] [PubMed]
- Hegerl, G.C.; von Storch, H.; Hasselmann, K. Detecting greenhouse-gas-induced climate change with an optimal fingerprint method. J. Clim. 1996, 9, 2281–2306. [Google Scholar] [CrossRef]
- Karl, T.R.; Knight, R.W.; Easterling, D.R.; Quayle, R.G. Indices of climate change for the United States. Bull. Am. Meteorol. Soc. 1996, 77, 279–292. [Google Scholar] [CrossRef]
- Monier, E.; Gao, X. Climate change impacts on extreme events in the United States: An uncertainty analysis. Clim. Chang. 2015, 131, 67–81. [Google Scholar] [CrossRef]
- Brunet, M.; Jones, P.D.; Sigro, J.; Saladie, O.; Aguilar, E.; Moberg, A.; Della-Marta, P.M.; Lister, D.; Walther, A.; Lopez, D. Temporal and spatial temperature variability and change over Spain during 1850–2005. J. Geophys. Res. 2007, 112, D12117. [Google Scholar] [CrossRef]
- Lee, M.H.; Ho, C.H.; Kim, J.; Song, C.K. Assessment of the changes in extreme vulnerability over East Asia due to global warming. Clim. Chang. 2012, 113, 301–321. [Google Scholar] [CrossRef]
- Easterling, D.R.; Evans, J.L.; Groisman, P.Y.; Karl, T.R.; Kunkel, K.E.; Ambenje, P. Observed variability and trends in extreme climate events: A brief review. Bull. Am. Meteorol. Soc. 2000, 81, 417–425. [Google Scholar] [CrossRef]
- Trenberth, K.E.; Jones, P.D.; Ambenje, P.; Bojariu, R.; Easterling, D.; Klein Tank, A.; Parker, D.; Rahimzadeh, F.; Renwick, J.A.; Rusticucci, M.; et al. Observations: Surface and Atmospheric Climate Change. In Climate Change 2007: The Physical Science Basis; Cambridge University Press: Cambridge, UK, 2007. [Google Scholar]
- Intergovernmental Panel on Climate Change (IPCC). Climate Change 2013: The Physical Science Basis. Available online: http://www.ipcc.ch/report/ar5/wg1/ (accessed on 2 July 2018).
- Baigorria, G.A.; Jones, J.W. GiST: A stochastic model for generating spatially and temporally correlated daily rainfall data. J. Clim. 2010, 23, 5990–6008. [Google Scholar] [CrossRef]
- Roy, S.S.; Yuan, F. Trends in extreme temperatures in relation to urbanization in the Twin Cities metropolitan area, Minnesota. J. Appl. Meteorol. Climatol. 2009, 48, 669–679. [Google Scholar]
- Fang, F.; Guo, J.; Sun, L.; Wang, J.; Wang, X. The effects of urbanization on temperature trends in different economic periods and geographical environments in northwestern China. Theor. Appl. Climatol. 2014, 116, 227–241. [Google Scholar] [CrossRef]
- Karl, T.R.; Diaz, H.F.; Kukla, G. Urbanization: Its detection and effect in the United States climate record. J. Clim. 1988, 1, 1099–1123. [Google Scholar] [CrossRef]
- Fujibe, F. Detection of urban warming in recent temperature trends in Japan. Int. J. Climatol. 2009, 29, 1811–1822. [Google Scholar] [CrossRef] [Green Version]
- McCarthy, M.P.; Best, M.J.; Betts, R.A. Climate change in cities due to global warming and urban effects. Geophys. Res. Lett. 2010, 37, L09705. [Google Scholar] [CrossRef]
- Choi, Y.S.; Ho, C.H.; Kim, J.; Gong, D.Y.; Park, R.J. The impact of aerosols on the summer rainfall frequency in China. J. Appl. Meteorol. Climatol. 2008, 47, 1802–1813. [Google Scholar] [CrossRef]
- Chung, Y.S.; Yoon, M.B.; Kim, H.S. On climate variations and changes observed in South Korea. Clim. Chang. 2004, 66, 151–161. [Google Scholar] [CrossRef]
- Choi, K.S.; Kim, D.W.; Byun, H.R. The regime shift in the early 1980s of spring precipitation in Korea. Int. J. Climatol. 2010, 30, 721–732. [Google Scholar] [CrossRef]
- Park, J.S.; Kang, H.S.; Lee, Y.S.; Kim, M.K. Changes in the extreme daily rainfall in South Korea. Int. J. Climatol. 2011, 31, 2290–2299. [Google Scholar] [CrossRef]
- Im, E.S.; Jung, I.W.; Bae, D.H. The temporal and spatial structures of recent and future trends in extreme indices over Korea from a regional climate projection. Int. J. Climatol. 2011, 31, 72–86. [Google Scholar] [CrossRef]
- Jung, S.H.; Choi, Y.E.; Oh, J.H.; Lim, G.H. Recent trends in temperature and precipitation over South Korea. Int. J. Climatol. 2002, 22, 1327–1337. [Google Scholar] [CrossRef] [Green Version]
- Ho, C.H.; Lee, J.Y.; Ahn, M.H.; Lee, H.S. A sudden change in summer rainfall characteristics in Korea during the late 1970s. Int. J. Climatol. 2003, 23, 117–128. [Google Scholar] [CrossRef] [Green Version]
- Nam, W.H.; Hong, E.H.; Choi, J.Y. Has climate change already affected the spatial distribution and temporal trends of reference evapotranspiration in South Korea? Agric. Water Manag. 2015, 150, 129–138. [Google Scholar] [CrossRef]
- Nam, W.H.; Hong, E.M.; Baigorria, G.A. How climate change has affected the spatio-temporal patterns of precipitation and temperature at various time scales in North Korea. Int. J. Climatol. 2016, 36, 722–734. [Google Scholar] [CrossRef]
- Baigorria, G.A.; Jones, I.W.; O’Brien, J.J. Understanding rainfall spatial variability in southeast USA at different timescales. Int. J. Climatol. 2007, 27, 749–760. [Google Scholar] [CrossRef] [Green Version]
- Gastwirth, J.L.; Gel, Y.R.; Miao, W. The impact of Levene’s test of equality of variances on statistical theory and practice. Stat. Sci. 2009, 24, 343–360. [Google Scholar] [CrossRef]
- Levene, H. Robust Test for Equality of Variances. In Contributions to Probability and Statistics: Essays in Honour of Harold Hotelling; Olkin, I., Ghurye, S.G., Hoeffding, W., Madow, W.G., Mann, H.B., Eds.; Stanford University Press: Palo Alto, CA, USA, 1960. [Google Scholar]
- Duncan, D.B. Multiple range and multiple F tests. Biometrics 1955, 11, 1–42. [Google Scholar] [CrossRef]
- Ly, S.; Charles, C.; Degre, A. Geostatistical interpolation of daily rainfall at catchment scale: The use of several variogram models in the Ourthe and Ambleve catchment, Belguim. Hydrol. Earth Syst. Sci. 2011, 15, 2259–2274. [Google Scholar] [CrossRef]
- Shepard, D.S. A Two-Dimensional Interpolation Function for Irregularly-Spaced Data. In Proceedings of the 1968 ACM National Conference, Las Vegas, NV, USA, 27–29 August 1968; pp. 517–524. [Google Scholar]
- Han, J.Y.; Baik, J.J.; Lee, H. Urban impacts on precipitation. Asia Pac. J. Atmos. Sci. 2014, 50, 17–30. [Google Scholar] [CrossRef]
- DeGaetano, A.T.; Allen, R.J. Trends in twentieth-century temperature extremes across the United States. J. Clim. 2002, 15, 3188–3205. [Google Scholar] [CrossRef]
- Li, Q.; Zhang, H.; Liu, X.; Huang, J. Urban heat island effect on annual mean temperature during the last 50 years in China. Theor. Appl. Climatol. 2004, 79, 165–174. [Google Scholar] [CrossRef]
- Chung, U.; Choi, J.; Yun, J.I. Urbanization effect on the observed change in mean monthly temperatures between 1951–1980 and 1971–2000 in Korea. Clim. Chang. 2004, 66, 127–136. [Google Scholar] [CrossRef]
Figure 1.
Spatial distribution of the weather stations and their land coverage areas (Korean Water Management Information System).
Figure 1.
Spatial distribution of the weather stations and their land coverage areas (Korean Water Management Information System).

Figure 2.
Spatial distribution of p-values for different groups related to annual meteorological elements with F-test statistics from ANOVA. The degree of statistical significance (p < 0.01; p < 0.05; no significance) after comparing each group is shown. Brown and orange represent statistically significant p-values. White represents no significant correlation.

Figure 3.
Maps of Duncan’s Multiple Range Test p-values for annual group II meteorological elements. The level of statistical significance (p < 0.01; p < 0.05; no significance) after comparing the latest period (2003 to 2012) is shown. Brown and orange represent statistically significant p-values. White represents no significant correlation.

Figure 4.
Maps of Duncan’s Multiple Range Test p-values for annual group III meteorological elements. The level of statistical significance (p < 0.01; p < 0.05; no significance) after comparing the latest period (2008 to 2012) is shown. Brown and orange represent statistically significant p-values. White represents no significant correlation.


Table 1.
The mean annual maximum/minimum temperatures and precipitation between urban and agricultural areas in Group II (Four periods of 10 years).
Table 1.
The mean annual maximum/minimum temperatures and precipitation between urban and agricultural areas in Group II (Four periods of 10 years).
| Regions | Maximum Temperature (°C) | Minimum Temperature (°C) | Precipitation (mm) | ||||||||||
|---|---|---|---|---|---|---|---|---|---|---|---|---|---|
| 1973 to 1982 | 1983 to 1992 | 1993 to 2002 | 2003 to 2012 | 1973 to 1982 | 1983 to 1992 | 1993 to 2002 | 2003 to 2012 | 1973 to 1982 | 1983 to 1992 | 1993 to 2002 | 2003 to 2012 | ||
| Urban areas | Seoul | 16.75 | 16.80 (+0.05) | 17.02 (+0.27) | 17.45 (+0.70) | 7.94 | 8.22 (+0.28) | 8.89 (+0.95) | 9.02 (+1.08) | 1135 | 1416 (+281) | 1446 (+311) | 1640 (+505) |
| Daejeon | 17.67 | 18.11 (+0.44) | 18.13 (+0.46) | 18.61 (+0.94) | 7.23 | 7.72 (+0.49) | 8.02 (+0.79) | 8.44 (+1.21) | 1247 | 1354 (+107) | 1401 (+154) | 1475 (+228) | |
| Daegu | 18.97 | 19.32 (+0.35) | 19.67 (+0.70) | 19.75 (+0.78) | 8.55 | 9.06 (+0.51) | 9.74 (+1.19) | 10.09 (+1.54) | 968 | 1050 (+82) | 1089 (+121) | 1133 (+165) | |
| Agriculture areas | Jeongeup | 18.19 | 18.82 (+0.63) | 18.83 (+0.64) | 18.90 (+0.71) | 7.54 | 7.85 (+0.31) | 8.16 (+0.62) | 8.27 (+0.73) | 1264 | 1265 (+1) | 1312 (+48) | 1372 (+108) |
| Namwon | 18.82 | 19.13 (+0.31) | 19.06 (+0.24) | 19.24 (+0.42) | 6.40 | 6.67 (+0.27) | 6.42 (+0.02) | 6.69 (+0.29) | 1282 | 1367 (+85) | 1339 (+57) | 1432 (+150) | |
| Jinju | 19.10 | 19.19 (+0.09) | 19.72 (+0.62) | 19.78 (+0.68) | 7.57 | 7.61 (+0.04) | 7.70 (+0.13) | 7.97 (+0.40) | 1460 | 1521 (+61) | 1497 (+37) | 1589 (+129) | |
Units: difference in parentheses compared with the first decade (1973–1982).
Table 2.
Comparison of population between urban and agricultural areas.
| Regions | Latitude (°) | Longitude (°) | 1966 | 1970 | 1975 | 1980 | 1985 | 1990 | 1995 | 2000 | 2005 | 2010 | 2015 | |
|---|---|---|---|---|---|---|---|---|---|---|---|---|---|---|
| Urban areas | Seoul | 37.57 | 126.97 | 3.793 | 5.525 (146%) | 6.879 (181%) | 8.351 (220%) | 9.626 (254%) | 10.603 (280%) | 10.217 (269%) | 9.854 (260%) | 9.763 (257%) | 9.631 (254%) | 9.904 (261%) |
| Daejeon | 36.37 | 127.37 | 0.315 | 0.414 (131%) | 0.506 (161%) | 0.651 (207%) | 0.866 (275%) | 1.050 (333%) | 1.272 (404%) | 1.368 (434%) | 1.443 (458%) | 1.502 (477%) | 1.538 (488%) | |
| Daegu | 35.89 | 128.62 | 0.845 | 1.081 (128%) | 1.309 (155%) | 1.604 (190%) | 2.028 (240%) | 2.228 (264%) | 2.445 (289%) | 2.474 (293%) | 2.456 (291%) | 2.432 (288%) | 2.466 (292%) | |
| Agriculture areas | Jeongeup | 35.56 | 126.87 | 0.278 | 0.259 (93%) | 0.248 (89%) | 0.221 (79%) | 0.200 (72%) | 0.185 (67%) | 0.139 (50%) | 0.129 (46%) | 0.115 (41%) | 0.109 (39%) | 0.111 (40%) |
| Namwon | 35.41 | 127.33 | - | - | - | - | 0.061 | 0.063 (103%) | 0.104 (170%) | 0.095 (156%) | 0.086 (141%) | 0.078 (128%) | 0.080 (131%) | |
| Jinju | 35.16 | 128.04 | 0.254 | 0.254 (100%) | 0.271 (107%) | 0.303 (119%) | 0.311 (122%) | 0.329 (130%) | 0.330 (130%) | 0.339 (133%) | 0.336 (132%) | 0.335 (132%) | 0.350 (138%) | |
Units: million, percentage (%) of difference in parentheses compared with the first year (1966 or 1985).
Table 3.
Duncan’s multiple range tests of p-values for monthly meteorological elements with the F-test statistics from ANOVA in Group II (Four periods of 10 years) compared with 2003–2012.
Table 3.
Duncan’s multiple range tests of p-values for monthly meteorological elements with the F-test statistics from ANOVA in Group II (Four periods of 10 years) compared with 2003–2012.
| Month | Maximum Temperature (°C) | Minimum Temperature (°C) | Precipitation (mm) | Number of Rainfall Events | ||||||||
|---|---|---|---|---|---|---|---|---|---|---|---|---|
| 1973 to 1982 | 1983 to 1992 | 1993 to 2002 | 1973 to 1982 | 1983 to 1992 | 1993 to 2002 | 1973 to 1982 | 1983 to 1992 | 1993 to 2002 | 1973 to 1982 | 1983 to 1992 | 1993 to 2002 | |
| January | 2 | 2 | 2 | - | - | 2 | 2 | - | 31 | 7 | 20 | 24 |
| February | 33 | 24 | - | 20 | 2 | - | 2 | - | - | 2 | 15 | 17 |
| March | 6 | 9 | 6 | 35 | 4 | 2 | - | - | - | 6 | - | 4 |
| April | 2 | 4 | 4 | 22 | 20 | - | - | - | - | 2 | 7 | 17 |
| May | 30 | 20 | 9 | 70 | 65 | 22 | - | 11 | 7 | - | 9 | 2 |
| June | 35 | 20 | 15 | 54 | 41 | 26 | - | - | - | - | 2 | - |
| July | - | - | 7 | - | 6 | - | 33 | 7 | 46 | 11 | 6 | 57 |
| August | 4 | - | - | 33 | 13 | 4 | - | 11 | - | 13 | 22 | - |
| September | 20 | 28 | 2 | 83 | 31 | 48 | 6 | - | - | 33 | - | 52 |
| October | 6 | 26 | 6 | 48 | 41 | - | 22 | - | 28 | 19 | - | 19 |
| November | 43 | 6 | - | 33 | 31 | 6 | - | - | - | - | - | - |
| December | - | 6 | 6 | - | - | 2 | 6 | 2 | - | 2 | 2 | 6 |
Units: percentage (%) of meteorological stations of significant at the 0.05 probability level.
Table 4.
The mean annual precipitation and the number of rainfall events for 54 meteorological stations in Group II (Four periods of 10 years).
Table 4.
The mean annual precipitation and the number of rainfall events for 54 meteorological stations in Group II (Four periods of 10 years).
| Meteorological Elements | Month | 1973 to 1982 | 1983 to 1992 | 1993 to 2002 | 2003 to 2012 |
|---|---|---|---|---|---|
| Precipitation (mm, stand deviation in parentheses) | January | 26.7 (9.4) | 32.5 (9.3) | 33.3 (12.0) | 19.7 (7.5) |
| July | 238.2 (41.5) | 300.8 (57.2) | 240.3 (53.7) | 377.1 (73.6) | |
| October | 57.5 (16.0) | 50.8 (20.9) | 67.7 (16.0) | 38.9 (12.7) | |
| Number of rainfall events (days, stand deviation in parentheses) | January | 6.4 (1.8) | 6.7 (1.9) | 7.0 (2.0) | 5.2 (1.8) |
| July | 13.5 (1.0) | 14.4 (1.3) | 12.5 (1.2) | 16.1 (1.3) | |
| October | 6.5 (0.7) | 5.6 (0.9) | 6.1 (0.8) | 4.7 (0.8) |
Table 5.
Duncan’s multiple range tests of p-values for monthly meteorological elements with the F-test statistics from ANOVA in Group III (Eight periods of 5 years) compared with 2008–2012.
Table 5.
Duncan’s multiple range tests of p-values for monthly meteorological elements with the F-test statistics from ANOVA in Group III (Eight periods of 5 years) compared with 2008–2012.
| Month | Maximum Temperature (°C) | Minimum Temperature (°C) | Precipitation (mm) | Number of Rainfall Events | ||||||||||||||||||||||||
|---|---|---|---|---|---|---|---|---|---|---|---|---|---|---|---|---|---|---|---|---|---|---|---|---|---|---|---|---|
| P1 | P2 | P3 | P4 | P5 | P6 | P7 | P1 | P2 | P3 | P4 | P5 | P6 | P7 | P1 | P2 | P3 | P4 | P5 | P6 | P7 | P1 | P2 | P3 | P4 | P5 | P6 | P7 | |
| January | - | - | - | 7 | 2 | 2 | 2 | - | - | - | 9 | - | 7 | 2 | - | 4 | - | - | - | 13 | - | 2 | 11 | 4 | 20 | 4 | 30 | 2 |
| February | - | - | 20 | - | 2 | - | - | - | - | - | - | - | - | - | - | - | - | - | - | - | - | - | - | 4 | 6 | 11 | - | - |
| March | - | - | 2 | 2 | - | 15 | - | 30 | 17 | 19 | - | 9 | 4 | - | - | - | - | - | - | 6 | - | - | 6 | - | - | - | 9 | - |
| April | - | - | 2 | 2 | - | 7 | - | 17 | 11 | 2 | 6 | 2 | 2 | - | 57 | - | - | - | 4 | - | - | 6 | 4 | - | 4 | 26 | - | - |
| May | 59 | - | 4 | 22 | 22 | 2 | 4 | 48 | 56 | 35 | 39 | 39 | - | - | - | - | - | 4 | - | - | 2 | 4 | - | 7 | - | - | 4 | - |
| June | 33 | 9 | 4 | 15 | 11 | 7 | - | 57 | 13 | 31 | 7 | 17 | 17 | 2 | - | - | - | - | - | - | - | 2 | - | - | - | - | - | - |
| July | - | - | 13 | 7 | - | 6 | 13 | 2 | - | 30 | 11 | 4 | 11 | 11 | 6 | 6 | 2 | 2 | 4 | 4 | - | 4 | - | 6 | 2 | 15 | 4 | - |
| August | - | 4 | - | 2 | - | 4 | - | 2 | 9 | - | 13 | - | 4 | - | 2 | - | 2 | 15 | - | - | 2 | 9 | 2 | - | 31 | - | - | - |
| September | 4 | 48 | 33 | 24 | 2 | 6 | 11 | 9 | 94 | 7 | 20 | 93 | - | - | - | - | - | - | 2 | 4 | - | - | 2 | - | 6 | 37 | 2 | 9 |
| October | 2 | - | 4 | 4 | 6 | 7 | - | 15 | 46 | 4 | 56 | 28 | - | - | 6 | - | 9 | 37 | - | 15 | - | 13 | - | 15 | - | - | 26 | - |
| November | - | - | - | - | - | - | 4 | 6 | 2 | 4 | - | - | 2 | - | - | - | - | - | - | 2 | - | - | - | - | 2 | - | 2 | 2 |
| December | - | 2 | - | 59 | 7 | 17 | - | - | - | - | 39 | 2 | 7 | - | - | 2 | - | - | - | - | 4 | - | - | - | - | 13 | 7 | 6 |
Units: percentage (%) of meteorological stations of significant at the 0.05 probability level, P1: 1973 to 1977, P2: 1978 to 1982, P3: 1983 to 1987, P4: 1988 to 1992, P5: 1993 to 1997, P6: 1998 to 2002, P7: 2003 to 2007.
© 2018 by the authors. Licensee MDPI, Basel, Switzerland. This article is an open access article distributed under the terms and conditions of the Creative Commons Attribution (CC BY) license (http://creativecommons.org/licenses/by/4.0/).
Share and Cite
MDPI and ACS Style
Nam, W.-H.; Baigorria, G.A.; Hong, E.-M.; Kim, T.; Choi, Y.-S.; Feng, S. The Fingerprint of Climate Change and Urbanization in South Korea. Atmosphere 2018, 9, 273. https://doi.org/10.3390/atmos9070273
AMA Style
Nam W-H, Baigorria GA, Hong E-M, Kim T, Choi Y-S, Feng S. The Fingerprint of Climate Change and Urbanization in South Korea. Atmosphere. 2018; 9(7):273. https://doi.org/10.3390/atmos9070273
Chicago/Turabian StyleNam, Won-Ho, Guillermo A. Baigorria, Eun-Mi Hong, Taegon Kim, Yong-Sang Choi, and Song Feng. 2018. "The Fingerprint of Climate Change and Urbanization in South Korea" Atmosphere 9, no. 7: 273. https://doi.org/10.3390/atmos9070273
Note that from the first issue of 2016, this journal uses article numbers instead of page numbers. See further details here.