Rainfall Detection and Rainfall Rate Estimation Using Microwave Attenuation


1
Geo-Sciences Institute, Pukyong National University, 45, Yongso-Ro, Nam-Gu, Busan 48513, Korea
2
Department of Environmental Atmospheric Sciences, Pukyong National University, 45, Yongso-Ro, Nam-Gu, Busan 48513, Korea
*
Author to whom correspondence should be addressed.
Atmosphere 2018, 9(8), 287; https://doi.org/10.3390/atmos9080287
Submission received: 8 February 2018
/
Revised: 6 July 2018
/
Accepted: 20 July 2018
/
Published: 24 July 2018
(This article belongs to the Special Issue Precipitation: Measurement and Modeling)
Abstract
:Eight microwave links operating at frequencies ranging from 6 to 8 GHz and with path lengths ranging from 5.7 to 37.4 km traversing the city of Seoul, Korea are used to detect rainfall and estimate path-averaged rainfall rates. Rainfall detection using rain-induced attenuation (dB) was validated by rain detectors installed at automatic weather stations, and the results confirmed that microwave links can be used to detect rainfall with an accuracy ≥80%. The power-law R-k relationships between rain-induced specific attenuation, k (dB km−1), and the rainfall rate, R (mm h−1), were established and cross-validated by estimating the path-averaged rainfall rate. The mean bias of the path-averaged rainfall rate, as compared to the rainfall rate from ground rain gauges, was between −3 and 1 mm h−1. The improved accuracy of rainfall detection led to the improved accuracy of the path-averaged rainfall rate. Hence, it was confirmed that microwave links, used for broadcasting and media communications, can identify rainy or dry periods (rain spells or dry spells) in a way comparable to rain detectors and provide high time-resolution rainfall rates in real time.
1. Introduction
Rainfall observations are commonly conducted using rain gauge observation networks in conjunction with weather radar networks. Weather radar can provide a wide range of rainfall distribution information. For example, the radar observation network operated by the Korea Meteorological Administration (KMA) has a relatively high density and is installed at positions suitable for monitoring the sea and a wide watershed area; thus, it is suited to the peninsular part of the country because it can observe offshore rainfall heading inland. However, observation failures with respect to rainfall that occurs farther inland and flood frequency in urban areas represent limitations in the current rainfall monitoring system. Radars can capture rainfall structure at the mesoscale; however, the typical spatial and temporal resolution of radar’s gridded precipitation product is too low for urban hydrological applications [1]. Weather radar does not directly measure rainfall, but instead measures reflected energy using electromagnetic waves, which scan hundreds of meters above the Earth’s surface (i.e., 1 or 2 km of altitude at 100 km) with its volume scan increasing with the square of its distance from the weather radar. The reflected energy may also be due to obstructions from the local topography [2]. Therefore, weather radar often encounters errors when observing near-surface rainfall. One such error is the conversion of rainfall particle reflectivity (Z) to an accurate rainfall rate using the Z-R relationship expressed as a series of power functions related to the ground rainfall rate (R). As a result, radar rainfall estimation over a volume may be prone to errors because of the averaging of nonlinear functions [3]. Uijlenhoet et al. [4] confirmed that the parameters (a,b) of the Z-R relationship will provide different estimates within the same heavy rainfall system and suggested that applying a single Z-R relationship is a cause of error in quantitative rainfall estimation. Since the Z-R parameters are often derived from rain gauges or disdrometers at small scales, whereas the radar pixels are large (≥1 km2), the resulting estimated rainfall rate would be inaccurate, particularly for lower-resolution radars. Another source of error could be the changing nature of rainfall over time, with convective and stratiform rainfall occasionally. Bright band contamination and radar calibration errors could be other contributing factors in rainfall estimation errors from weather radar systems [4,5].
Rain gauges, conversely, are observational instruments capable of accurately and directly measuring near-surface rainfall. However, these instruments do not provide rainfall information at high spatial resolutions, and observational errors may be introduced into their measurements by strong ground winds or calibration errors. Particularly, in the case of tipping-bucket rain gauges (widely used for automatic rainfall observations globally due to easy digitization of the signals), rainfall data may vary significantly depending on whether the center or the edge of the rain cell passes over the rain gauge. Rahimi et al. [2] reported that tipping-bucket rain gauges are vulnerable to a host of potential problems. Tipping-bucket rain gauges also exhibit instrumental limitations when the 1-min tip data are converted into 1-min rainfall rates; errors may occur depending on the resolution of the rain gauge [6,7].
A microwave link is a point-to-point radio system that connects two remote locations. It features a radio unit and a directional antenna transmitting a radio signal from one site to another, where the signal is received by yet another unit [1]. The microwave links typically cover a range of a few kilometers at a height of a few tens of meters above the surface [8]. Since the first proposed method of path-averaged rainfall rate estimation using microwave attenuation by Atlas and Ulbrich [9], the path-averaged rainfall rate has been estimated using microwave links (10–30 GHz) by Olsen et al. [10], Kramer et al. [11], Messer et al. [12], Overeem et al. [13], and Mercier et al. [14]. In Israel, the application of the 10–40 GHz wavelength, which can complement the rain gauges and weather radar networks, has been proposed for its usability [15,16,17,18]. Microwave links, through which very high temporal resolution data can be observed and compared with rain gauge data, are useful for estimating accurate near-surface rainfall rates in urban areas [19,20] and can also be used to estimate variations in drop size distribution (DSD) [21]. The path-averaged rainfall rate also provides new rainfall information for ground adjustment of weather radar rainfall estimates [22]. A microwave link can be thought of as a range of profiles of DSDs through which an electromagnetic wave propagates [8]. Bulk rainfall variables, such as rainfall rate, specific attenuation, and radar reflectivity factor, depend on this DSD and can be computed from it [23]. Berne and Uijlenhoet [8] investigated the influence of the spatial variability of rainfall along the link on the accuracy of the rainfall estimates using single-frequency links operating at frequencies ranging from 5 to 50 GHz and with lengths ranging from 500 m to 30 km. Transmitted and received microwave signal levels in the frequency bands (5–50 GHz) can be used to estimate the path-averaged rainfall rate since they are attenuated by rainfall. On a different scale, Overeem et al. [24] estimated rainfall in 15-min intervals and retrieved the spatiotemporal dynamics of the rainfall using a network of 2400 microwave links that operate at frequencies ranging from 13 to 40 GHz. Rainfall intensity distributions were then reconstructed from seven cellular microwave links that have lengths of 1–17 km and operate at frequencies of 8–23 GHz [12]. Fencl et al. [25] investigate the effects of different topologies of microwave link networks on the retrieved spatio-temporal rainfall dynamics over an urban catchment and reported that most microwave links capture microscale rainfall variability very well. Barthès and Mallet [26] used Ku-band microwave sources on geostationary satellites to estimate rainfall.
Accurate path-averaged rainfall rate estimations were also found to be possible using 7 GHz microwave links, which are lower in frequency compared with the European and Israeli links, in areas where convective rainfall is predominant, such as West Africa [27]. Ramos et al. [28] found attenuation values on the order of 6 dB for a microwave link operating at 5.52 GHz and 18 km in length even though the International Telecommunication Union recommendation (ITU-RP.838-3) states that rain attenuation for frequencies below 6 GHz can be neglected.
Accurate, high-resolution, near-surface rainfall rate measurements are essential for meteorology, hydrology, agriculture, and environmental policy. Moreover, short-term weather forecasts and continuous and accurate observations of near-surface rainfall rates are important for flood forecasting, urban drainage management, and water management. Although the theoretical basis of this approach is outlined quite well by previous studies, there are few practical applications in operational settings, especially in Korea [3]. This study investigates the potential of eight microwave links operating at low frequencies ranging from 6 to 8 GHz in Seoul, Korea to detect rainfall and estimate the path-averaged rainfall.
2. Materials
2.1. Experimental Site
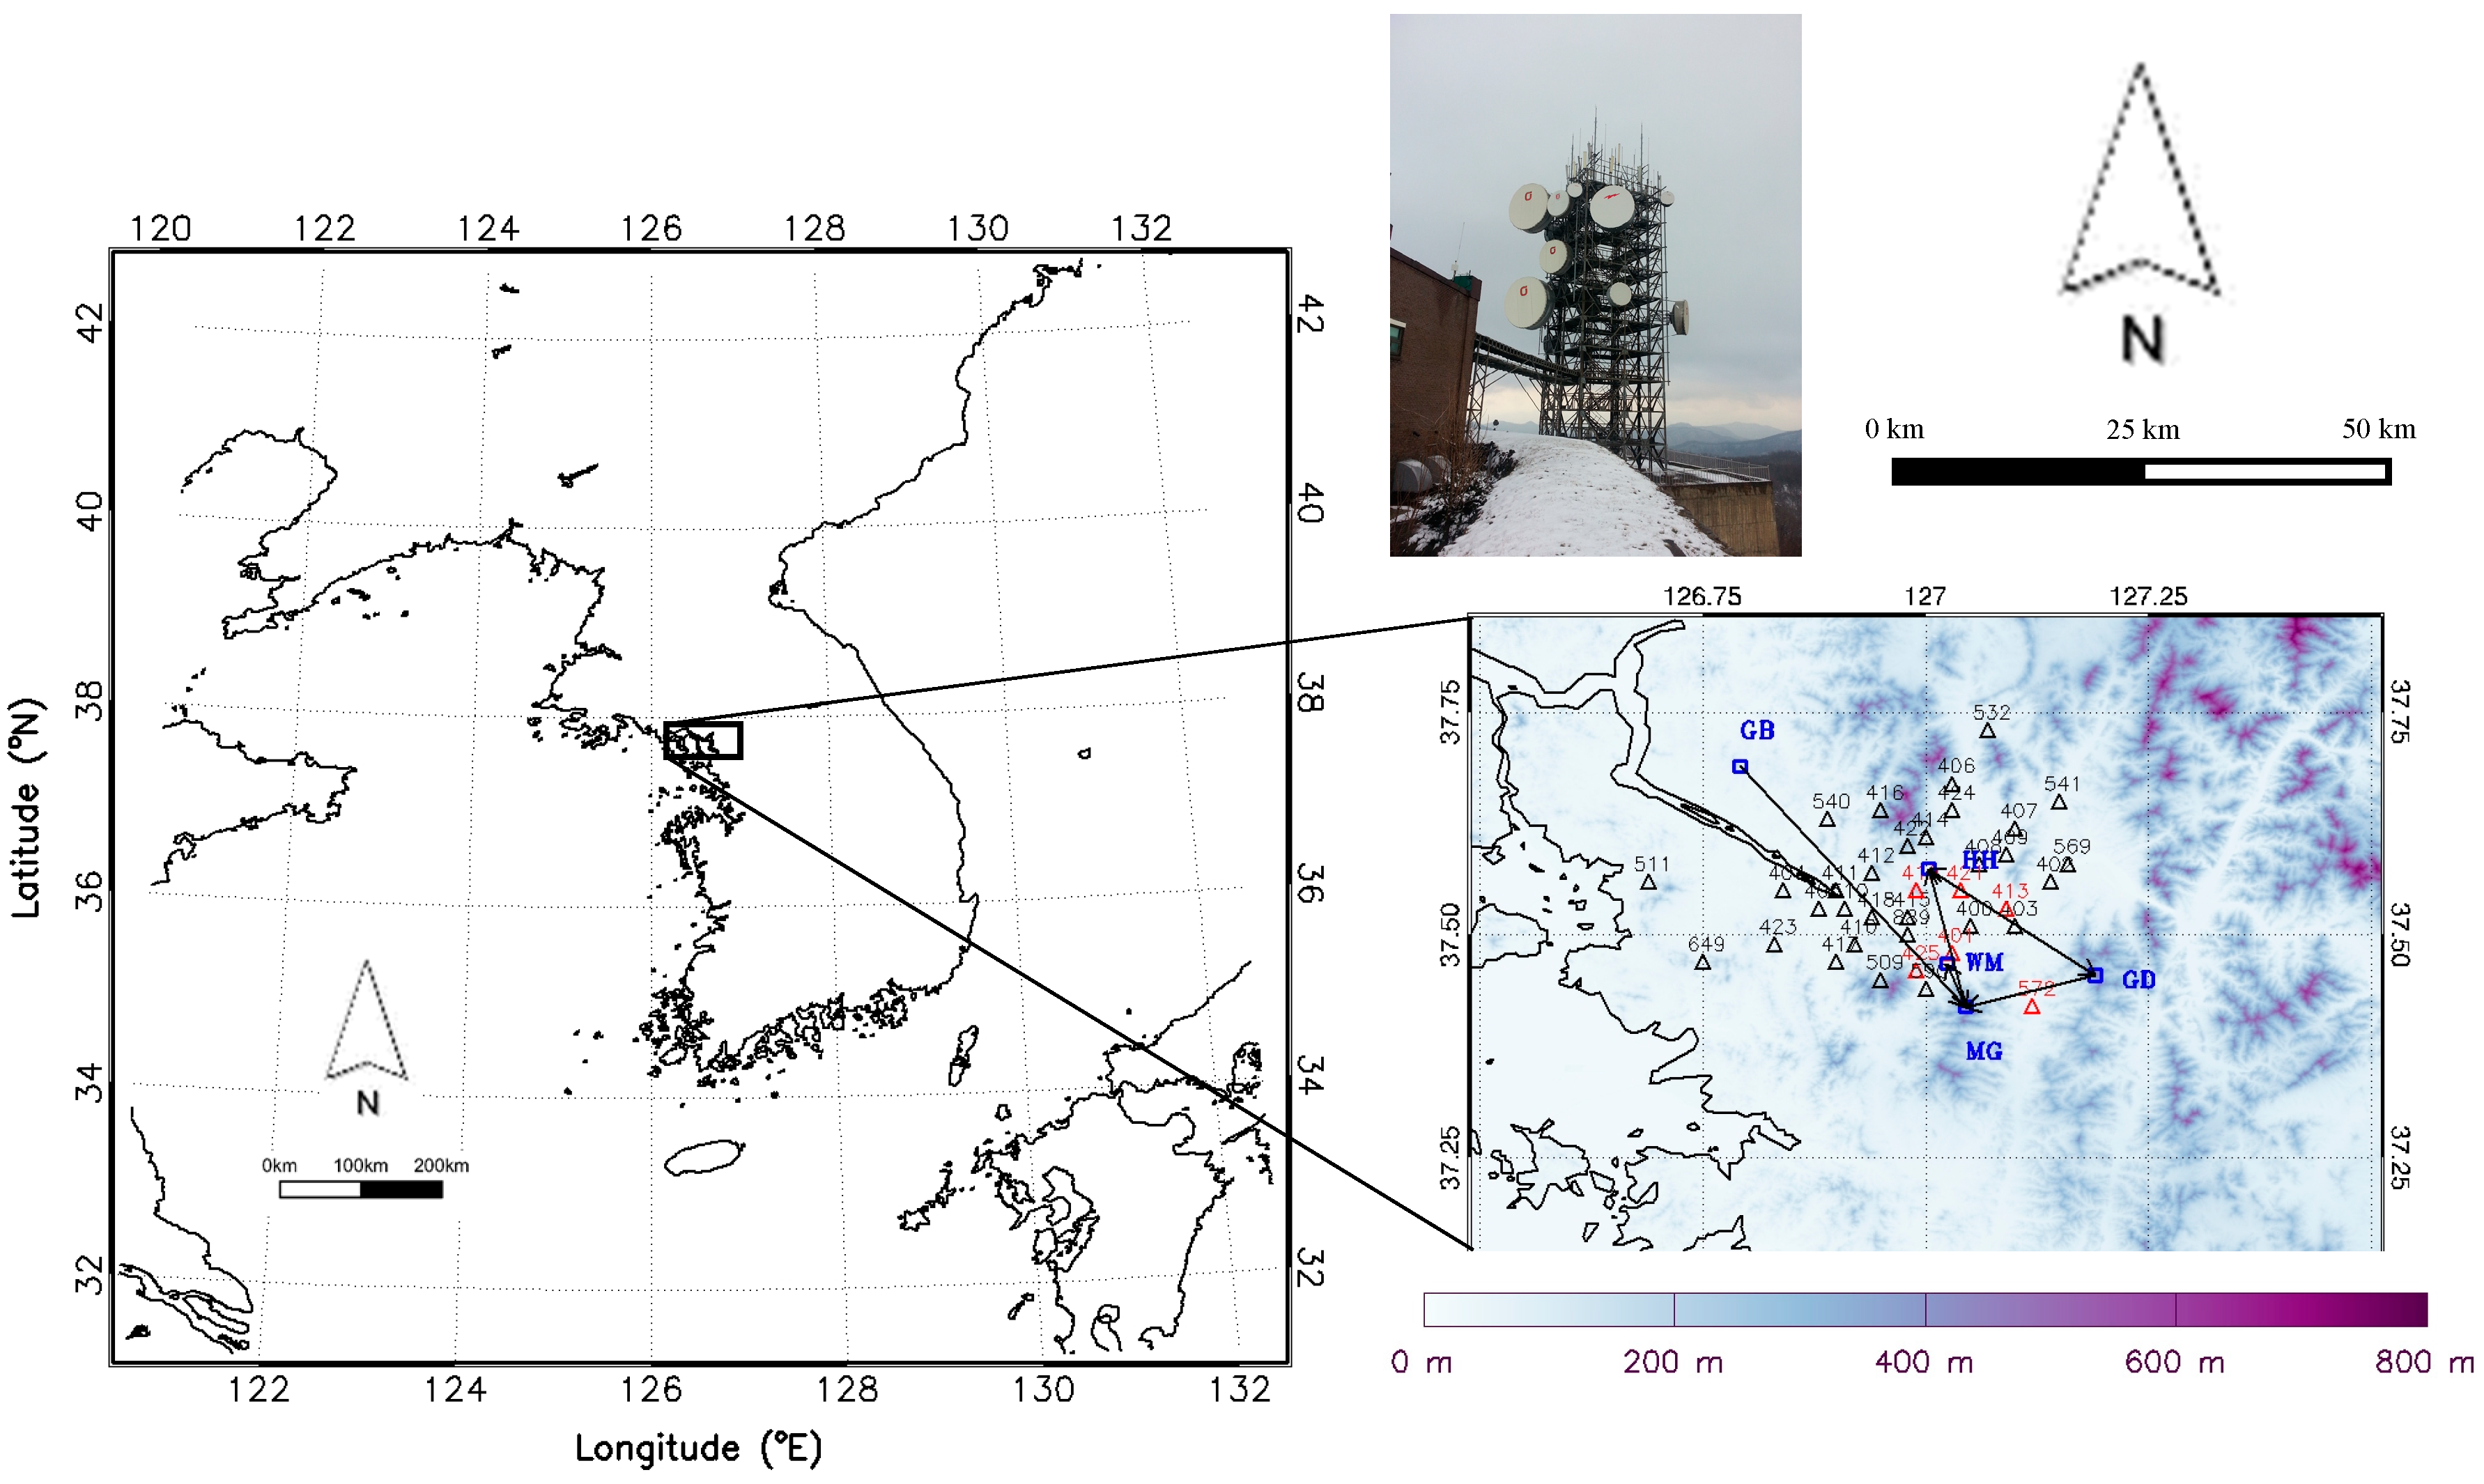
The city of Seoul comprises more than 20% of the total population of Korea (Figure 1). Located at a latitude of 37°33′ N and a longitude of 127° E, the southwestern region is relatively flat, while the northeastern region has more complex topography. The difference in elevation between the two regions is less than 800 m (Figure 1). The city is influenced by the cold, high pressure of the continent during the winter and hot, humid ocean air masses in the summer. Therefore, the annual temperature difference is up to 30 °C, indicating a continental climate. The average annual rainfall is 1450.5 mm, subject to seasonal fluctuations. Approximately 72% of the annual rainfall occurs during June to September, with July being the wettest month (20% of annual rainfall). Rainfall data collected from 1777 to 2015, using both older rain gauges and modern weather equipment, indicate that both the average and extreme rainfall during the rainy season have increased in Seoul [29]. Even recently, the June to August rainfall increased by 187.9 mm in the 2000s compared to that in the 1970s. On 21 September 2010, a heavy rainfall event resulted in 280.5 mm of rainfall. During this event, the maximum hourly rainfall amount was 108 mm, the highest September hourly rainfall rate recorded in Seoul to date. Furthermore, major damage, including landslides, was caused by heavy rain (up to 113 mm h−1) during three days from 27 July to 29 July 2011 [30].
2.2. Rain Gauges and Rain Detectors
Rainfall is highly variable at all scales [8]. Rain consists of many individual drops, each with its own diameter and fall velocity, and can be characterized by its DSD. Leijnse et al. [23] noted that the natural variability of DSD depends on the spatial and temporal scales at which it is measured or applied. The 1-min tip data recorded by tipping-bucket rain gauges installed at 36 automatic weather stations (AWS) throughout Seoul and its suburbs were analyzed. The locations of the AWS are shown in Figure 1. The AWS are equipped with a 0.5-mm tipping-bucket rain gauge designed to be positioned 50~60 cm above ground level. Two sizes of tipping-bucket rain gauge are generally used: 0.1 mm and 0.5 mm. The World Meteorological Association recommends a minimum unit of observation of 0.2 mm increments, possibly in units of 0.1 mm. For the calculation of rainfall rate using the rain gauge, 15-min tip data were converted to 1 min rainfall rates (mm h−1) using a moving average.
The AWS are equipped with rain detectors (JY100097-3, Jinyang Inc., Anseong, Korea) at heights of 1.5 m, which record the value as 10 if rainfall is detected at 1-min intervals and as 0 if rainfall is not detected. Rain detectors are used to validate the rainfall detection using rain-induced attenuation. The rain detector is designed with a heater inside the sensor so that dew or mist does not interfere with data collection. The AWS data are collected following quality control measures, such as the physical limit test, the step test, the internal consistency test, and the persistence test [31].
2.3. Weather Radar
Weather radar data were used to identify the spatiotemporal distribution of rainfall. The terrain and sea clutter observed at an altitude of ≤1 km and the Constant Altitude Plan Position Indicator reflectivity at a 1.5 km altitude, which is less affected by the melting layer in which ice particles melt into raindrops (at 3.5–5 km altitude during summer), were converted to rainfall rates. The KMA operational radar network consists of a total of 11 radars: one radar (RIIA) is operated at the C-band wavelength, and the others are operated at the S-band wavelength. All the radars have Doppler capability and perform plan-position-indicator volume scans routinely, comprising 6–15 elevation steps every 6 or 10 min. The radars collected reflectivity data with an azimuthal resolution of 1° and a range resolution of 250 m for the S-band and 500 m or 1000 m for the C-band wavelength radars. The unambiguous ranges for the reflectivity measurements were about 240 km, except for the RIIA radar (130 km), and the mean distance between the radar sites is about 105 km. Thus, most areas over the southern Korean Peninsula were overlapped by observations from two or more radars at a height of >2.5 km above mean sea level [32].
2.4. Microwave Links
Weather radars operate at increasing altitudes with increasing distance from the source, where the nature and amounts of precipitation can be quite different, while microwave links operate close to the surface. An important difference is that quantitative precipitation estimates (QPEs) from a radar are based on the measured power of echoes reflected by raindrops, whereas those from a microwave link are based on the rain-induced attenuation along its path [1]. Generally, microwaves are propagated into the atmosphere in the form of beams by a transmitting antenna, and some signal is absorbed by the atmosphere, some is scattered, and the remainder passes through a receiving antenna [20]. Microwave links have features in between those of radars and rain gauges, with different spatial and temporal resolutions [12]. They cannot be directly matched, however, because the altitude and sampling volumes are different. Assuming a homogeneous rainstorm, the total path attenuation (dB) is related to the rainfall rate R (mm h−1) by an equation of the form:
where L is the length (km) of the path and /L (=k) is the specific attenuation rate (dB km−1).
Generally, this k-R relationship is explained by the power function in Equation (1) [9,10,12,13,21,23,33].
The coefficient a and exponent b depend on the microwave frequency, polarization characteristics, temperature, raindrop shape, DSD, and the length of the path [34,35]. Berne and Uijlenhoet [8] reported that a and b depend on microwave frequency rather than link distance, using microwave links with a frequency range of 5–50 GHz and a link distance of 0.5–30 km. Since homogeneous rainstorms are unlikely to occur and the DSD may be uncertain, rainfall estimates based on the inverse k-R relationship , using average values for a and b, can be very inaccurate.
Korea Telecom (KT) operates microwave links at frequencies of 10 GHz or less that are mainly used for broadcasting and communication relays in Korea. In this study, Hyehwa-Geomdan (HG), Geomdan-Hyehwa (GH), Manggyeong-Hyehwa (MH), Hyehwa-Manggyeong (HM), Manggyeong-Woomyeon (MW), Woomyeon-Manggyeong (WM), Manggyeong-Gobong (MB), and Manggyeong-Geomdan (MG) link data collected over a 7-month period (May–November 2016) were analyzed. HG and GH, MH and HM, and MW and WM are collocated parallel microwave links with different frequencies as shown in Table 1. Each microwave link has specifications related to frequency, polarization, transmitted power (dBm), and link length. The transmitted and received power resolution is 0.01 dBm, and the time resolution is 15 s. The (dB) is calculated as the difference between the received and transmitted power (dBm). Because the time resolution of the rain gauge rainfall rate and the rain detector data is 1 min, are also averaged over 1 min.
2.5. Rainfall Cases
Ten rainfall cases were chosen over a 3-month period (from May 2016 to July 2016) to validate the rainfall detection and rainfall rate estimation (Table 2). Furthermore, to establish the power-law R-k relationship between the rainfall rate and specific attenuation, 1-min rainfall rates that were computed from rain gauges within a 10 km radius of the receiving and transmitting antennas for each link, using the Inverse Distance Weighting (IDW) method, were used. This study did not analyze winter rainfall to exclude microwave attenuation caused by solid rainfall.
In Table 2, the rain spell data obtained from tipping-bucket rain gauges and rain detectors display large differences because the rain gauge cannot measure rainfall that is less than 0.5 mm if the tipping-bucket size is 0.5 mm. Such differences in the rain spell indicate less persistent rainfall. Differences in rainfall amounts and rain spells can occur in the same case, depending on the location of the rain gauges, because the incoming precipitation cells are not homogeneous. Tipping-bucket rain gauges with bucket sizes of 0.5 mm are ineffective in the event of heavy rainfall because the rainfall in such cases exceeds the bucket volume. Rainfall estimation errors occur because the bucket is not emptied and is repeatedly operated. Conversely, the rain gauge is less likely to detect light rainfall rates (≤10 mm h−1) because the bucket needs time to be filled. Classification schemes of precipitation type generally depend on rainfall rate or radar reflectivity because of a lack of detailed dynamic and microphysical information in time and space. Simple classification schemes (those that threshold the radar reflectivity and rainfall rate) were used to separate convective rainfall (≥40 dBZ or ≥10 mm h−1) from stratiform rainfall (<40 dBZ or <10 mm h−1) [4]. The rainfall cases (Cases 1, 4, 6, 7, 8, and 10) show rapid spatial and temporal variations with spatial heterogeneity.
3. Methods
3.1. Classification of Rain and Dry Spells
Rainfall is not the only factor that causes microwave attenuation, because, during clear skies, water vapor concentrations, temperatures, wind effects on the antenna, signal loss in the transmission and reception process, multipath effects, and a wet antenna also have attenuating effects on microwaves [21]. Generally, total path attenuation at time t can be classified into attenuation caused by rainfall , attenuation during clear skies ), and attenuation by a wet antenna ). For the frequencies considered in this study, ) is smaller than . All antennas of the microwave links used in this paper were shielded from rain using the hydrophobicity of a planar radome outer surface, which is critical to reducing additional transmission loss during rain [26]. Thus, we assume that the wet antenna effect can be considered negligible. Leijnse et al. [23] confirmed that the errors are also less severe because long microwave links experience more path-integrated attenuation than wet antenna attenuation. The equation outlining the total path attenuation is as follows:
Fenicia et al. [3] compared two different estimation methods, the first assuming a constant throughout the rainfall event and the second based on a one-parameter linear low-pass filter. The results indicate that the low-pass filter provides consistently better results than a constant method. Overeem et al. [13] defined constant as the mean of during the 24-h period prior to the beginning of a rainfall event. In this study, was calculated in real time using solely past or current based on the assumption that the local variation in would be small in clear skies and would increase with the rainfall rate. Since rain-induced attenuation occurs when exceeds , it can detect rainfall in real time. Therefore, if is determined incorrectly every minute, the accuracy of rainfall detection declines, and the accuracy of the path-averaged rainfall rate thus decreases when applying to the R-k relationship. In order to calculate in real time, we used a test statistic . for the local variation in as shown in Equations (3) and (4):
where is the average of the for a given window size () that is related to the natural variability of rainfall, and NW is the number of within . While, as previously mentioned, is generally determined using the 24-h period prior to the start of a rain event, it may also be determined by considering climate characteristics [16]. Barthès and Mallet [26] performed calculations using different window sizes centered on the current time, ranging from 100 s to 1 h, to test their ability to discriminate between rain spells and dry spells. Kaufmann and Rieckermann [36] use forward-backward-looking windows with (15, 30, 120 min). In this study, when the autocorrelation of was 0.65 or more, the characteristics of the rainfall cell were determined to be the same, and the corresponding 90 min were used as . Leijnse et al. [23] have investigated independently the length and time scales of rainfall by computing the autocorrelation function of rainfall rate for each time step. Since is nonstationary, there is no convergence between the local standard deviations of and [16]. The local variability of is small during clear skies and increases with rainfall; hence, an appropriate threshold () is needed to determine the rainfall detection. This threshold can be determined using a rain gauge or a rain detector around the microwave link. To calculate , the appropriate related to the variability characteristics of rainfall should be selected. If is too short, rainfall is difficult to distinguish due to the small attenuation differences between and attenuation caused by a low rainfall rate. Conversely, if is too large, the during clear skies is difficult to distinguish. If values are available for several months, can be calculated using the climatological basis that rain spells are short in most regions. For example, Schleiss and Berne [16] used threshold values from 0.05 to 0.15, which is the annual average period of rainfall in Paris, France. Due to the multifractal properties of rainfall, rain characteristics are related to the scale considered. Rainfall dynamics, due to coupling with atmospheric turbulence, can be statistically described by scale-invariant processes. Interactions occurring between energy fluxes and neighboring scales may be conserved from large to small scales [37]. Scale dependency is due to rain intermittency and the multifractal properties of rainfall. Verrier et al. [38] investigated the scaling properties of the rainfall process and reported that multiscaling regimes should be distinguished, i.e., 3 days to 30 min (interevent variability) and 15 min to 15 s (internal variability) with different universal multifractals. In this study, the seasonal differences in rainy periods were significant; hence, was applied from 0.009 to 0.09. When is determined, is determined, and the rainfall detection is determined using Equation (5) at intervals of 1 min:
Finally, the path-averaged rainfall rate can be deduced using Equation (6), which is referred to as the R-k relationship. Generally, the closer b is to 1, the more the path-averaged rainfall rate will be estimated accurately with respect to the true path-averaged rainfall rate:
where (dB) is rain-induced attenuation, which is the difference between (dB) and (dB) that exceeded 2.5% of the . The value of 2.5% is a threshold that is determined by comparison with the rain detector rainfall rate results. is rain-induced specific attenuation (dB km−1).
3.2. Weighted Rainfall Rate
Unlike convective rainfall, which is spatially diverse and lasts for short periods of time, stratiform rainfall displays spatial homogeneity and lasts longer. To establish the R-k relationship, a rain gauge must be situated on the microwave link. However, as shown in Figure 1, the AWS locations are not ideally suited for this purpose. Assuming that the estimated path-averaged rainfall rate from rain-induced specific attenuation (dB km−1) is related to the inverse distance within a radius of influence with respect to each transmitting and receiving antenna, we obtain the following [39]:
where D is the radius of influence, and is the distance between the microwave link and the i-th rain gauge in the study area. In this study, a power of 2 was assumed [40]. The weights are generally inversely proportional to the square of the distance. Furthermore, the following variogram was used to calculate the radius of influence:
where h is the separation distance, γ(h) is a semivariogram according to the separation distance h corresponding to half of the variogram 2γ(h), is the rainfall rate at an arbitrary position , is the rainfall rate at a position separated by h from , and signifies the total number of data pairs separated by h in a spatially distributed region [41]. The relationship can also be expressed as follows:
where is the weighted rainfall rate based on the distance between each rain gauge from the microwave link.
4. Results and Discussion
4.1. Detection of Rain and Dry Spells
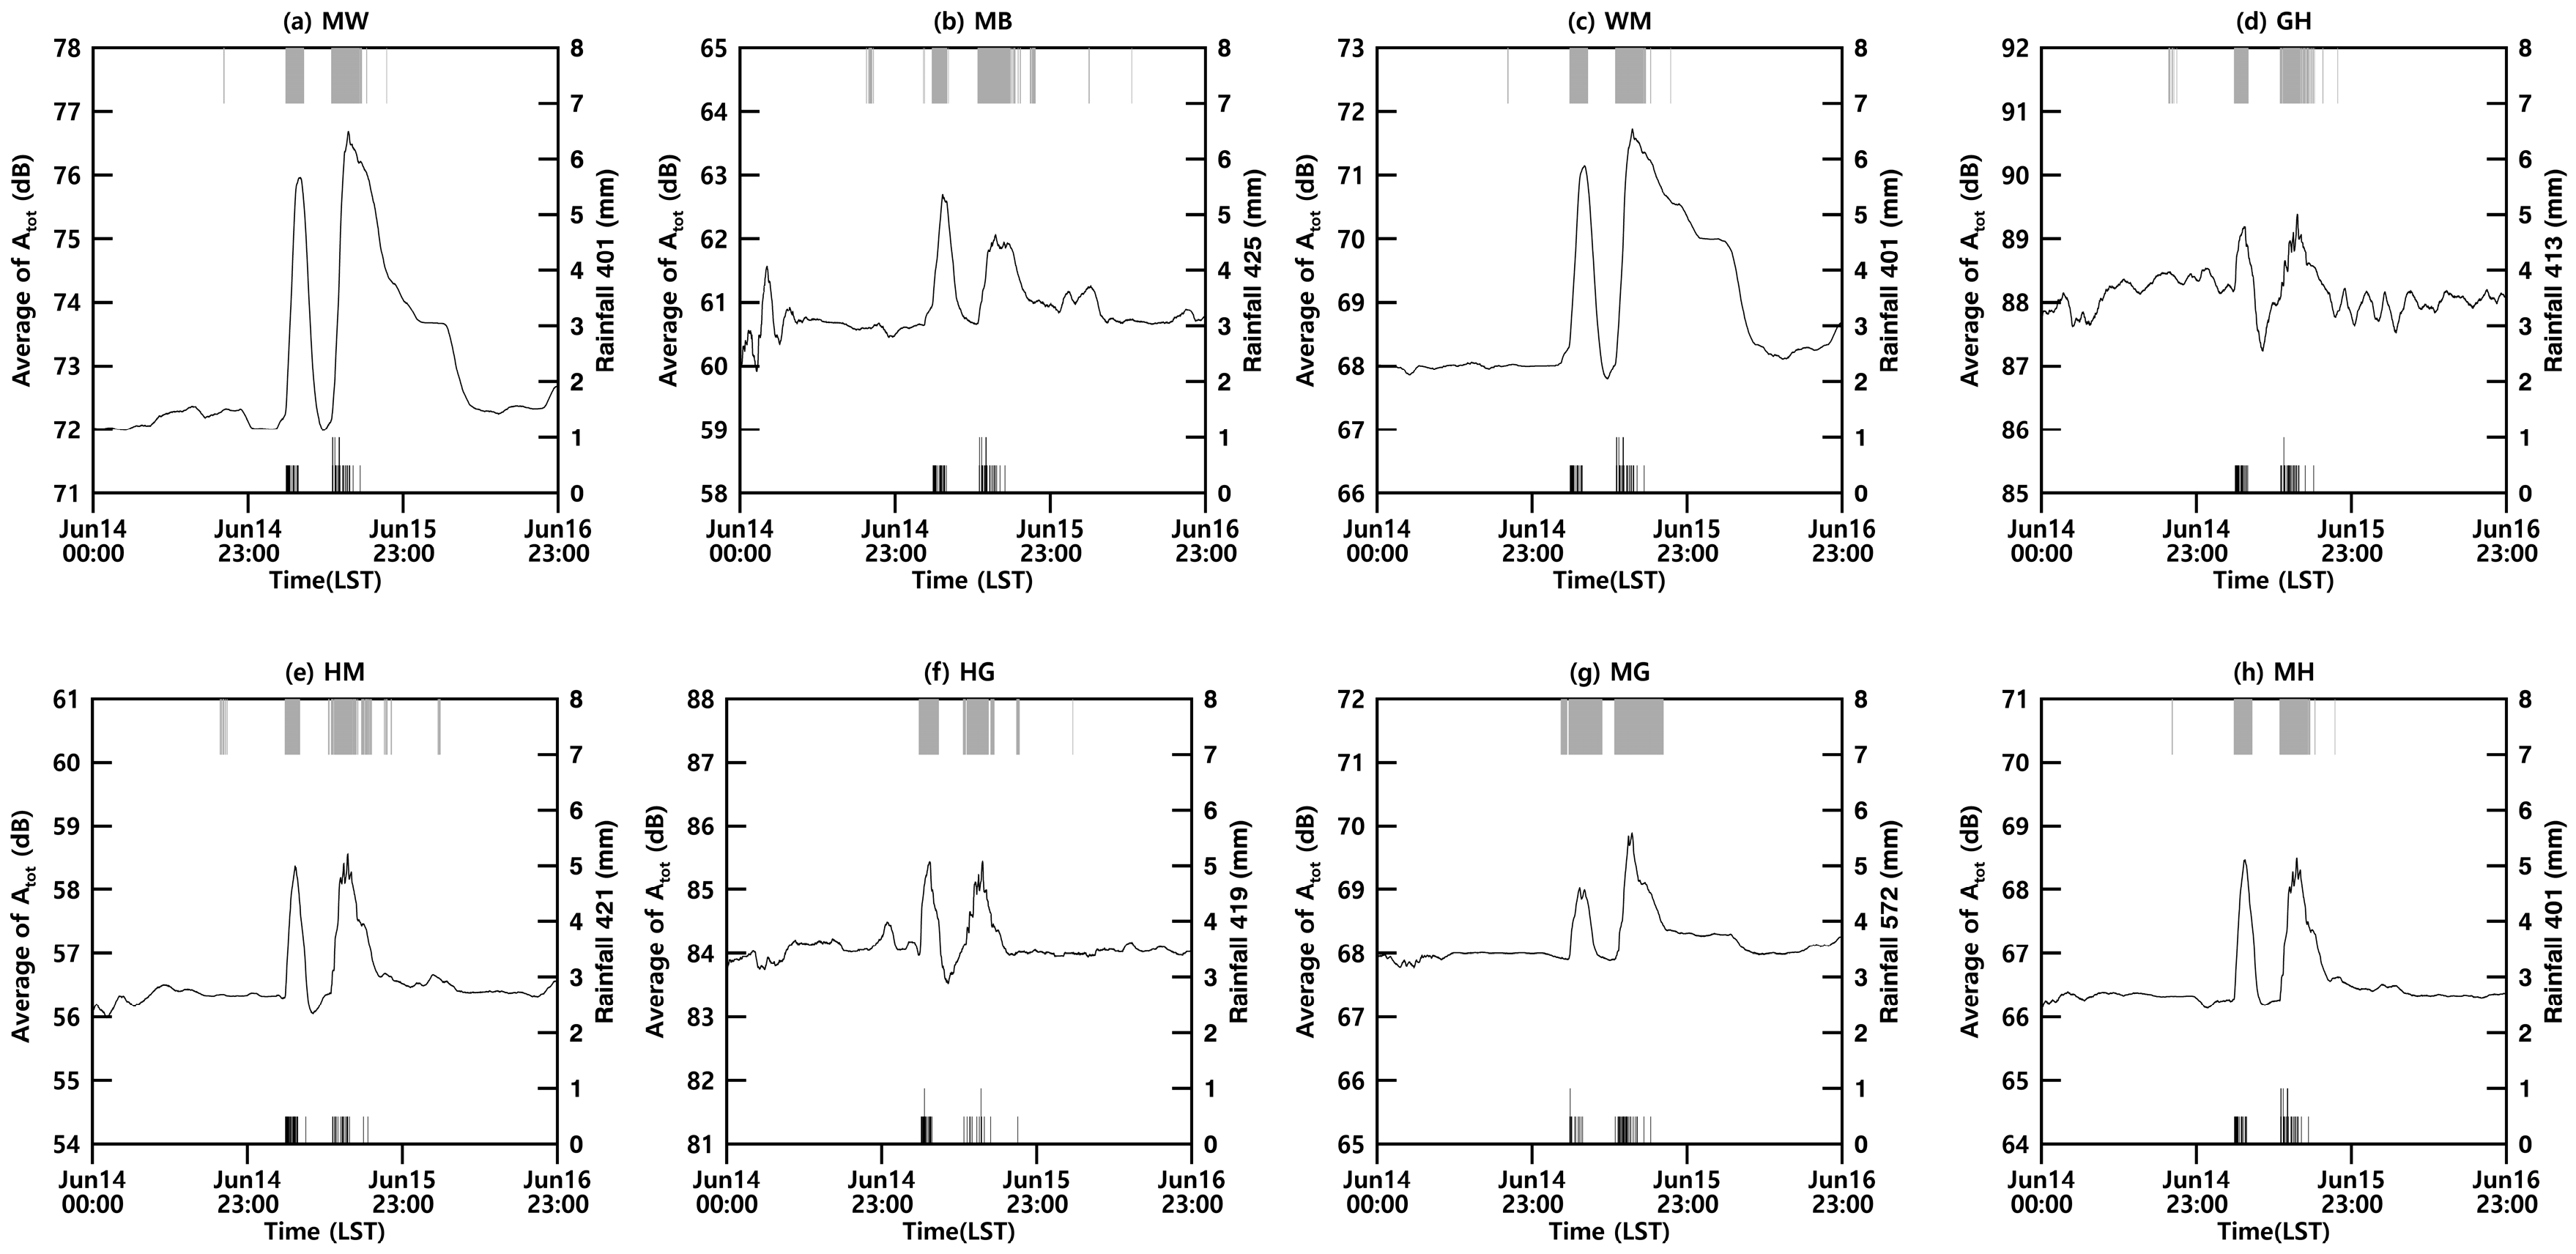
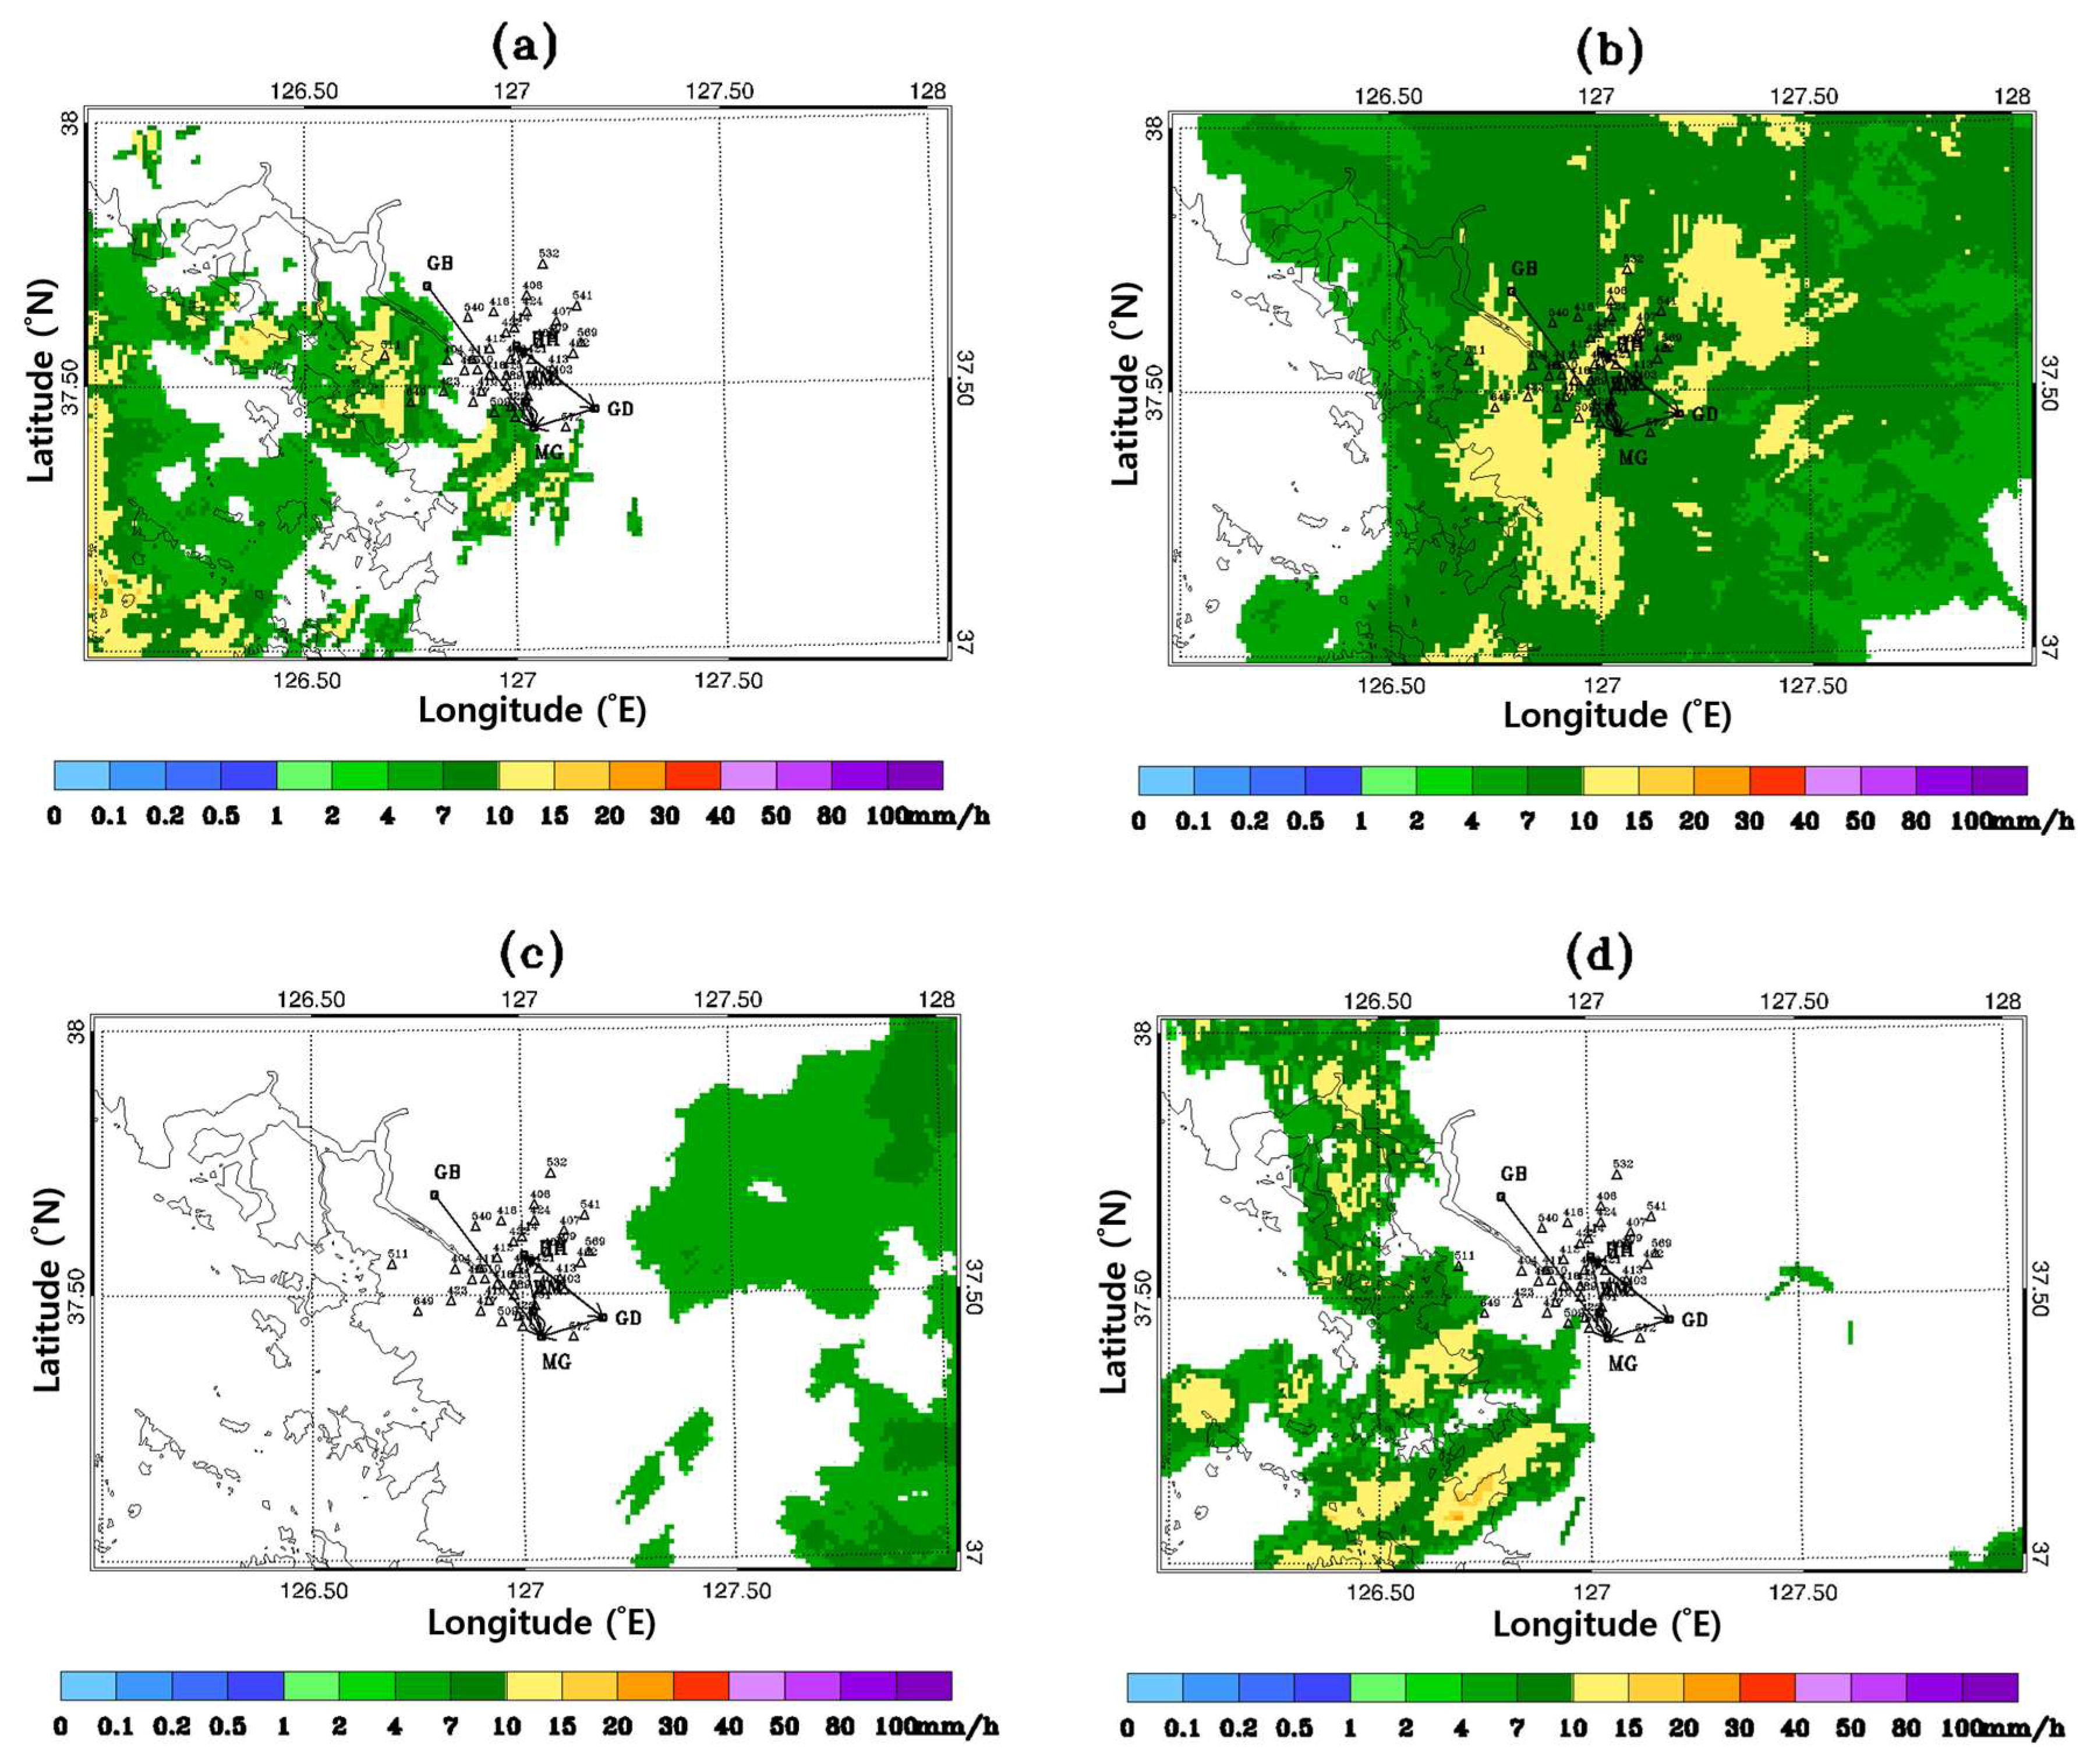
The rainfall detection algorithm is validated for Case 6, which is an intermittent (discontinuous) rainfall event; rainfall occurred from 05:00 to 07:00 LST and from 13:00 to 17:00 LST on 15 June. The bars shown in Figure 2 are the 1-min tip data (rainfall) recorded by the rain gauge (bottom black bars) and the rain spell recorded by the rain detector adjacent to the microwave link (top gray bars). Despite being part of the same rainfall case, large differences in rain spells were apparent between the rain gauge and rain detector. According to weather radar data, rainfall occurred from 04:15 to 09:30 LST on 15 June and again from 12:10 to 18:00 LST. The radar rainfall rate indicates that the temporal and spatial variability of the rainfall observations is due to the heterogeneity of the rain cells. Several convective cores coexisted within stratiform rainfall in this case (Figure 3). In the rain gauge (AWS 401) installed closest to the MW link, rainfall was recorded from 05:53 to 07:47 LST on 15 June, and rainfall was observed again from 13:02 to 17:20 LST (Figure 2a). Rain spells observed by the rain gauge (AWS 401) lasted for a total of 63 min, and the rainfall amount observed was 35 mm. However, rain spells were recorded by the rain detector (AWS 401) for 447 min between 20:13 LST on 14 June and 21:27 LST on 15 June. This indicates that rainfall occurred before it was detected by the rain gauge, which is consistent with the limitations of tipping-bucket rain gauges described by Humphrey et al. [6], Molini et al. [7], and Rahimi et al. [2]. There is no disagreement observed when distinguishing the two rainfall peaks with distinct (dB).
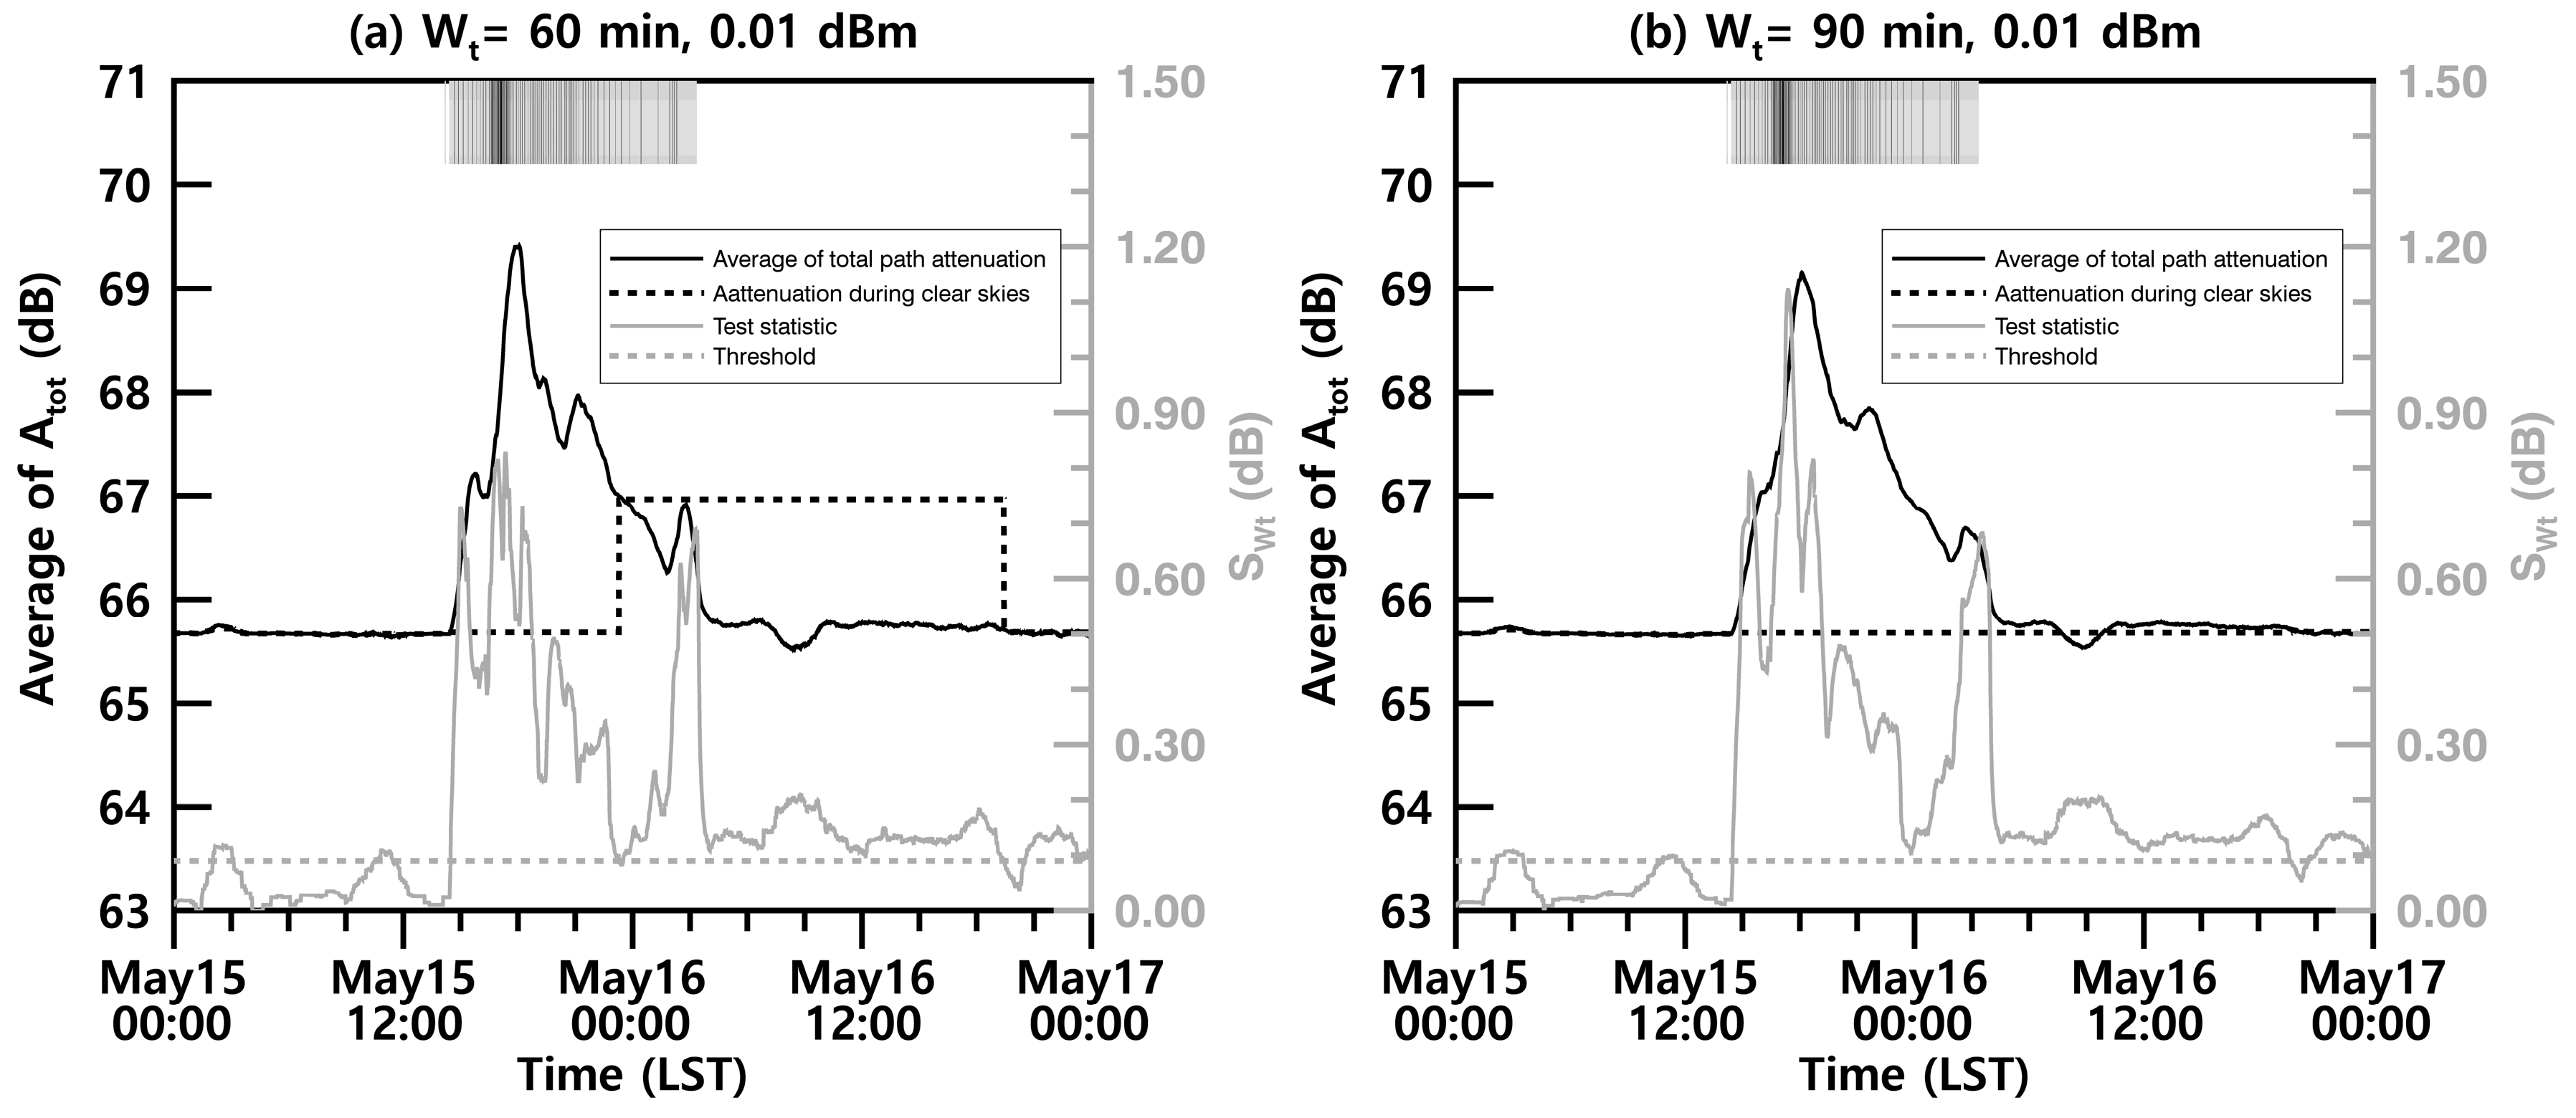
Attenuation during clear skies can be calculated in real time based on the assumption that the local variation in the total path attenuation is small in clear skies and increases with the rainfall rate. In Figure 4a,b, the accuracy of the rainfall detection with a given window size was investigated. Figure 4 shows the test statistic (gray solid line) and the average of total path attenuation (black solid line) calculated from Equations (3) and (4) using the total path attenuation for the MH link in Case 4; the temporal variations in and the average of total path attenuation rely on . Black bars show that rain spells were recorded simultaneously by the rain gauge (AWS 401) and rain detector (AWS 401) installed nearest to the MH link, and the gray bars show that rain spells were recorded only by the rain detector. The black dotted line is and is calculated in real time using Equation (5). As Schleiss and Berne [16] determined, decreases slowly below ; therefore, the total path attenuation remains larger than even after the rainfall event has ended. To overcome this issue, in this study, rain spells were determined using the rain-induced attenuation (dB).
At 00:00 LST on 15 May, the test statistic (gray solid line) was 0.01, which is smaller than the threshold . Therefore, (black dotted line) was determined to be at 65.7 dB according to Equation (6). On 15 May at 02:03 LST, when the test statistic exceeded by 0.097, increased slightly to 65.72 dB, which was the average of total path attenuation at 02:02 LST according to Equation (7). As decreased to 0.084 at 3:08 LST on 15 May, decreased slightly to 65.7 dB, which is the average of total path attenuation . As the test statistic decreased to 0.087 at 23:18 LST on 15 May, increased sharply to 67 dB (the ) from 23:19 LST on 15 May to 03:19 LST on 16 May. Although a rain spell was recorded, total path attenuation was noted to be lower than and therefore could not be detected as a rain spell. The number of rain spells, as recorded by the rain detector, was 764, and the number of rain spells determined by the rain-induced attenuation was 526. The rate of rainfall detection during a rain spell (RR) was 68.8% when using rain spells observed by the rain detector. Furthermore, the rate of rainfall detection during a dry spell (RD) was 28.9%, the rate of dry detection during a dry spell (DD) was 97.8%, and the rate of dry detection during a rain spell (DR) was 0.4%.
As shown in Figure 4b, when was 90 min, was 0.15 at 23:18 LST. was calculated using Equation (5) at the time before exceeded , which was an average of total path attenuation of 65.7 dB. Therefore, the number of rain spells determined by increased to 739; thus, RR increased to 97.9%, and RD decreased to 2.1% (Table 3). This is consistent with the findings of Schleiss and Berne [16], who suggested that varying according to the rainfall pattern improves the accuracy of the rainfall detection rates under clear sky and rainy conditions. Fencl et al. [25] applied a of 60 min (before rainfall) and 180 min (after rainfall) to eliminate the potential influence of attenuation by antenna wetting. Leijnse et al. [33] showed that the effect of the shift in the is seen to be major, especially for a long-lasting and low-intensity event. A longer window reduces sensitivity to random noise [1].
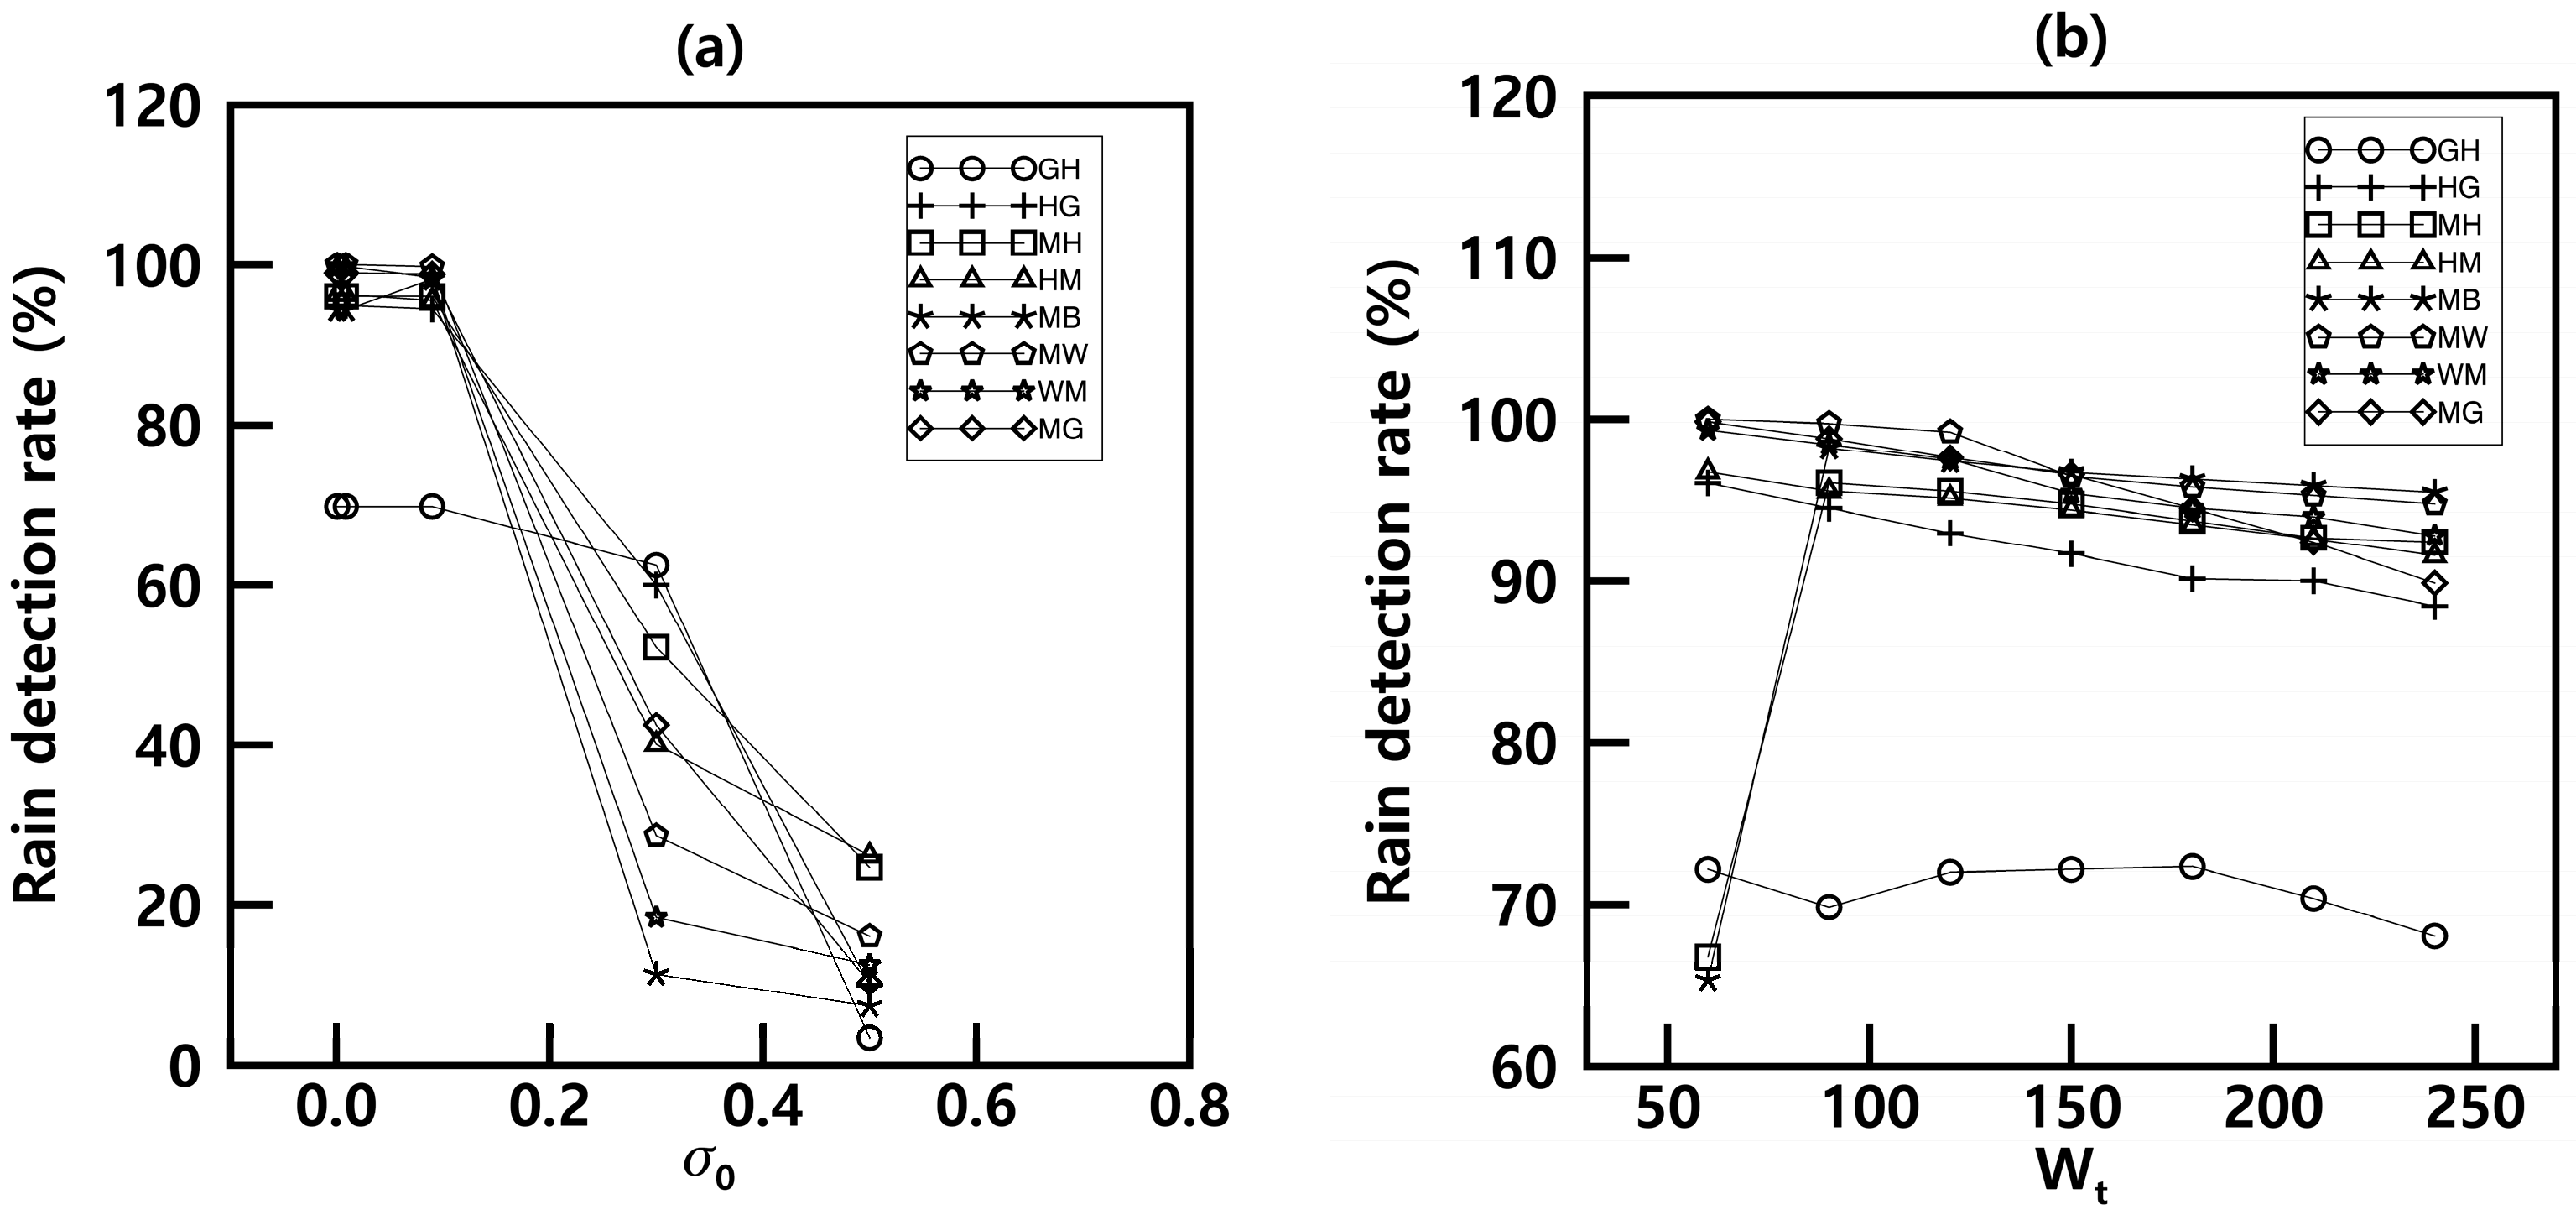
In Figure 5a, the rainfall detection accuracy for all links was investigated with the different threshold values (0.009, 0.09, 0.3, 0.5) given window size = 90 min for Case 4. We confirmed that the accuracy of rain detection decreases with increasing the threshold . This is because, when the test statistic is less than the threshold , the corresponding time is determined to be a dry spell according to Equations (3)–(5). Consequently, the attenuation during clear sky is not calculated correctly. The accuracy of rainfall detection was also investigated with the different values (60, 90, 120, 150, 180, 210, and 240 min) given by = 0.09. As the window size increases, rain detection accuracy decreases slightly compared to Figure 5a, except for the MH and MB links. This is because, when the window size is too large, the total path attenuation signal during dry spells is difficult to distinguish. It is very important to choose the threshold and the window size appropriately for capturing the dynamics of the considered rainfall.
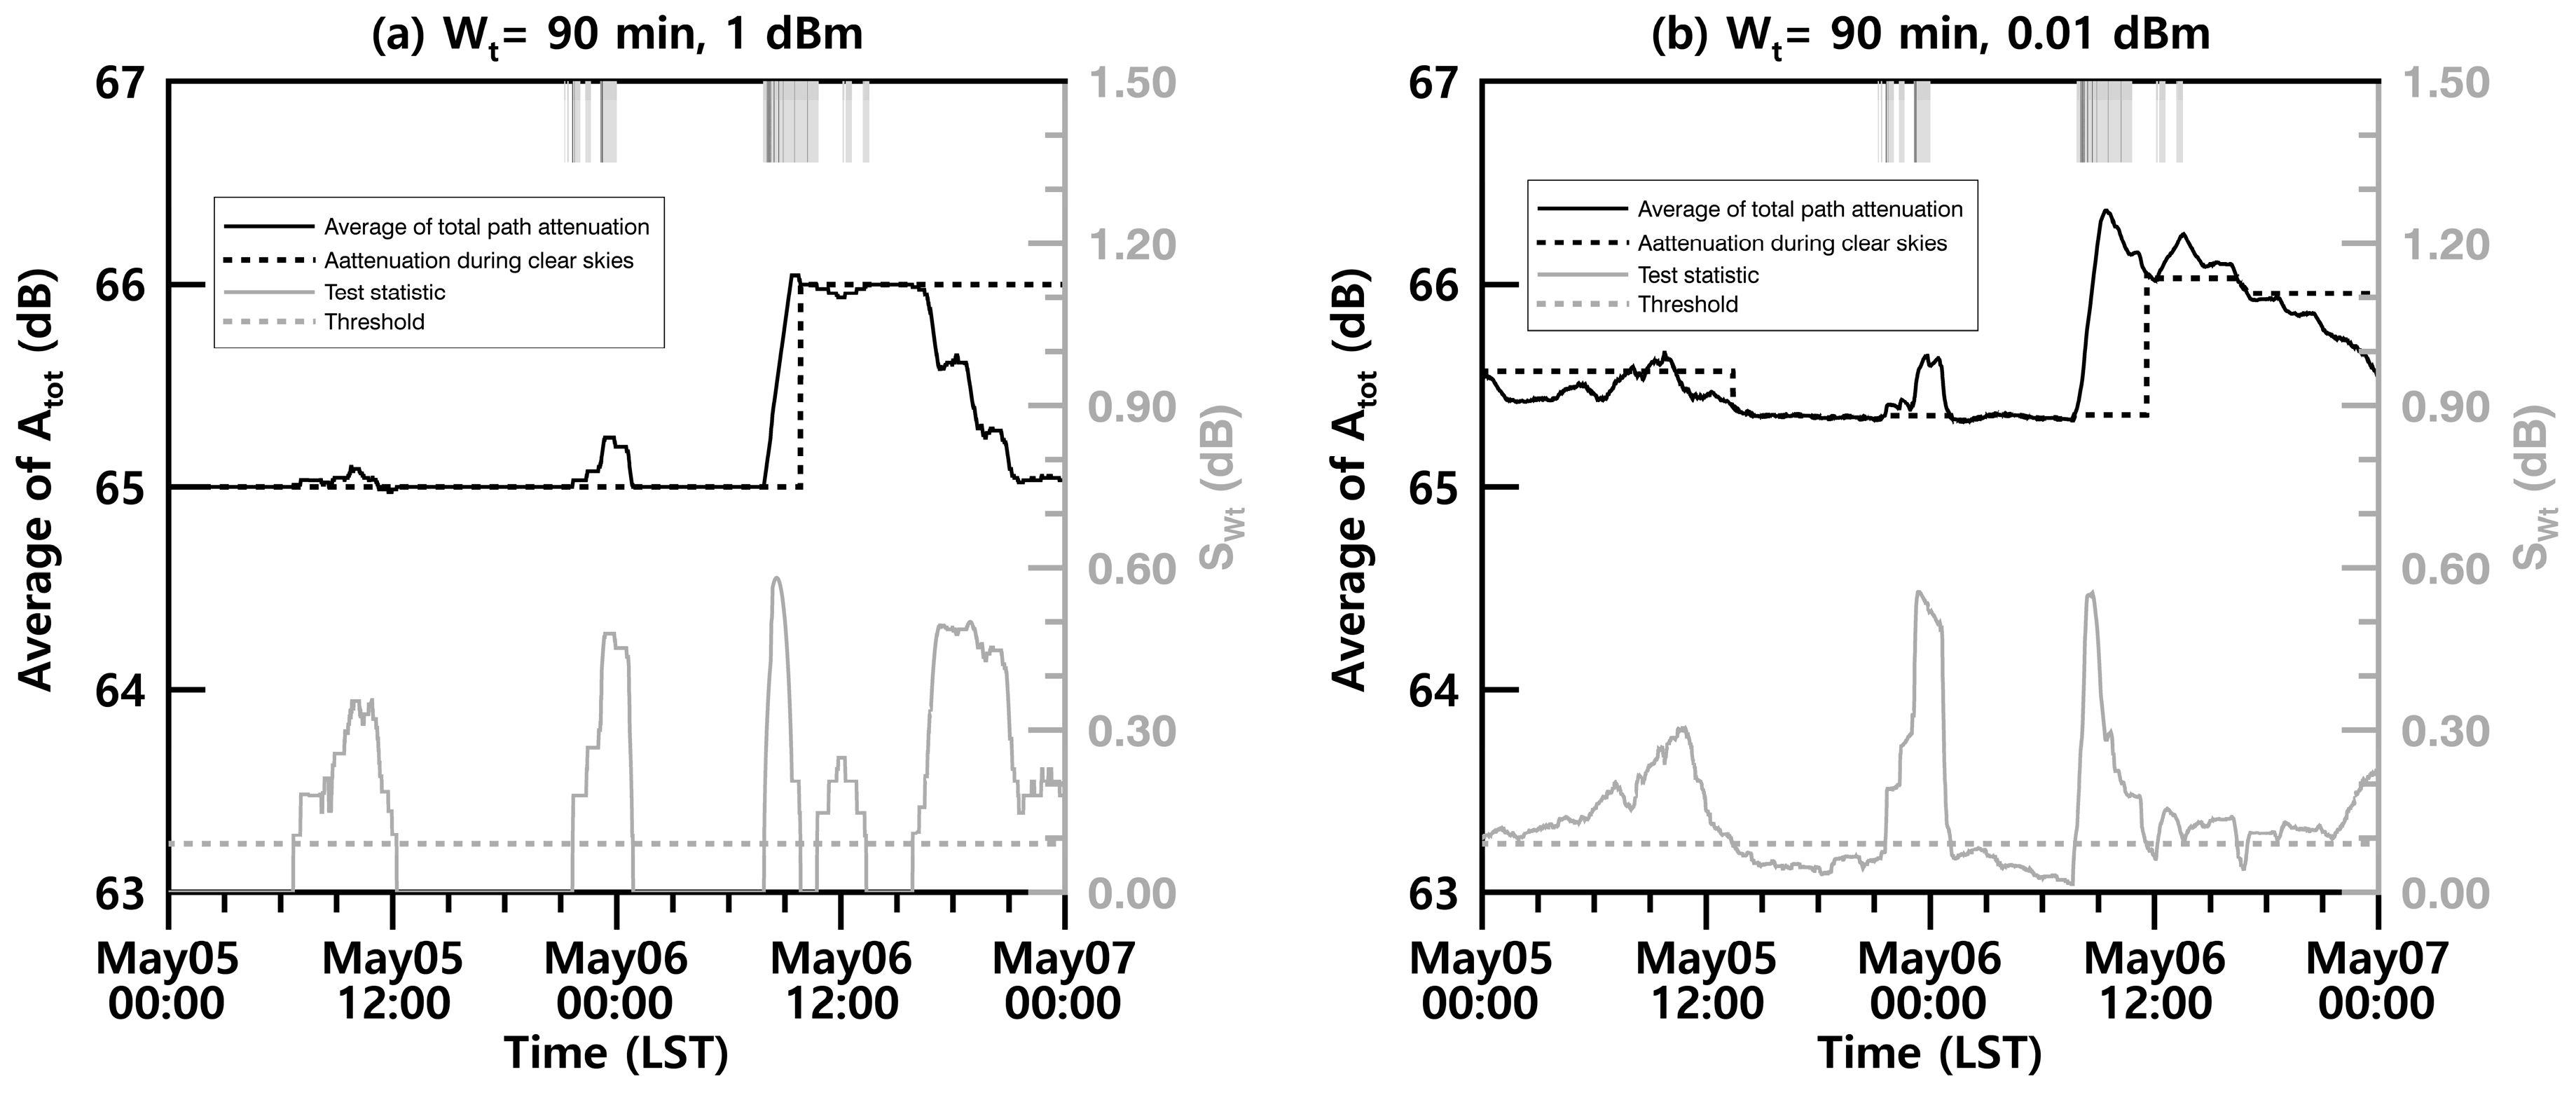
Leijnse et al. [23] investigated the effect of having a power resolution of 1 dBm, which is typical for commercial cellular communication links. If the total path attenuation is quantized (usually at 1 dBm), this may cause rounding errors. The degradation of the power resolution can be seen to cause severe errors and uncertainties for short links and at low frequencies. However, for longer links and at higher frequencies, this is not the case. The power resolution of total path attenuation is 0.01 dBm, which is 2 orders of magnitude higher than that of typical commercial cellular communication links. In Figure 6, the effect of the degradation of the power resolution was investigated with different power resolutions (1 dBm, Figure 6a; 0.01 dBm Figure 6b) given = 90 min for Case 4. We confirmed that using the degradation of the power resolution (1 dBm) does not correctly capture the dynamics of the considered rainfall compared to using the power resolution (0.01 dBm), because the test statistic (gray line) and the attenuation during clear sky (black dotted line) are not calculated adequately. In the case of 1 dBm, increased to 66 dB and missed subsequent rain spells at 09:50 on 6 May. The rate of rainfall detection during a rain spell (RR) was 43.9% using rain spells observed by the rain detector. Furthermore, the rate of rainfall detection during a dry spell (RD) was 97.7%, the rate of dry detection during a dry spell (DD) was 56.1%, and the rate of dry detection during a rain spell (DR) was 0.8%.
On the other hand, in the case of 0.01 dBm, increased to 66.05 dB at 11:35 on 6 May and detected subsequent rain spells. The rate of rainfall detection during a rain spell (RR) was 81.3% using rain spells observed by the rain detector. Furthermore, the rate of rainfall detection during a dry spell (RD) was 88.3%, the rate of dry detection during a dry spell (DD) was 18.7%, and the rate of dry detection during a rain spell (DR) was 10.2% (Table 4).
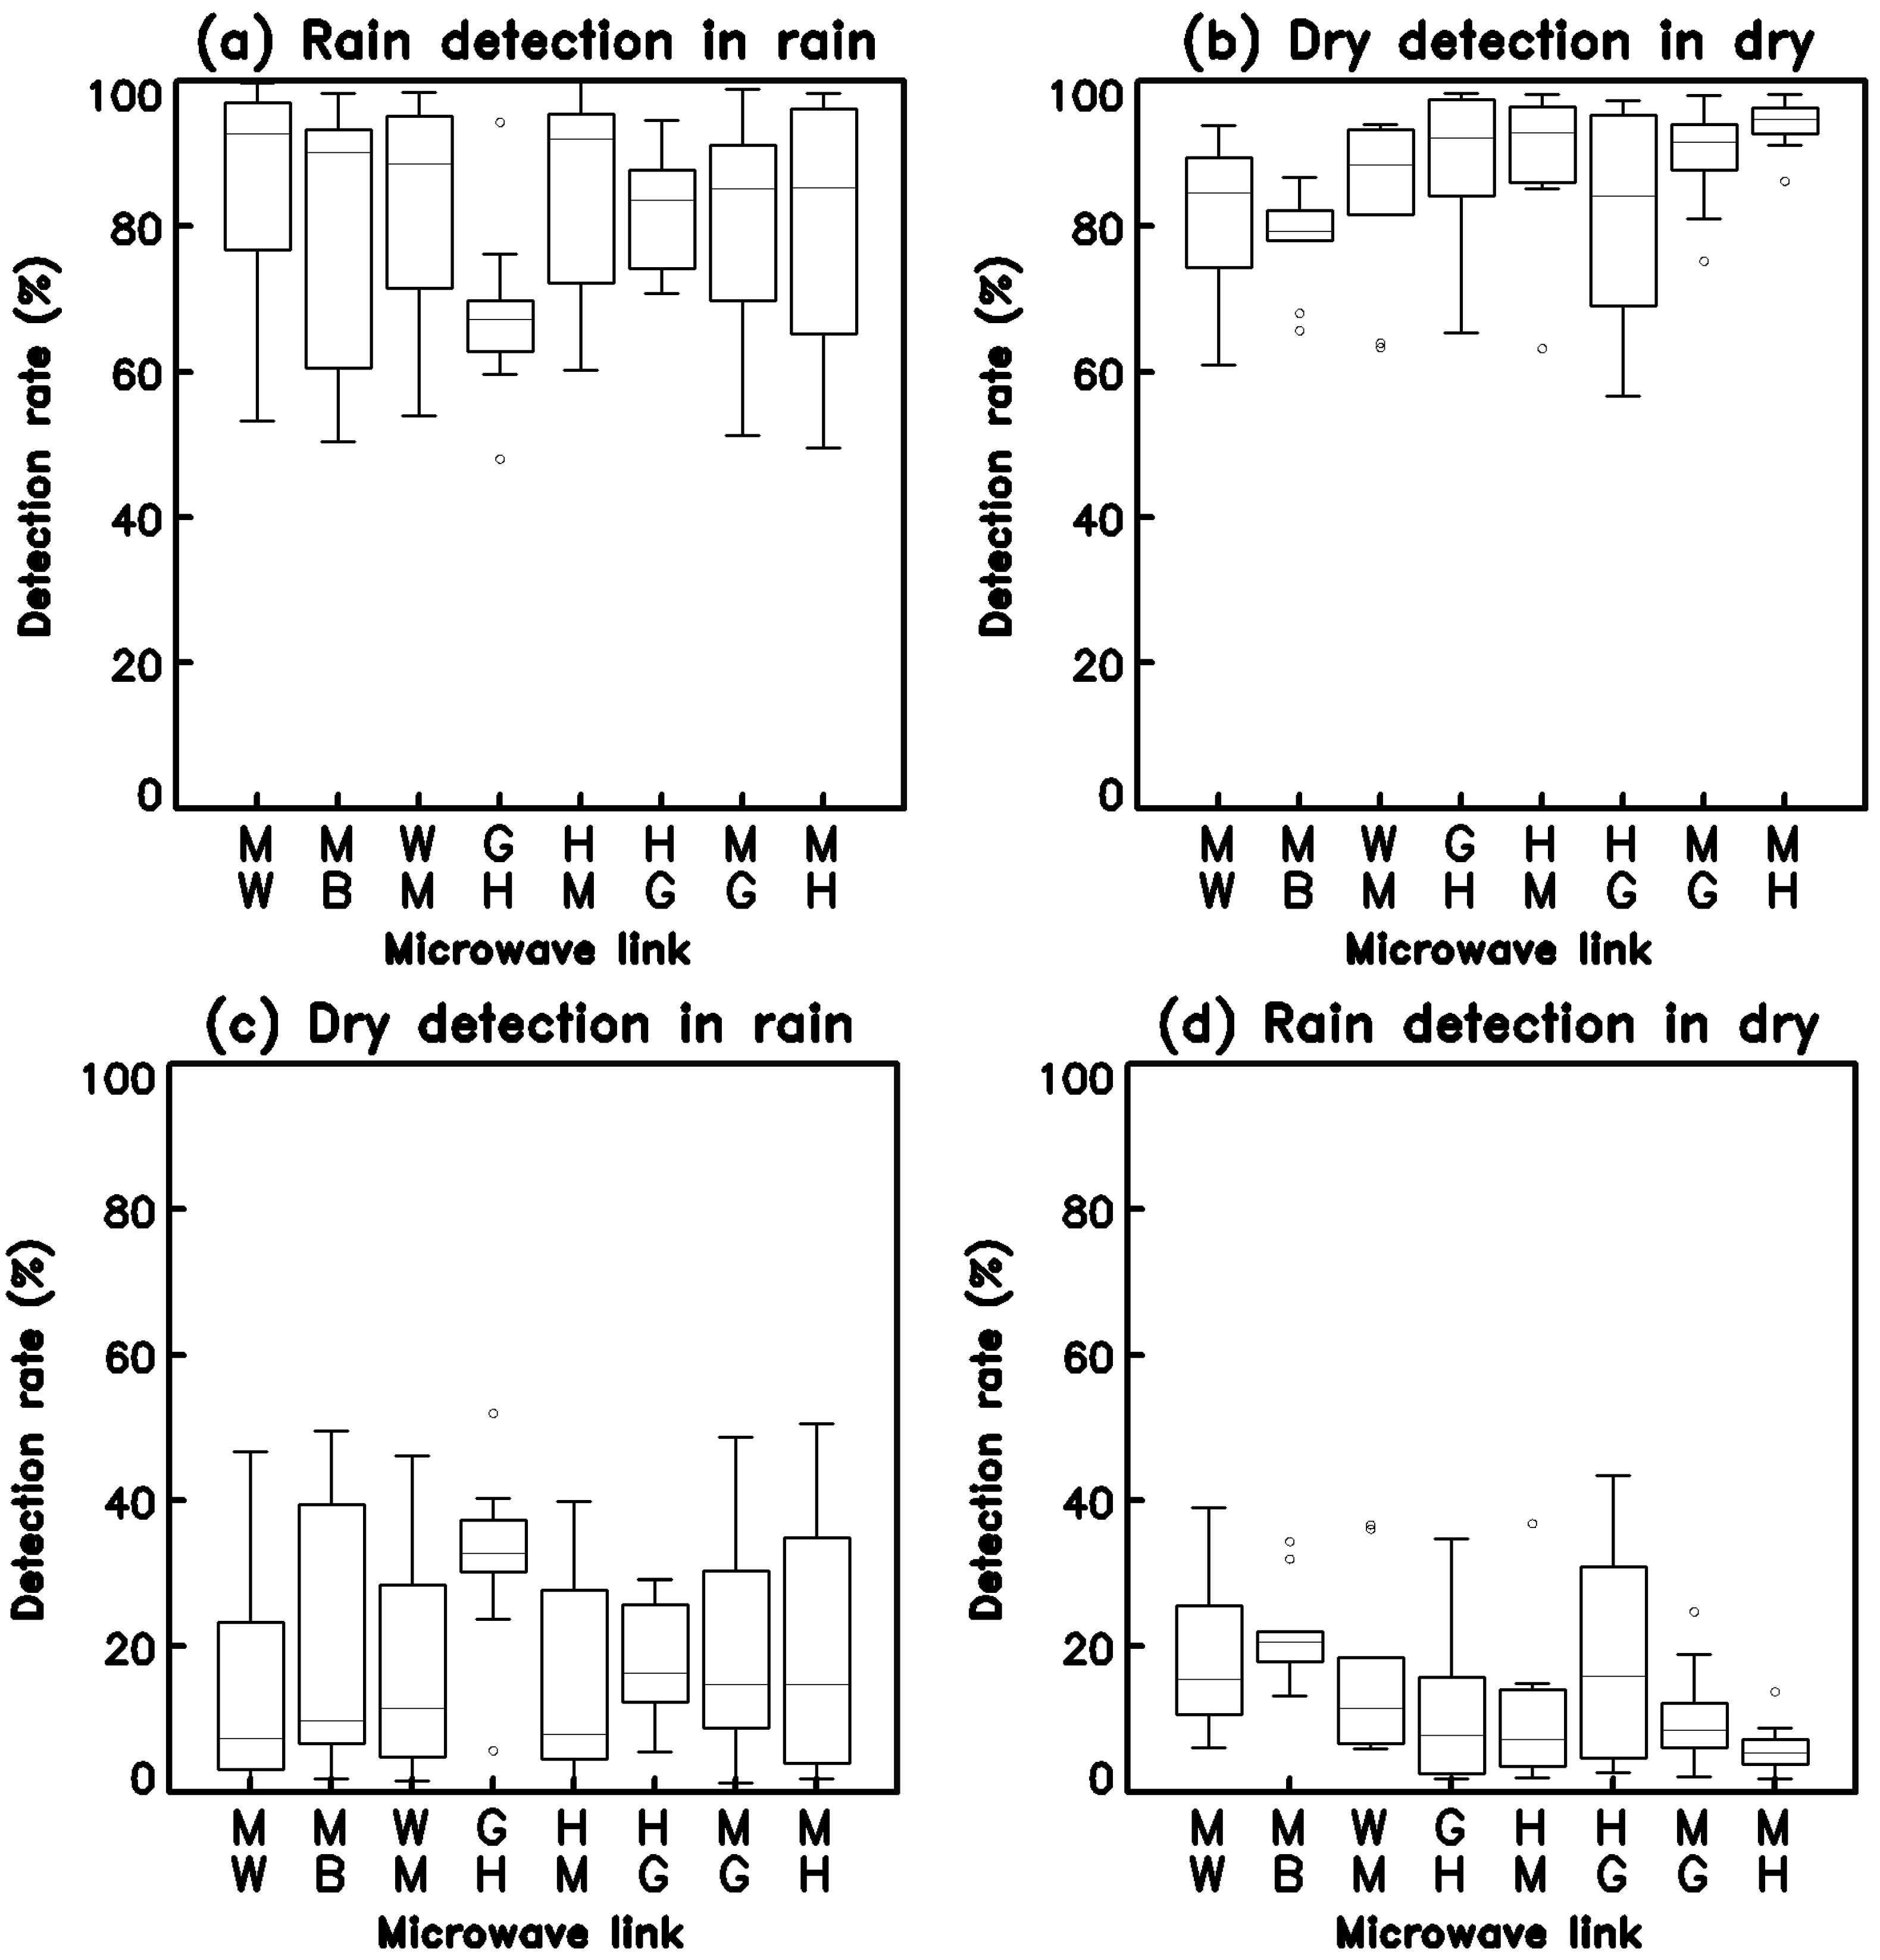
Figure 7 shows a box plot of rainfall detection after applying the window size for 90 min using all the total path attenuation for the 10 rainfall cases. The median rate of rainfall detection during a rain spell (RR) for all cases per microwave link is 80% or more, with the exception of GH (65%), and the median rate of dry detection during a dry spell (DD) is between 80% and 95% for the eight links. The median rate of rainfall detection during a dry spell (RD) is between 5% and 18%, with the exception of GH (35%), and the median rate of dry detection during a rain spell (DR) is between 3% and 14%. Rainfall and clear sky events were correctly detected by the microwave links for all the rainfall cases by all microwave links, and it was confirmed that total path attenuation can be used for real-time rainfall detection.
4.2. Path-Averaged Rainfall Rate
To estimate the path-averaged rainfall rate using the attenuation during clear sky in real time, it is necessary to establish the R-k relationship between the rain-induced attenuation and the weighted rainfall rate that causes microwave attenuation. The path-averaged rainfall rate is estimated from using the R-k relationship discussed in previous sections. The accuracy of the R-k relationship depends on the use of at a given time and the use of the weighted rainfall rate.
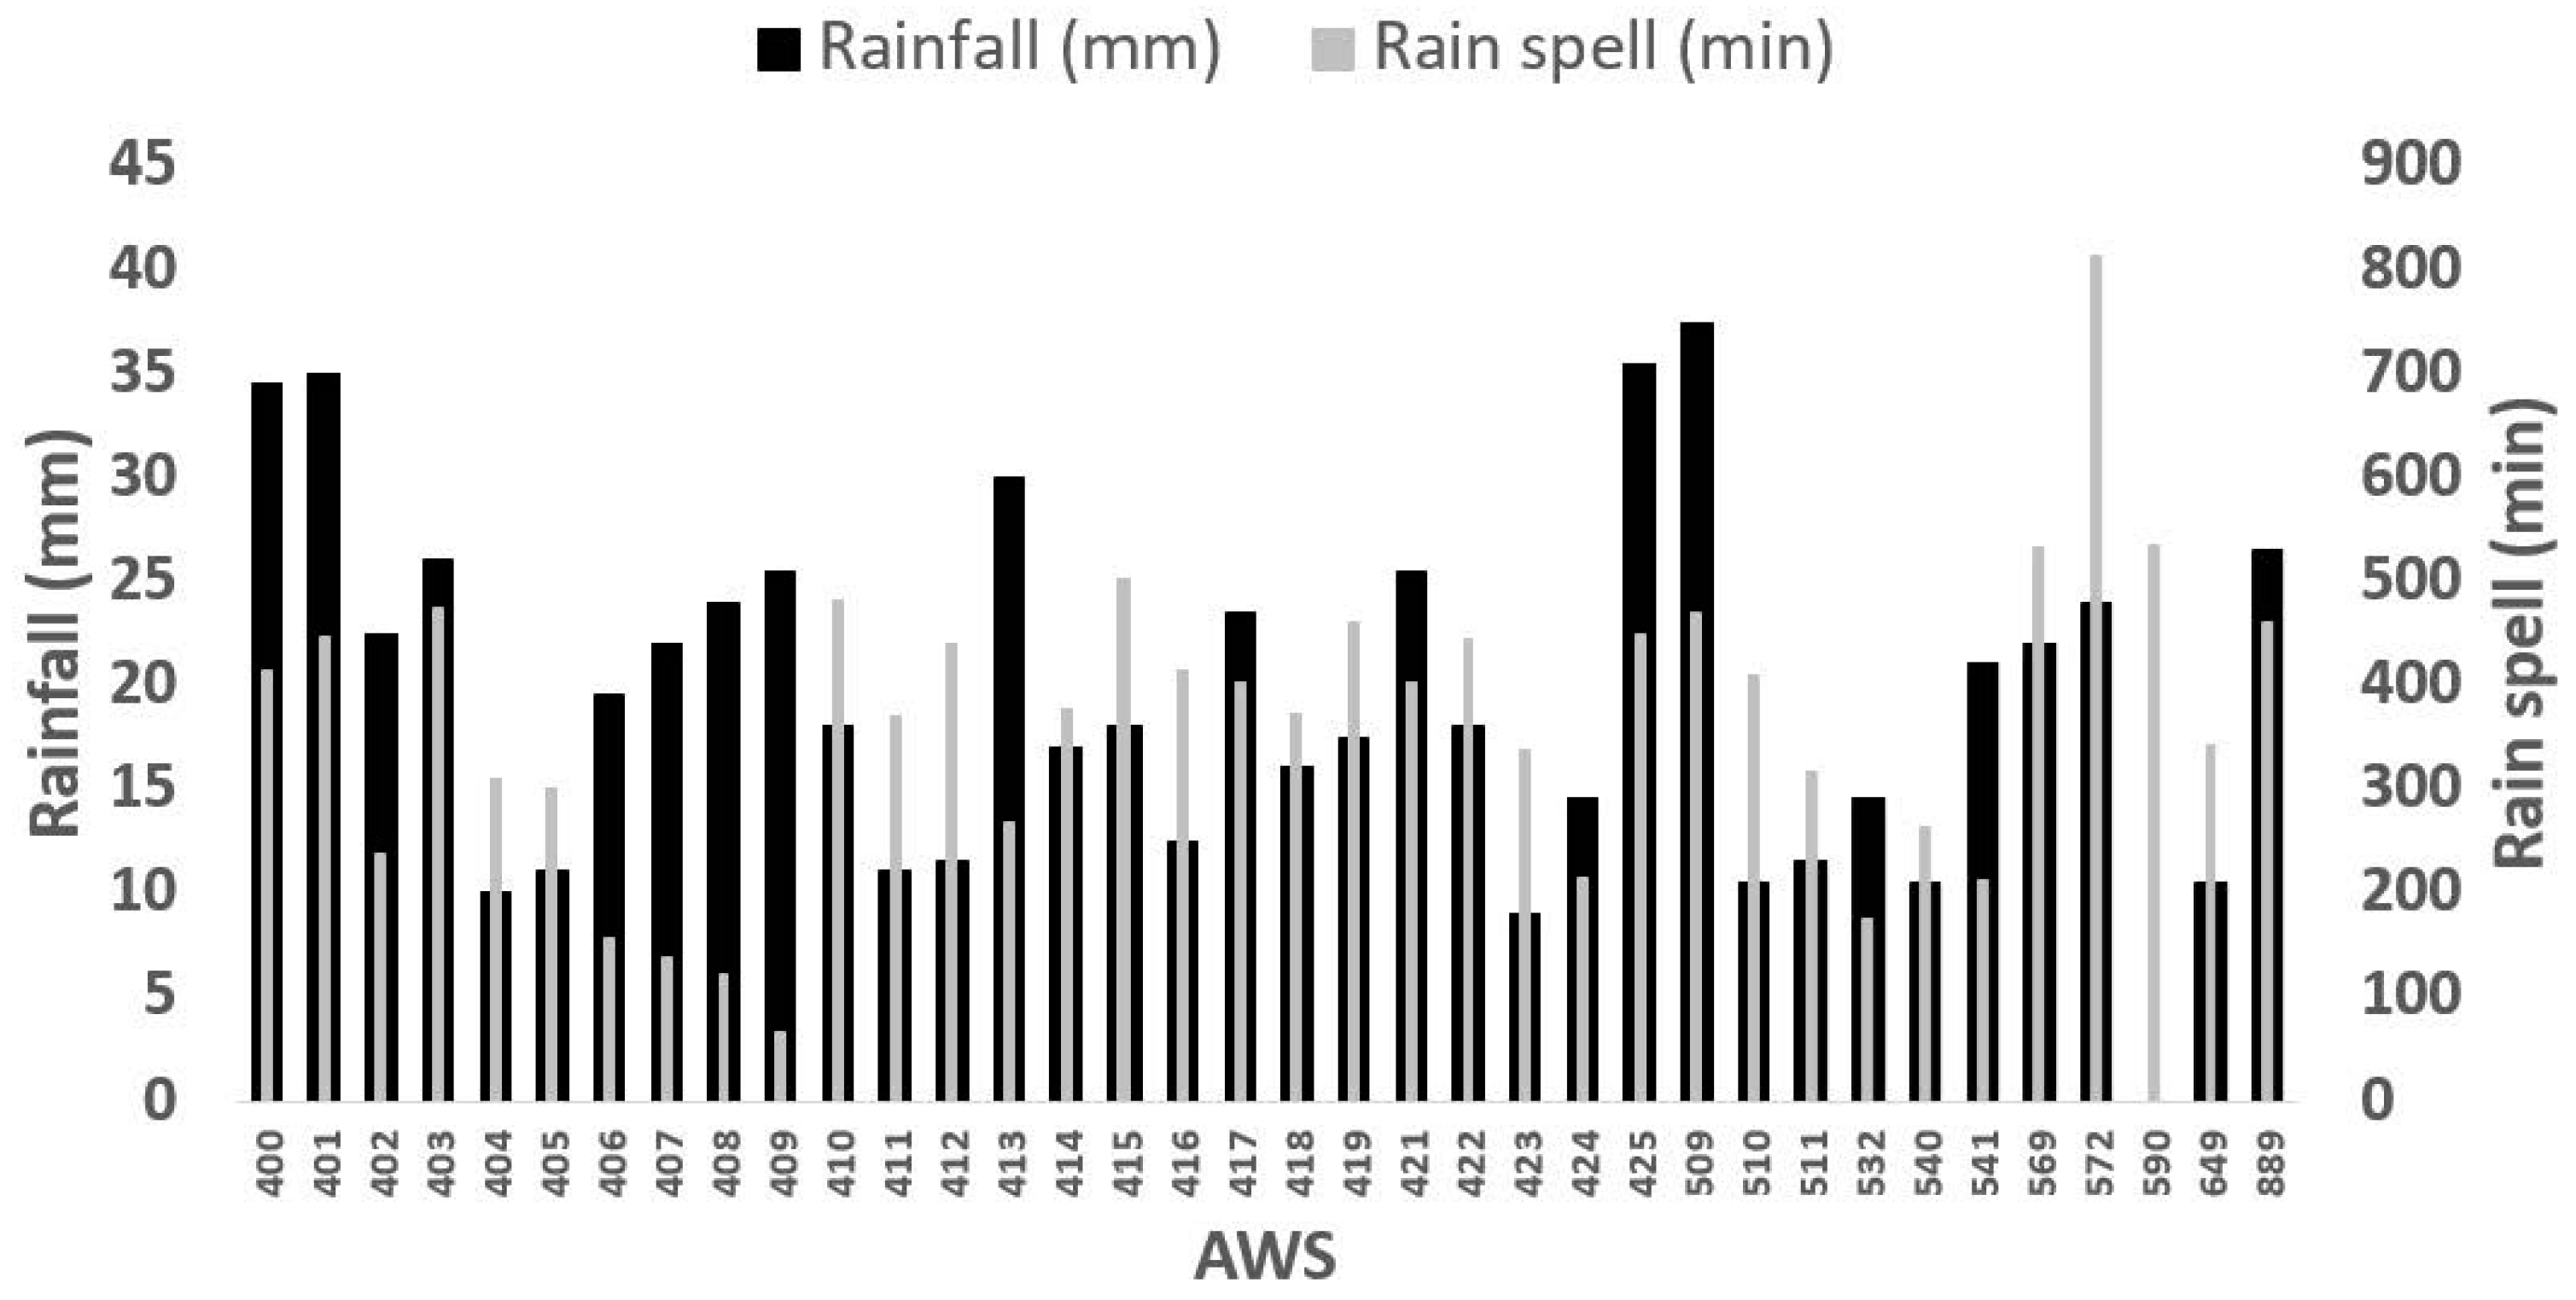
Figure 8 shows that the rainfall rates and rain spells observed by the rain gauges at 36 AWS located around each microwave link differ from one another. Since rainfall varies widely in time and space, the rainfall rate is averaged using the IDW method according to the distance from the rain gauge to the link. The radius of influence (D) in Equation (6) is the maximum correlation distance when the variogram converges to a constant and is determined to be 10 km. Leijnse et al. [33] used a rainfall rate of 2 mm h−1 or more to establish the R-k relationship. Verrier et al. [5] applied a threshold at R = 0.1 mm h−1 (at a maximum 15-s resolution) to eliminate small rainfall rates that would not be observed by most instruments (radars and rain gauges) and demonstrated the existence of multifractal properties over specific scaling regimes. In this study, each power-law R-k relationship was established when the rainfall rate was ≥1 mm h−1 at all rain gauges around each microwave link. Of the 10 rain cases, 7 cases were used for establishing the R-k relationships, and the remaining 3 cases (Cases 4, 7, and 10 in May) were used for the validation set approach.
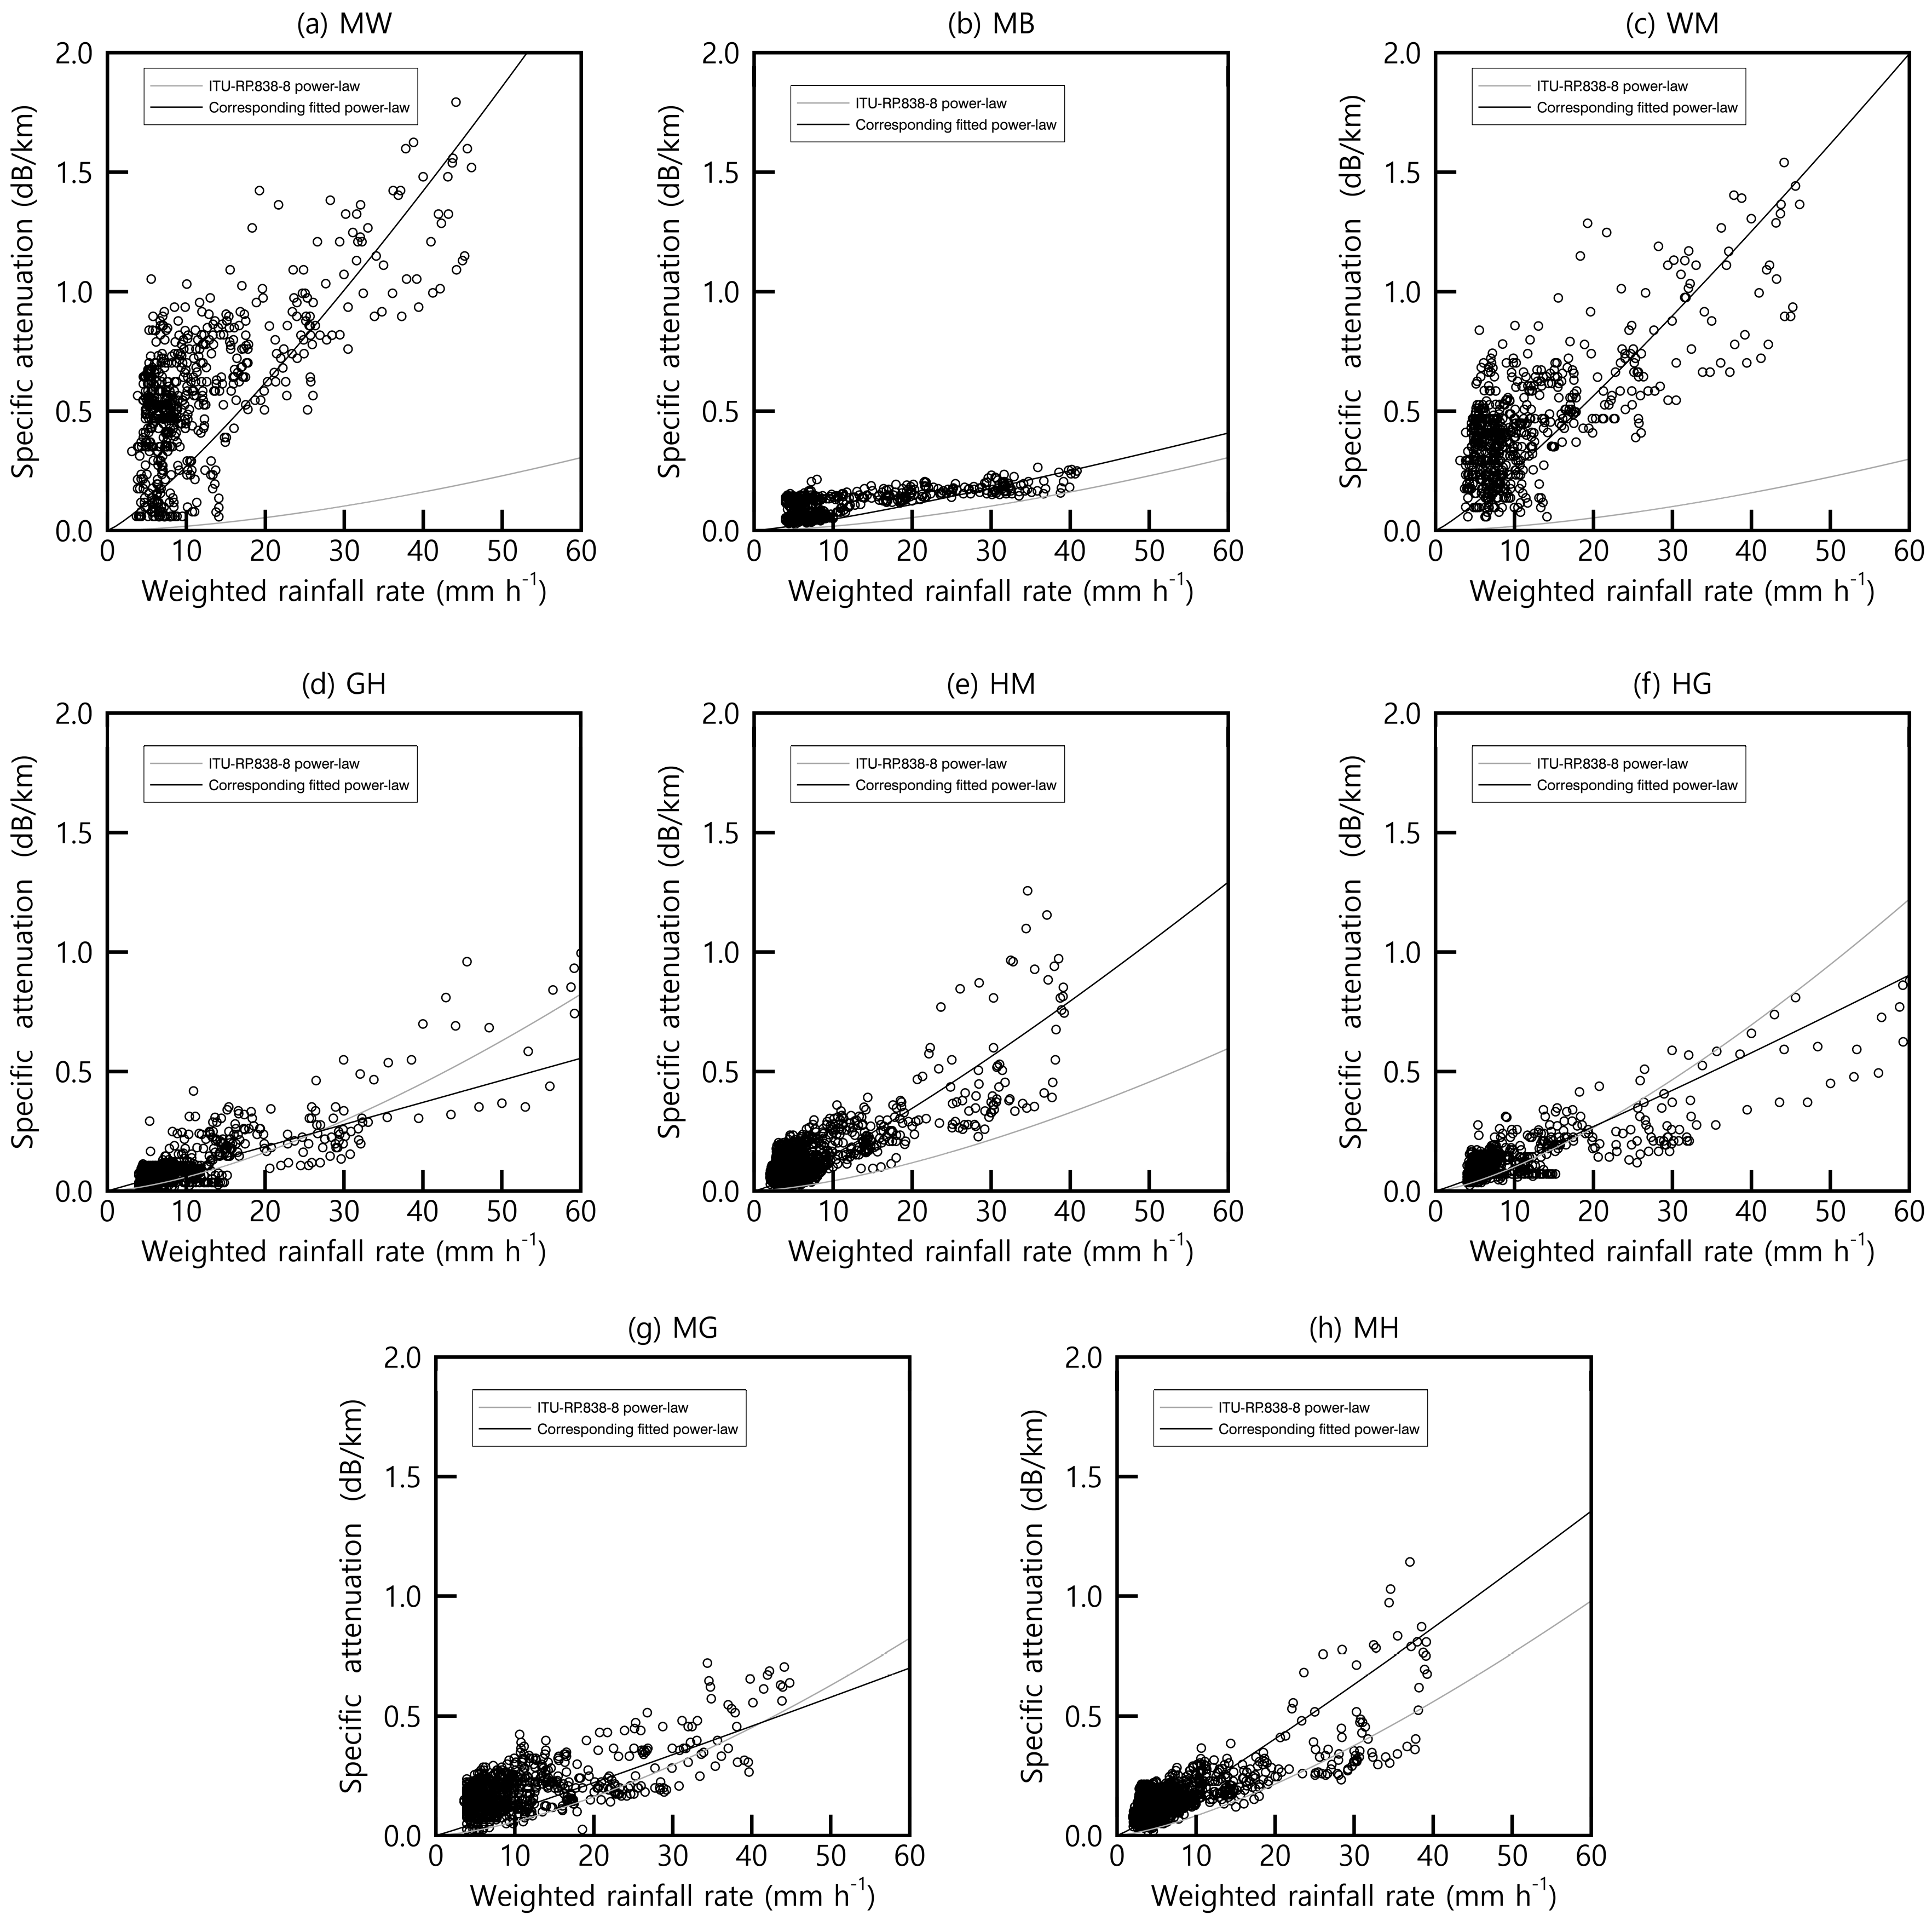
Figure 9 shows the scatter plots for each link; the black solid lines show the fitted power laws for each link, and the gray solid lines show the power-law models given by the ITU-R P.838-8 [42]. The two curves are not very similar, particularly for the WM and MW links (low frequency, short length). The exponent b of the power-law R-k relationship is almost linear, and the prefactor a is larger than that of the ITU-R P.838-8. Goldshtein et al. [21] studied DSD variations with respect to the power-law R-k relationship and suggested that adjustments of the prefactor a and the exponent b may be needed per rainfall event to improve the accuracy of estimation. A longer link produces lower quantization error than a shorter link. Verrier et al. [5] stated that extreme variability in rainfall processes could lead to a scale dependency of the parameters in the usual power law Z-R relationships used in radar rainfall estimations by multifractal statistics and scaling. If both Z and R follow conservative multifractal statistics, the prefactor a should increase as a power law of scale (for usual values b > 1) with a moderate scaling exponent (of the order of 0.1), whereas the exponent b of the power law Z-R relationship should be constant with scale. The power-law R-k relationships are summarized in Table 5.
Despite the differences between prefactor a and exponent b compared with the ITU-R P.838-8 recommendation at a frequency of 7 GHz, the detection and quantification of rainfall rate are very satisfactory, with less than 10% bias. This is due to the nature of convective rainfall in the region. Ramos et al. [28] found attenuation values on the order of 6 dB for a microwave link operating at 5.52 GHz and 18 km of length, even though the ITU-RP.838-3 recommendation states that rain attenuation for frequencies below 6 GHz can be neglected and the prefactor a and exponent b need to be changed to adapt the system to the local weather and environmental conditions. The use of the ITU-R recommendations may result in significant errors, and there is no clear optimal frequency for retrieving rainfall rate using a microwave link [8]. Frey [43] found that, for frequencies () ranging from 2.9 GHz to 54 GHz, prefactor a varies , and exponent b varies for frequencies () ranging from 8.5 GHz to 25 GHz. Fanicia et al. [3] showed that lower frequencies are important for rainfall rate measurements during high rainfall rate events. It was found that the range of reception associated with the higher frequencies was exceeded for some high rainfall rate events, while the lower frequencies were able to provide useful measurements.
The path-averaged rainfall rate was estimated in Case 4, where the maximum rainfall rate measured by the rain gauge was less than 20 mm h−1, and in Case 7, where the maximum rain gauge rainfall rate was 40 mm h−1 or more. The path-averaged rainfall rates calculated using the R-k relationship in Cases 4 and 7 were compared with the weighted rainfall rates (Figure 10). Case 4 had a correlation coefficient of 0.9, an root mean square error (RMSE) of 1.5 mm h−1, and a mean bias of −0.5 mm h−1. Furthermore, Case 7 had a correlation coefficient of 0.9, an RMSE of 2.1 mm h−1, and a mean bias of −0.2 mm h−1. Leijnse et al. [23] stated that the time and length scales of rain events are very important variables to know for the dependence of errors on microwave link length. If the typical length scale of rainfall events is much shorter than the microwave link, the relationship between specific attenuation and rainfall rate will have to be very close to linear in order to provide an accurate path-averaged rainfall rate; however, if the variation in rainfall rate is small along an entire microwave link, this requirement of near-linearity is much less strict. Leijnse et al. [35] reported that uncertainties about the retrieval relations decrease when scatter decreases due to averaging of the spatially variable DSDs for longer microwave links. Leijnse et al. [23] stated that if most of the variation in rainfall occurs within a microwave link (i.e., if the microwave link is much longer than the typical length scale of rainfall cases), then the relation between rainfall rate and specific attenuation will have to be very close to linear. The typical spatial scales are relatively distributed in ranges below 8 km; the typical temporal scales are mostly below 20 min [23]. The microwave link lengths used in this study are very long, except for those at WM and MW (Table 5). The high power resolution (0.01 dBm) of the microwave total path attenuation can capture the dynamics of the considered rainfall.
In Figure 10c,d, the gray solid line represents the path-averaged rainfall rate (R-k rainfall rate) estimated using the power-law R-k relationship, and the black solid line denotes the weighted rainfall rate. The black bar indicates the rain spells recorded by the rain detector closest to the MH link. For Case 4, the comparison between the time series of the weighted rainfall rate and path-averaged rainfall rate estimated using the MH link shows that the dynamics of the rainfall are generally captured (Figure 10c,d). For Case 7, the R-k rainfall rate that could not be detected by the rain gauge can be detected by the MH link. However, the false positive estimated path-averaged rainfall rate from 09:00 to 23:00 on 1 July requires further improvement.
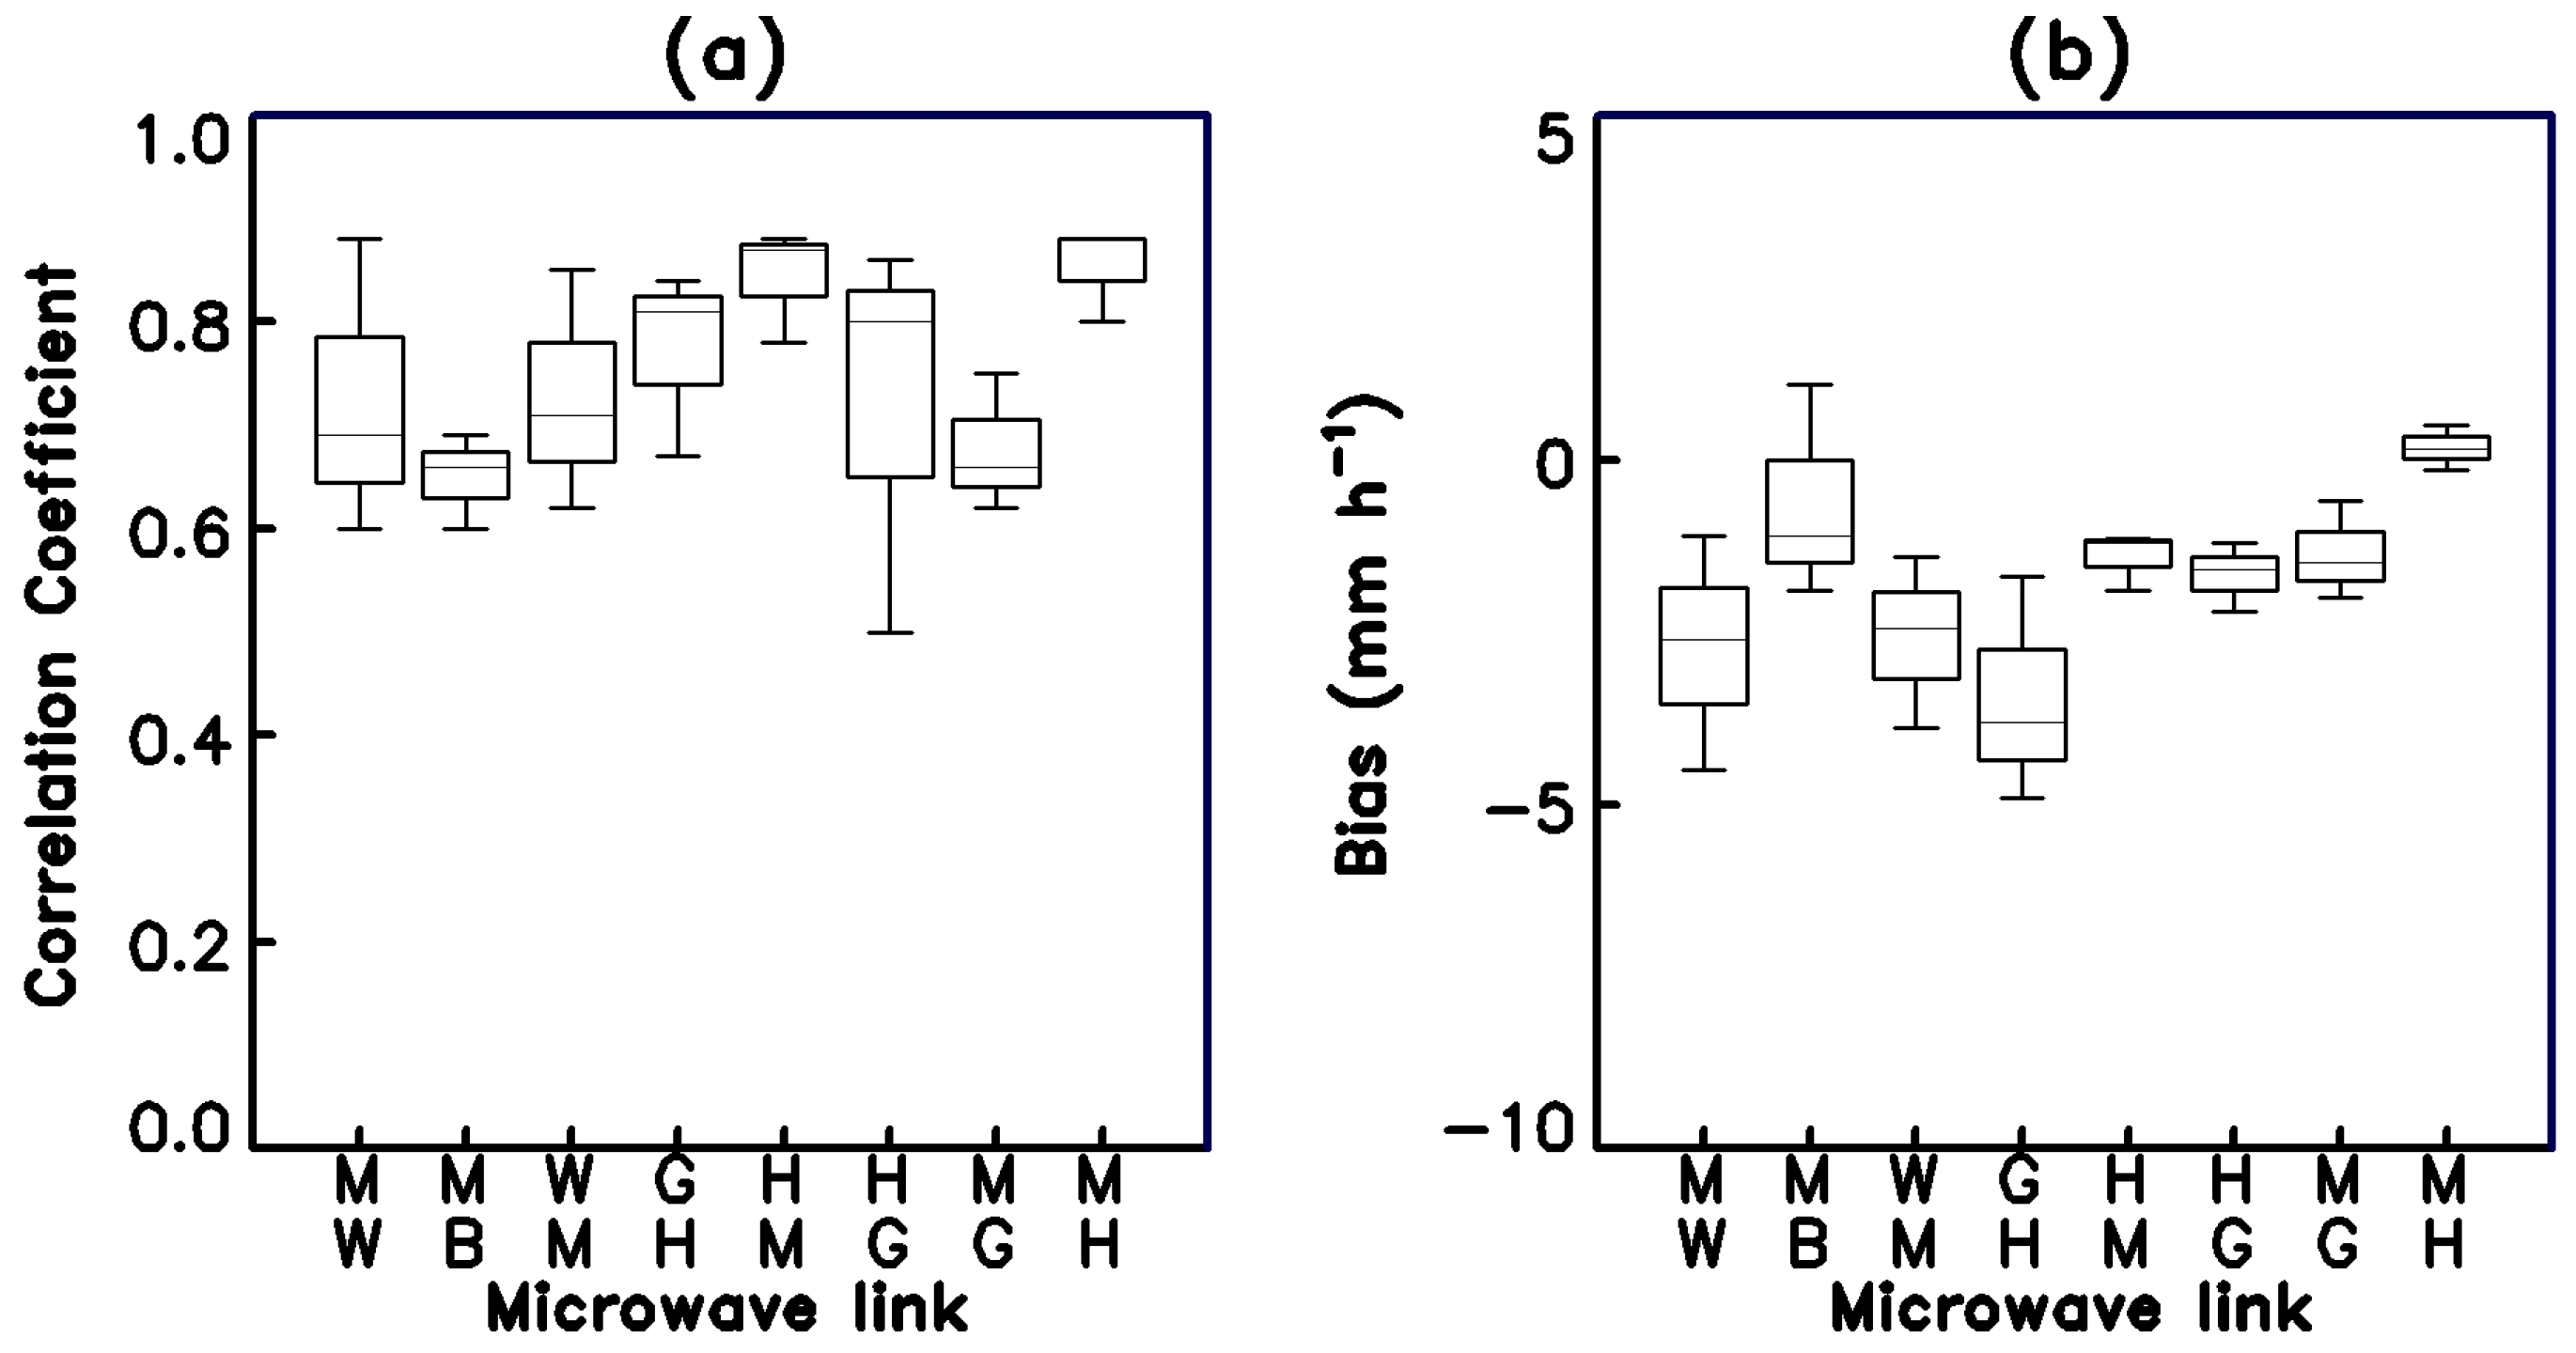
Figure 11 shows a comparison of the weighted rainfall rate and the estimated path-averaged rainfall rate by applying the rain-induced specific attenuation from Cases 4, 7, and 10, which are not used to establish the power-law R-k relationships. The correlation coefficient exceeds 0.65 in all cases, with the exception of the HG link. Furthermore, the mean bias was negative, and the path-averaged rainfall rate was slightly larger than the weighted rainfall rate. The MW link, which has a relatively low sensitivity due to its frequency (6.06 GHz), showed a relatively large bias.
5. Conclusions
The first evaluation of rainfall measurement using lower-frequency microwaves (6–8 GHz) in Korea has proven to be meaningful. Although these frequencies are not optimal for the estimation of weak rainfall rates, due to its lack of sensitivity, it seems to be good when the rainfall rate increases.
The power resolution of the signals in this study was 0.01 dBm, higher than that used in previous studies; the lower resolution values in previous studies tended to cause large rounding errors, especially in long-duration and low-intensity events. Since the sampling interval of 10 min, which is typical for weather radar, can cause errors, measuring near-surface rainfall at a temporal resolution of 1 min is an advantage in hydrometeorology.
Determining the attenuation during clear sky is very important in deriving a useful R-k relationship. Our results confirm that is determined when the optimal window size and the threshold values are used. If is too large, the local variability of microwave attenuation decreases, and thus more rain spells are detected as dry spells. On the other hand, if is too small, then the local variability of microwave attenuation increases, and false positive rainfall events are detected. This error occurs particularly in stratiform rainfall events, when rainfall is relatively light and has a long duration. The median error of real-time rainfall and dry spell detection rates using the rain-induced attenuation was less than 20% for all links, with the exception of the GH link. Furthermore, the test statistic was noted to increase rapidly as soon as the rain started; however, it took some time for the value to decrease at the end of each event.
Practical reasons prevent the location of rain gauges on microwave links to estimate and validate the power-law R-k relationship. Furthermore, a rain spell recorded by a single tipping-bucket rain gauge may be less representative due to the spatiotemporal variability of rainfall. Consequently, the rainfall rate corresponding to microwave attenuation was calculated by applying data from all the rain gauges installed within the radius of influence of the microwave link using the IDW method. In the evaluation of the power law R-k relationship for each link, with data obtained at 1-min intervals using the IDW method, the median correlation coefficient for all links, except for the GH link, exceeded 0.7. Further studies with more links and more events are necessary to precisely quantify the rainfall rate for different types of precipitation. There are more than 5400 microwave links operating throughout Korea, including those in island areas. We have confirmed that microwave links operating at 6–8 GHz frequencies have the potential to detect rain/dry spells and to estimate the path-averaged rainfall rate using rain gauges. The algorithm used in this study provides an alternative monitoring technique that can be useful in underdeveloped nations that need economical surveillance of precipitation.
Author Contributions
M.-S.K. led the manuscript writing and contributed to research design and data analysis. B.H.K. supervised this study, contributed to the research design and manuscript writing, and served as the corresponding author.
Acknowledgments
This research was supported by a grant (17AWMP-B079625-04) from the Water Management Research Program funded by the Ministry of Land, Infrastructure, and Transport of the Korean government. We would like to thank the three anonymous reviewers for their comments, which have greatly improved this manuscript.
Conflicts of Interest
The authors declare no conflict of interest.
References
- Fencl, M.; Dohnal, M.; Rieckermann, J.; Bares, V. Gauge-Adjusted Rainfall Estimates from Commercial Microwave Links. Hydrol. Earth Syst. Sci. 2017, 21, 617–634. [Google Scholar] [CrossRef]
- Rahimi, A.; Holt, A.; Upton, G.; Cummings, R. Use of Dual-Frequency Microwave Links for Measuring Path-Averaged Rainfall. J. Geophys. Res. Atmos. 2003, 108. [Google Scholar] [CrossRef]
- Fenicia, F.; Pfister, L.; Kavetski, D.; Matgen, P.; Iffly, J.; Hoffmann, L.; Uijlenhoet, R. Microwave Links for Rainfall Estimation in an Urban Environment: Insights from an Experimental Setup in Luxembourg-City. J. Hydrol. 2012, 464, 69–78. [Google Scholar] [CrossRef]
- Uijlenhoet, R.; Steiner, M.; Smith, J.A. Variability of Raindrop Size Distributions in a Squall Line and Implications for Radar Rainfall Estimation. J. Hydrometeorol. 2003, 4, 43–61. [Google Scholar] [CrossRef]
- Verrier, S.; Barthès, L.; Mallet, C. Theoretical and Empirical Scale Dependency of Z-R Relationships: Evidence, Impacts, and Correction. J. Geophys. Res. Atmos. 2013, 118, 7435–7449. [Google Scholar] [CrossRef]
- Humphrey, M.; Istok, J.; Lee, J.; Hevesi, J.; Flint, A. A New Method for Automated Dynamic Calibration of Tipping-Bucket Rain Gauges. J. Atmos. Ocean. Technol. 1997, 14, 1513–1519. [Google Scholar] [CrossRef]
- Molini, A.; Lanza, L.; La Barbera, P. The Impact of Tipping-bucket Raingauge Measurement Errors on Design Rainfall for Urban-Scale Applications. Hydrol. Process. 2005, 19, 1073–1088. [Google Scholar] [CrossRef]
- Berne, A.; Uijlenhoet, R. Path-averaged Rainfall Estimation Using Microwave Links: Uncertainty Due to Spatial Rainfall Variability. Geophys. Res. Lett. 2007, 34. [Google Scholar] [CrossRef]
- Atlas, D.; Ulbrich, C.W. Path-and Area-Integrated Rainfall Measurement by Microwave Attenuation in the 1–3 cm Band. J. Appl. Meteorol. 1977, 16, 1322–1331. [Google Scholar] [CrossRef]
- Olsen, R.; Rogers, D.V.; Hodge, D. The aR B Relation in the Calculation of Rain Attenuation. IEEE Trans. Antennas Propag. 1978, 26, 318–329. [Google Scholar] [CrossRef]
- Krämer, S.; Verworn, H.; Redder, A. Improvement of X-Band Radar Rainfall Estimates Using a Microwave Link. Atmos. Res. 2005, 77, 278–299. [Google Scholar] [CrossRef]
- Messer, H.; Zinevich, A.; Alpert, P. Environmental Monitoring by Wireless Communication Networks. Science 2006, 312, 713. [Google Scholar] [CrossRef] [PubMed]
- Overeem, A.; Leijnse, H.; Uijlenhoet, R. Measuring Urban Rainfall Using Microwave Links from Commercial Cellular Communication Networks. Water Resour. Res. 2011, 47. [Google Scholar] [CrossRef]
- Mercier, F.; Barthès, L.; Mallet, C. Estimation of Finescale Rainfall Fields using Broadcast TV Satellite Links and a 4DVAR Assimilation Method. J. Atmos. Ocean. Technol. 2015, 32, 1709–1728. [Google Scholar] [CrossRef]
- Zinevich, A.; Messer, H.; Alpert, P. Frontal Rainfall Observation by a Commercial Microwave Communication Network. J. Appl. Meteorol. Climatol. 2009, 48, 1317–1334. [Google Scholar] [CrossRef]
- Schleiss, M.; Berne, A. Identification of Dry and Rainy Periods using Telecommunication Microwave Links. IEEE Geosci. Remote Sens. Lett. 2010, 7, 611–615. [Google Scholar] [CrossRef]
- Rayitsfeld, A.; Samuels, R.; Zinevich, A.; Hadar, U.; Alpert, P. Comparison of Two Methodologies for Long Term Rainfall Monitoring Using a Commercial Microwave Communication System. Atmos. Res. 2012, 104, 119–127. [Google Scholar] [CrossRef]
- Ostrometzky, J.; Cherkassky, D.; Messer, H. Accumulated Mixed Precipitation Estimation Using Measurements from Multiple Microwave Links. Adv. Meteorol. 2015, 2015. [Google Scholar] [CrossRef]
- Minda, H.; Nakamura, K. High Temporal Resolution Path-Average Rain Gauge with 50-GHz Band Microwave. J. Atmos. Ocean. Technol. 2005, 22, 165–179. [Google Scholar] [CrossRef]
- Upton, G.; Holt, A.; Cummings, R.; Rahimi, A.; Goddard, J. Microwave Links: The Future for Urban Rainfall Measurement? Atmos. Res. 2005, 77, 300–312. [Google Scholar] [CrossRef]
- Goldshtein, O.; Messer, H.; Zinevich, A. Rain Rate Estimation Using Measurements from Commercial Telecommunications Links. IEEE Trans. Signal Process. 2009, 57, 1616–1625. [Google Scholar] [CrossRef]
- Zhang, P.; Liu, X.; Li, Z.; Zhou, Z.; Song, K.; Yang, P. Attenuation Correction of Weather Radar Reflectivity with Arbitrary Oriented Microwave Link. Adv. Meteorol. 2017, 2017. [Google Scholar] [CrossRef]
- Leijnse, H.; Uijlenhoet, R.; Stricker, J. Microwave Link Rainfall Estimation: Effects of Link Length and Frequency, Temporal Sampling, Power Resolution, and Wet Antenna Attenuation. Adv. Water Resour. 2008, 31, 1481–1493. [Google Scholar] [CrossRef]
- Overeem, A.; Leijnse, H.; Uijlenhoet, R. Country-Wide Rainfall Maps from Cellular Communication Networks. Proc. Natl. Acad. Sci. USA 2013, 110, 2741–2745. [Google Scholar] [CrossRef] [PubMed]
- Fencl, M.; Rieckermann, J.; Sýkora, P.; Stránský, D.; Bareš, V. Commercial Microwave Links Instead of Rain Gauges: Fiction or Reality? Water Sci. Technol. 2015, 71, 31–37. [Google Scholar] [CrossRef] [PubMed]
- Barthès, L.; Mallet, C. Rainfall Measurement from the Opportunistic Use of an Earth–Space Link in the Ku Band. Atmos. Meas. Tech. 2013, 6, 2181–2193. [Google Scholar] [CrossRef] [Green Version]
- Doumounia, A.; Gosset, M.; Cazenave, F.; Kacou, M.; Zougmore, F. Rainfall Monitoring Based on Microwave Links from Cellular Telecommunication Networks: First Results from a West African Test Bed. Geophys. Res. Lett. 2014, 41, 6016–6022. [Google Scholar] [CrossRef]
- Ramos, B.; Cordero, M.; Hurtado, K.; Núñez, A.; D’Amico, M. Rain Rate Estimation using a Microwave Link in Guayaquil City. In Proceedings of the 2017 IEEE Second Ecuador Technical Chapters Meeting (ETCM), Salinas, Ecuador, 16–20 October 2017; pp. 1–6. [Google Scholar]
- Wang, B.; Ding, Q.; Jhun, J. Trends in Seoul (1778–2004) Summer Precipitation. Geophys. Res. Lett. 2006, 33. [Google Scholar] [CrossRef]
- Jeong, S.; Kim, Y.; Lee, J.K.; Kim, J. The 27 July 2011 Debris Flows at Umyeonsan, Seoul, Korea. Landslides 2015, 12, 799–813. [Google Scholar] [CrossRef]
- Jarraud, M. Guide to Meteorological Instruments and Methods of Observation (WMO-no. 8); World Meteorological Organisation: Geneva, Switzerland, 2008. [Google Scholar]
- Park, S.; Lee, G. Calibration of Radar Reflectivity Measurements from the KMA Operational Radar Network. Asia-Pac. J. Atmos. Sci. 2010, 46, 243–259. [Google Scholar] [CrossRef]
- Leijnse, H.; Uijlenhoet, R.; Stricker, J. Rainfall Measurement Using Radio Links from Cellular Communication Networks. Water Resour. Res. 2007, 43. [Google Scholar] [CrossRef]
- Jameson, A. A Comparison of Microwave Techniques for Measuring Rainfall. J. Appl. Meteorol. 1991, 30, 32–54. [Google Scholar] [CrossRef] [Green Version]
- Leijnse, H.; Uijlenhoet, R.; Berne, A. Errors and Uncertainties in Microwave Link Rainfall Estimation Explored Using Drop Size Measurements and High-Resolution Radar Data. J. Hydrometeorol. 2010, 11, 1330–1344. [Google Scholar] [CrossRef] [Green Version]
- Kaufmann, M.; Rieckermann, J. Identification of Dry and Rainy Periods Using Telecommunication Microwave Links. In Proceedings of the 12nd International Conference on Urban Drainage, Porto Alegre, RS, Brazil, 11–16 September 2011; pp. 10–15. [Google Scholar]
- Verrier, S.; De Montera, L.; Barthès, L.; Mallet, C. Multifractal Analysis of African Monsoon Rain Fields, Taking into Account the Zero Rain-Rate Problem. J. Hydrol. 2010, 389, 111–120. [Google Scholar] [CrossRef]
- Verrier, S.; Mallet, C.; Barthès, L. Multiscaling Properties of Rain in the Time Domain, Taking into Account Rain Support Biases. J. Geophys. Res. Atmos. 2011, 116. [Google Scholar] [CrossRef]
- Szolgay, J.; Parajka, J.; Kohnová, S.; Hlavčová, K. Comparison of Mapping Approaches of Design Annual Maximum Daily Precipitation. Atmos. Res. 2009, 92, 289–307. [Google Scholar] [CrossRef]
- Ahrens, B. Distance in Spatial Interpolation of Daily Rain Gauge Data. Hydrol. Earth Syst. Sci. Discuss. 2006, 10, 197–208. [Google Scholar] [CrossRef]
- Gaona, M.R.; Overeem, A.; Leijnse, H.; Bierkens, M.; Uijlenhoet, R. Rainfall Field Estimation Using Simulated Microwave Link Information. In Proceedings of the 11th International Precipitation Conference, Ede, The Netherlands, 30 June–3 July 2013; p. 73. [Google Scholar]
- ITU-R Recommendations. 838-3. Specific Attenuation Model for Rain for Use in Prediction Methods; P Series Fasicle; ITU: Geneva, Switzerland, 2005. [Google Scholar]
- Frey, T.L. The Effects of the Atmosphere and Weather on the Performance of a mm-Wave Communication Link. Appl. Microw. Wirel. 1999, 11, 76–81. [Google Scholar]
Figure 1.
Location of the research area (Seoul metropolitan area) in Korea. Lines represent microwave links, and triangle symbols indicate the automatic weather stations.
Figure 1.
Location of the research area (Seoul metropolitan area) in Korea. Lines represent microwave links, and triangle symbols indicate the automatic weather stations.

Figure 2.
Average of total path attenuation of eight microwave links ((a) MW link, (b) MB link, (c) WM link, (d) GH link, (e) HM link, (f) HG link, (g) MG link, (h) MH link) during Case 6; the rain spell (top gray bars) recorded by the rain detector and the rainfall (bottom black bars) recorded by the rain gauge.

Figure 3.
Spatial distributions of the radar composite rainfall rate at (a) 04:10 LST on 15 June 2016, (b) 07:20 LST on 15 June 2016, (c) 09:40 LST on 15 June 2016, (d) 12:10 LST on 15 June 2016 during Case 6.
Figure 3.
Spatial distributions of the radar composite rainfall rate at (a) 04:10 LST on 15 June 2016, (b) 07:20 LST on 15 June 2016, (c) 09:40 LST on 15 June 2016, (d) 12:10 LST on 15 June 2016 during Case 6.

Figure 4.
Average of total path attenuation (black solid line) and the test statistic for the local variation in total path attenuation (gray solid line) variations according to the change in window size ((a) 60 min and (b) 90 min) at the MH link for Case 4.
Figure 4.
Average of total path attenuation (black solid line) and the test statistic for the local variation in total path attenuation (gray solid line) variations according to the change in window size ((a) 60 min and (b) 90 min) at the MH link for Case 4.

Figure 5.
Rainfall detection according to (a) threshold and (b) window size at all links for Case 4.
Figure 5.
Rainfall detection according to (a) threshold and (b) window size at all links for Case 4.

Figure 6.
(black solid line) and (gray solid line) variations according to the power resolution ((a) 1 dBm and (b) 0.01 dBm) at the MH link for Case 2.
Figure 6.
(black solid line) and (gray solid line) variations according to the power resolution ((a) 1 dBm and (b) 0.01 dBm) at the MH link for Case 2.

Figure 7.
For the 10 rainfall cases, (a) rainfall detection rate, (b) dry detection rate, (c) dry detection rate during rainfall, and (d) rainfall detection rate during dry spells.
Figure 7.
For the 10 rainfall cases, (a) rainfall detection rate, (b) dry detection rate, (c) dry detection rate during rainfall, and (d) rainfall detection rate during dry spells.

Figure 8.
Rainfall measured by the rain gauges of 36 AWS for Case 6 and the rain spell recorded by the rain detectors.
Figure 8.
Rainfall measured by the rain gauges of 36 AWS for Case 6 and the rain spell recorded by the rain detectors.

Figure 9.
Specific attenuation versus weighted rainfall rate calculated by the Inverse Distance Weighting (IDW) method for microwave links ((a) MW link, (b) MB link, (c) WM link, (d) GH link, (e) HM link, (f) HG link, (g) MG link, (h) MH link) with frequencies ranging from 6 to 8 GHz and time resolutions of 1 min. The black solid lines represent the corresponding fitted power-law R-k relationships. The gray solid lines indicate the International Telecommunication Union (ITU)-RP.838-8 power-law R-k relationships.

Figure 10.
(a) Path-averaged rainfall rate with the weighted rainfall rate for the MH link for (a) Case 4 and (b) Case 7. Temporal variations of path-averaged rainfall rate and weighted rainfall rate for the MH link for (c) Case 4 and (d) Case 7.
Figure 10.
(a) Path-averaged rainfall rate with the weighted rainfall rate for the MH link for (a) Case 4 and (b) Case 7. Temporal variations of path-averaged rainfall rate and weighted rainfall rate for the MH link for (c) Case 4 and (d) Case 7.

Figure 11.
(a) Correlation coefficients and (b) bias of the path-averaged rainfall rate to the weighted rainfall rate for all eight microwave links for Cases 4, 7, and 10.
Figure 11.
(a) Correlation coefficients and (b) bias of the path-averaged rainfall rate to the weighted rainfall rate for all eight microwave links for Cases 4, 7, and 10.


Table 1.
Characteristics of the microwave links.
| Link Name | Receiving Antenna | Transmitting Antenna | Frequency (GHz) | Nearest AWS | Power (dBm) | Link Length (km) |
|---|---|---|---|---|---|---|
| HG | Heyhwa | Geomdan | 8.06 | 419 | 29 | 21.1 |
| GH | Geomdan | Heyhwa | 7.75 | 413 | 29 | 21.1 |
| WM | Woomyeon | Manggyeong | 6.32 | 401 | 29 | 5.7 |
| MW | Manggyeong | Woomyeon | 6.06 | 401 | 29 | 5.7 |
| MH | Manggyeong | Heyhwa | 8.26 | 401 | 30 | 17.6 |
| HM | Heyhwa | Manggyeong | 7.95 | 421 | 30 | 17.6 |
| MB | Manggyeong | Gobong | 6.23 | 425 | 30 | 37.4 |
| MG | Manggyeong | Geomdan | 8.1 | 572 | 29 | 13.4 |
AWS, automated weather station.
Table 2.
Rainfall amounts and rain spells recorded for 10 cases at five rain gauges installed near the microwave links.
Table 2.
Rainfall amounts and rain spells recorded for 10 cases at five rain gauges installed near the microwave links.
| Case | Type of Rainfall Rate | Maximum Radar Rainfall Rate (mm h−1) | Total Rainfall (mm) | Rain spell from Rain Gauge (min) | Rain spell from Rain Detector (min) | |||||||||
|---|---|---|---|---|---|---|---|---|---|---|---|---|---|---|
| 401 | 413 | 419 | 425 | 401 | 413 | 419 | 425 | 401 | 413 | 419 | 425 | |||
| 1 | convective | 25 | 53 | 56 | 44 | 73 | 106 | 111 | 88 | 145 | 1383 | 966 | 1213 | 1372 |
| 2 | stratiform | 9 | 9 | 10 | 13 | 8 | 17 | 19 | 26 | 16 | 305 | 214 | 565 | 395 |
| 3 | stratiform | 5 | 14 | 14 | 6 | 16 | 28 | 27 | 12 | 32 | 621 | 456 | 318 | 666 |
| 4 | convective | 20 | 45 | 42 | 42 | 55 | 89 | 84 | 83 | 110 | 764 | 557 | 676 | 730 |
| 5 | stratiform | 8 | 31 | 31 | 36 | 42 | 61 | 62 | 71 | 83 | 644 | 525 | 635 | 626 |
| 6 | convective | 20 | 35 | 30 | 18 | 36 | 63 | 59 | 33 | 67 | 447 | 268 | 461 | 450 |
| 7 | convective | 50 | 115 | 119 | 57 | 134 | 180 | 238 | 109 | 206 | 1006 | 554 | 1076 | 967 |
| 8 | convective | 50 | 138 | 155 | 124 | 154 | 244 | 255 | 196 | 254 | 1764 | 820 | 1033 | 1509 |
| 9 | stratiform | 7 | 47 | 48 | 31 | 64 | 93 | 95 | 62 | 126 | 1092 | 472 | 843 | 1371 |
| 10 | convective | 80 | 23 | 38 | 33 | 33 | 39 | 44 | 50 | 56 | 332 | 137 | 254 | 386 |
Table 3.
Accuracy of rainfall detection according to the change.
| Case | Data Resolution | Rain Detector | RR (%) | DD (%) | RD (%) | DR (%) | |||
|---|---|---|---|---|---|---|---|---|---|
| 4 | 60 min | 0.01 dB | 0.09 | 764 | 526 | 68.8 | 97.8 | 28.9 | 0.4 |
| 90 min | 725 | 97.9 | 93.6 | 2.1 | 4.6 |
RR, rate of rainfall detection during a rain spell; DD, rate of dry detection during a dry spell; RD, rate of rainfall detection during a dry spell; DR, rate of dry detection during a rain spell.
Table 4.
Accuracy of rainfall detection according to data resolution.
| Case | Data Resolution | Rain Detector | RR (%) | DD (%) | RD (%) | DR (%) | |||
|---|---|---|---|---|---|---|---|---|---|
| 2 | 1 dB | 90 min | 0.09 | 305 | 134 | 43.9 | 97.7 | 56.1 | 0.8 |
| 0.01 dB | 248 | 81.3 | 88.3 | 18.7 | 10.2 |
Table 5.
Characteristics of the microwave links, and R-k relationships.
| Link Name | Frequency (GHz) | Polarization | Path Length (km) | R-k Relationships | ITU-R P.838-8 R-k Relationships |
|---|---|---|---|---|---|
| GH | 7.75 | H | 21.1 | ||
| HG | 8.06 | H | 21.1 | ||
| MG | 8.1 | H | 13.4 | ||
| WM | 6.32 | V | 5.7 | ||
| MW | 6.06 | V | 5.7 | ||
| MB | 6.23 | V | 37.4 | ||
| MH | 8.26 | V | 17.6 | ||
| HM | 7.95 | V | 17.6 |
© 2018 by the authors. Licensee MDPI, Basel, Switzerland. This article is an open access article distributed under the terms and conditions of the Creative Commons Attribution (CC BY) license (http://creativecommons.org/licenses/by/4.0/).
Share and Cite
MDPI and ACS Style
Kim, M.-S.; Kwon, B.H. Rainfall Detection and Rainfall Rate Estimation Using Microwave Attenuation. Atmosphere 2018, 9, 287. https://doi.org/10.3390/atmos9080287
AMA Style
Kim M-S, Kwon BH. Rainfall Detection and Rainfall Rate Estimation Using Microwave Attenuation. Atmosphere. 2018; 9(8):287. https://doi.org/10.3390/atmos9080287
Chicago/Turabian StyleKim, Min-Seong, and Byung Hyuk Kwon. 2018. "Rainfall Detection and Rainfall Rate Estimation Using Microwave Attenuation" Atmosphere 9, no. 8: 287. https://doi.org/10.3390/atmos9080287
Note that from the first issue of 2016, this journal uses article numbers instead of page numbers. See further details here.