Analysis of Dust Aerosol Retrievals Using Satellite Data in Central Asia


Abstract
1. Introduction
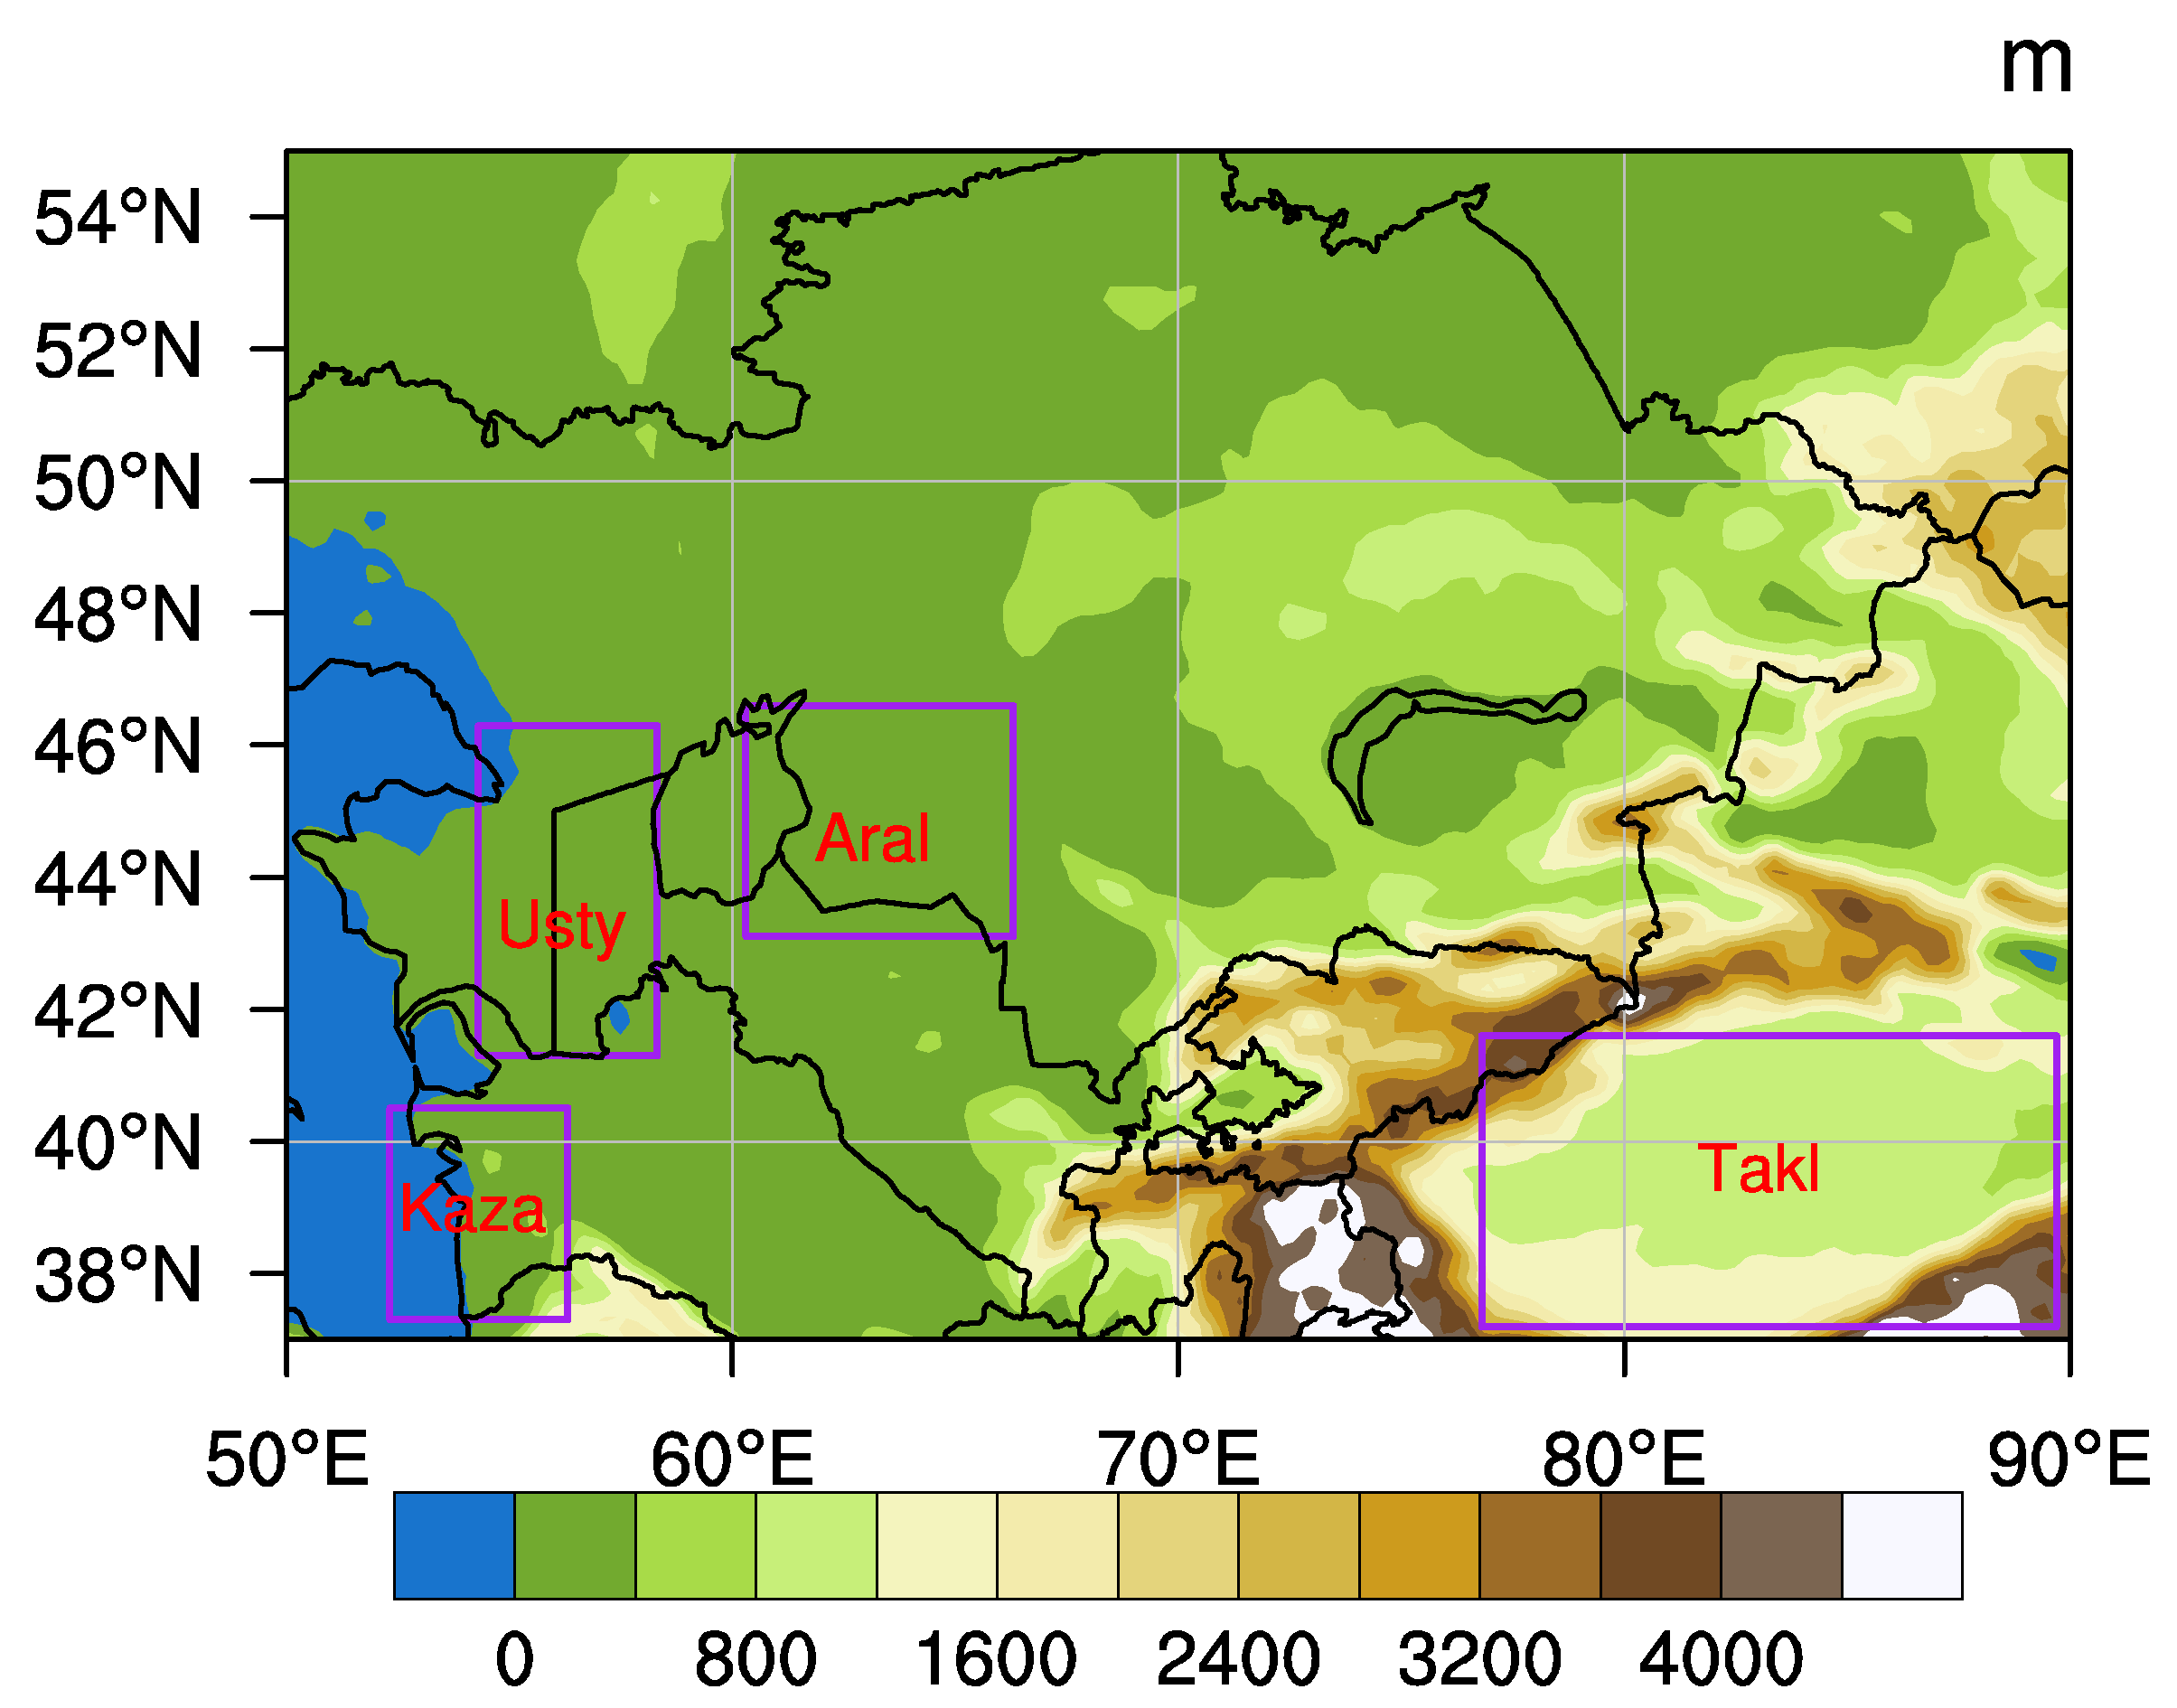
2. The Study Domain
3. Data
3.1. MODIS AOD
3.2. SeaWiFS AOD
3.3. MISR AOD
3.4. OMI AAI
3.5. CALIPSO Data
4. Methodology
5. Results
5.1. The Variability of DOD
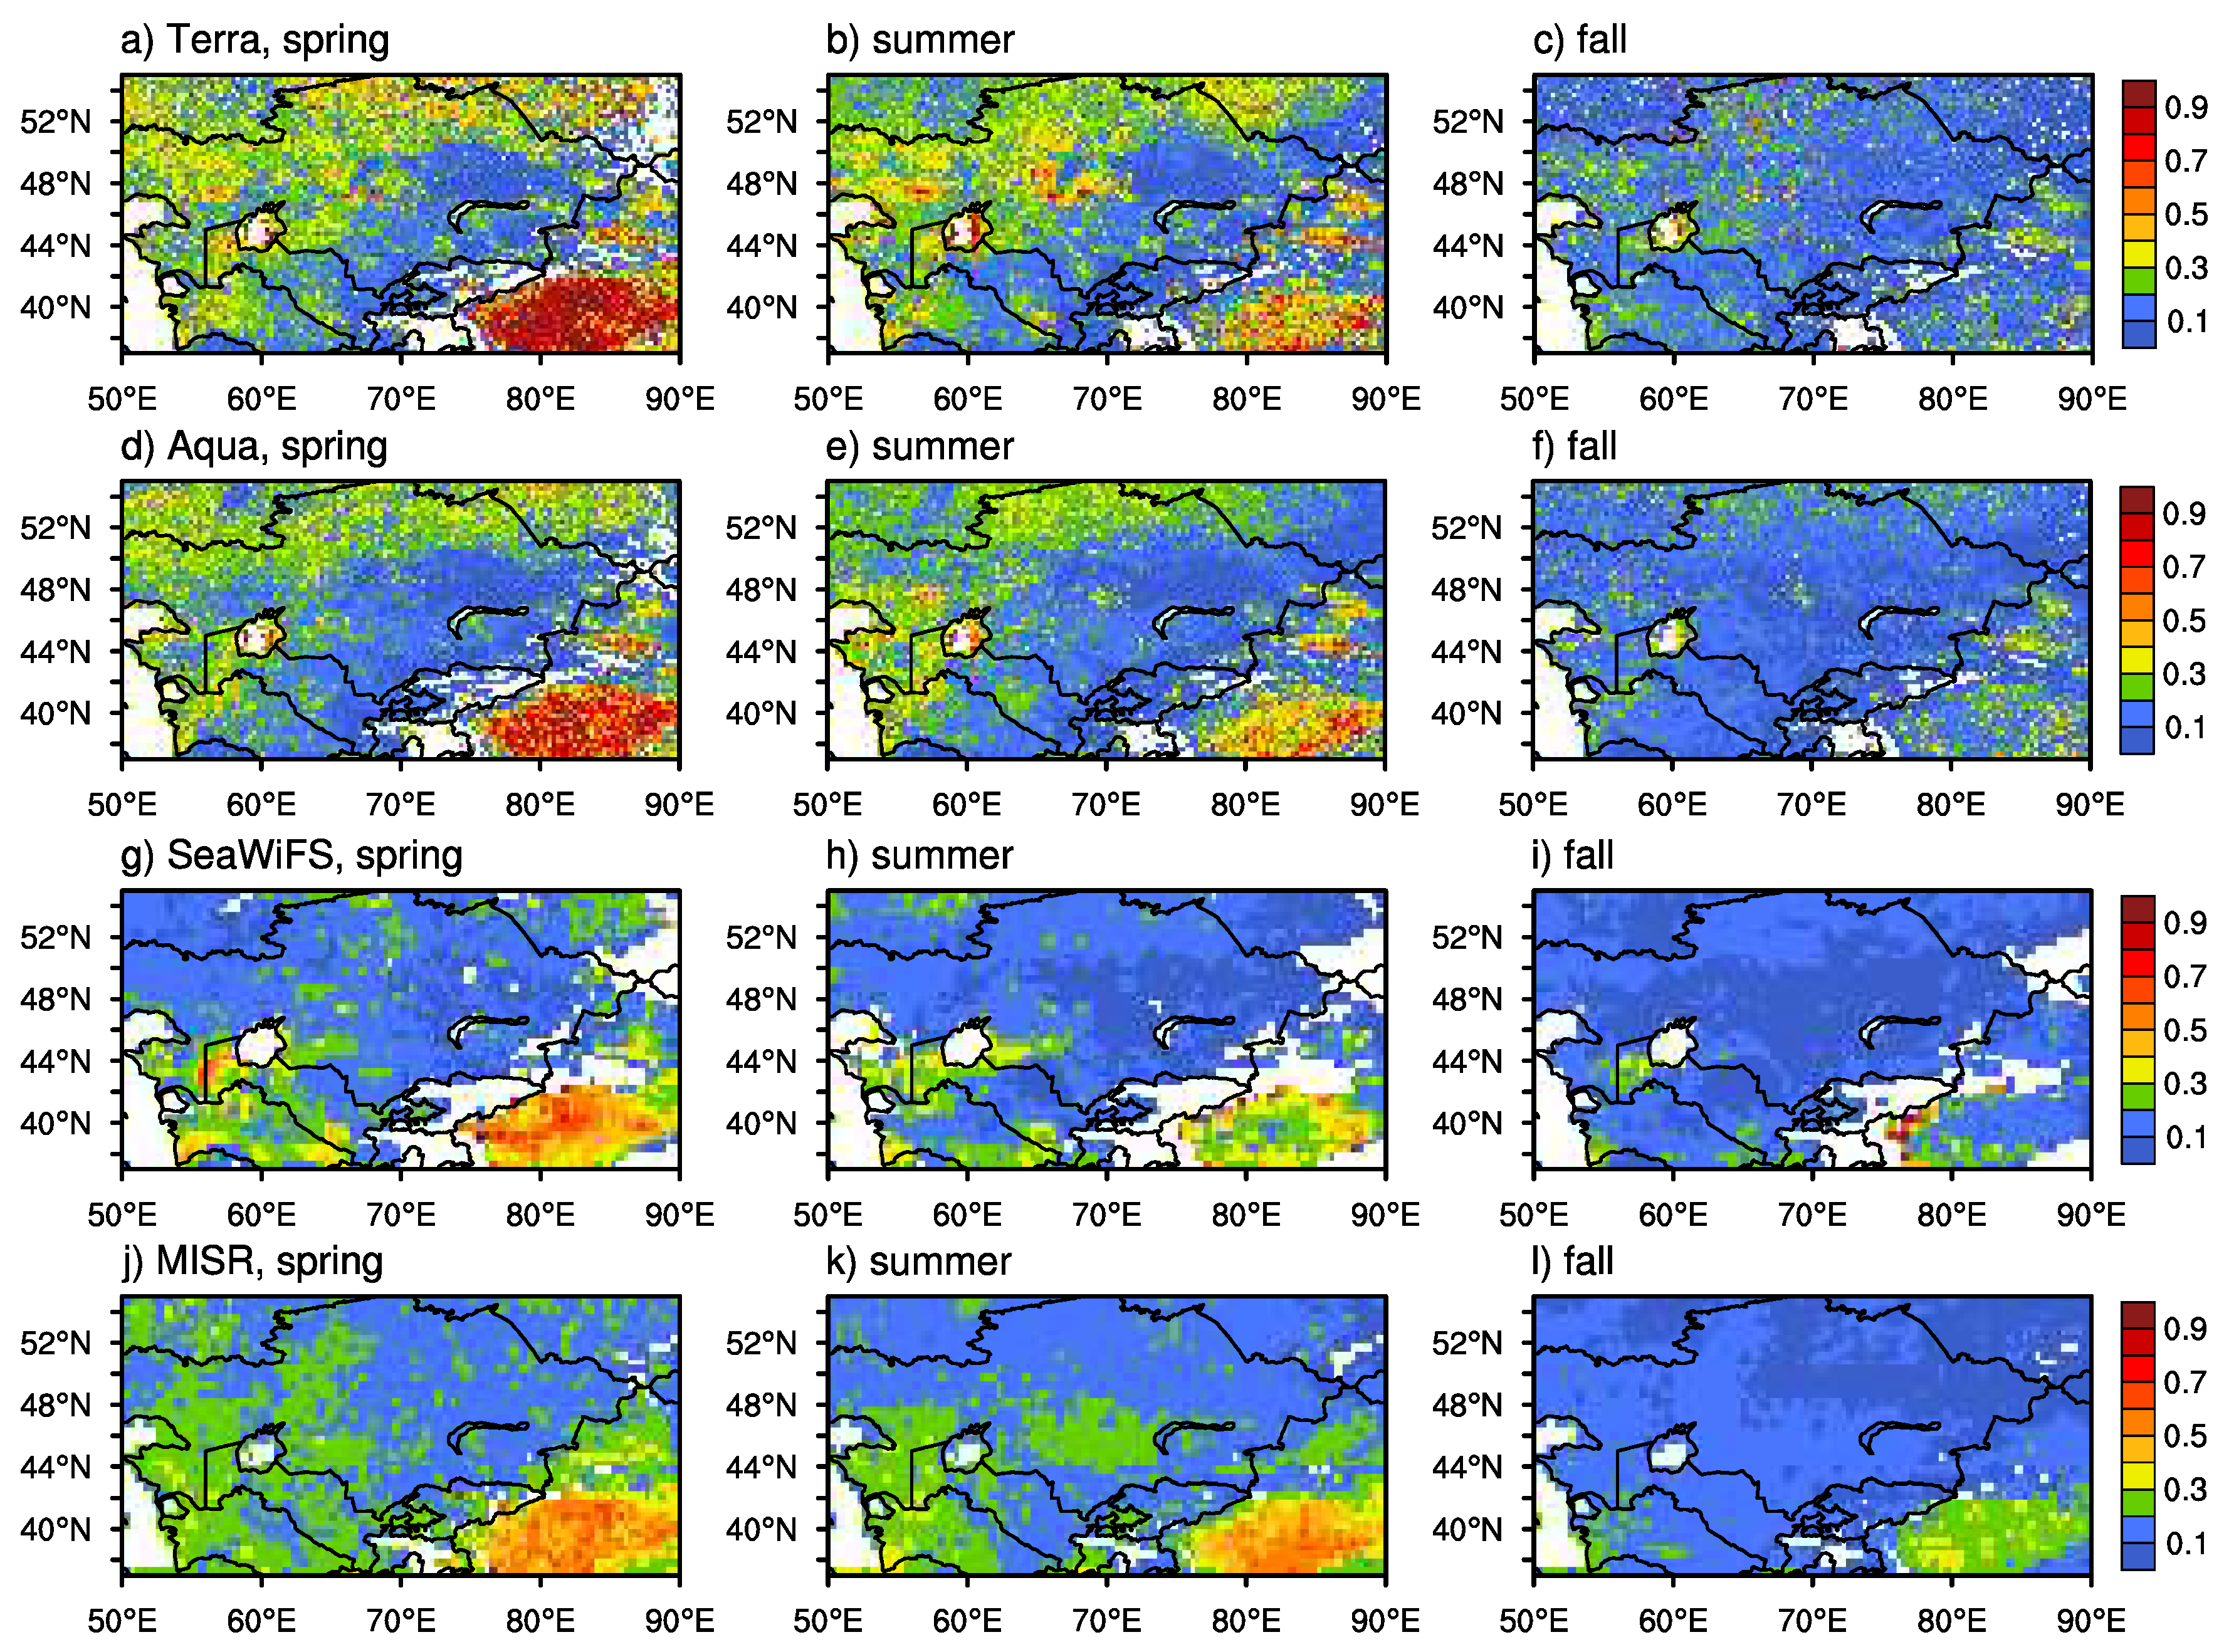
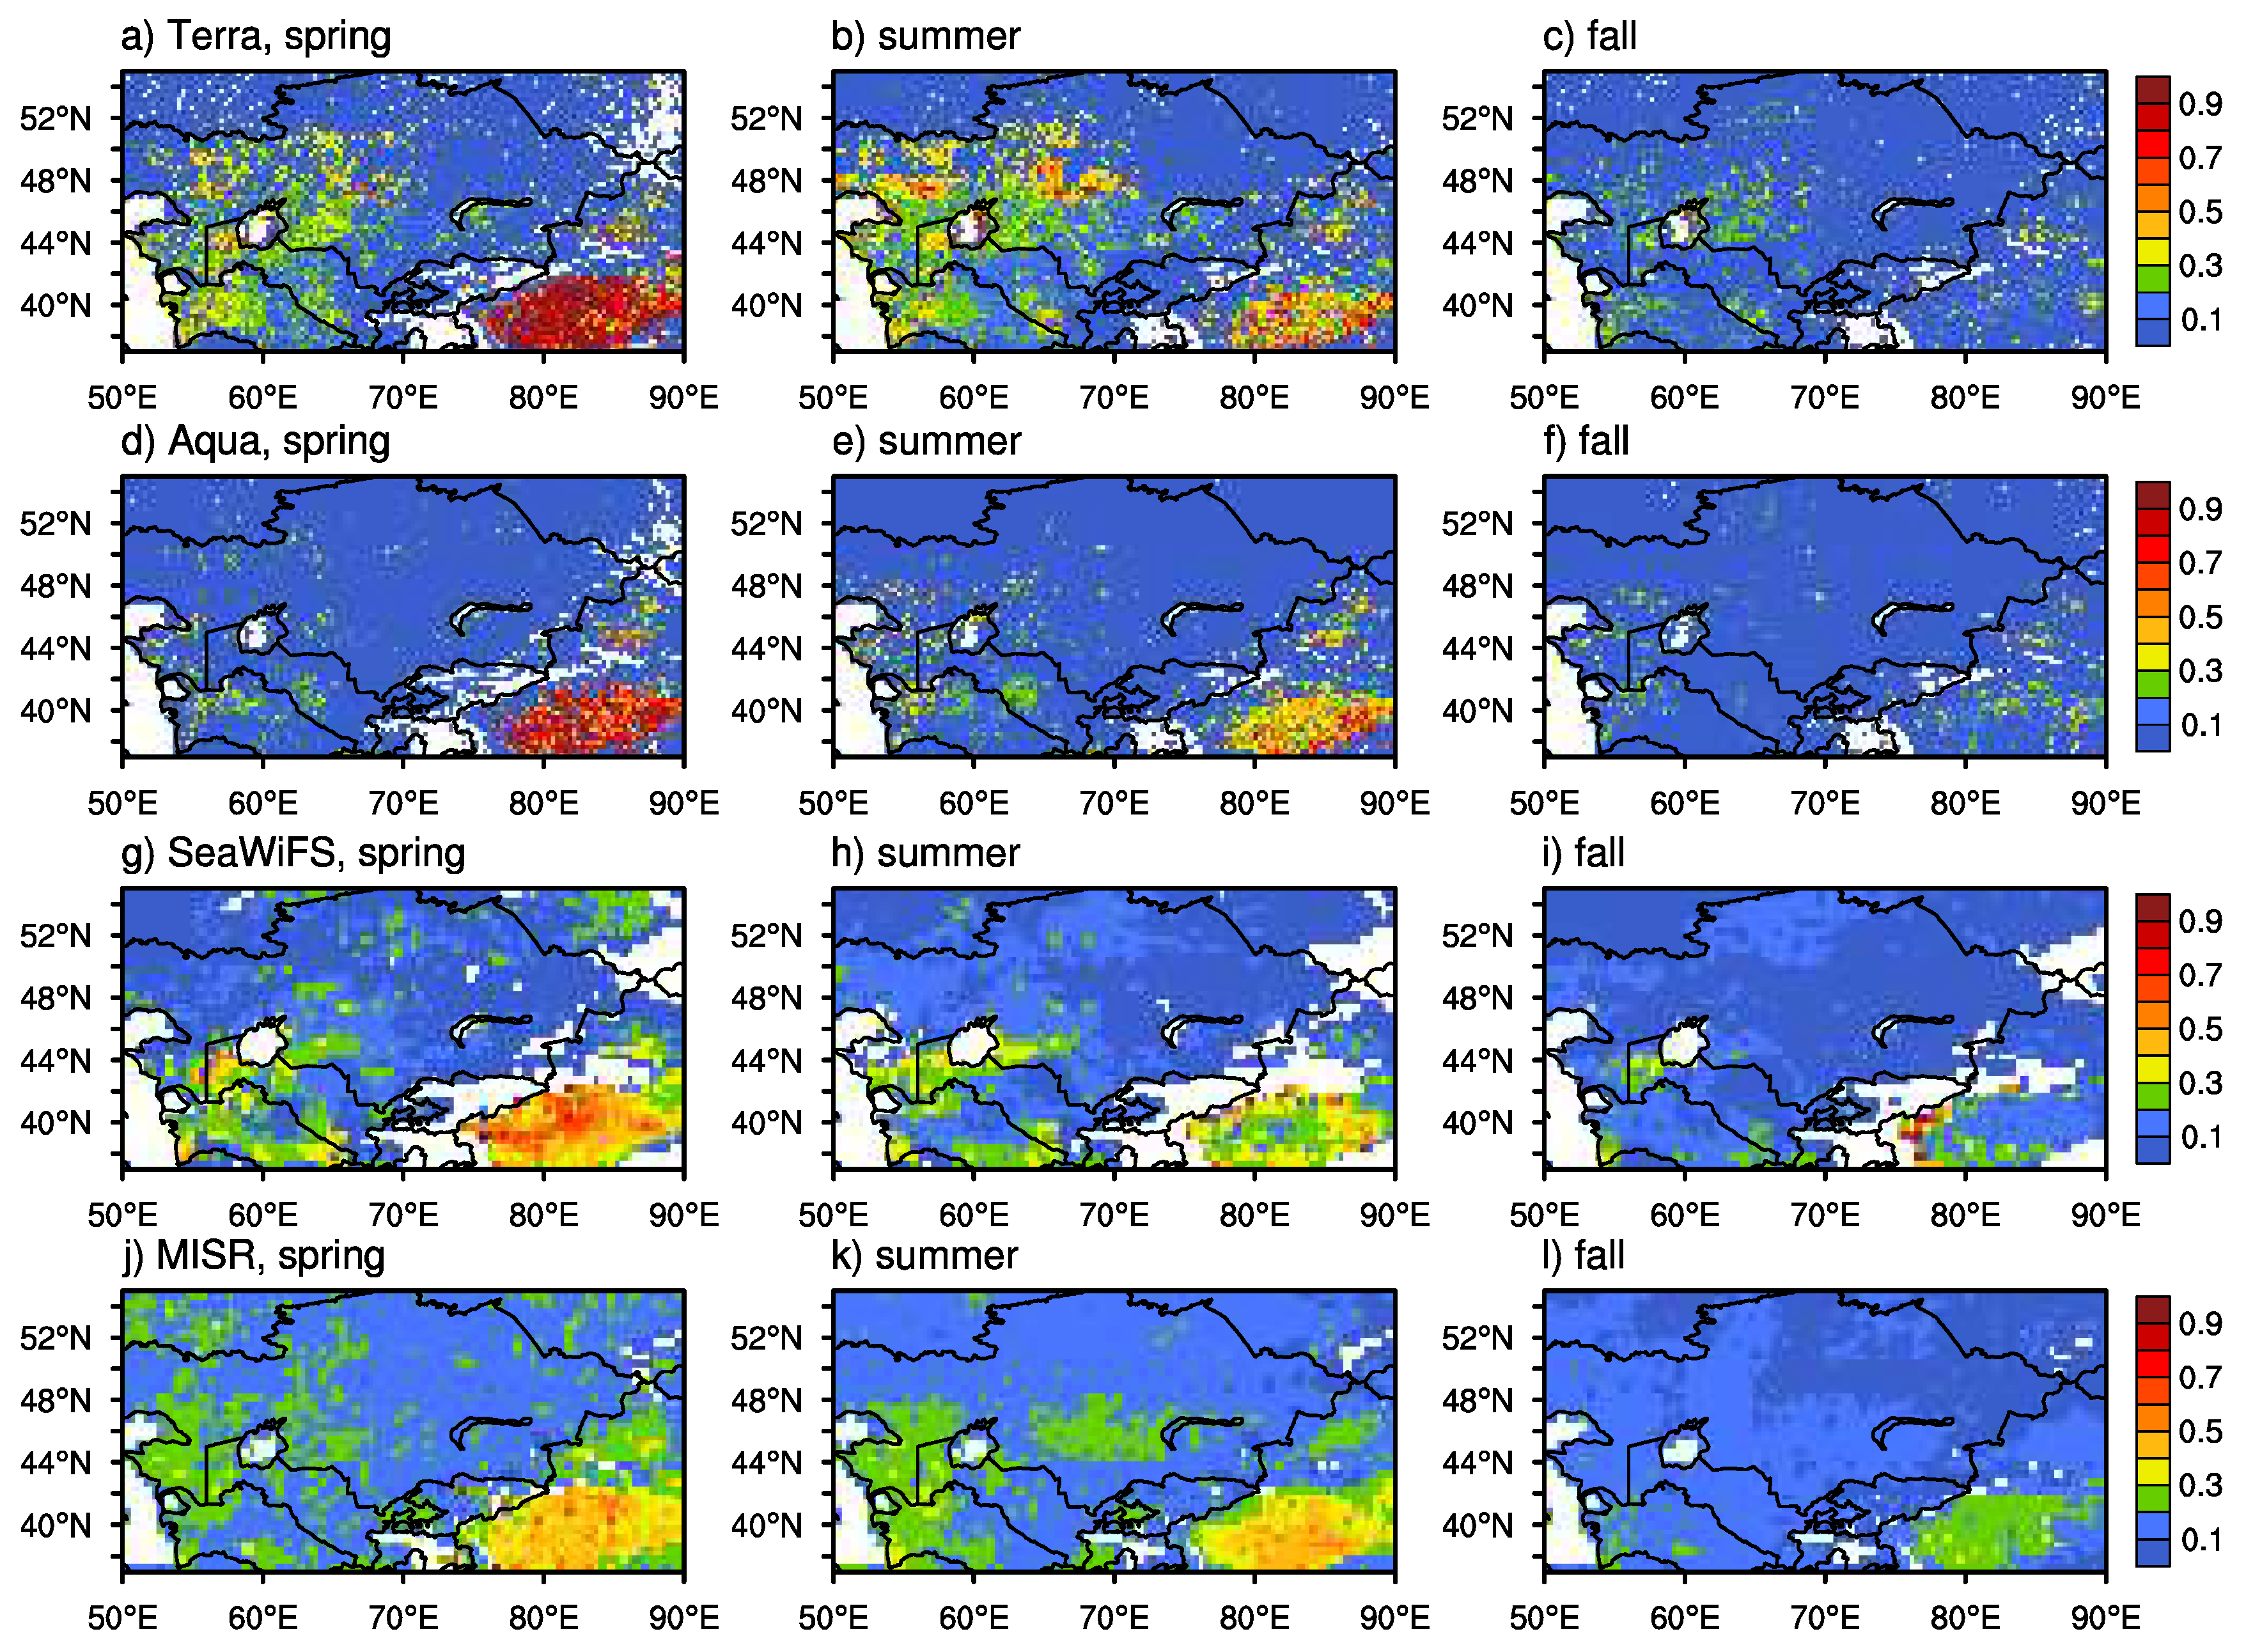
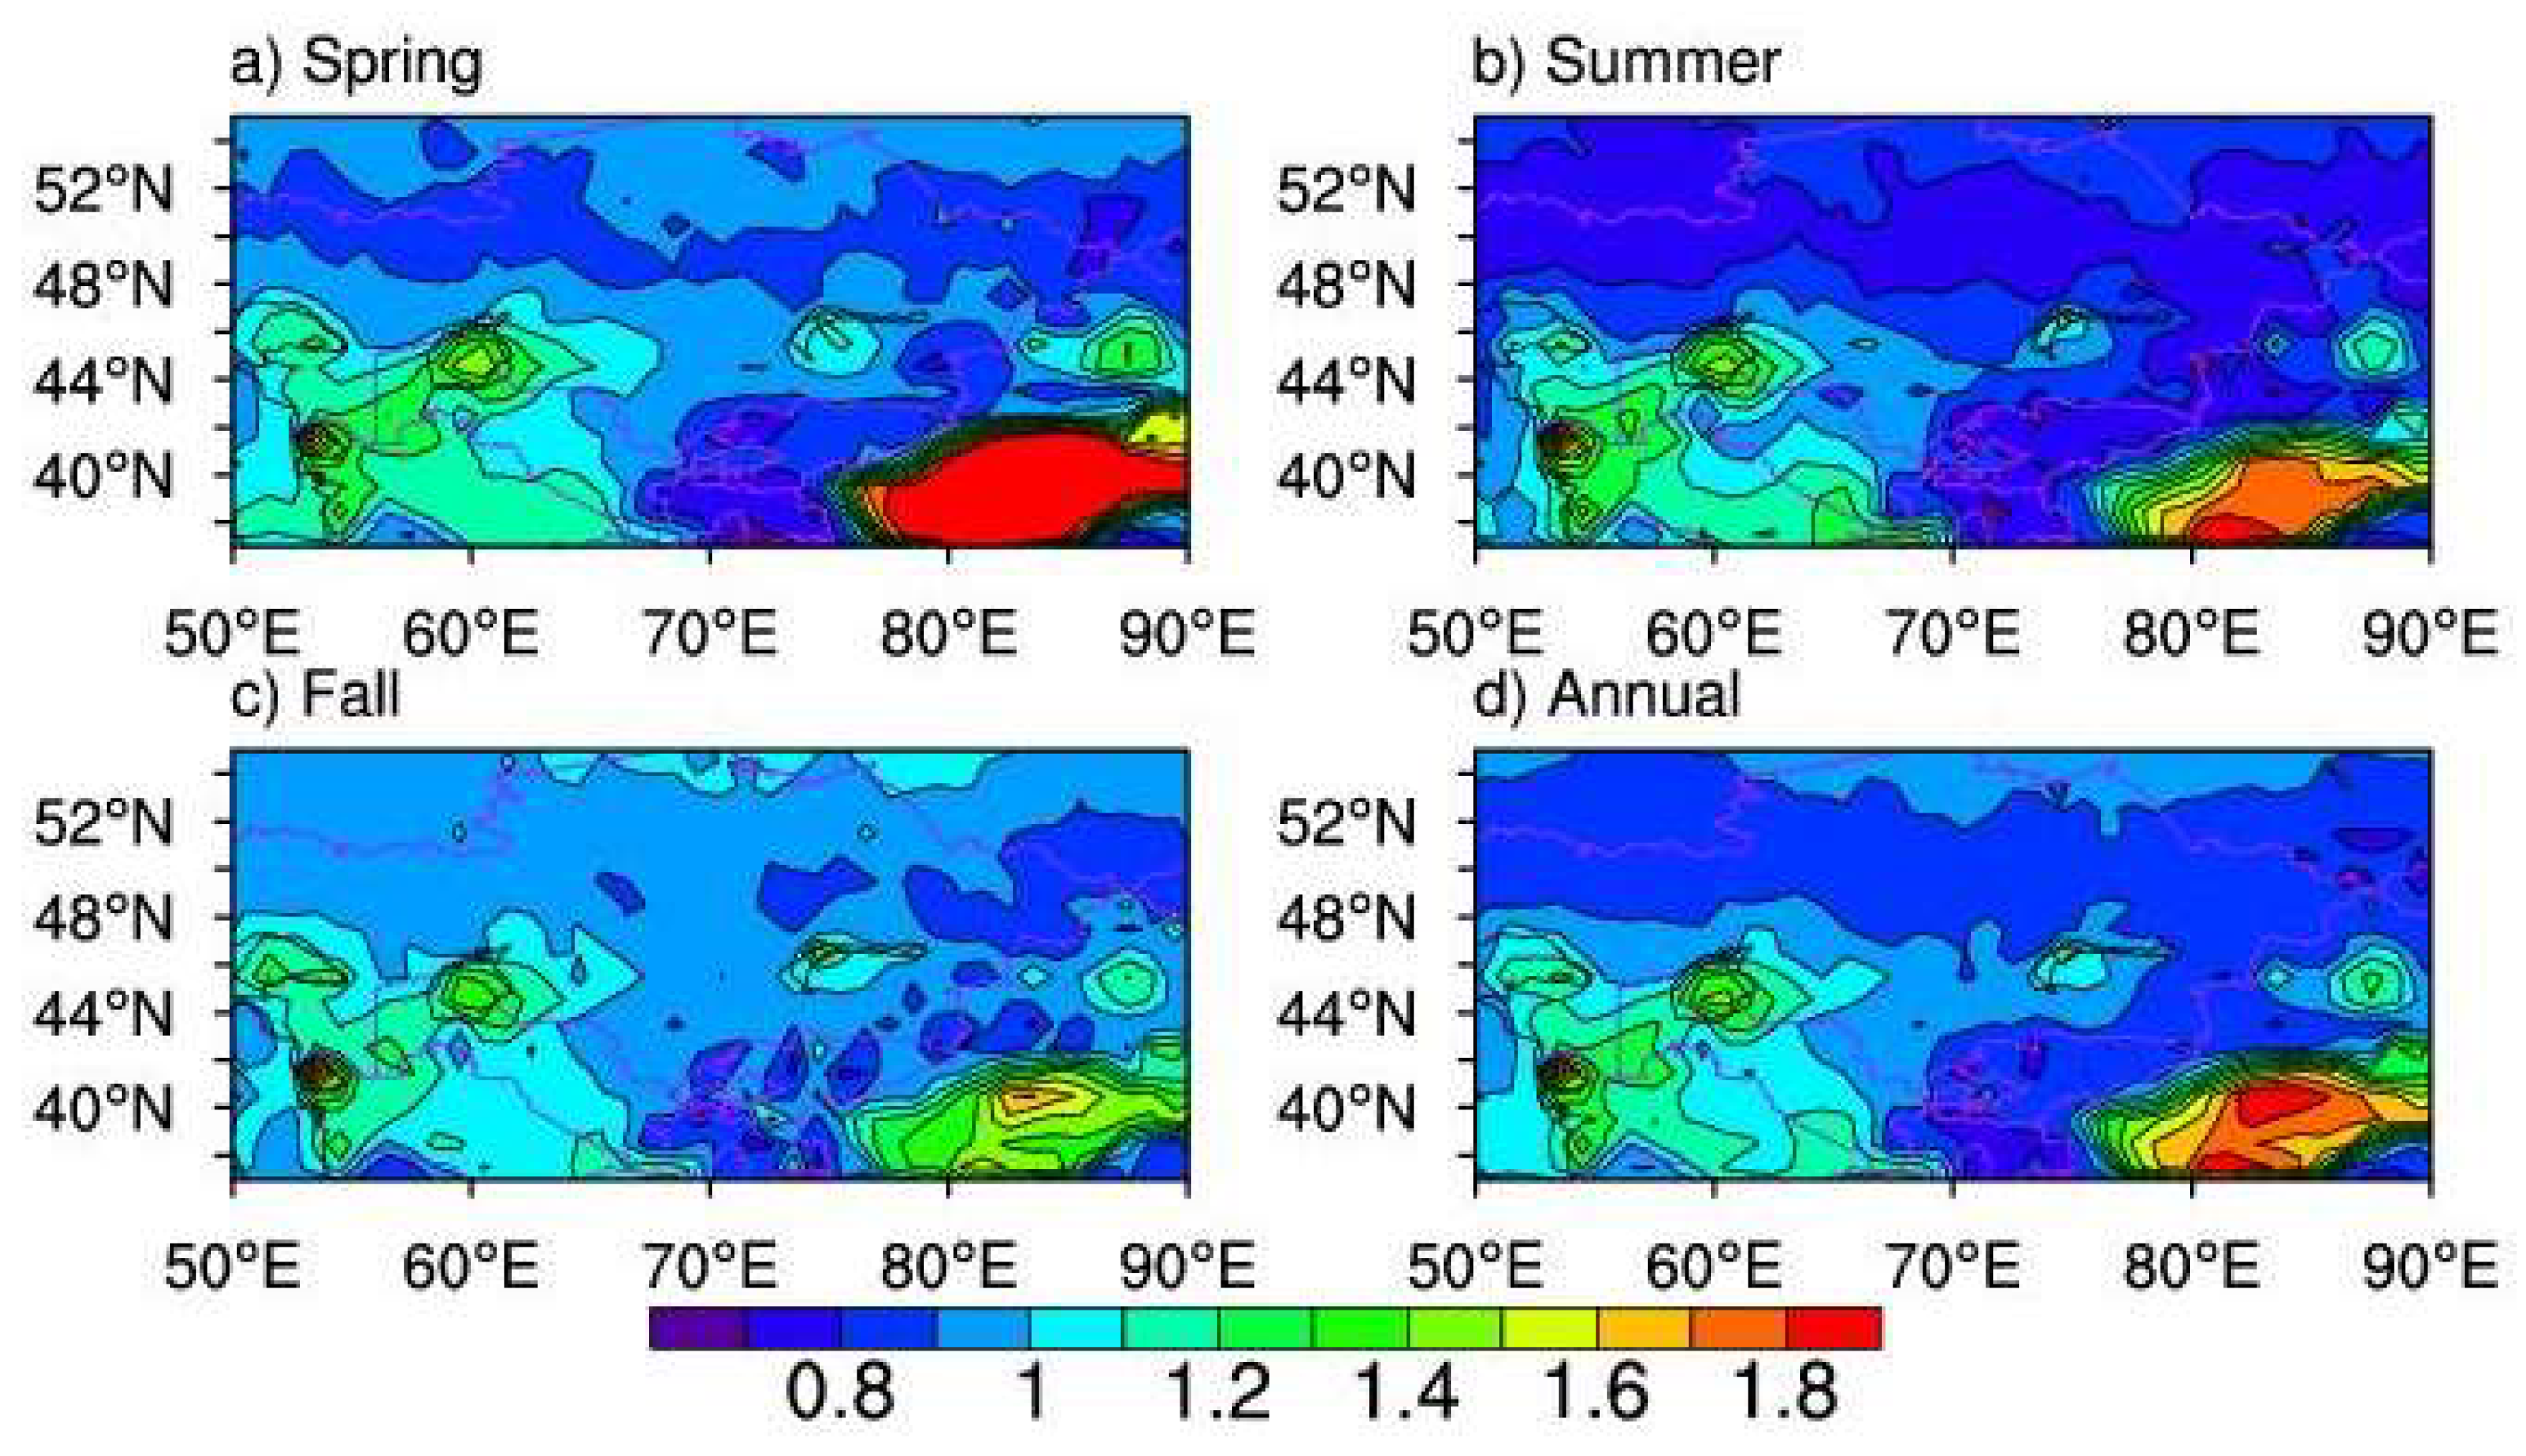
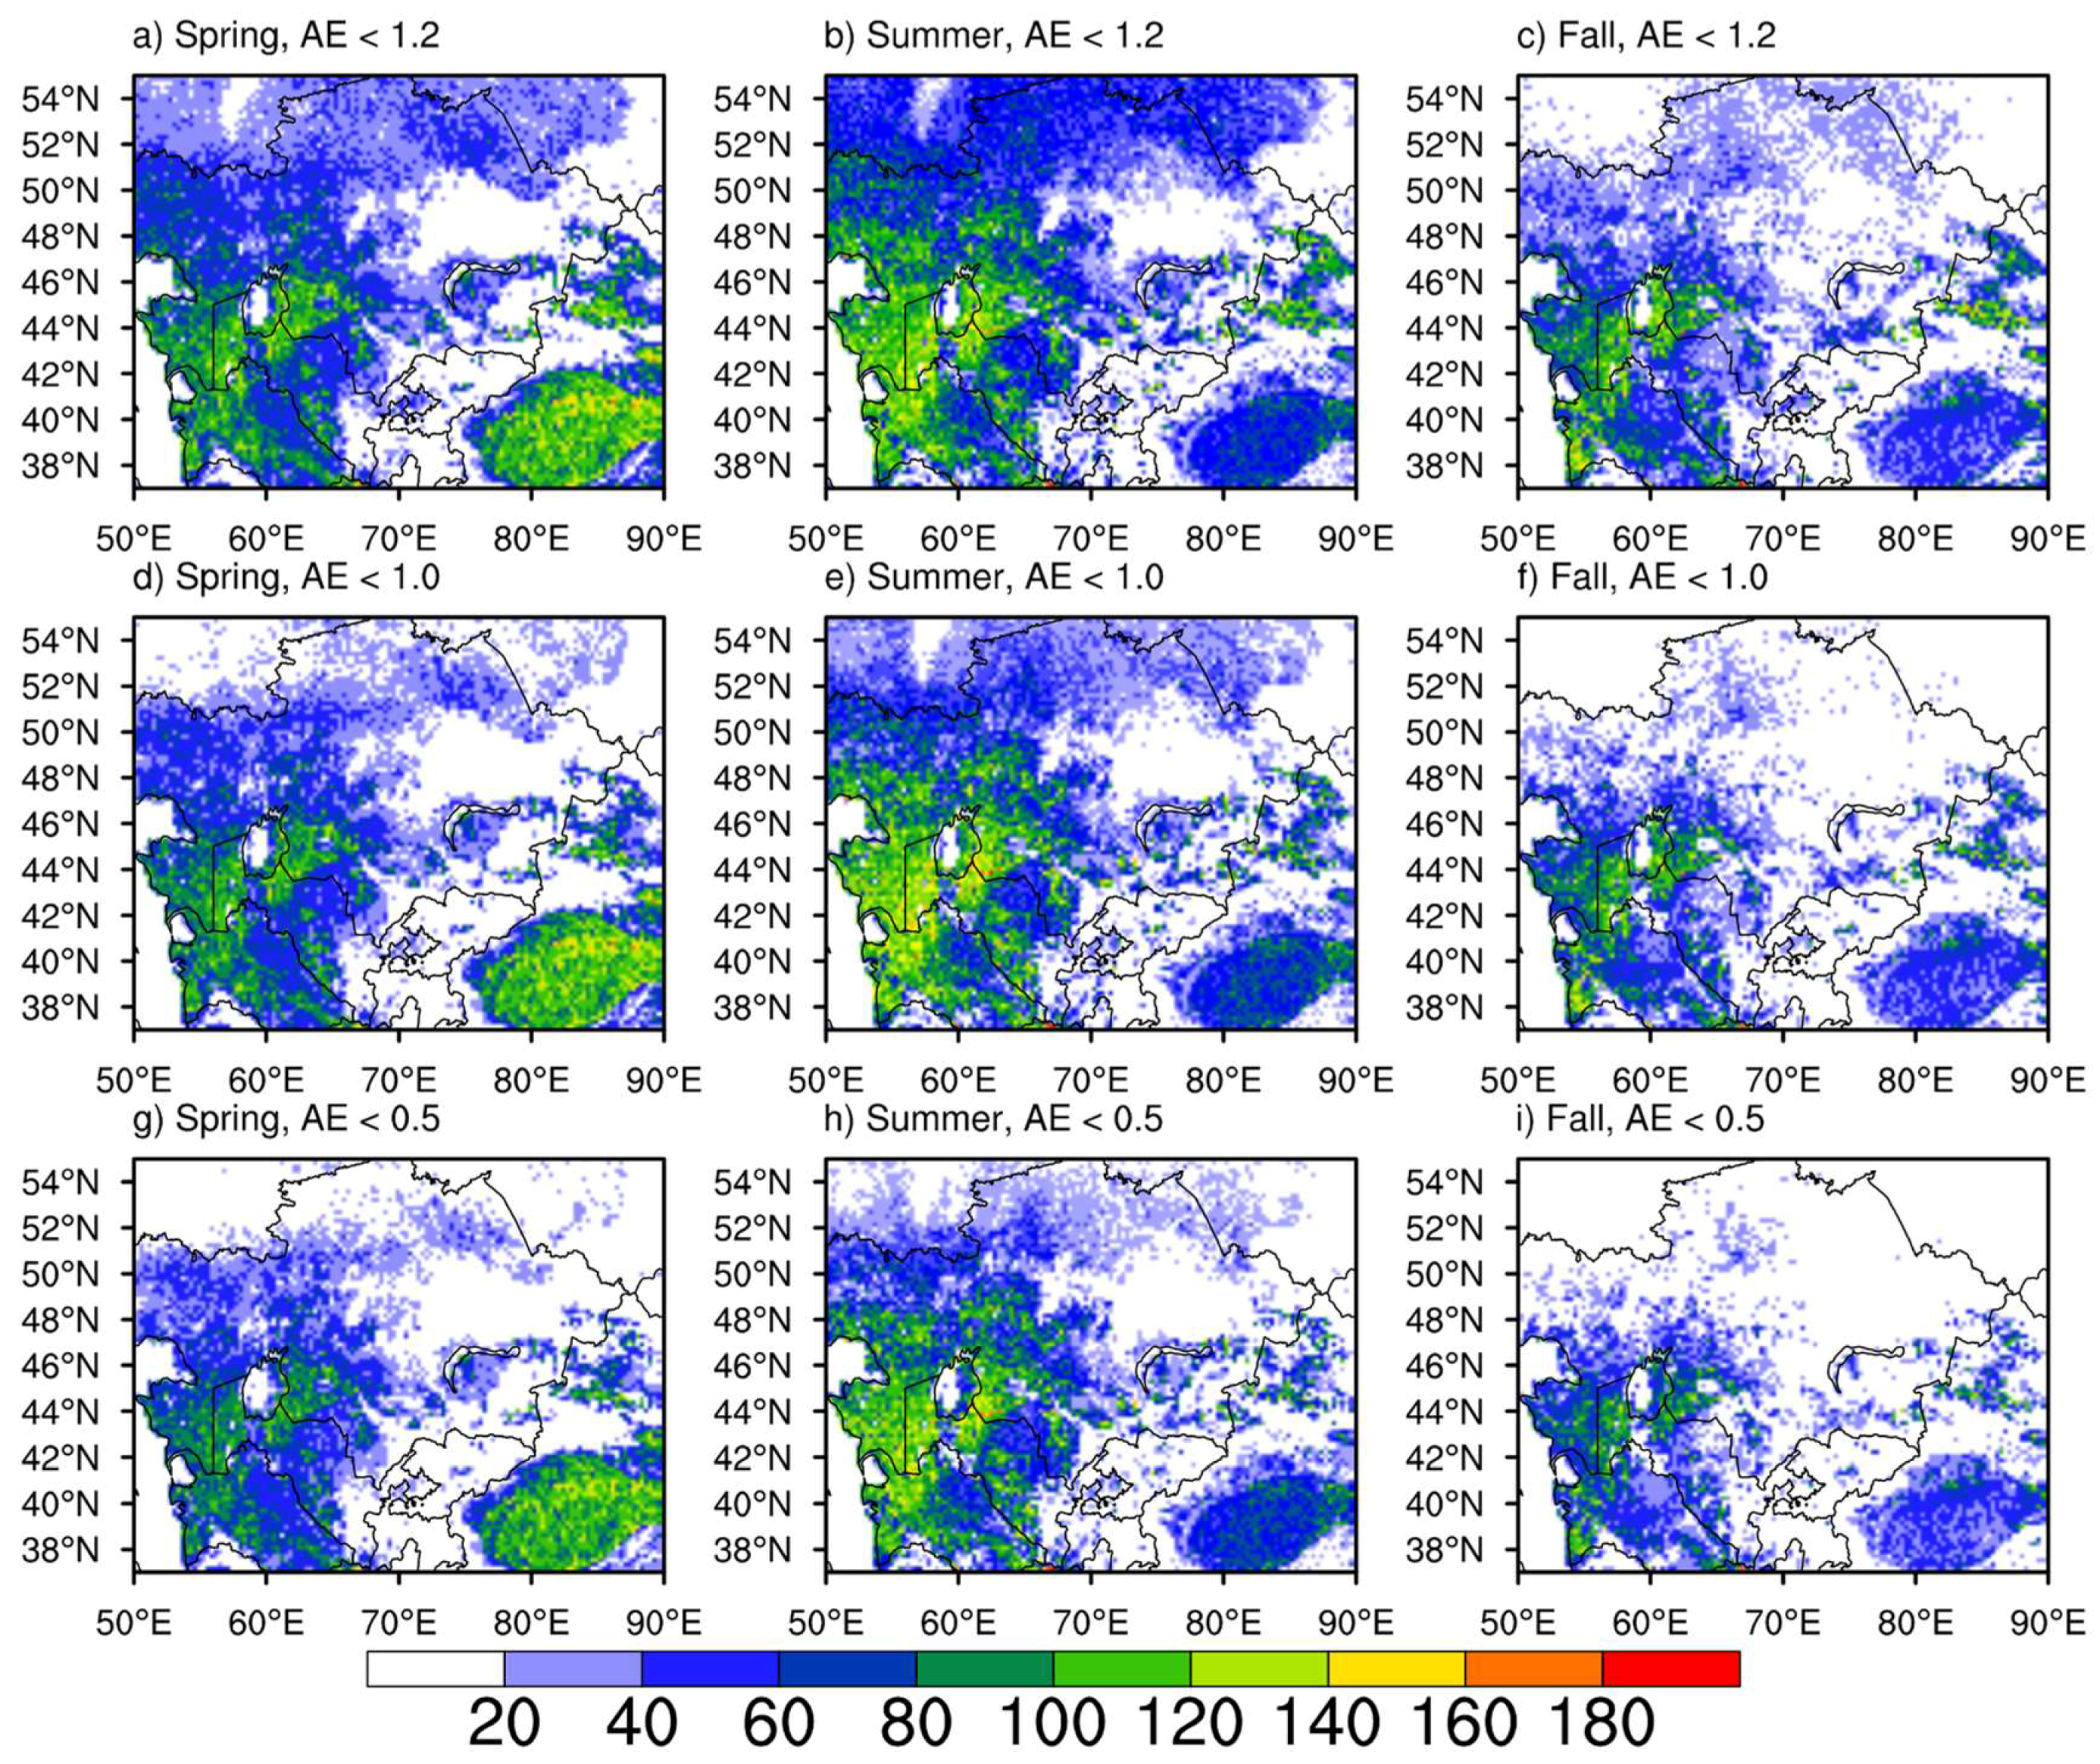
5.1.1. Spatial Distributions
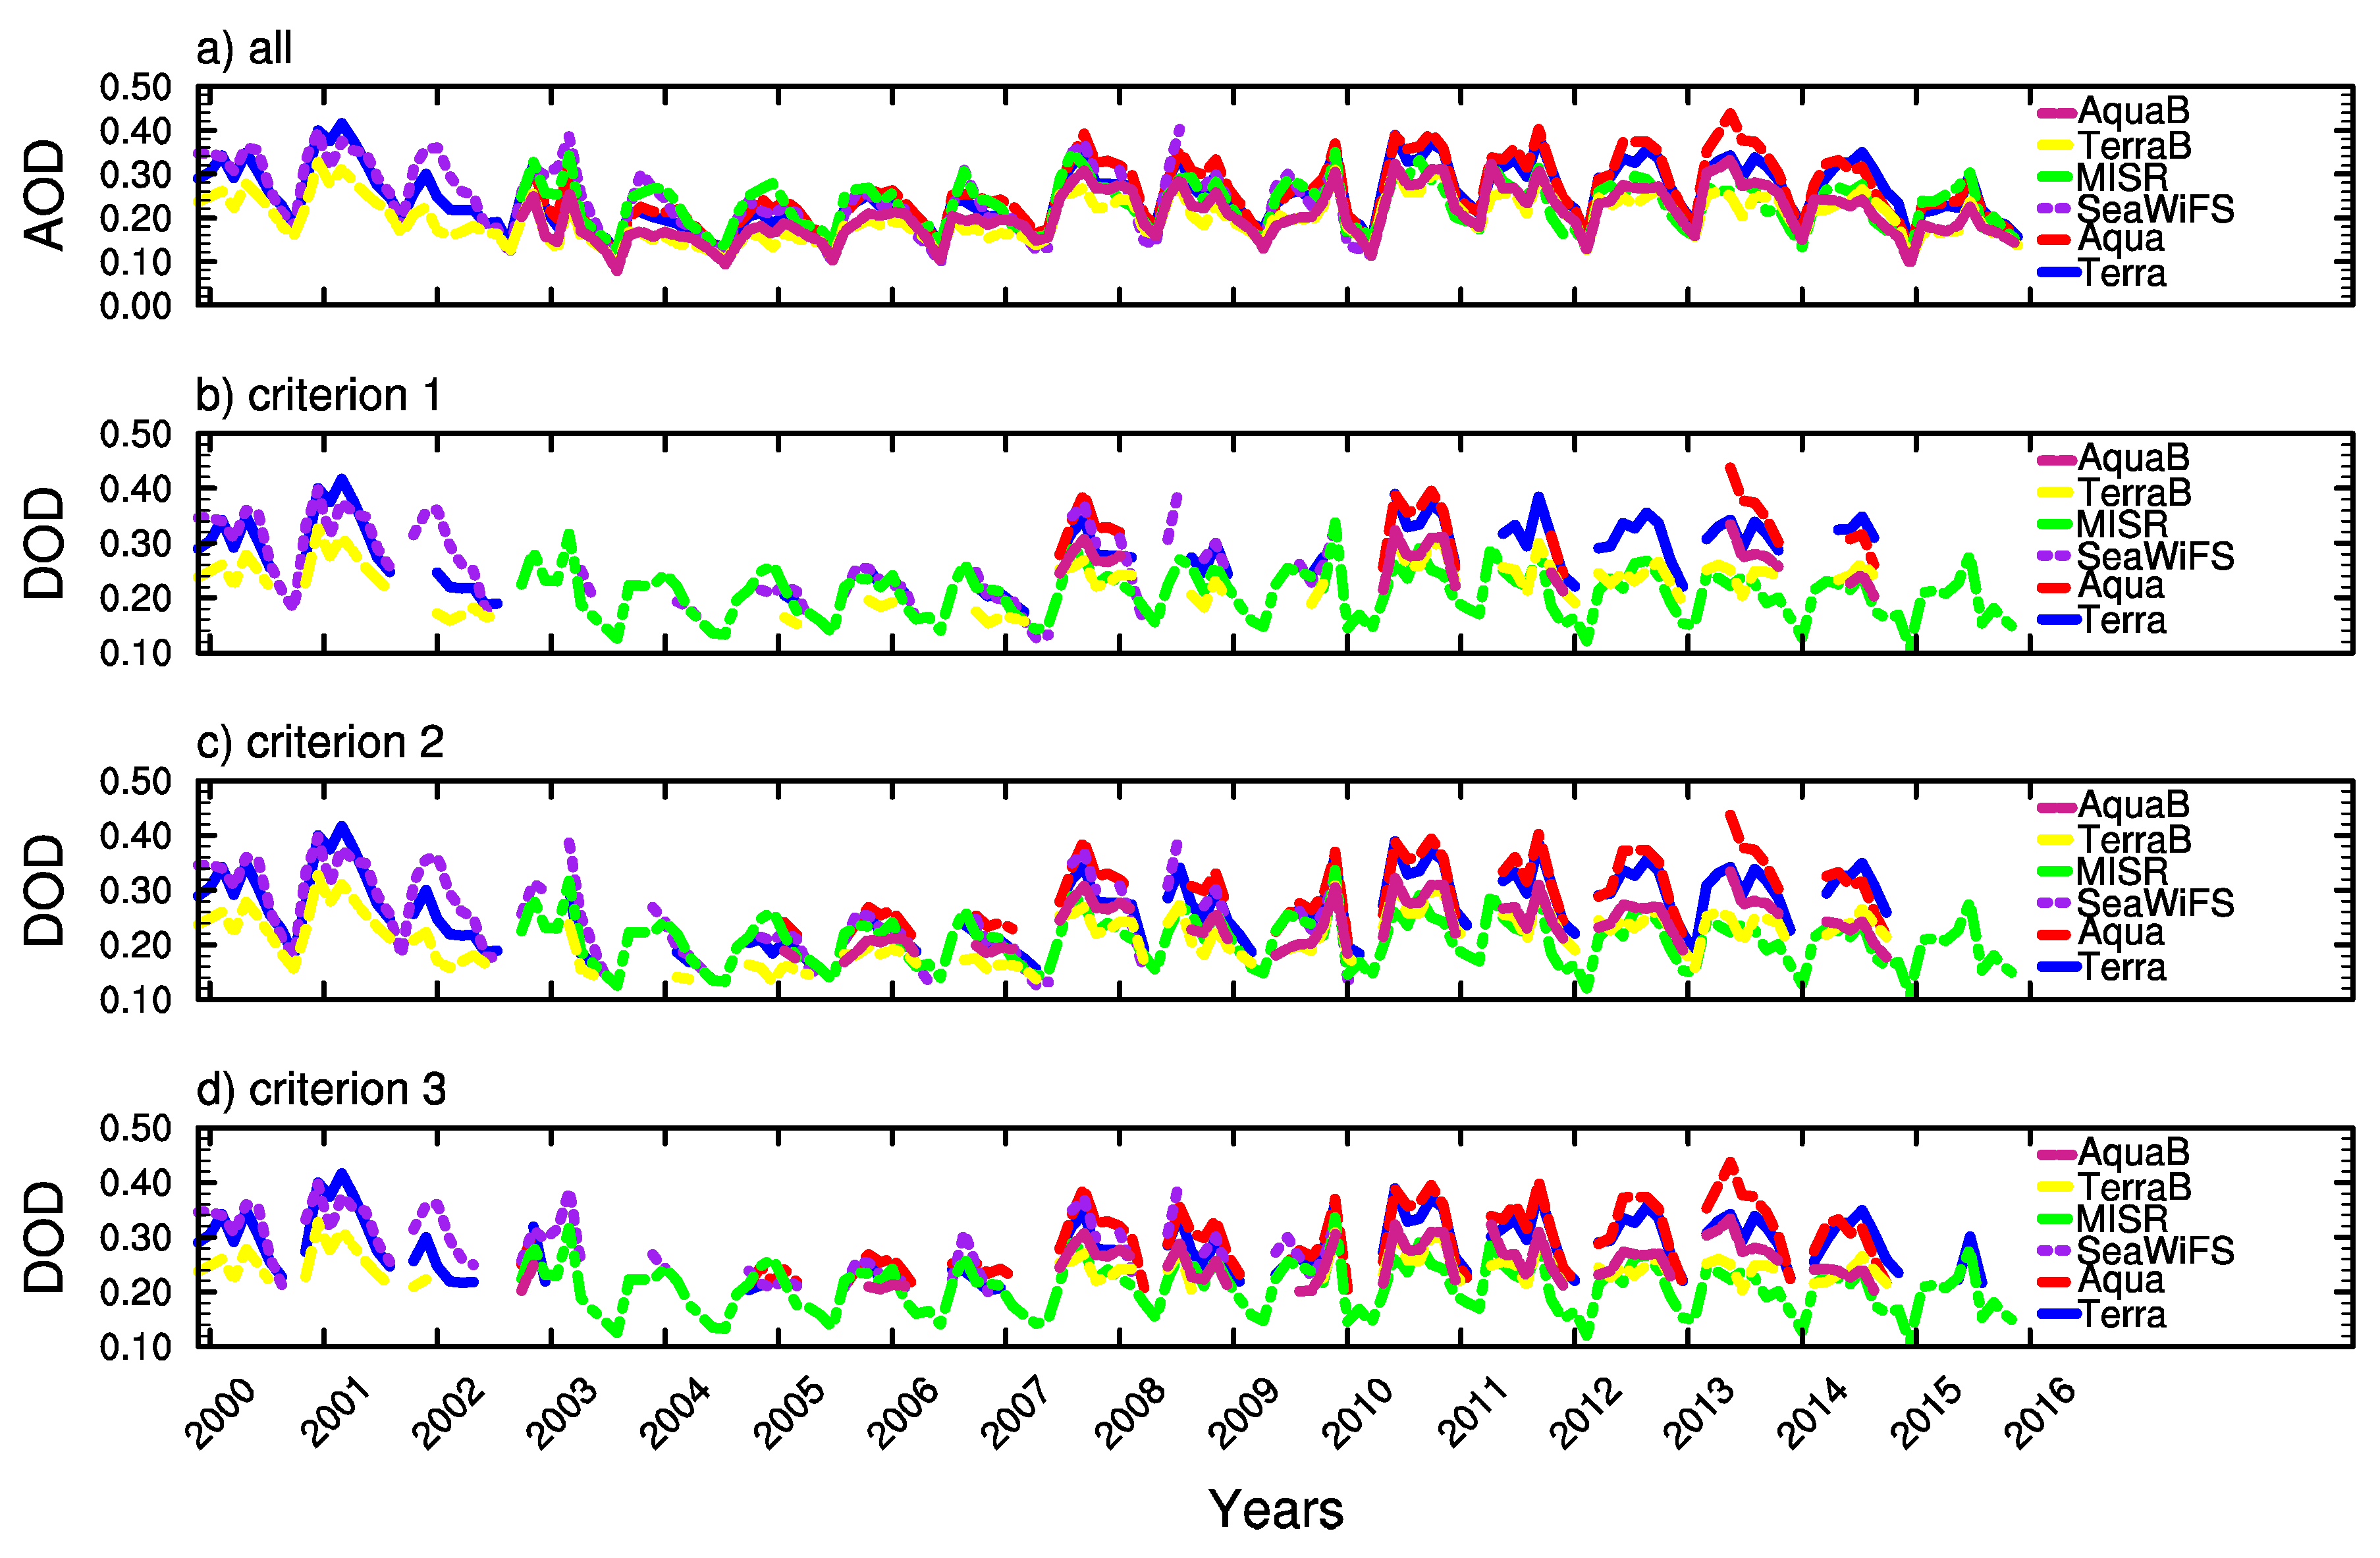
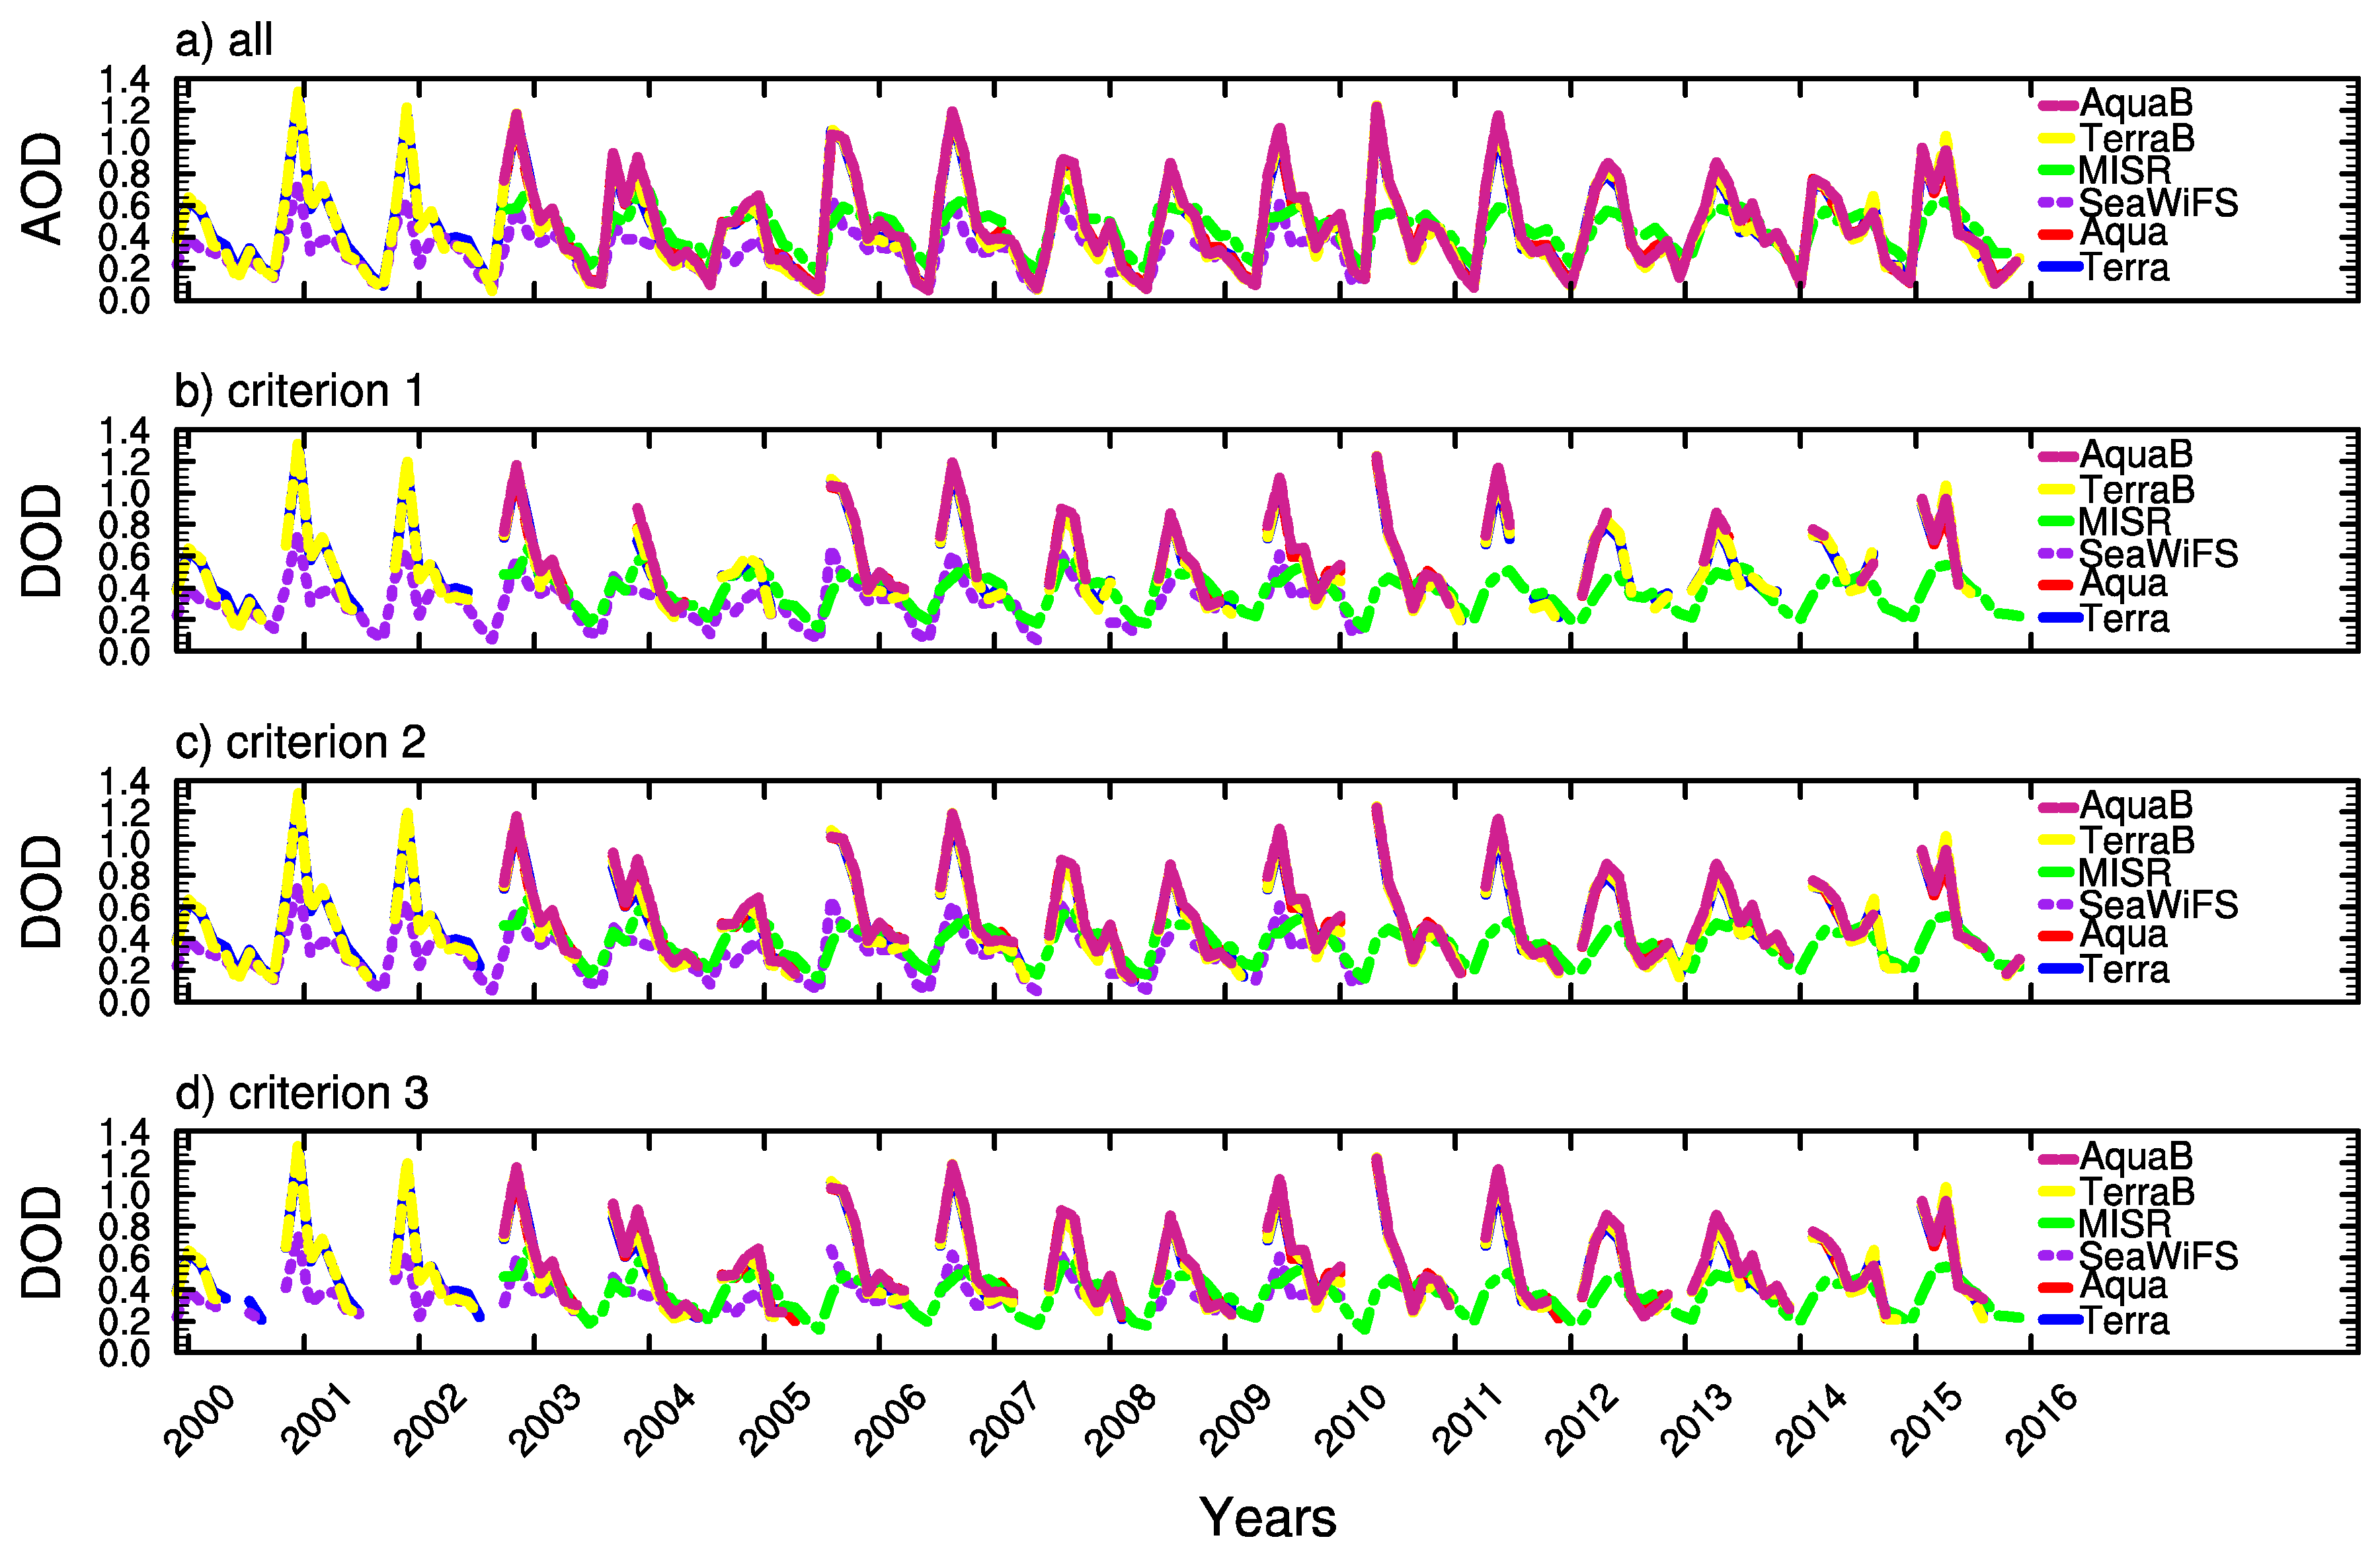
5.1.2. The Inter-Annual Variability
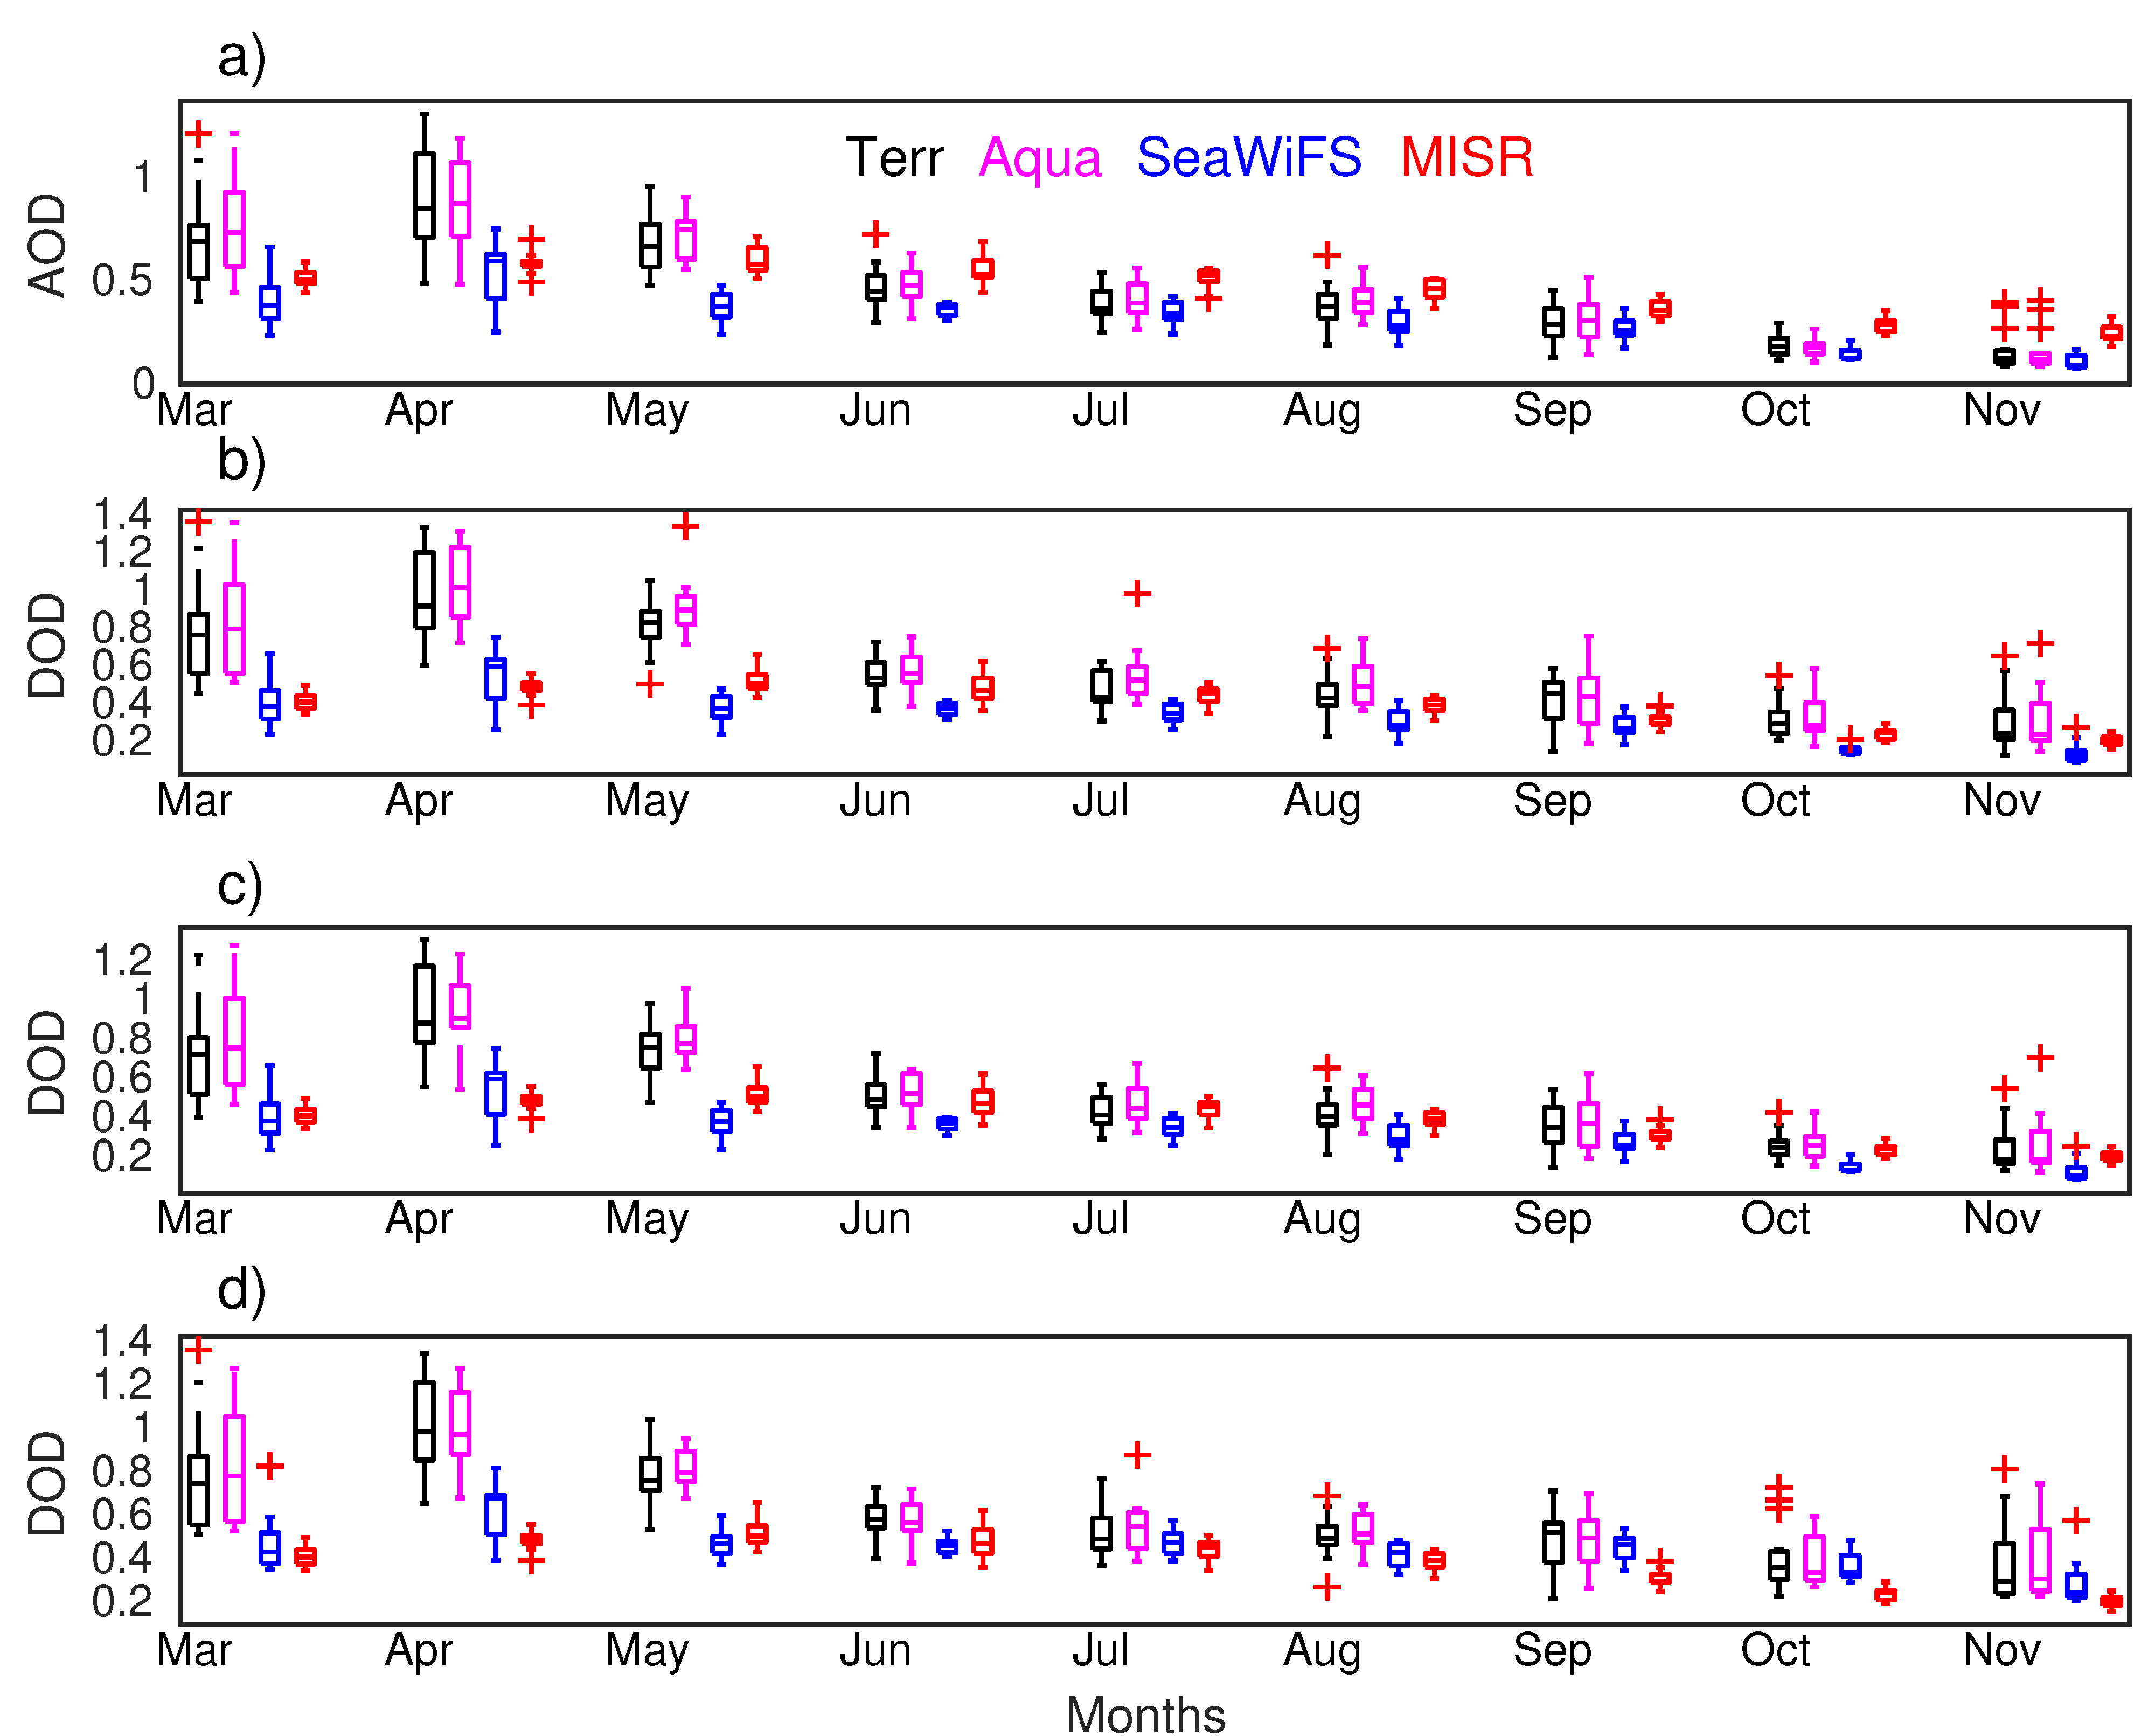
5.1.3. The Seasonal Variability
5.2. Dust Occurrences
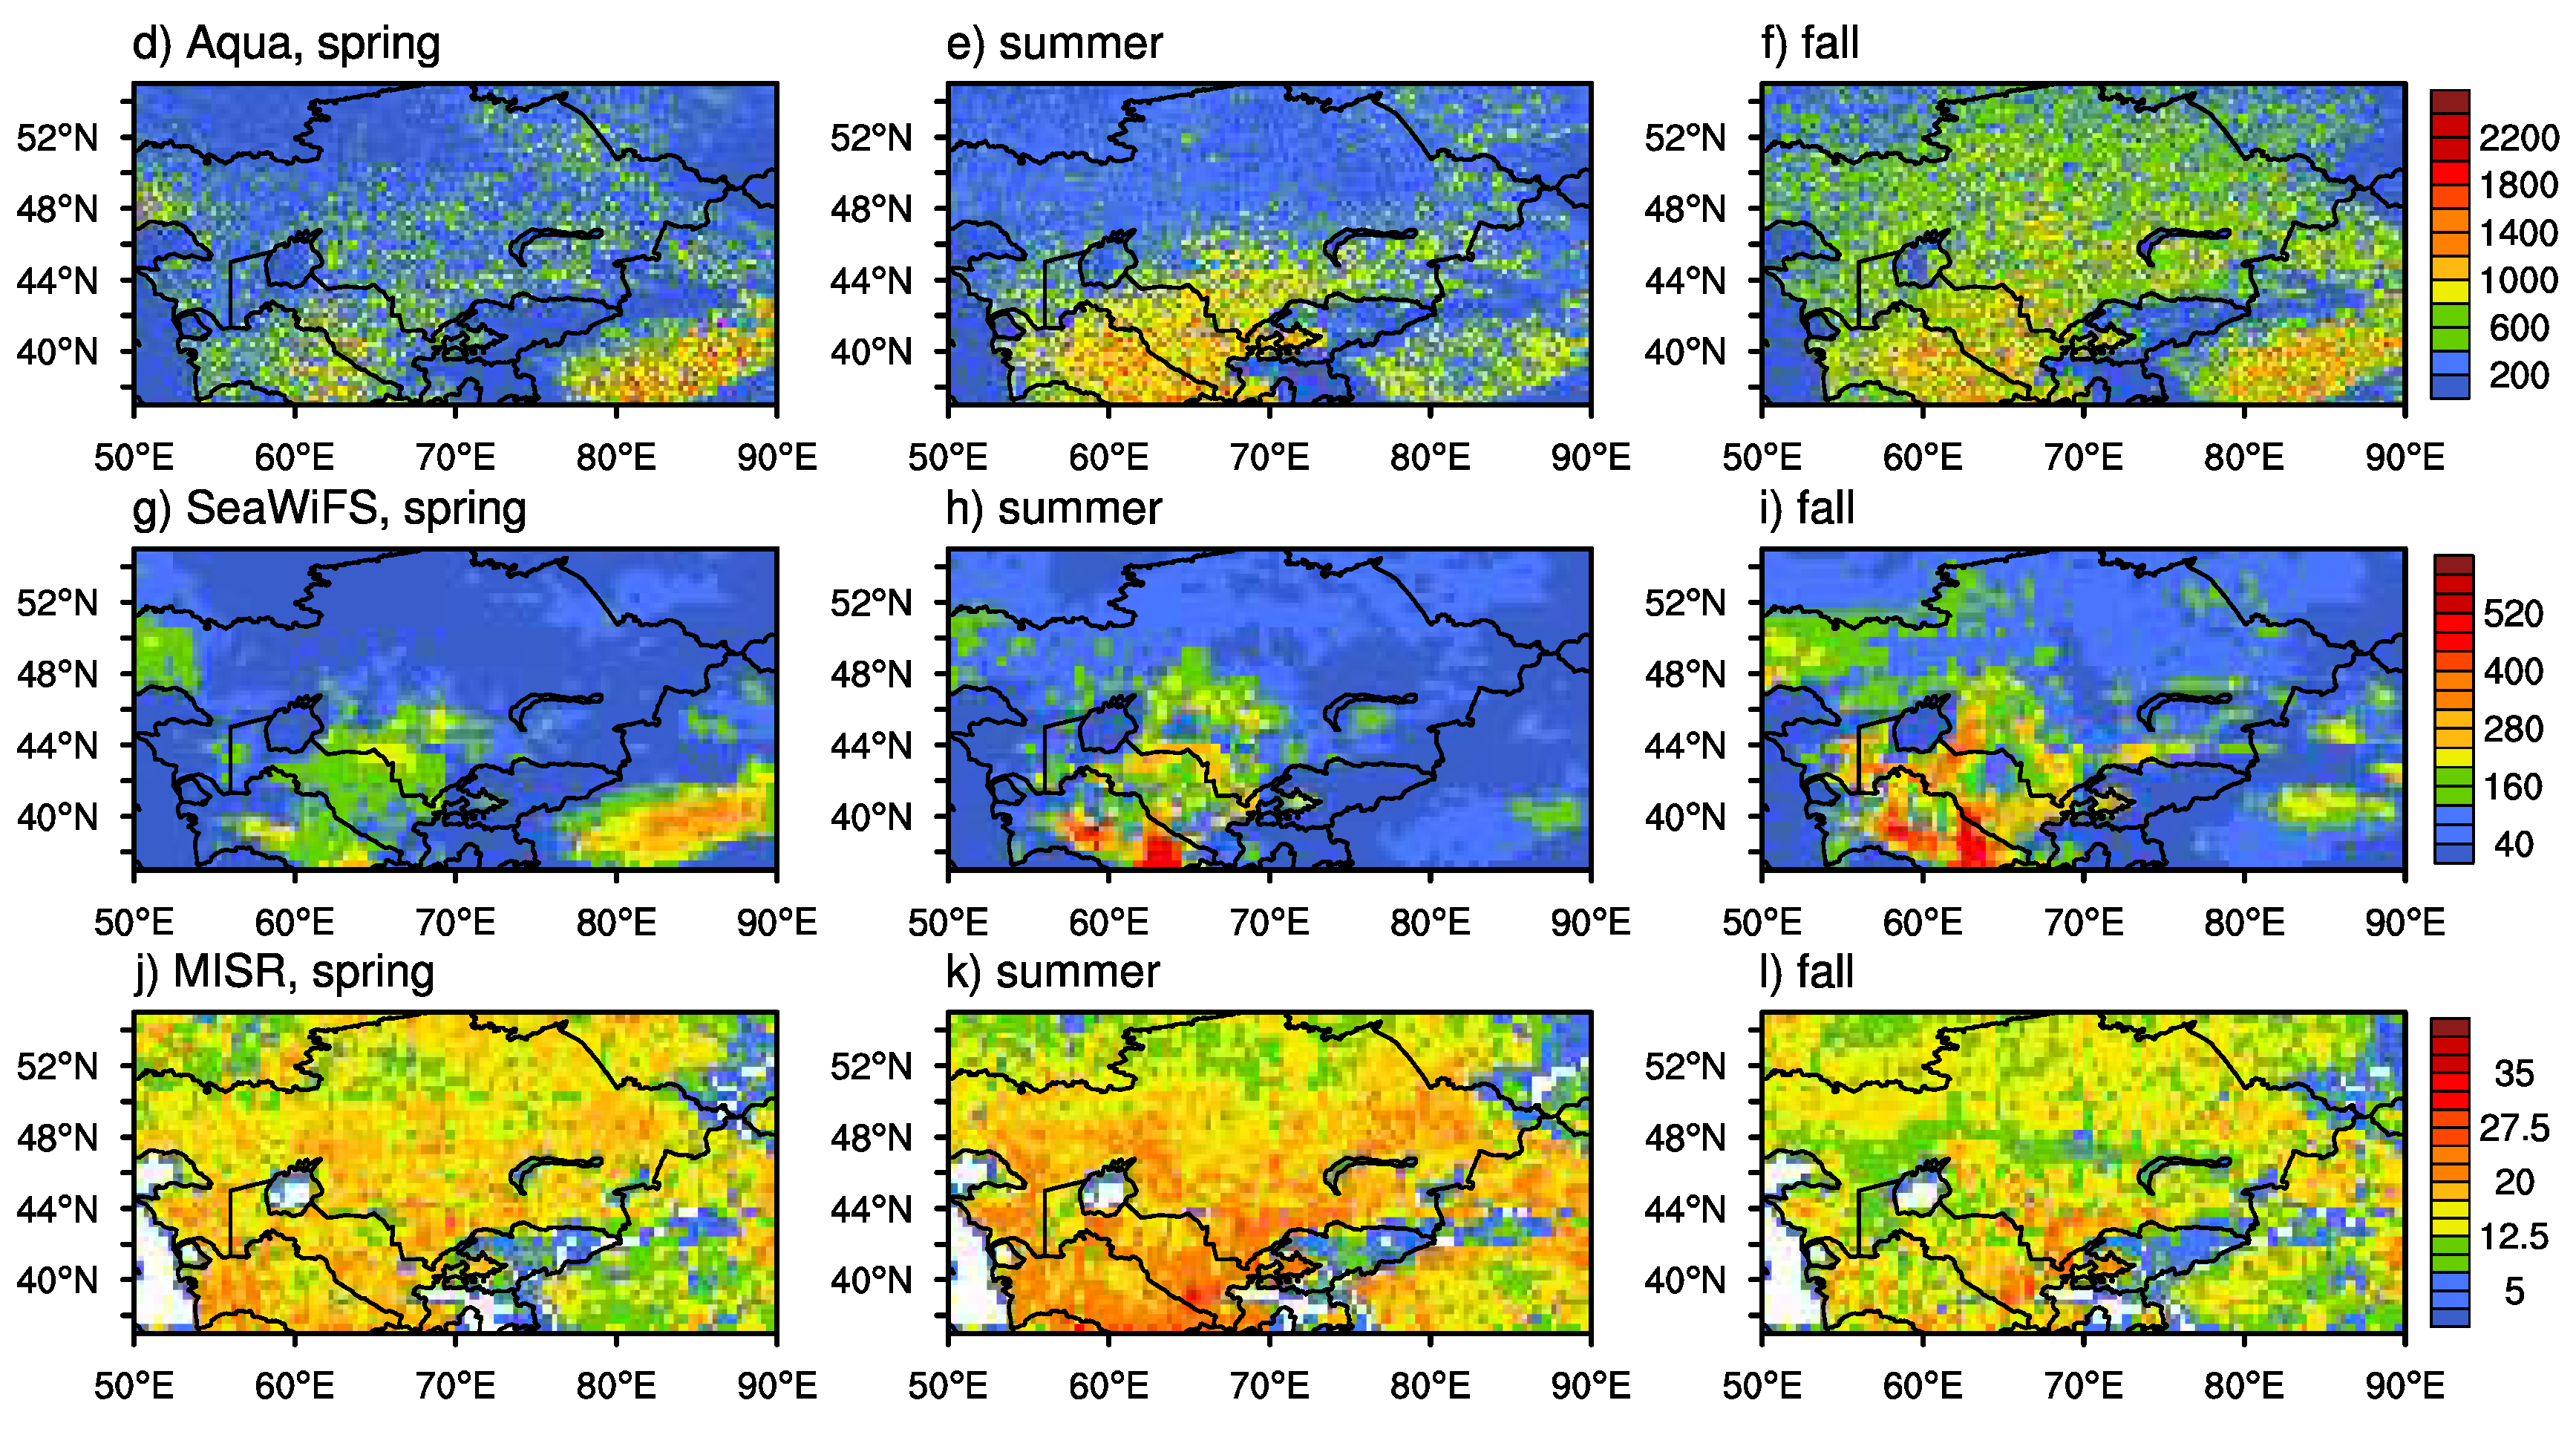
5.2.1. Spatial Distributions
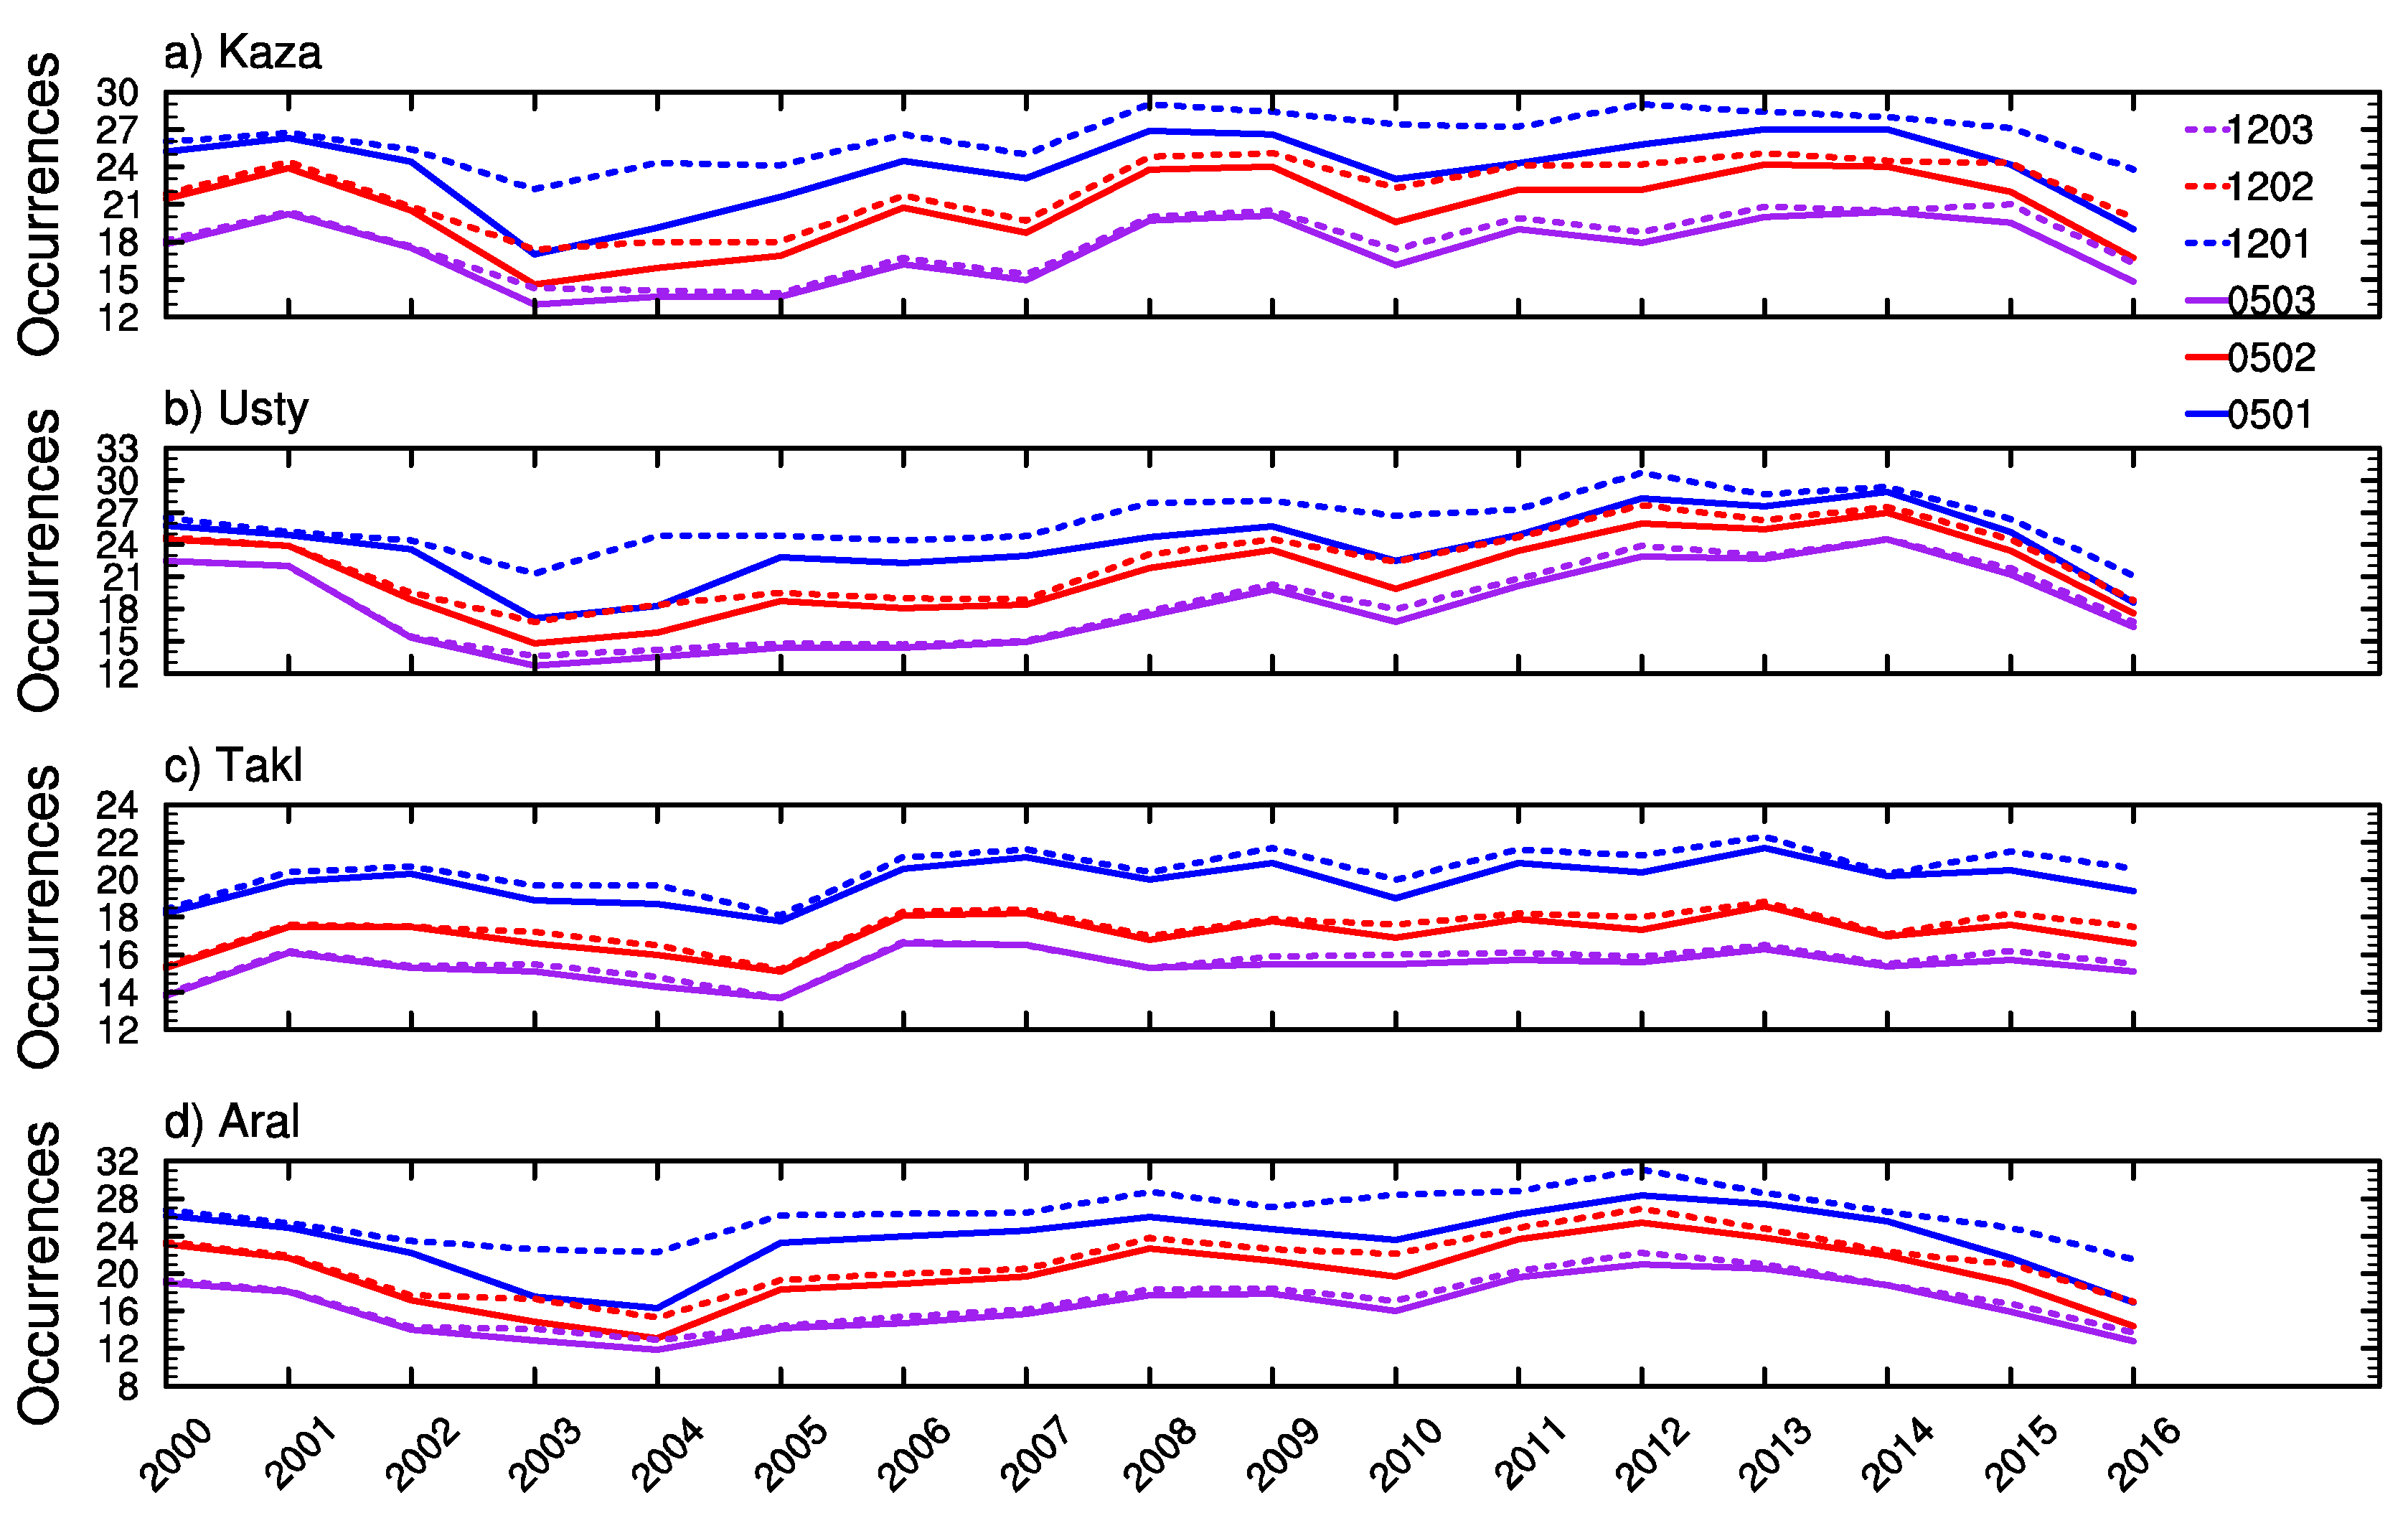
5.2.2. The Inter-Annual Variability
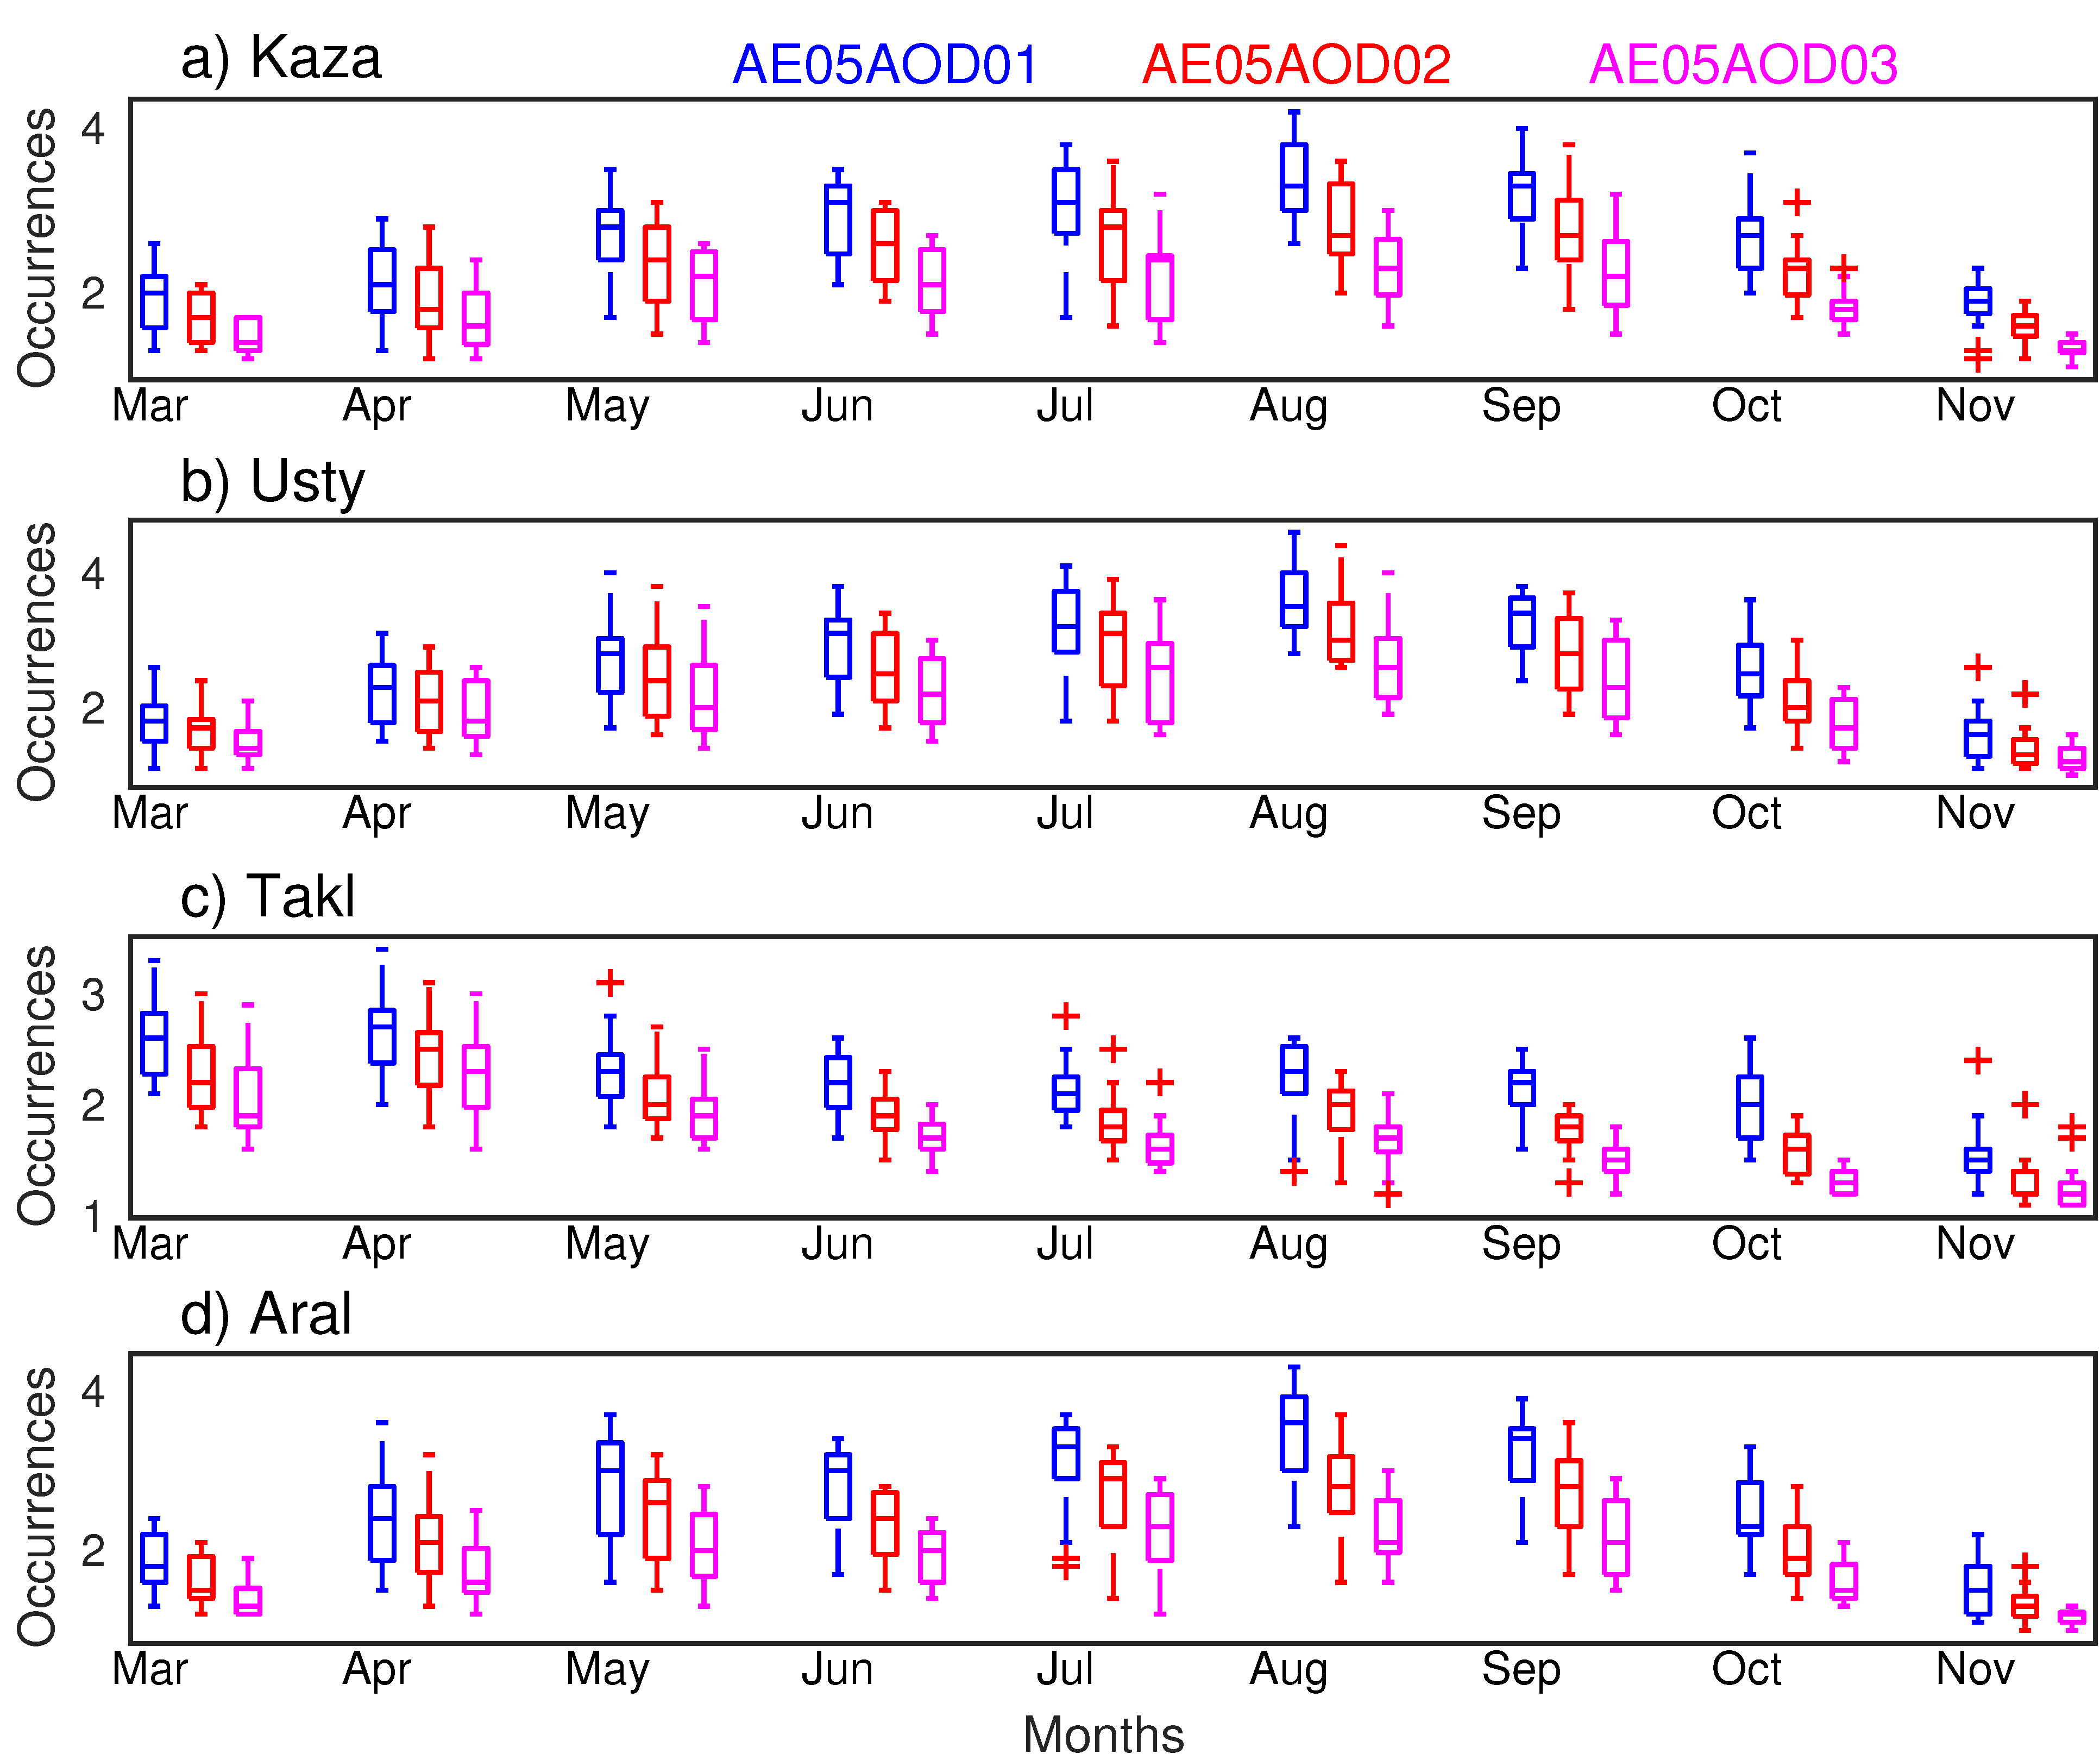
5.2.3. The Seasonal Variability
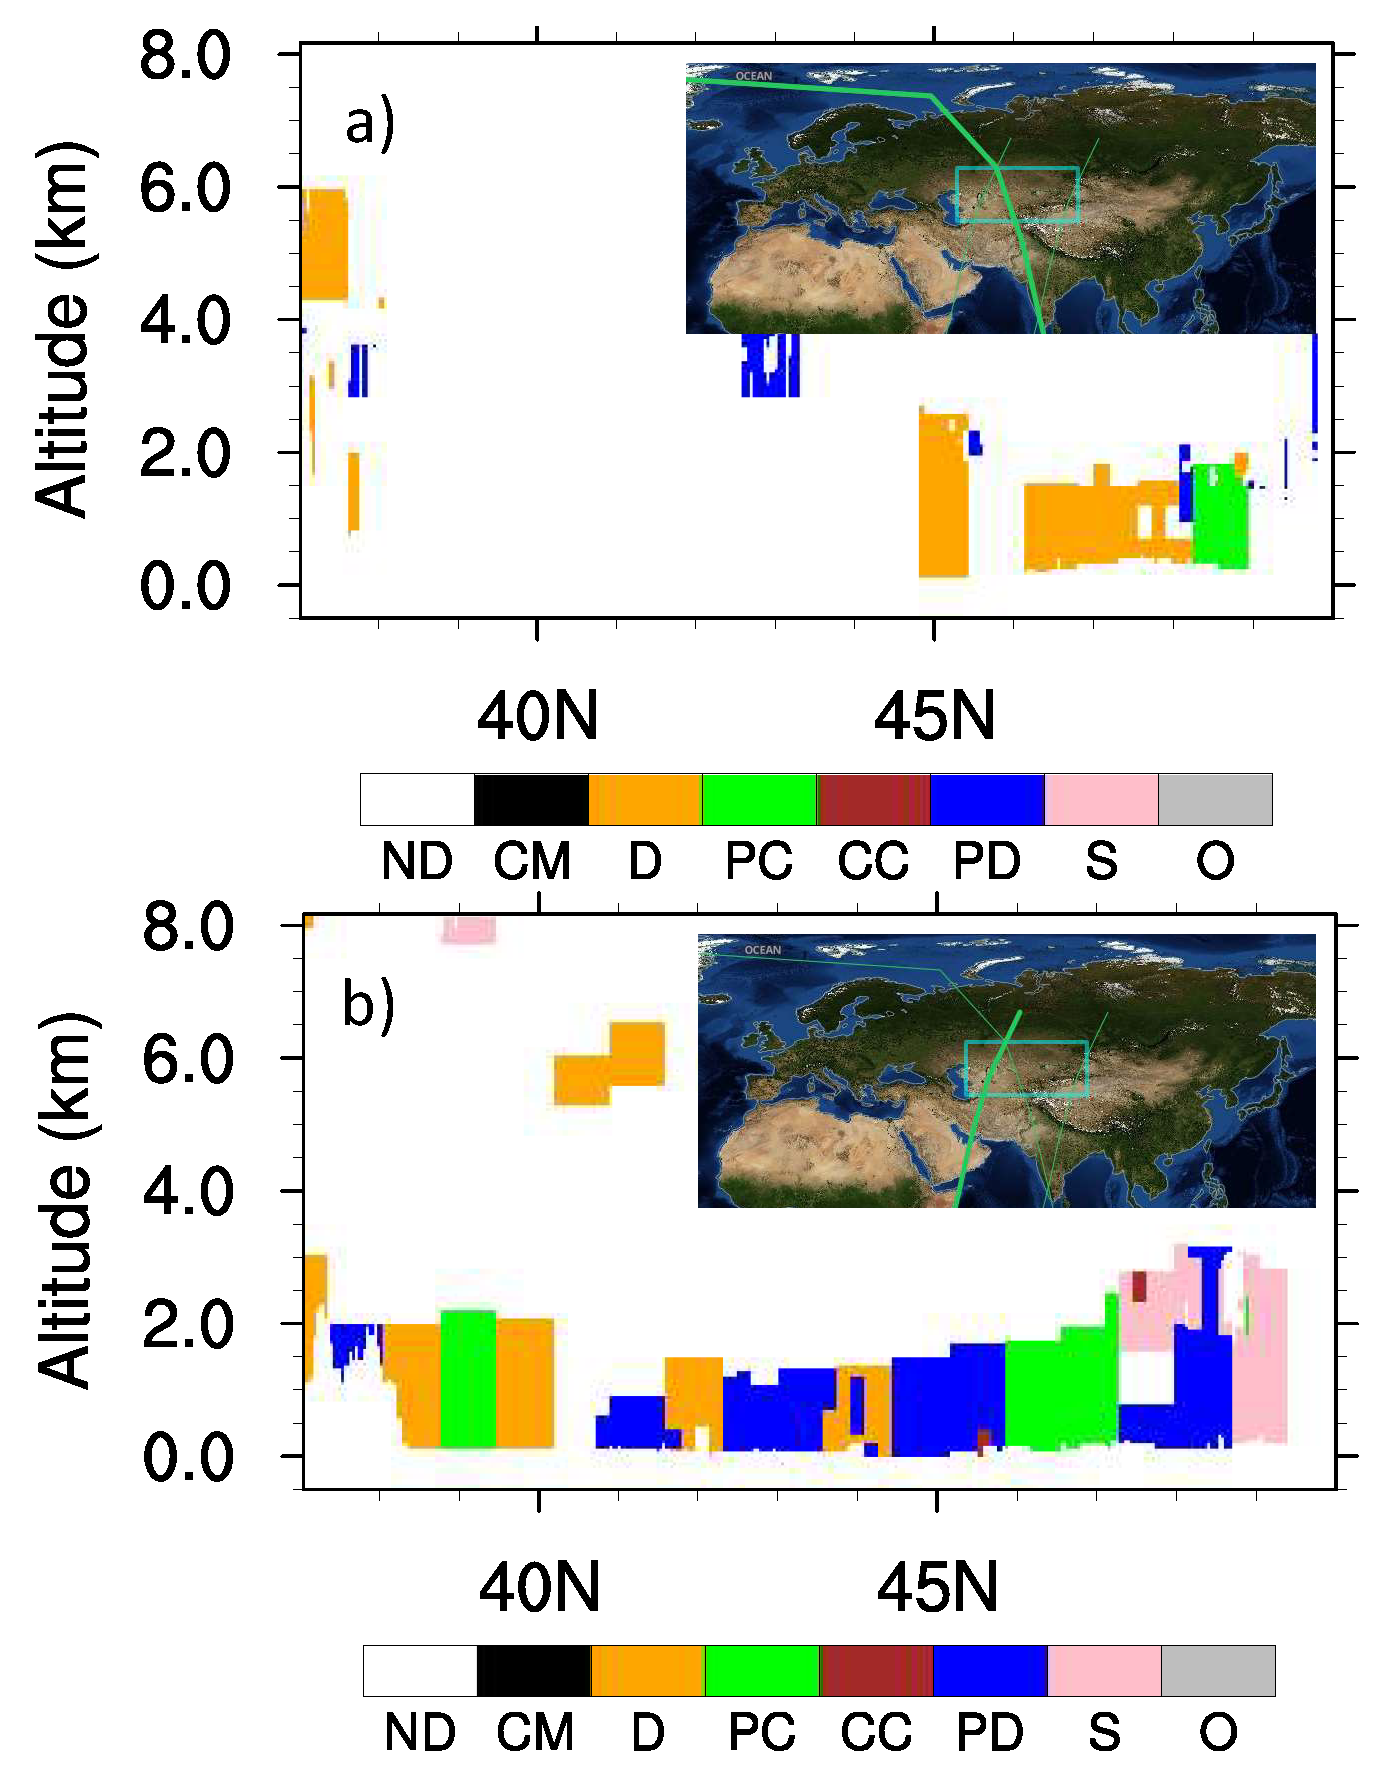
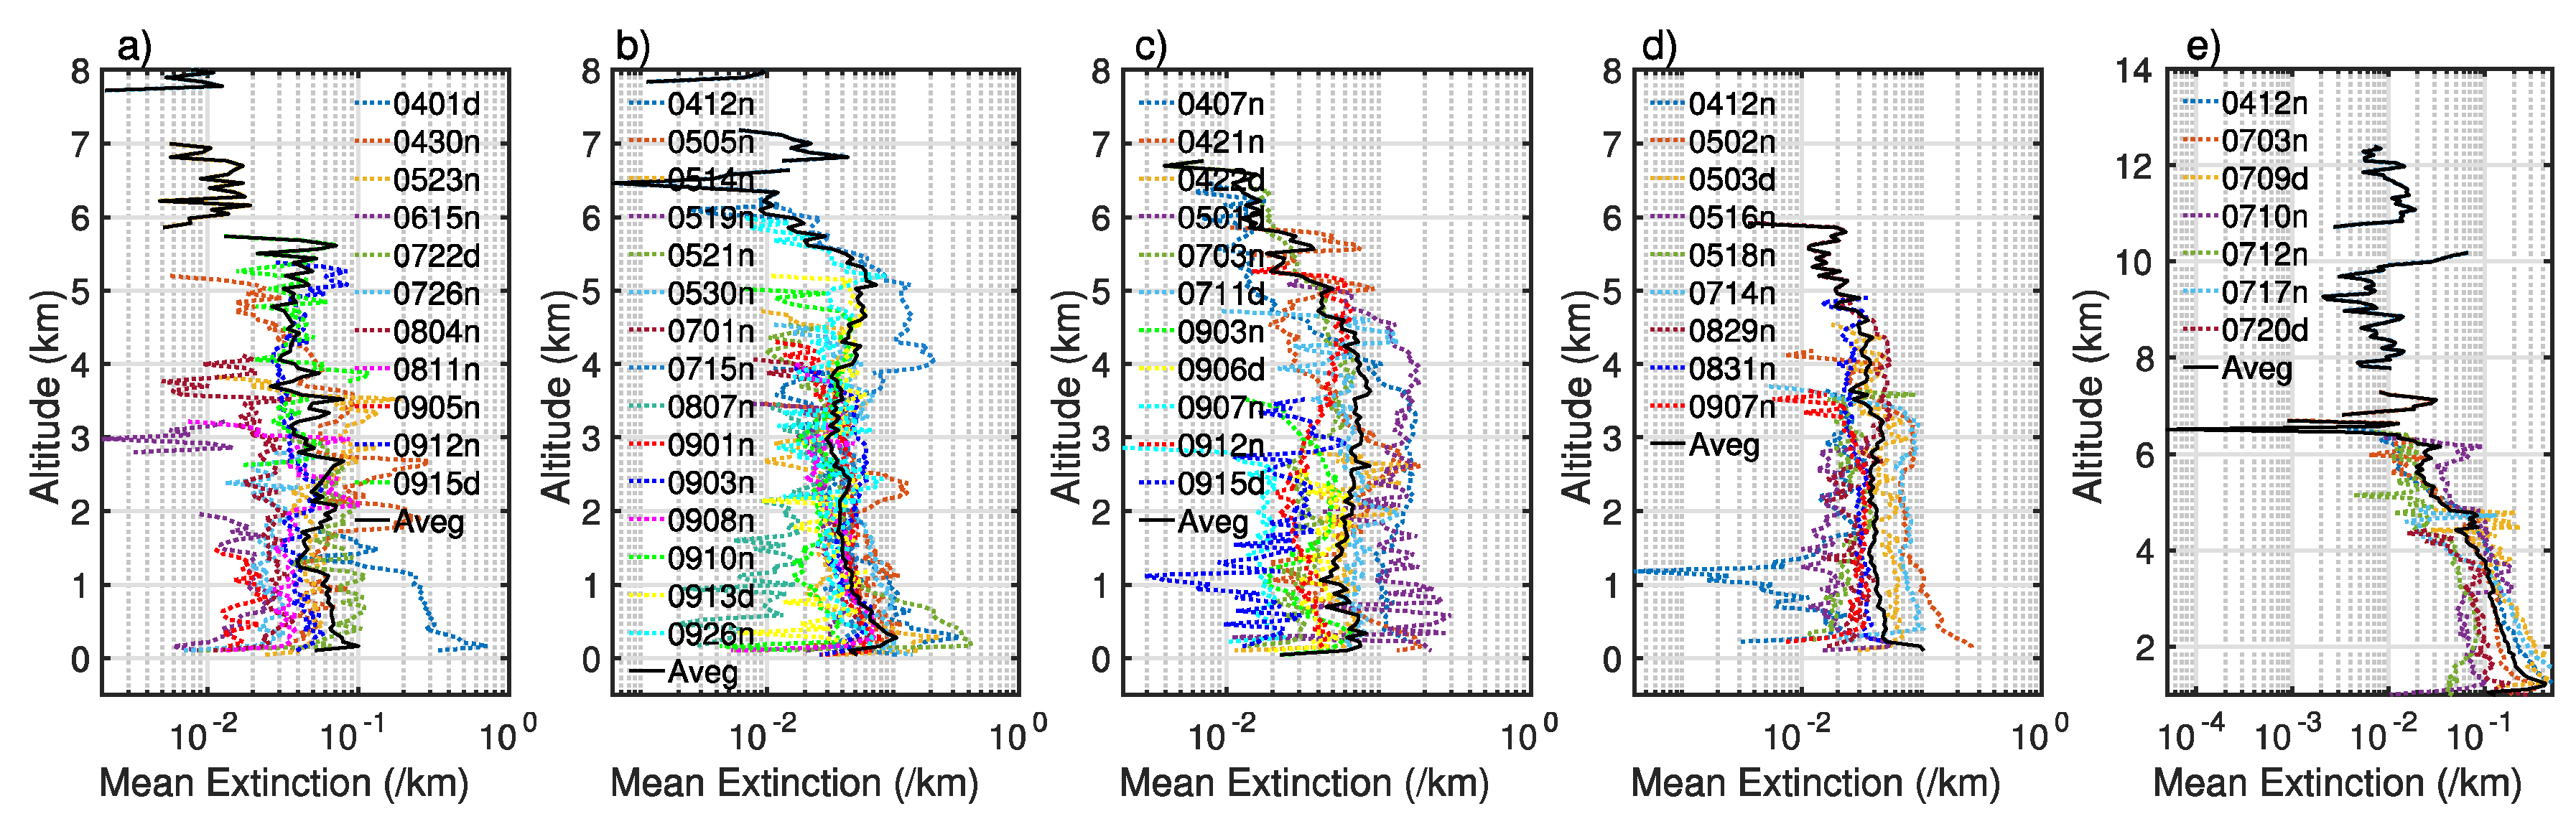
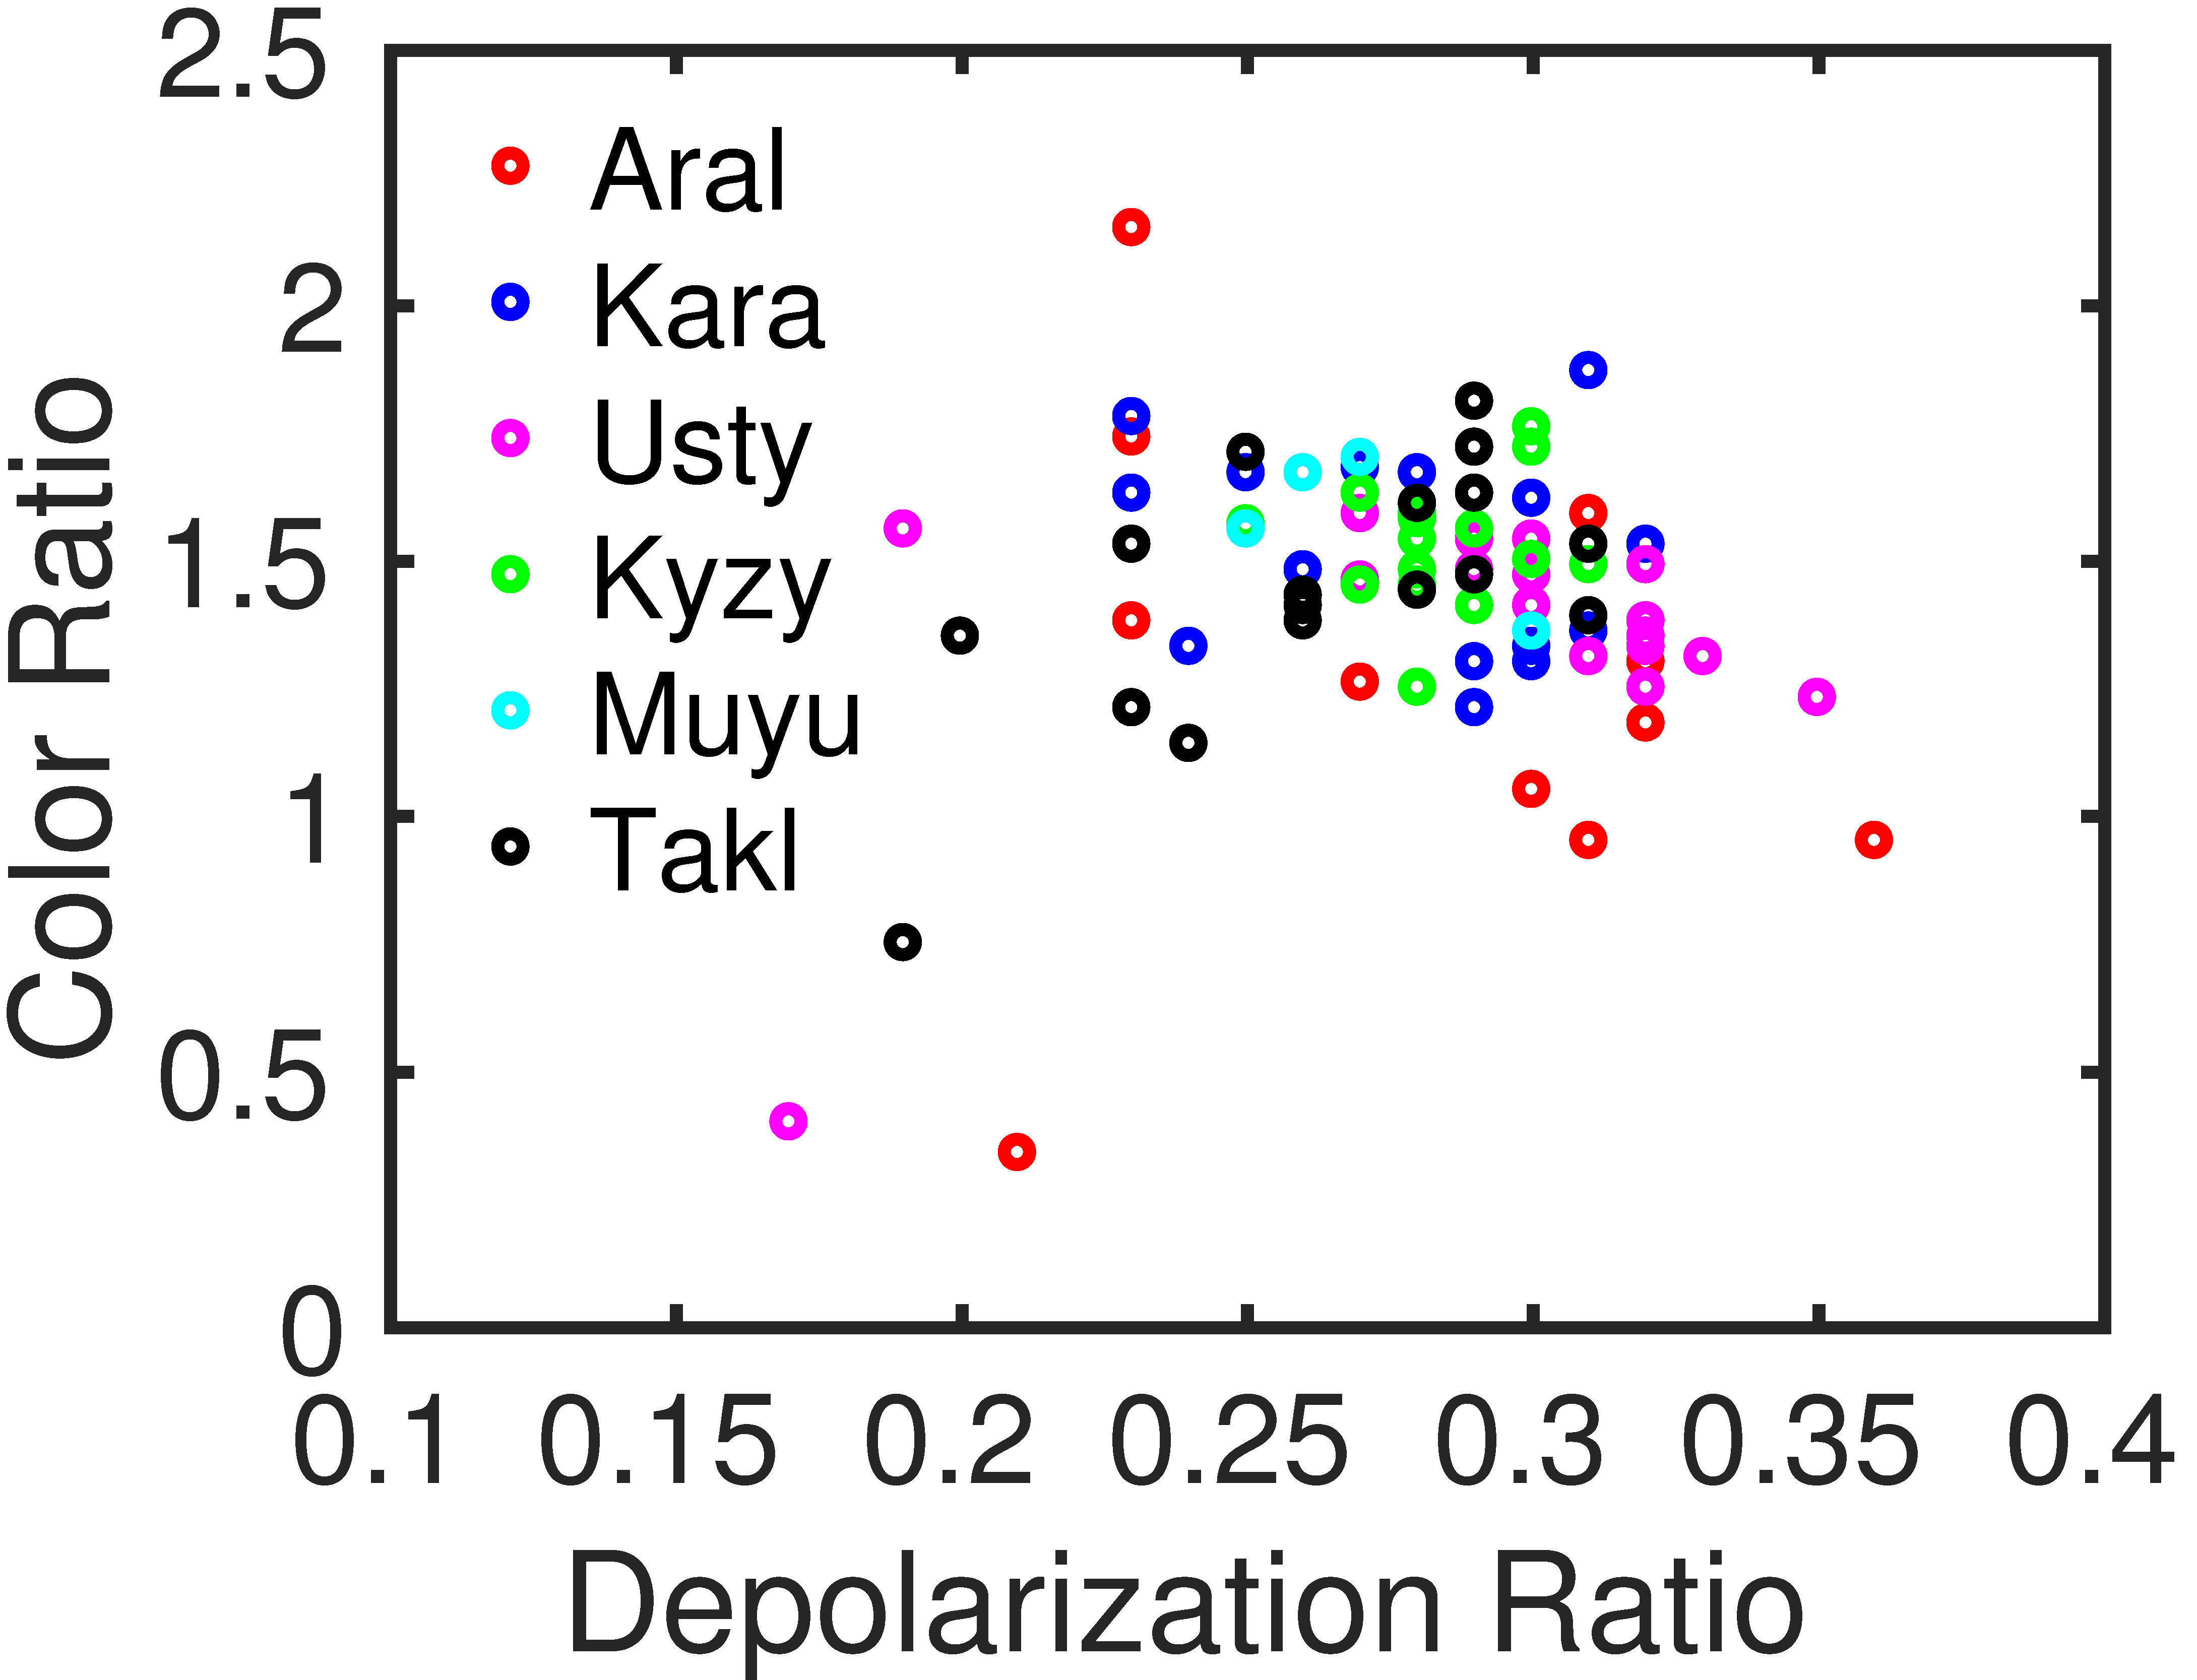
5.3. Physical Properties and Vertical Profiles of Dust Aerosols
6. Discussion and Conclusions
Supplementary Materials
Author Contributions
Funding
Acknowledgments
Conflicts of Interest
References
- Sokolik, I.N.; Toon, O.B. Direct radiative forcing by anthropogenic airborne mineral aerosols. Nature 1996, 381, 681–683. [Google Scholar] [CrossRef]
- Jickells, T.D.; An, Z.S.; Andersen, K.K.; Baker, A.R.; Bergametti, G.; Brooks, N.; Cao, J.J.; Boyd, P.W.; Duce, R.A.; Hunter, K.A.; et al. Global iron connections between desert dust, ocean biogeochemistry, and climate. Science 2005, 308, 67–71. [Google Scholar] [CrossRef] [PubMed]
- Atkinson, J.D.; Murray, B.J.; Woodhouse, M.T.; Whale, T.F.; Baustian, K.J.; Carslaw, K.S.; Dobbie, S.; O’Sullivan, D.; Malkin, T.L. The importance of feldspar for ice nucleation by mineral dust in mixed-phase clouds. Nature 2013, 500, 491. [Google Scholar] [CrossRef]
- Li, L.L.; Sokolik, I.N. Developing a dust emission procedure for central Asia. Air Soil Water Res. 2017, 10, 1–12. [Google Scholar] [CrossRef]
- Saiko, T.A.; Zonn, I.S. Irrigation expansion and dynamics of desertification in the circum-aral region of central Asia. Appl. Geogr. 2000, 20, 349–367. [Google Scholar] [CrossRef]
- Indoitu, R.; Kozhoridze, G.; Batyrbaeva, M.; Vitkovskaya, I.; Orlovsky, N.; Blumberg, D.; Orlovsky, L. Dust emission and environmental changes in the dried bottom of the Aral Sea. Aeolian Res. 2015, 17, 101–115. [Google Scholar] [CrossRef]
- Ge, Y.X.; Abuduwaili, J.; Ma, L.; Liu, D.W. Temporal variability and potential diffusion characteristics of dust aerosol originating from the Aral Sea basin, central Asia. Water Air Soil Pollut. 2016, 227, 63. [Google Scholar] [CrossRef]
- Orlovsky, L.; Orlovsky, N.; Durdyev, A. Dust storms in Turkmenistan. J. Arid Environ. 2005, 60, 83–97. [Google Scholar] [CrossRef]
- Orlovsky, N.; Birnbaum, E.H. The role of haloxylon species for combating desertification in central Asia. Plant Biosyst. 2002, 136, 233–240. [Google Scholar] [CrossRef]
- Groll, M.; Opp, C.; Aslanov, I. Spatial and temporal distribution of the dust deposition in central Asia—Results from a long term monitoring program. Aeolian Res. 2013, 9, 49–62. [Google Scholar] [CrossRef]
- Mahowald, N.M.; Dufresne, J.L. Sensitivity of toms aerosol index to boundary layer height: Implications for detection of mineral aerosol sources. Geophys. Res. Lett. 2004, 31. [Google Scholar] [CrossRef]
- Papadimas, C.D.; Hatzianastassiou, N.; Mihalopoulos, N.; Querol, X.; Vardavas, I. Spatial and temporal variability in aerosol properties over the Mediterranean basin based on 6-year (2000–2006) modis data. J. Geophys. Res.-Atmos. 2008, 113. [Google Scholar] [CrossRef]
- Kosmopoulos, P.G.; Kaskaoutis, D.G.; Nastos, P.T.; Kambezidis, H.D. Seasonal variation of columnar aerosol optical properties over athens, greece, based on modis data. Remote Sens. Environ. 2008, 112, 2354–2366. [Google Scholar] [CrossRef]
- Martonchik, J.V.; Diner, D.J.; Kahn, R.; Gaitley, B.; Holben, B.N. Comparison of MISR and AERONET aerosol optical depths over desert sites. Geophys. Res. Lett. 2004, 31. [Google Scholar] [CrossRef]
- Christopher, S.A.; Wang, J. Intercomparison between multi-angle imaging spectroradiometer (MISR) and sunphotometer aerosol optical thickness in dust source regions over china: Implications for satellite aerosol retrievals and radiative forcing calculations. Tellus B 2004, 56, 451–456. [Google Scholar] [CrossRef]
- Liu, J.; Xia, X.; Li, Z.; Wang, P.; Min, M.; Hao, W.; Wang, Y.; Xin, J.; Li, X.; Zheng, Y.; et al. Validation of multi-angle imaging spectroradiometer aerosol products in China. Tellus B 2010, 62, 117–124. [Google Scholar] [CrossRef][Green Version]
- Sayer, A.M.; Hsu, N.C.; Bettenhausen, C.; Jeong, M.J. Validation and uncertainty estimates for MODIS collection 6 “deep blue” aerosol data. J. Geophys. Res.-Atmos. 2013, 118, 7864–7872. [Google Scholar] [CrossRef]
- Hsu, N.C.; Tsay, S.C.; King, M.D.; Herman, J.R. Aerosol properties over bright-reflecting source regions. IEEE Trans. Geosci. Remote 2004, 42, 557–569. [Google Scholar] [CrossRef]
- Ginoux, P.; Garbuzov, D.; Hsu, N.C. Identification of anthropogenic and natural dust sources using moderate resolution imaging spectroradiometer (modis) deep blue level 2 data. J. Geophys. Res.-Atmos. 2010, 115. [Google Scholar] [CrossRef]
- Prospero, J.M.; Ginoux, P.; Torres, O.; Nicholson, S.E.; Gill, T.E. Environmental characterization of global sources of atmospheric soil dust identified with the nimbus 7 total ozone mapping spectrometer (toms) absorbing aerosol product. Rev. Geophys. 2002, 40. [Google Scholar] [CrossRef]
- Kaskaoutis, D.G.; Kambezidis, H.D.; Nastos, P.T.; Kosmopoulos, P.G. Study on an intense dust storm over greece. Atmos. Environ. 2008, 42, 6884–6896. [Google Scholar] [CrossRef]
- Schepanski, K.; Tegen, I.; Macke, A. Comparison of satellite based observations of Saharan dust source areas. Remote Sens. Environ. 2012, 123, 90–97. [Google Scholar] [CrossRef]
- Huang, J.; Minnis, P.; Chen, B.; Huang, Z.W.; Liu, Z.Y.; Zhao, Q.Y.; Yi, Y.H.; Ayers, J.K. Long-range transport and vertical structure of asian dust from CALIPSO and surface measurements during PACDEX. J. Geophys. Res.-Atmos. 2008, 113. [Google Scholar] [CrossRef]
- Liu, Z.Y.; Omar, A.; Vaughan, M.; Hair, J.; Kittaka, C.; Hu, Y.X.; Powell, K.; Trepte, C.; Winker, D.; Hostetler, C.; et al. CALIPSO lidar observations of the optical properties of Saharan dust: A case study of long-range transport. J. Geophys. Res.-Atmos. 2008, 113. [Google Scholar] [CrossRef]
- Liao, H.; Seinfeld, J.H. Radiative forcing by mineral dust aerosols: Sensitivity to key variables. J. Geophys. Res.-Atmos. 1998, 103, 31637–31645. [Google Scholar] [CrossRef]
- Quijano, A.L.; Sokolik, I.N.; Toon, O.B. Radiative heating rates and direct radiative forcing by mineral dust in cloudy atmospheric conditions. J. Geophys. Res.-Atmos. 2000, 105, 12207–12219. [Google Scholar] [CrossRef]
- Meloni, D.; di Sarra, A.; Di Iorio, T.; Fiocco, G. Influence of the vertical profile of Saharan dust on the visible direct radiative forcing. J. Quant. Spectrosc. Radiat. 2005, 93, 397–413. [Google Scholar] [CrossRef]
- Tulet, P.; Mallet, M.; Pont, V.; Pelon, J.; Boone, A. The 7–13 March 2006 dust storm over west Africa: Generation, transport, and vertical stratification. J. Geophys. Res.-Atmos. 2008, 113. [Google Scholar] [CrossRef]
- Gkikas, A.; Hatzianastassiou, N.; Mihalopoulos, N.; Torres, O. Characterization of aerosol episodes in the greater Mediterranean sea area from satellite observations (2000–2007). Atmos. Environ. 2016, 128, 286–304. [Google Scholar] [CrossRef]
- Hamonou, E.; Chazette, P.; Balis, D.; Dulac, F.; Schneider, X.; Galani, E.; Ancellet, G.; Papayannis, A. Characterization of the vertical structure of saharan dust export to the Mediterranean basin. J. Geophys. Res.-Atmos. 1999, 104, 22257–22270. [Google Scholar] [CrossRef]
- Ansmann, A.; Baars, H.; Tesche, M.; Muller, D.; Althausen, D.; Engelmann, R.; Pauliquevis, T.; Artaxo, P. Dust and smoke transport from africa to south america: Lidar profiling over cape verde and the Amazon rainforest. Geophys. Res. Lett. 2009, 36. [Google Scholar] [CrossRef]
- Adams, A.M.; Prospero, J.M.; Zhang, C.D. CALIPSO-derived three-dimensional structure of aerosol over the Atlantic basin and adjacent continents. J. Clim. 2012, 25, 6862–6879. [Google Scholar] [CrossRef]
- Eguchi, K.; Uno, I.; Yumimoto, K.; Takemura, T.; Shimizu, A.; Sugimoto, N.; Liu, Z. Trans-pacific dust transport: Integrated analysis of NASA/CALIPSO and a global aerosol transport model. Atmos. Chem. Phys. 2009, 9, 3137–3145. [Google Scholar] [CrossRef]
- Indoitu, R.; Orlovsky, L.; Orlovsky, N. Dust storms in central Asia: Spatial and temporal variations. J. Arid Environ. 2012, 85, 62–70. [Google Scholar] [CrossRef]
- Li, L.; Sokolik, I.N. The dust direct radiative impact and its sensitivity to the land surface state and key minerals in the WRF-Chem-DuMo model: A case study of dust storms in central Asia. J. Geophys. Res.-Atmos. 2018, 123. [Google Scholar] [CrossRef]
- Mishchenko, M.I.; Travis, L.D.; Kahn, R.A.; West, R.A. Modeling phase functions for dustlike tropospheric aerosols using a shape mixture of randomly oriented polydisperse spheroids. J. Geophys. Res.-Atmos. 1997, 102, 16831–16847. [Google Scholar] [CrossRef]
- Torres, O.; Tanskanen, A.; Veihelmann, B.; Ahn, C.; Braak, R.; Bhartia, P.K.; Veefkind, P.; Levelt, P. Aerosols and surface UV products from ozone monitoring instrument observations: An overview. J. Geophys. Res.-Atmos. 2007, 112. [Google Scholar] [CrossRef]
- Omar, A.H.; Winker, D.M.; Kittaka, C.; Vaughan, M.A.; Liu, Z.Y.; Hu, Y.X.; Trepte, C.R.; Rogers, R.R.; Ferrare, R.A.; Lee, K.P.; et al. The calipso automated aerosol classification and lidar ratio selection algorithm. J. Atmos. Ocean. Technol. 2009, 26, 1994–2014. [Google Scholar] [CrossRef]
- Ginoux, P.; Prospero, J.M.; Gill, T.E.; Hsu, N.C.; Zhao, M. Global-scale attribution of anthropogenic and natural dust sources and their emission rates based on modis deep blue aerosol products. Rev. Geophys. 2012, 50. [Google Scholar] [CrossRef]
- Schepanski, K.; Tegen, I.; Laurent, B.; Heinold, B.; Macke, A. A new Saharan dust source activation frequency map derived from MSG-SEVIRI IR-channels. Geophys. Res. Lett. 2007, 34. [Google Scholar] [CrossRef]
- Xu, Y. Evaluation of mineral dust aerosol optical depth and related components from the chimere-dust model using satellite remote sensing and ground-based observations. Atmos. Environ. 2018. [Google Scholar] [CrossRef]
- Ciren, P.; Kondragunta, S. Dust aerosol index (DAI) algorithm for MODIS. J. Geophys. Res.-Atmos. 2014, 119, 4770–4792. [Google Scholar] [CrossRef]
- Darmenova, K.; Sokolik, I.N.; Shao, Y.P.; Marticorena, B.; Bergametti, G. Development of a physically based dust emission module within the weather research and forecasting (WRF) model: Assessment of dust emission parameterizations and input parameters for source regions in central and east Asia. J. Geophys. Res.-Atmos. 2009, 114. [Google Scholar] [CrossRef]
- Baddock, M.C.; Ginoux, P.; Bullard, J.E.; Gill, T.E. Do MODIS-defined dust sources have a geomorphological signature? Geophys. Res. Lett. 2016, 43, 2606–2613. [Google Scholar] [CrossRef]
- Xi, X.; Sokolik, I.N. Dust interannual variability and trend in central Asia from 2000 to 2014 and their climatic linkages. J. Geophys. Res.-Atmos. 2015, 120. [Google Scholar] [CrossRef]
- Razakov, R.M.; Kosnazarov, K.A. Dust and salt transfer from the exposed bed of the Aral Sea and measures to decrease its environmental impact. In NATO ASI Series (Series 2. Environment); Micklin, P.P., Williams, W.D., Eds.; Springer: Berlin/Heidelberg, Germany, 1996; Volume 12, pp. 95–102. [Google Scholar]
- Winker, D.M.; Tackett, J.L.; Getzewich, B.J.; Liu, Z.; Vaughan, M.A.; Rogers, R.R. The global 3-d distribution of tropospheric aerosols as characterized by CALIOP. Atmos. Chem. Phys. 2013, 13, 3345–3361. [Google Scholar] [CrossRef]
- Gautam, R.; Liu, Z.Y.; Singh, R.P.; Hsu, N.C. Two contrasting dust-dominant periods over India observed from MODIS and CALIPSO data. Geophys. Res. Lett. 2009, 36. [Google Scholar] [CrossRef]
- Shimizu, A.; Sugimoto, N.; Matsui, I.; Arao, K.; Uno, I.; Murayama, T.; Kagawa, N.; Aoki, K.; Uchiyama, A.; Yamazaki, A. Continuous observations of Asian dust and other aerosols by polarization lidars in China and Japan during ACE-Asia. J. Geophys. Res.-Atmos. 2004, 109. [Google Scholar] [CrossRef]
- Chen, B.B.; Sverdlik, L.G.; Imashev, S.A.; Solomon, P.A.; Lantz, J.; Schauer, J.J.; Shafer, M.M.; Artamonova, M.S.; Carmichael, G.R. Lidar measurements of the vertical distribution of aerosol optical and physical properties over central Asia. Int. J. Atmos. Sci. 2013, 2013, 1–17. [Google Scholar] [CrossRef]
- Lioubimtseva, E.; Cole, R.; Adams, J.M.; Kapustin, G. Impacts of climate and land-cover changes in arid lands of central Asia. J. Arid Environ. 2005, 62, 285–308. [Google Scholar] [CrossRef]
- Xi, X.; Sokolik, I.N. Seasonal dynamics of threshold friction velocity and dust emission in central Asia. J. Geophys. Res.-Atmos. 2015, 120, 1536–1564. [Google Scholar] [CrossRef] [PubMed]
- Xuan, J.; Sokolik, I.N. Characterization of sources and emission rates of mineral dust in northern China. Atmos. Environ. 2002, 36, 4863–4876. [Google Scholar] [CrossRef]
- Laurent, B.; Marticorena, B.; Bergametti, G.; Mei, F. Modeling mineral dust emissions from chinese and Mongolian deserts. Glob. Planet. Chang. 2006, 52, 121–141. [Google Scholar] [CrossRef]
- De Beurs, K.M.; Henebry, G.M.; Owsley, B.C.; Sokolik, I. Using multiple remote sensing perspectives to identify and attribute land surface dynamics in central Asia 2001–2013. Remote Sens. Environ. 2015, 170, 48–61. [Google Scholar] [CrossRef]
- Kahn, R.A.; Garay, M.J.; Nelson, D.L.; Yau, K.K.; Bull, M.A.; Gaitley, B.J.; Martonchik, J.V.; Levy, R.C. Satellite-derived aerosol optical depth over dark water from MISR and MODIS: Comparisons with aeronet and implications for climatological studies. J. Geophys. Res.-Atmos. 2007, 112. [Google Scholar] [CrossRef]
- Abdou, W.A.; Diner, D.J.; Martonchik, J.V.; Bruegge, C.J.; Kahn, R.A.; Gaitley, B.J.; Crean, K.A.; Remer, L.A.; Holben, B. Comparison of coincident multiangle imaging spectroradiometer and moderate resolution imaging spectroradiometer aerosol optical depths over land and ocean scenes containing aerosol robotic network sites. J. Geophys. Res.-Atmos. 2005, 110. [Google Scholar] [CrossRef]
- Kahn, R.A.; Nelson, D.L.; Garay, M.J.; Levy, R.C.; Bull, M.A.; Diner, D.J.; Martonchik, J.V.; Paradise, S.R.; Hansen, E.G.; Remer, L.A. Misr aerosol product attributes and statistical comparisons with modis. IEEE Trans. Geosci. Remote 2009, 47, 4095–4114. [Google Scholar] [CrossRef]
- Uno, I.; Amano, H.; Emori, S.; Kinoshita, K.; Matsui, I.; Sugimoto, N. Trans-pacific yellow sand transport observed in April 1998: A numerical simulation. J. Geophys. Res.-Atmos. 2001, 106, 18331–18344. [Google Scholar] [CrossRef]
- Liu, Z.Y.; Sugimoto, N.; Murayama, T. Extinction-to-backscatter ratio of Asian dust observed with high-spectral-resolution lidar and raman lidar. Appl. Opt. 2002, 41, 2760–2767. [Google Scholar] [CrossRef] [PubMed]
- Uno, I.; Eguchi, K.; Yumimoto, K.; Takemura, T.; Shimizu, A.; Uematsu, M.; Liu, Z.Y.; Wang, Z.F.; Hara, Y.; Sugimoto, N. Asian dust transported one full circuit around the globe. Nat. Geosci. 2009, 2, 557–560. [Google Scholar] [CrossRef]
- Burton, S.P.; Ferrare, R.A.; Vaughan, M.A.; Omar, A.H.; Rogers, R.R.; Hostetler, C.A.; Hair, J.W. Aerosol classification from airborne hsrl and comparisons with the CALIPSO vertical feature mask. Atmos. Meas. Tech. 2013, 6, 1397–1412. [Google Scholar] [CrossRef]
- Wu, Y.H.; Cordero, L.; Gross, B.; Moshary, F.; Ahmed, S. Assessment of calipso attenuated backscatter and aerosol retrievals with a combined ground-based multi-wavelength lidar and sunphotometer measurement. Atmos. Environ. 2014, 84, 44–53. [Google Scholar] [CrossRef]
- Sokolik, I.N.; Toon, O.B. Incorporation of mineralogical composition into models of the radiative properties of mineral aerosol from UV to IR wavelengths. J. Geophys. Res.-Atmos. 1999, 104, 9423–9444. [Google Scholar] [CrossRef]


| p-Values | Regions | Sensor | |||||||
|---|---|---|---|---|---|---|---|---|---|
| Terra | Aqua | SeaWiFS | MISR | ||||||
| JJA vs. MAM | SON vs. MAM | JJA vs. MAM | SON vs. MAM | JJA vs. MAM | SON vs. MAM | JJA vs. MAM | SON vs. MAM | ||
| AOD | Cen | 2.10(−1) | 4.06(−90) | 3.65(−02) 1 | 4.74(−97) | 2.14(−07) | 3.16(−155) | 5.38(−05) | 4.35(−137) |
| Tak | 3.65(−94) | 1.19(−258) | 1.49(−77) | 2.56(−227) | 1.33(−10) | 1.43(−126) | 1.18(−09) | 6.52(−143) | |
| Criterion 1 | Cen | 1.57(−15) | 2.02(−26) | 5.48(−06) | 2.42(−21) | 4.55(−10) | 1.05(−73) | 4.14(−02) | 7.10(−104) |
| Tak | 2.43(−80) | 7.15(−83) | 1.43(−53) | 1.04(−60) | 8.09(−10) | 5.50(−96) | 2.77(−04) | 7.39(−123) | |
| Criterion 2 | Cen | 2.31(−10) | 8.47(−45) | 9.78(−05) | 6.29(−37) | 3.15(−12) | 1.90(−104) | 4.14(−02) | 7.10(−104) |
| Tak | 5.56(−83) | 9.35(−128) | 1.26(−66) | 7.48(−98) | 4.57(−10) | 3.62(−108) | 2.77(−04) | 7.39(−123) | |
| Criterion 3 | Cen | 4.80(−03) | 2.10(−20) | 7.30(−03) | 1.48(−16) | 2.41(−05) | 6.28(−23) | 4.14(−02) | 7.10(−104) |
| Tak | 1.38(−38) | 4.43(−37) | 1.81(−30) | 1.36(−33) | 1.58(−04) | 2.80(−07) | 2.77(−04) | 7.39(−123) | |
| DOD> | Regions | AE < 2.0 | AE < 1.2 | AE < 0.7 | AE < 0.5 | ||||||||
|---|---|---|---|---|---|---|---|---|---|---|---|---|---|
| Spring | Summer | Fall | Spring | Summer | Fall | Spring | Summer | Fall | Spring | Summer | Fall | ||
| Kaza | 104(20) | 153(15) | 129(29) | 95 | 143 | 112 | 90(84) | 136(77) | 104(148) | 87 | 133 | 100 | |
| 0.1 | Usty | 107(22) | 166(13) | 122(24) | 97 | 157 | 107 | 91(52) | 150(58) | 100(138) | 88 | 147 | 98 |
| Takl | 114(9) | 87(6) | 72(16) | 112 | 85 | 68 | 107(35) | 82(71) | 63(152) | 105 | 82 | 62 | |
| Aral | 116(25) | 159(15) | 123(35) | 103 | 148 | 103 | 96(104) | 141(114) | 95(228) | 93 | 138 | 91 | |
| Kaza | 80(18) | 120(14) | 87(23) | 75 | 114 | 80 | 71 | 108 | 74 | 68 | 105 | 71 | |
| 0.2 | Usty | 89(17) | 138(11) | 81(16) | 83 | 132 | 77 | 78 | 127 | 72 | 76 | 124 | 70 |
| Takl | 95(7) | 64(5) | 42(11) | 94 | 64 | 41 | 91 | 62 | 38 | 89 | 61 | 38 | |
| Aral | 86(21) | 116(15) | 72(24) | 80 | 110 | 66 | 74 | 104 | 61 | 71 | 101 | 58 | |
| Kaza | 55(17) | 86(15) | 49(23) | 52 | 81 | 46 | 49 | 77 | 42 | 47 | 75 | 40 | |
| 0.3 | Usty | 66(14) | 103(11) | 47(15) | 63 | 99 | 45 | 60 | 95 | 42 | 58 | 93 | 41 |
| Takl | 83(6) | 49(4) | 27(13) | 82 | 49 | 26 | 79 | 48 | 25 | 78 | 47 | 24 | |
| Aral | 55(22) | 75(17) | 34(21) | 51 | 71 | 32 | 47 | 66 | 29 | 45 | 64 | 28 | |
| Threshold | Sub-Regions | DODt = 0.1 | DODt = 0.2 | DODt = 0.3 | |||
|---|---|---|---|---|---|---|---|
| Trend | p-Values | Trend | p-Values | Trend | p-Values | ||
| Kaza | 0.0829 | 0.5098 | 0.1658 | 0.2661 | 0.1679 | 0.2322 | |
| Usty | 0.2325 | 0.174 | 0.4725 | 0.2165 | 0.5167 | 0.0581 | |
| AEt = 0.5 | Takl | 0.0817 | 0.1175 | 0.05 | 0.3031 | 0.0333 | 0.3648 |
| Aral | 0.1464 | 0.5366 | 0.1958 | 0.3434 | 0.1917 | 0.2322 | |
| Kaza | 0.1625 | 0.2016 | 0.2045 | 0.0836 | 0.2038 | 0.1082 | |
| Usty | 0.2086 | 0.1082 | 0.4023 | 0.174 | 0.3833 | 0.0529 | |
| AEt = 1.2 | Takl | 0.1225 | 0.0529 | 0.069 | 0.1494 | 0.0542 | 0.2487 |
| Aral | 0.1958 | 0.2322 | 0.2643 | 0.2322 | 0.2367 | 0.174 |
| Threshold | Regions | DODt = 0.1 | DODt = 0.2 | DODt = 0.3 | ||||||
|---|---|---|---|---|---|---|---|---|---|---|
| MAM vs. JJA | MAM vs. SON | SON vs. JJA | MAM vs. JJA | MAM vs. SON | SON vs. JJA | MAM vs. JJA | MAM vs. SON | SON vs. JJA | ||
| Kaza | 2.14(−10) | 0.9871 | 6.09(−05) | 1.92(−08) | 0.89 | 1.59(−05) | 2.95(−07) | 0.61 | 1.86(−06) | |
| Usty | 3.19(−10) | 0.88 | 4.52(−06) | 1.06(−08) | 0.53 | 1.02(−06) | 3.97(−07) | 0.17 | 2.79(−07) | |
| AEt = 0.5 | Takl | 3.84(−05) | 7.2(−10) | 3.82(−04) | 1.79(−06) | 5.92(−15) | 3.76(−08) | 5.79(−09) | 5.01(−17) | 1.07(−10) |
| Aral | 1.33(−07) | 0.37 | 1.59(−05) | 6.78(−06) | 0.69 | 1.97(−05) | 1.21(−05) | 0.89 | 1.21(−06) | |
| Kaza | 1.06(−12) | 0.999 | 9.82(−04) | 1.22(−09) | 0.92 | 1.6(−05) | 7.51(−08) | 0.45 | 5.51(−07) | |
| Usty | 1.06(−11) | 0.98 | 3.6(−05) | 2.4(−09) | 0.48 | 6.51(−07) | 3.84(−07) | 0.063 | 7.5(−08) | |
| AEt = 1.2 | Takl | 3.97(−06) | 2.41(−09) | 0.55(−02) | 1.51(−07) | 3.88(−15) | 2.8(−07) | 4.19(−10) | 3.1(−17) | 1.16(−09) |
| Aral | 6.27(−09) | 0.1 | 4.13(−04) | 1.36(−06) | 0.77 | 1.33(−05) | 6.58(−06) | 0.94 | 2.71(−07) |
© 2018 by the authors. Licensee MDPI, Basel, Switzerland. This article is an open access article distributed under the terms and conditions of the Creative Commons Attribution (CC BY) license (http://creativecommons.org/licenses/by/4.0/).
Share and Cite
Li, L.; Sokolik, I.N. Analysis of Dust Aerosol Retrievals Using Satellite Data in Central Asia. Atmosphere 2018, 9, 288. https://doi.org/10.3390/atmos9080288
Li L, Sokolik IN. Analysis of Dust Aerosol Retrievals Using Satellite Data in Central Asia. Atmosphere. 2018; 9(8):288. https://doi.org/10.3390/atmos9080288
Chicago/Turabian StyleLi, Longlei, and Irina N. Sokolik. 2018. "Analysis of Dust Aerosol Retrievals Using Satellite Data in Central Asia" Atmosphere 9, no. 8: 288. https://doi.org/10.3390/atmos9080288
APA StyleLi, L., & Sokolik, I. N. (2018). Analysis of Dust Aerosol Retrievals Using Satellite Data in Central Asia. Atmosphere, 9(8), 288. https://doi.org/10.3390/atmos9080288