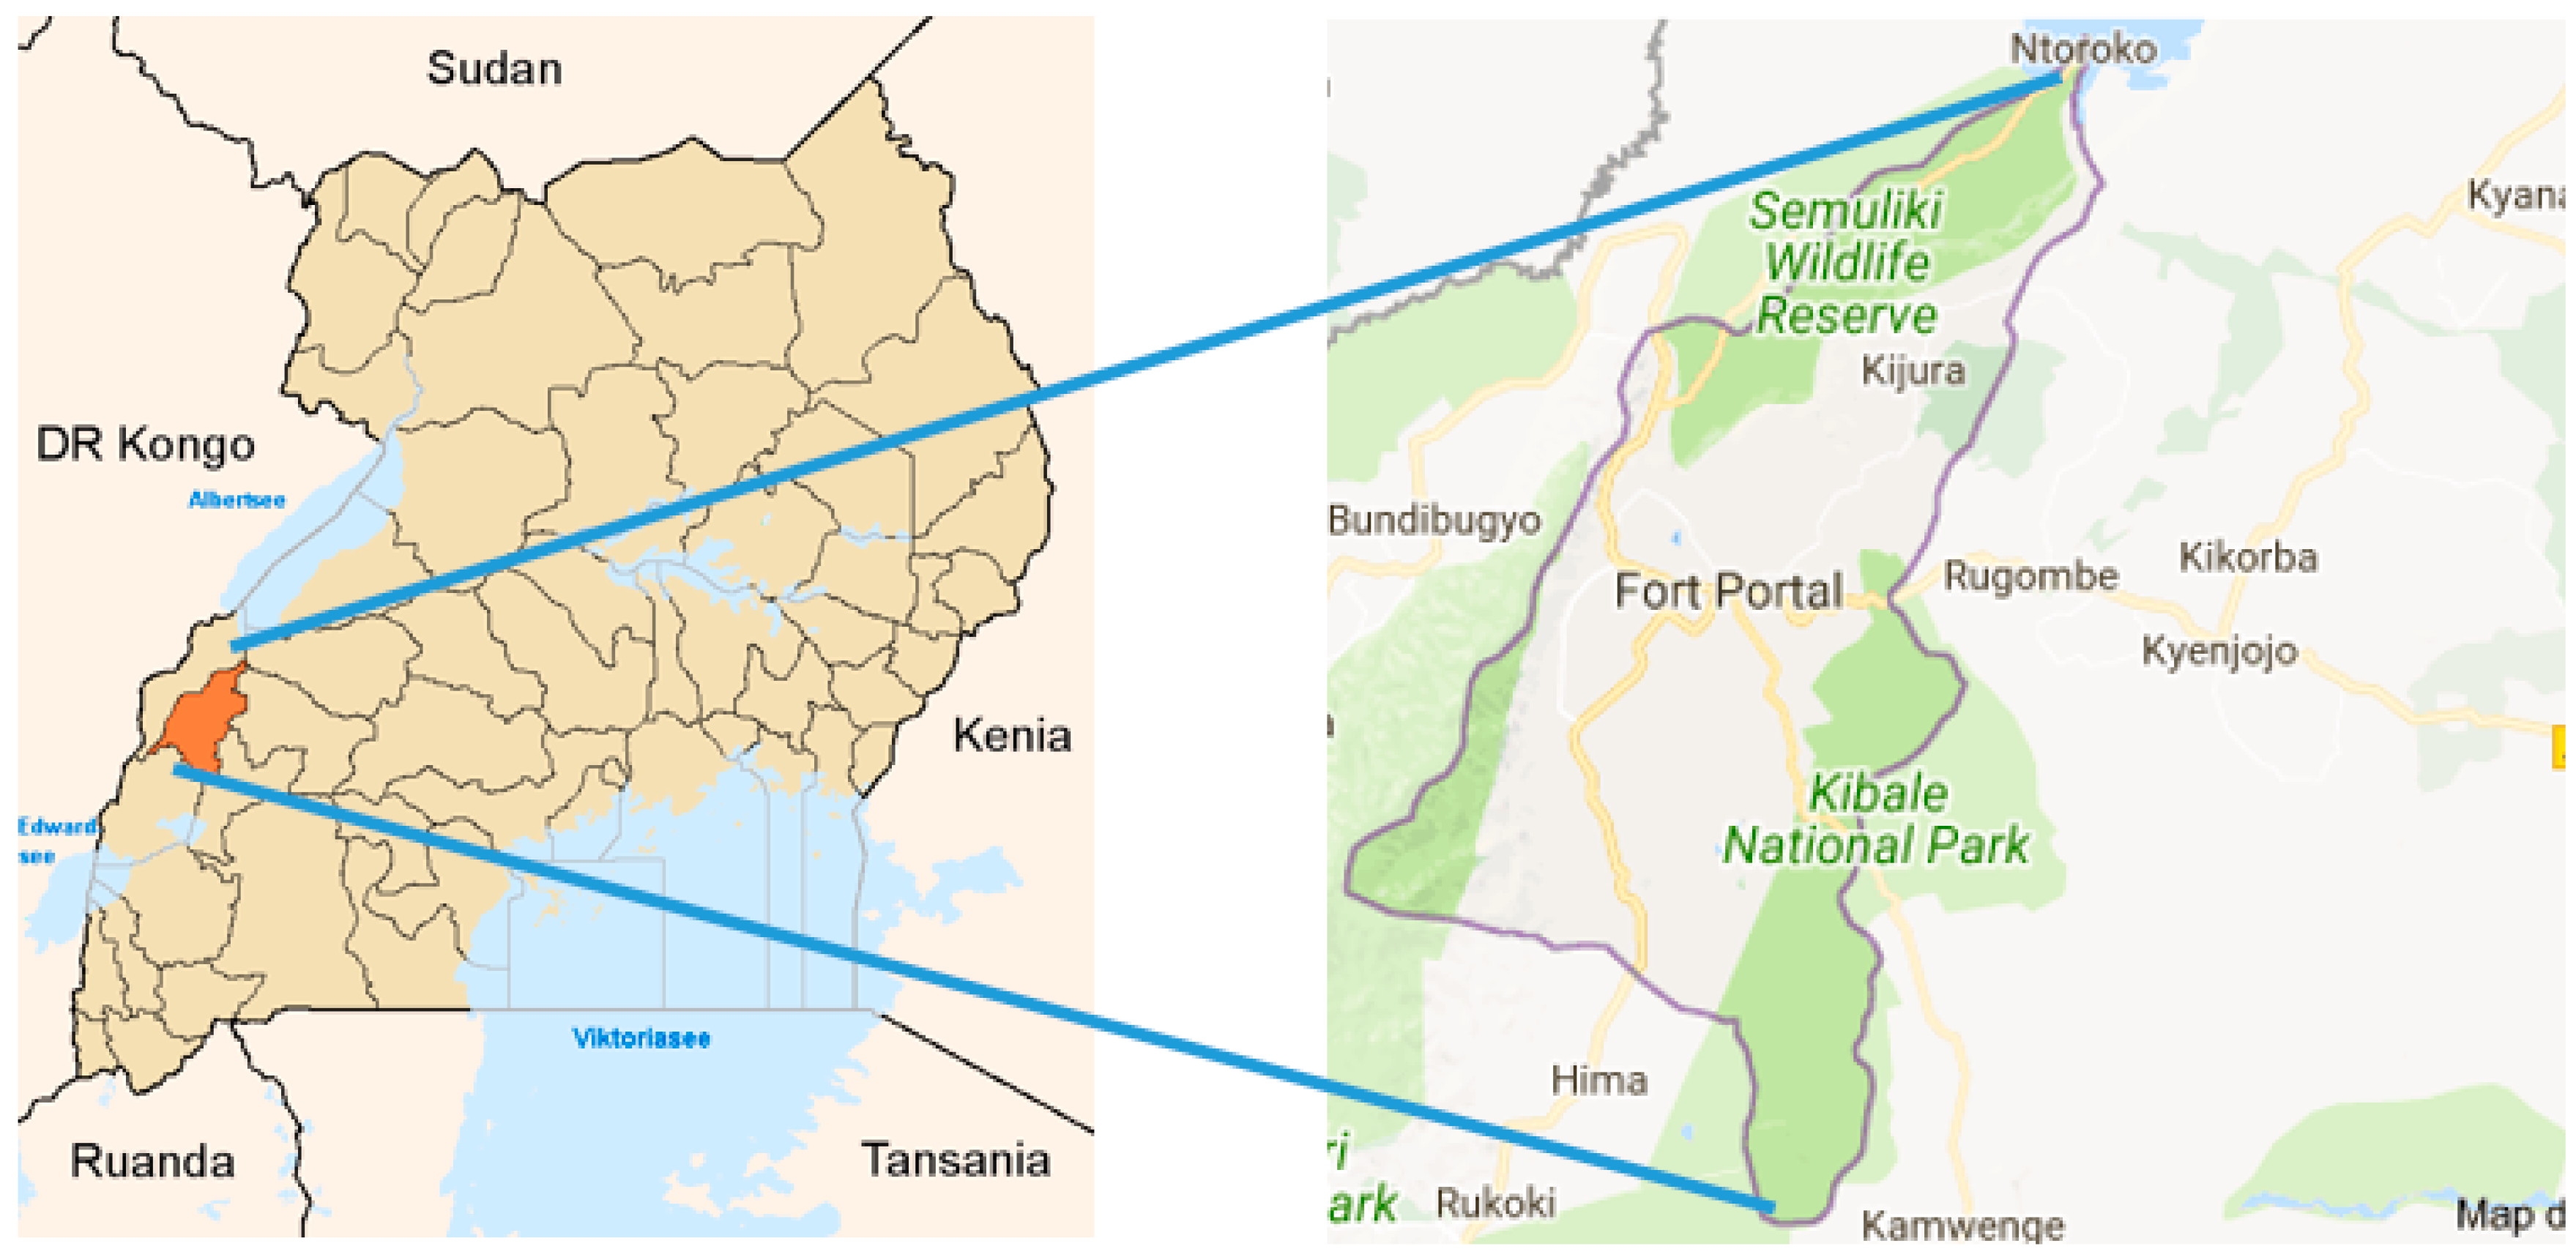
Article

Effect of Climate Change on Reliability of Rainwater Harvesting Systems for Kabarole District, Uganda

1
School of Agriculture and Environmental Sciences, Mountains of the Moon University, Fort Portal P.O. Box 837, Uganda
2
Chemical Engineering Department, ProcESS division, KU Leuven, Box 2424, 3001 Heverlee, Leuven, Belgium
3
National Water and Sewerage Corporation, Kampala P.O. Box 7053, Uganda
4
Faculty of Engineering and the Built Environment, Tshwane University of Technology, Pretoria, Private 0183, South Africa
*
Author to whom correspondence should be addressed.
Water 2018, 10(1), 71; https://doi.org/10.3390/w10010071
Submission received: 28 November 2017 / Revised: 8 January 2018 / Accepted: 10 January 2018 / Published: 15 January 2018

Abstract

:
This paper assesses the effect of climate change on reliability of rainwater harvesting systems for Kabarole district, Uganda, as predicted by 6 best performing global circulation models (GCMs). A daily water balance model was used to simulate the performance of a rainwater harvesting system using historical daily rainfall data for 20 years. The GCMs used to generate daily rainfall projections for 2025–2055 and 2060–2090 periods included; ACCESS1-0, BCC-CSM-1-M, CNRM-CM5, HADGEM2-CC, HADGEM2-ES and MIROC5. Analysis was based on the Ugandan weather seasons which included March, April, May (MAM) and September, October, November (SON) rain seasons in addition to December, January, February (DJF) and June, July, August (JJA) dry seasons. While an increase in reliability is predicted for the SON season, the worst-case scenario is projected during the MAM season with a reliability reduction of over 40% for the 2055–2090 period. This corresponds to a 27% reduction in water security for the same period. The DJF season is also expected to experience reduced water security by 1–8% for 2025–2055 and 2060–2090 with a 0.5 m3 tank size. Therefore, some form of extra harvesting surface and increased tank size will be required to maintain 80% systems reliability considering climate change.

1. Introduction

Competing global demands for water such as irrigated agriculture, climate change and population growth result in an increasing pressure on existing water resources to satisfy a demand that is approaching the limit of supply [1]. Global climate change estimates vary widely but most concur that some areas will have increased precipitation at the expense of other areas [2]. It is now widely accepted that climate change will, among others, lead to an increase in the frequency and intensity of climatic extremes such as droughts and floods, some of the very elements that define climate variability [3]. Historically, climate extremes such as strong El Niño events were easily predictable. However, with a warmer and drier climate predicted for Southern Africa, an increased frequency and intensity of El Niño events is expected [3]. In a review of climate dynamics and variability across East Africa, Nicholson reports that rainfall across East Africa has strong links to the El-Nino Southern Oscillation (ENSO) phenomena with above average rainfall recorded during ENSO years [4]. Shongwe et al. [5] also reports that for East Africa, an increase in mean precipitation rates and intensity of high rainfall events and less severe droughts is expected. Generally, although predictions vary, rainfall is generally projected to increase over the African continent, the exceptions being southern Africa and parts of the Horn of Africa, where rainfall is projected to decline by 2050 by about 10%. Analyses from General Circulation Models (GCMs) indicate an upward trend in rainfall under global warming over much of Burundi, Kenya, Rwanda, southern Somalia and Uganda (as cited in [6]).
Although the lack of adequate data has hampered research into climate change effects on a local scale, two major studies have been conducted in Uganda. Hisali, Birungi and Buyinza [7] used a United Kingdom Regional Climate Model (RCM) PRECIS (Providing REgional Climates for Impacts Studies) in simulating rainfall and temperature over Uganda. The model projected:
  • An increase in mean rainfall by 0.2 mm per day in the future 2071–2100, during the March, April and May season compared to the climatological period (1961–1990) for almost the entire country.
  • A reduction in rainfall of about 0.4 mm per day in June, July and August and 0.7 mm per day in September, October and November [7].
Through the Ministry of Water and Environment climate change unit, a more recent study based on the newly released climate change scenarios [8] was conducted. Two realistic greenhouse gas emission scenarios were considered under the regional scale Climate Change study: a moderate concentration pathway (RCP 4.5), and a more extreme concentration pathway (RCP 8.5) [9]. The report concluded that:
  • For both scenarios, projected annual rainfall totals are expected to differ little from what is presently experienced, with projected changes within a range of less than plus or minus 10% from present rainfall [9].
  • On a seasonal scale however, an increase in seasonal rainfall for the December, January and February season (up to 100% from present), which is indicative of a longer wet season that extends from September towards February is expected for both scenarios.
  • In addition, the months from March to August might expect slightly less rainfall which also signifies a drier dry season [9].
Overall, both studies agree that Uganda will have longer wet seasons and a drier dry season. Therefore, seasonal rainfall changes will be more important than annual rainfall changes and hence planning for any water infrastructure should account for this.
Depending on estimated local impacts and prevailing economic conditions, different regions in the world are responding differently to such predictions. For most developing countries, rainwater harvesting is listed as one of the specific adaptation strategies that the water sector needs to undertake to cope with future climate change. It is often seen as a viable option especially for rural communities where centralized systems are lacking [10,11]. Rainwater harvesting for the provision of potable, non-potable and agricultural use, has been widespread throughout the world for over 4000 years [12]. In Africa, the earliest documentation dates back to the Roman times in the western Mediterranean coastal desert in Egypt [13]. Pacey and Cullis [14] adequately document the history of rainwater harvesting and popular methodologies up to 1985. Despite this, it is only recently that rainwater harvesting has been acknowledged as an important water source. The last 20 years have thus seen an increase in roof catchment systems in Africa and South-Asia [15], with Kenya and Thailand taking the lead in technological innovations [13]. It was only in 2005 that a rainwater harvesting strategy was developed for Uganda [15]. For rainwater harvesting to be feasible, current and future rainfall projections need to be considered in the systems’ design. A few studies have tried to incorporate climate change into rain water harvesting systems’ design and performance [16,17,18,19]. For instance, in South Africa, Kahinda et al. [18] developed a methodology that mainstreams climate change in domestic rain water harvesting projects. The methodology was then applied to different climatic zones within South Africa and the general trend was a 5–20% increase in water security for a tank size of 0.5 m3 in the dry sub humid, humid and semi-arid regions. Although the study uses 6 GCMs to evaluate climate change effects on water security, variations in changes in seasonal predictions were not addressed. Seasonal specific design recommendations are thus not recorded. In Australia, Rahman et al. [17] evaluated the impacts of climate change on rainwater harvesting. The study evaluated seasonal changes and concluded that climate change will have a negative effect on rainwater savings, reliability and the impacts will be more severe in the dry season than the wet season. The study however relied on a single GCM for the predicted rainfall but it is evident that different GCMs can yield conflicting predictions for the same location further complicating the planning process [18]. This is especially true for sub Saharan Africa where climate change modeling is still relatively new, which makes reliance on studies done elsewhere very unfeasible.
A few studies that have incorporated different GCMs in water harvesting systems design assessments are mainly in developed nations like Australia [19] but since the effects are often location specific, predictions are highly variable. This is especially critical for developing nations where vulnerability is often high. Therefore, it is crucial to consider the variations in rainfall predictions using the best performing GCMs when designing rainwater harvesting systems for developing nations like Uganda. This can help in designing systems that account for uncertainties related to climate change predictions in such regions. The overall objective of this paper is therefore to assess the effect of climate change on reliability and water security of rainwater harvesting systems, using Kabarole district as a case study. Specifically, the paper generates rainfall projections for the near future (2025–2055) and long-term future (2060–2090) using 6 best performing GCMs; the paper then evaluates seasonal climate change effects on rain water harvesting reliability and water security for the same periods. Changes in design combinations to ensure a maintenance of 80% reliability are also analyzed and implications on rural households presented. Based on previous climate change assessments for Uganda, projected annual rainfall changes are not as significant as projected seasonal rainfall changes [9,20]. For instance, while total annual precipitation is expected to increase by less than 10% for the RCP4.5 scenario [9], seasonal rainfall is expected to significantly differ from the present (up to 100%) especially for December, January and February season [20]. Hence, using annual rainfall changes in designing rainwater harvesting systems may lead to either over-or underestimation of systems’ design. Identification of the most affected season thus informs the overall systems design since this would account for the worst-case scenario. Therefore, this analysis was done on a seasonal scale representing the 2 rainy seasons of March, April May (MAM) and September, October, November (SON) and 2 dry seasons of June, July, August (JJA) and December, January, February (DJF).

2. Materials and Methods

2.1. Location of Study Area

To accomplish the above objectives, Kabarole district was used as a case study. As shown in Figure 1, Kabarole District is in western Uganda and is bordered by Kamwenge District in the north, Bundibugyo District in the northwest, Kasese in the west and Kyenjojo in the east. Fort Portal is the main town of Kabarole district and is over 300 km from Kampala, Uganda’s capital city. It has a total area of 8319 sq. km and is estimated to have a population density of 112 persons per square kilometer [21]. The district receives some of the highest rainfall in Uganda and short dry spells. Despite this, households still depend on unsafe water sources and walk long distances during dry spells. Rainwater harvesting is hence seen as a feasible option.

2.2. Rainfall Pattern

The district experiences a bimodal rainfall pattern and is characterized as a humid tropical environment. The first rain season occurs during March, April and May (MAM) and the second rain season occurs during September, October and November (SON). The first dry season is from June, July and August (JJA) while the second one occurs from December, January and February (DJF). April, October and November are normally the wettest months of the year while February and July are normally the driest months of the year. Annual rainfall ranges from less than 1000 to 2000 mm and is greatly influenced by altitude. Figure 2 is based on historical data from Kyembogo station described in detail in Section 2.4. Even though JJA and DJF months are traditionally known as dry seasons, 20–30% of the dry season consisted of rain days during the period of 1992–2012. Figure 2 also shows that although August is classified as a dry month, it signifies the start of the second rain season and hence has higher rainfall than the other dry season months.

2.3. System’s Reliability Estimation

For this study, reliability refers to the number of days when household demand is fully met by the rainwater harvesting system given a specific tank and roof size. The adopted estimation approach closely follows methodologies widely used in daily simulations of water harvesting systems [12,17,22,23,24]. Different reliability estimation models were built for different model predictions and seasons. In this estimation, reliance on other water sources was not incorporated in the model. Figure 3 shows a summary of steps taken in the estimation of reliability of a rainwater harvesting system.
To estimate tank reliability under current and future climate change, a water balance model was built in Ms. Excel 2016. Different parameters including daily rainfall, varying roof size, daily losses from catchment area, daily household demand and tank spillage were considered.
Tank capacity was varied from 0.5, 1, 2, 5, 10, 15 and 20 m3. This represented a range of storage capacities in the study area. Just as described in Mehrabadi et al. [24] the initial spillage, and stored volume were set to zero.
Harvested runoff volume was estimated as:
I t = P A Q
where It is daily harvestable runoff volume (m3) on day t, P is the daily rainfall (m), A is the roof area (m2) and Q is the dimensionless runoff coefficient which was considered as 0.8. Such a runoff coefficient indicates a loss of 20% of the rainwater that is discarded for roof cleaning and evaporation [25]. This is within the typical ranges of 0.8–0.95 for roof catchments used in similar studies [12,25,26,27,28]. However, Van der Sterren et al. [29] found out that a runoff coefficient of 0.9 tended to over-estimate the runoff from roof areas, hence the adoption of a runoff coefficient of 0.8 for this study. The roof area was varied in 5 increments from 20 to 200 m2.
Daily release, which is the volume of water used by the household, was estimated using Equations (2) and (3):
R t = D t ; i f   I t + V t 1 D t
R t = I t + V t 1 ; i f   I t + V t 1 < D t
where Rt is daily tank outflow on day t (m3), Dt is the daily household demand on day t (m3) and Vt−1 is the tank storage on the day before (m3). Tank spillage on day t (SPt) was estimated based on the equation below.
S P t = I t + V t 1 D t V m a x ; i f   I t + V t 1 D t > V m a x
S P t = 0 ;   i f   I t + V t 1 D t V m a x
where Vmax is the design storage capacity while tank storage at the end of each days was estimated from the equations below:
V t = V m a x ;   i f   S P t > 0
V t = I t + V t 1 R t ; i f   S P t = 0
System’s reliability (Rt) was estimated using the equation below:
R t = n N × 100
where n is the number of days when household demand is fully met while N is the total number of days in the simulation. This was adopted from similar studies in the literature [17,22,23]. The optimum design reliability was considered as 80%. In similar studies, reliability varied from 80% to 100% [19,27,30] depending on prevailing local conditions and the purpose of rainwater harvesting systems. However, designing for higher reliability rates requires larger catchment areas and/or larger storage tank capacity [19] and may result in more expensive systems [31], which could be a hindrance especially for rural households. On the other hand, designing for lower reliabilities can result in low water availability despite having sufficient rainfall. Therefore, for this study, 80% design reliability was taken as a feasible tradeoff.
Water security was estimated from the following equation:
W = e E × 100
where e is the number of days a tank of specified capacity will be completely empty while E is the number of days in the simulation. This was adopted from Rahman et al. [17].
Different models where built for each climate change scenario and projection period and results compared in terms of systems reliability with varying tank and roof sizes.

2.4. Observed Rainfall Data

The historical daily rainfall data for 20 years (1992 to 2012) recorded at the Kyembogo station were used for this study. The station is located 5 km away from Fort Portal. The station number is 89,300,180 with an elevation of 1500 m. This station was chosen as the driver station, because it provided the longest uninterrupted array of data compared to other stations in the region. The driver station concept was adopted from [18]. Although this approach helps preserve the statistical properties of point rainfall, it oversimplifies daily areal rainfall in large areas [18].

2.5. Climate Change Rainfall Projections

For this study, the simulations were carried out with six General Circulation Models for a moderate concentration pathway (RCP 4.5) as shown in Table 1. The daily projections were done up to 2025–2055 and 2060–2090.
The models in Table 1 were selected because they ranked as the best performing GCMs in simulating annual, seasonal and monthly precipitation over Lake Victoria, which is very close to Kabarole district, the study area [20]. The study concludes that for future projections of precipitation, high resolution GCMs namely CNRM-CM5, MIROC5, HadGEM2-CC, HadGEM2-ES and BCC-CSM1.1m gave the best performance in modeling past absolute precipitation over Lake Victoria hence they are favored to give more accurate estimates of seasonal variations [20]. Statistical downscaling was based on at least 20 years of historical rainfall data from Kyembogo weather station (described in 2.4). The 20 years historical data were statistically transformed using the perturbation tool (described in 2.6) to incorporate the 30-year rainfall characteristics that reflect changes in climate.
GCM simulations cannot be used directly as input to study projected future changes on catchments since GCM data are available at coarse spatial resolution only [32]. It is, therefore, important to downscale the GCM outputs such as rainfall and temperature to remove the bias before using them to study catchment responses. One such method is the statistical downscaling approach that has been applied by several researchers to study the impact of climate change on stream flows. The perturbation tool provides a means to achieve this statistical downscaling [33]. For this study, the statistical method was preferred over the dynamical approach because it allows the consideration of a large ensemble of available GCMs. Such ensemble approach is important as different GCMs may provide high differences in results; the GCM uncertainty hence has to be addressed [33,34,35,36]. Onyutha et al. [32] evaluated the performance of different statistical downscaling techniques, which included the change factor (Delta), simplified and advanced quantile-perturbation-based approaches in the Lake Victoria Basin. The study concluded that due to the higher accuracy of the downscaling techniques in capturing monthly rainfall totals, the difference between the projected changes of seasonal or annual rainfall totals from different downscaling techniques was not significant [32]. Therefore, for this study, the simplified quantile perturbation method was applied since the method captures the rainfall extremes and totals relatively well [32].

2.6. Simplified Quantile Perturbation Method

The quantile perturbation method (QPM) was used in projecting future precipitation, since the climatic changes often also involve changes in temporal variability due to climate change. Willems and Vrac [36] demonstrated that a higher accuracy can be obtained in the future climate scenarios by transferring bias using quantile perturbation factors since changes in more extreme rain storms often differ from changes in less intense rainfall [35]. In this method, only rainfall intensities are perturbed as opposed to their frequency of occurrence [34]. Therefore, the Quantile Perturbation Method 2A, as discussed by Van Uytven and Willems [33], was applied. This method changes the wet day frequency and applies quantile relative changes when the total rainfall amount is above a certain threshold, e.g., at least 1 mm/day. For values less than the threshold wet day precipitation, an absolute change rather than relative change is proposed. This eludes the possibility of having very high perturbation factors and consequently unrealistic future perturbed precipitation. The computations closely followed the methodology described in detail by Onyutha et al. [32].

2.7. Household Water Demand

Due to the long distances between households and common water sources (more than 1000 m), average water consumption in Kabarole district is only 10.6 L per capita [37]. According to Howard and Bartram [38], when a water source is more than 1000 m away or households take 30 min or more to collect water, consumption rarely exceeds 5 L per capita. For this study, it was assumed that since rainwater harvesting systems are located at the household, average water consumption would increase to 20 L per capita which is the minimum WHO recommendation [38]. This ensures cooking, drinking and basic hygiene like hand washing and bathing. An average household size of five people was considered based on the Ugandan national average household size [39].

2.8. Current State of Rainwater Harvesting

To assess the current state of rainwater harvesting, a household survey randomly targeting 300 households was conducted between May and June 2015. The survey was aimed at identifying the most common rainwater harvesting technologies, household perceptions and adoption rates in the study area. This information was used to supplement secondary literature data.

3. Results

3.1. Rainwater Harvesting Practices and Technologies

The results indicate that most households (73%) in fact practice rainwater harvesting. This accounts for both formal and informal rainwater harvesting systems. Formal systems include guttering, downpipe, covered storage and tap and informal systems are characterized with open containers under roof or gutter systems for the collection of rainwater [40]. Figure 4a illustrates an example of formal rainwater harvesting systems in the district. Although formal systems are more ideal and provide the safest water for domestic use compared to the informal systems, only 23% of the households practice formal rainwater harvesting (refer to Figure 5). This could be attributed to the high initial investment costs required especially for the large storage volume. Baguma and Loiskandl [41] concluded that subsidy provision is statistically significant in determining adoption of formal rain water technologies in rural Uganda. The investment costs for informal systems is low because storage facilities range from sauce pans, jerry cans, fabricated containers, drums and other locally made containers which are often already available in the home or are cheap to purchase (refer to Figure 4b). According to WHO and UNICEF [42], rainwater harvesting is considered a safe water source. Unfortunately, a distinction between different harvesting technologies is not mentioned. The quality of the rainwater can vary depending on the atmospheric pollution, harvesting method and storage [43]. While the quality of collected rainwater may vary, on the whole, harvested quality is found to be equal to that of the regular treated water supplied through the public mains [43]. However, the quantity and quality of rainwater from informal systems may not meet the WHO definition of what is considered a safe water source. Despite these limitations both formal and informal rainwater harvesting systems were found to be very common water sources within the district. The survey also shows that most households had low storage volumes (less or equal to 2 m3) and smaller roof sizes (average of 30 m2) which could be a main hindrance towards attaining higher reliabilities.

3.2. Current and Projected Daily Rainfall

Despite major modelling advances, different global climate models still only predict general directions and sometimes give mixed signals [18]. This is evident from Figure 6 and Figure 7 where MIROC5 is predicting contrasting deviations when compared to other models. From Figure 6, most of the models except MIROC5 seem to show that daily rainfall will not deviate much from what is currently observed for the 2025–2055 period. For example, during the first rain seasons of MAM, all models except MIROC5, predict no significant changes in daily rainfall while MIROC5 predicts a decrease of 11% to 32% from the observed data. This corresponds to a 2.7–3.7 mm reduction in daily rainfall from 4.6 to 6.6 mm observed scenario. During the dry season of JJA however, MIROC5 predicts that daily rainfall will increase by 42% (2.7 mm) during the month of June and 48% (3.7 mm) in July. This is contrary to findings from Taylor et al. [44] who predicted that the month of June and July will experience a reduction in rainfall ranging from 27–48% in Kabarole district. This can be attributed to the different models used in the simulations. Despite a predicted increase in rainfall in DJF by Taylor et al. [44], all models show that there will be no significant changes in rainfall during this season. Between October to December, HADGEM2-CC and HADGEM2-ES predict a decrease in daily rainfall by 1% (0.1 mm)–16% (1.3 mm) while CNRM-CM5 predicts an increase of about 21% (1.4 mm) in August. ACCESS1-0 and BCC-CSM1-1-M do not show significant deviations from observed daily rainfall during this period.
As shown in Figure 7, for 2060–2090 projections, greater deviations from observed rainfall are predicted by MIROC5, HADGEM2-CC and HADGEM2-ES models. For instance, during the MAM rainy season, MIROC predicts a 25–57% decrease in daily rainfall which corresponds to a 1.8 to 4.8 mm reduction in daily rainfall. The model predicts the greatest increase in daily rainfall of 65–70% (7.7–9.1 mm) between June and July and an increase of 18% (1.2 mm) in August. No significant deviations are observed for the other months. Both HADGEM2-CC and HADGEM2-ES predict a reduction in observed rainfall ranging from 17% (0.6 mm)–42% (3.1 mm) for the months of February to June. During August to November, both models predict an increase in daily rainfall of 28–57% which corresponds to a 2.1–13.3 mm increase in daily rainfall. This in line with findings from Rautenbach et al. [9] whose study shows that there will be more rainfall recorded during this season across Uganda for 2076–2095 period. No significant deviations are observed for the other months. ACCESS1-0 and BCC-CSM1-1-M do not show significant deviations from observed daily rainfall during the period of 2060–2090. It should be noted however that future simulations for instance after 2040 have higher uncertainties than simulations of up to 2040. This can be attributed to the uncertainty in emissions of greenhouse gases—hence radiative forcing increases exponentially especially after 2060 [20].

3.3. Systems’ Reliability under Climate Change

As explained in Section 2.3, system reliability is an indicator of how often full demand is met by a rainwater harvesting system with a specific roof and tank size. Due to the changes in seasonal rainfall, this is predicted to change, and the effect may vary according to the design specifications. Therefore, this section presents predicted changes in seasonal systems reliability using selected tank volumes as indicators. Due to an abundance of smaller tank volumes (up to 5 m3) in the study area, reliability changes for smaller tank volumes are more emphasized in this section (projections for higher tank capacities are presented in the supplementary material, Section 1). The changes in design specifications required to maintain 80% reliability are also presented with special focus on changes deemed more significant compared to current observations (design combinations for different reliabilities are presented in the supplementary material, Section 2).

3.3.1. Climate Change Effect on Reliability for DJF Season (2025–2055)

A tank volume of 2 m3 is used as an example to show the effect of climate change on reliability. It was specifically chosen because it is a typical example of tank sizes in Kabarole district. Figure 8 shows that when the predictions for observed scenario are compared with the model predictions, most of the models forecast a reduction in reliability during the DJF season up to the year 2055. Other models like ACCESS1-0 predict a slight increase. The greatest reduction in reliability of over 13% is shown by the HADGEM2-CC and HADGEM2-ES models by roof sizes ranging from 75–100 m2.
When the tank volume is increased to 5 m3, changes in reliability are not as significant for larger roof sizes compared to smaller roof areas (refer to Figure 9). Figure 9 shows that roof sizes below 100 m2 with a tank volume of 5 m3 will have a reduction in reliability by a maximum of 13%, as predicted by HADGEM2-CC. Increasing the tank to 10 m3 makes households with roof areas greater or equal to 50 m2, less affected by changes in reliability but any increase in tank volume beyond 10 m3, shows no effect on reliability. In all cases roof sizes less than 50 m2 are predicted to be greatly affected by changes in reliability during this period. HADGEM2-ES and ACCESS1-0 represents the worst and best-case scenarios for this period hence they act as the reliability envelope for different roof and tank sizes.

3.3.2. Design Requirements to Achieve 80% Reliability for DJF Season (2025–2055)

Figure 10 and Figure 11 indicate that for smaller tank sizes (0.5 and 1 m3), 80% reliability is not possible during the DJF season for all models. There is an exponential increase of systems’ reliability from 20 to about 50 m2 after which the increase becomes gradual from 50 m2 onwards. For instance, large roof sizes (over 200 m2) would only yield about 50% reliability for 0.5 m3 and close to 70% reliability for 1 m3 tank size. Increasing tank size from 0.5 m3 to 1 m3 only increases reliability by 10–14% for all roof sizes. In fact, reliability increase peaks at 60–80 m2 roof size after which it begins to decline. This pattern is replicated by all models. Therefore, this period, expansion of storage capacity will be more beneficial than increasing roof size.
When the tank size is increased to 2 m3 ,as shown in Figure 12, 80% reliability is achieved between 100 to 110 m2 roof size for the observed scenario and by ACCESS1-0, BCC-CSM1-1-M, MIROC5 and CNRM-CM5 models. However, HADGEM2-CC predicts a roof size requirement of 160 m2 and 180 m2 for HADGEM2-ES as indicated in Figure 10. This is an increase of 60–80 m2 from what is currently needed to maintain 80% reliability. Figure 13 shows that increasing the storage capacity to 5 m3 reduces the roof size requirement for the attainment of 80% reliability to 50–60 m2 for the observed and ACCESS1-0, BCC-CSM1-1-M, MIROC5 and CNRM-CM5 models. 80% reliability is achieved at 70 and 85 m2 for HADGEM2-CC and HADGEM2-ES respectively. This is a 10–20 m2 increase in roof size from observed requirement. Notably, reliability projections for all models and observed scenario converge when roof sizes are increased beyond 80 m2 with tank volumes of 5 m3 or more. Increasing tank size beyond 5 m3 does not result in a significant increase in reliability and reduction in roof size.

3.3.3. Climate Change Effect on Reliability for DJF Season (2060–2090)

There is a lot of variation in model predictions for the 2060–2090 period. While ACCESS1-0, HADGEM2-ES and CNRM-CM5 predict an increase in reliability, MIROC5, HADGEM2-CC and BCC-CSM1-1-M predict a reduction in reliability. As earlier noted, the effect of climate change tends to be less significant as roof size and tank size increases. For instance, when the tank size is increased from 2 m3 to 5 m3, the reduction in reliability becomes less significant, as shown in Figure 14 and Figure 15 respectively. Therefore, more models predict an increase in reliability during this period when the tank and roof size are increased. MIROC5 and HADGEM2-ES represent the worst and best-case scenarios respectively and hence show the reliability envelope for water harvesting systems during this period. Figure 14 and Figure 15 emphasize the high uncertainty in reliability when roof sizes are less than 100 compared to larger roof areas. The uncertainty is even greater when storage volumes are low.

3.3.4. Design Requirements to Achieve 80% Reliability for DJF Season (2060–2090)

For the 2060–2090 period, models such as ACCESS1-0, BCC-CSM1-1-M and CNRM-CM5 predict no significant deviations from the observed rainfall. However, MIROC5, HADGEM2-CC and HADGEM2-ES predict an increase in rainfall in December by over 12% and a decrease of over 24% in February. This has implications on the design of rainwater harvesting systems if an 80% reliability is to be met. Table 2 shows design combinations for 80% reliability during DJF dry season. For storage facilities smaller than 2 m3, it will be impossible to achieve this even with larger roof sizes for all models. Storage capacities of about 2 m3 will require larger roof sizes of between 100 to 110 m2 to attain 80% systems reliability. This, however, is reduced by half when storage facilities are increased to 5 m3 but any further increase in tank size does not significantly decrease the roof area required to maintain 80% reliability. Table 2 also shows that climate change will not have significant effects on changes in design requirements to maintain 80% reliability during this time. More information on design combinations required for different reliabilities for this period are presented in the supplementary material Section 2.1.

3.3.5. Climate Change Effect on Reliability for JJA Season (2025–2055)

During the JJA season for the 2025–2055 period, most models predict an increase in reliability, with MIROC5 predicting the greatest increase of over 25% for both 2 and 5 m3 tank size (refer to Figure 16 and Figure 17). ACESS1-0 however consistently predicts a decline in reliability of less than 5% during this period. From Figure 16 and Figure 17, the best and worst-case scenarios are predicted by MIROC5 and ACCESS1-0, respectively, hence representing the reliability envelope for water harvesting systems during this season. As earlier mentioned, smaller roof sizes are more affected by these uncertainties although in this case they also have the highest increase in reliability compared to larger systems.

3.3.6. Design Requirements to Achieve 80% Reliability for JJA Season (2025–2055)

During this period, MIROC5 predicts that daily rainfall will increase by 42% (2.7 mm) for the month of June and 48% (3.7 mm) in July while other models show no significant deviation from observed rainfall during this season. This projected increase in rainfall in this dry season is reflected in the increased projected reliability for MIROC5 compared to other models. Table 3 shows that even with lower tank sizes of 1 m3, 80% reliability can be achieved at roof sizes ranging from 125 to 130 m2. This is however not possible for both observed scenario and the other models. For other models 80% reliability is only achievable when tank size in increased to 2 m3 or greater. Therefore, according to MIROC5 predictions, climate change will have a positive impact in that 80% reliability of rainwater harvesting systems will be achieved even with low storage volumes which is not possible under current observation. This is unfortunately not confirmed by the other models. More information on design combinations required for different reliabilities are presented in the supplementary material Section 2.2.

3.3.7. Climate Change Effect on Reliability for JJA Season (2060–2090)

Most models predict more increase in reliability by as much as 50% for the MIROC5 model and about 10% for other models. Figure 18 shows that for smaller roof sizes, reliability is projected to increase by over 50%. The increase is even more when tank size is increased to 5 m3 as shown in Figure 19. The increase in reliability is greatest for roof sizes ranging from 20–70 m2. The best and worst-case scenarios are predicted by MIROC5 and ACCESS1-0, respectively.

3.3.8. Design Requirements to Achieve 80% Reliability for JJA Season (2060–2090)

As shown in Figure 20 and Figure 21, reliability projections for ACCESS1-0, BCC-CSM1-1-M and CNRM-CM5, HADGEM2-CC and HADGEM2-ES only have marginal deviations from the observed scenario. Projections from MIROC5 however, are significantly higher than projections from other models and observed scenario. In fact, even with a very small tank size of 0.5 m3 for instance, MIROC5 predicts that over 75% of reliability can be achieved as roof size increases. The highest reliability for other models and observed scenario is about 60% with larger roof sizes (refer to Figure 20). It is thus not possible to attain 80% reliability when storage is at 0.5 m3 even with roof sizes as large as 200 m2. However, Figure 21 shows that when tank size is doubled to 1 m3 for instance, 80% reliability is achieved at roof sizes slightly higher than 200 m2 but predictions from MIROC5 indicate that with a roof size of between 45 and 50 m2, 80% reliability can be achieved with reliability increasing to over 90% when roof sizes are further increased. An increase in tank size to 2 m3, as shown in Figure 22, shows that 80% reliability is achieved between 80 and 130 m2 roof size for other models while roof sizes of 30 m2 are sufficient for MIROC5.
According to Figure 23, with a tank size of 5 m3, MIROC5 predicts that close to 100% reliability can be achieved at roof sizes as small as 30 m2 while other models and the observed scenario attain over 80% reliability at roof sizes ranging from 55–120 m2. Increasing the tank volume to 10 m3 does not show significant changes in reliabilities for all models. In addition, model predictions converge as tank and roof size increase.
Comparing increase in reliability with increasing tank volume reveals that when tank volume is increased from 0.5 to 1 m3, reliability increases by 8–15% for all roof sizes and different models. The peak increase is obtained from roof sizes ranging from 50–100 m2 while for MIROC5, the peak reliability increase is obtained at only 20 m2. Increasing tank volume from 0.5 to 2 m3 increases reliability by 12–25% for all roof sizes and model but the highest increase is still obtained between 50 and 100 m2. When the volume is further increased to 5 m3, reliability increases by 14–35% with roof size of 50–100 m2 yielding the highest increase except for MIROC5 which peaks at 20 m2. Increasing the tank volume beyond 5 m3, only marginally increases reliability but roof size requirement is reduced to 45–85 m2 for all other models except MIROC5 which peaks at very small roof sizes.

3.3.9. Climate Change Effect on Reliability for MAM Season (2025–2055)

Figure 24 and Figure 25 show that the models conflict in their prediction but most notably, MIROC5 predicts a reduction in reliability by as much as 30%. The effect is more significant for roof sizes ranging from 20–60 m2. BCC-CSM1-1-M, however, predicts the highest increase in reliability by as much as 8%. The two models thus represent the worst and best-case scenarios and thus form the water reliability envelope for this season.

3.3.10. Design Requirements to Achieve 80% Reliability for MAM Season (2025–2055)

Table 4 shows that for a small tank size of 0.5 m3 very large roof sizes ranging from 85 m2 to over 200 m2 are required to ensure 80% reliability. However, roof size requirement is almost halved when the tank capacity is doubled to 1 m3. Any increase of tank capacity beyond 2 m3 does not result in a reduction in roof size requirement to maintain 80% reliability. For MIROC5, the minimum roof size requirement to maintain 80% reliability is 35–40 m2 which is higher than requirements for other models. When reliability from different design combinations are compared, the highest increase in reliability (12–25%) is achieved when tank size is increased from 0.5 to 5 m3 and a roof size of 25–45 m2. A further increase in tank size does not yield a significant increase in reliability. Other design combinations for different reliability projections are shown in the supplementary material (Section 2.3).

3.3.11. Climate Change Effect on Reliability for MAM Season (2060–2090)

Figure 26 and Figure 27 show that during this period, reliability is expected to reduce by over 40% according to MIROC5, HADGEM2-CC and HADGEM2CC projections. The rest of the models have slight deviations from the observed scenario. The changes in reliability are less distinct when the roof area exceeds 80 m2 and tank volume is increased to 5 m3. Although most models agree on the reduction in reliability for this period, MIROC5 still represents the worst-case scenario.

3.3.12. Design Requirements to Achieve 80% Reliability for MAM Season (2060–2090)

Figure 28 shows that just like the observed scenario, predictions from ACCESS1-0, BCC-CSM-1-M, and CNRM-CM5 show that with a small tank size of 0.5 m3, an 80% reliability can be achieved with roof sizes of about 100 m2 or greater. On the contrary, HADGEM2-CC, HADGEM2-ES and MIROC5 predict that during this period, it will be impossible to attain 80% reliability even with roof sizes as large as 200 m2. When the tank volume is increased to 1 m3, 80% reliability is achieved at roof sizes as small as 50 m2 for the observed scenario and ACCESS1-0, BCC-CSM-1-M, and CNRM-CM5 models. For HADGEM2-CC, HADGEM2-ES and MIROC5 models 80% reliability is achieved at roof sizes 130 m2 or larger. The models tend to converge as roof and tank size is increases. This difference is particularly greater in roof sizes smaller than 60 m2.
As shown in Figure 29 and Figure 30, when tank size increases to 2 and 5 m3, 80% reliability is achieved at very small roof sizes of 35 m2 or even smaller under observed scenario. ACCESS1-0, BCC-CSM-1-M, and CNRM-CM5 models closely follow the observed scenario and hence show the same reliability. For HADGEM2-CC, HADGEM2-ES and MIROC5 predictions, due to lower reliability predictions, 80% reliability can only be achieved at 80 and 60 m2 for tank sizes of 2 and 5 m3 respectively. Figure 29, Figure 30 and Figure 31 also show that with larger roof sizes and increased tank capacity, model predictions converge.
Increasing tank volume to 10 m3 or more (as shown in Figure 31) does not significantly decrease the roof size requirement for 80% reliability for all models. In fact, the graphs show that for smaller roof sizes (up to 70 m2), model predictions are widely different regardless of tank size. It is thus more beneficial to increase roof size than tank size during this period.

3.3.13. Climate Change Effect on Reliability for SON Season (2025–2055)

Figure 32 and Figure 33 show that during the SON season, there are mixed predictions on the changes in reliability. While HADGEM2-CC, HADGEM2-ES and ACCESS1-0 predict a 1–5% decrease in reliability, BCC-CSM1-1M and CNRM-CM5 forecast an increase in reliability of 1–4%. The deviations are not significant with larger roof areas. As earlier reported, roof sizes of 20–40 m2 are most prone to changes in reliability than larger systems. BCC-CSM1-1M and HADGEM2-ES represent the best and worst-case scenarios for this season. Increasing the tank size beyond 5 m3 does not show any significant changes in reliability hence roof size is more important than tank size for this season.

3.3.14. Design Requirements to Achieve 80% Reliability for SON Season (2025–2055)

During this period, all model predictions are not significantly different from the observed scenario. Table 5 shows that with small design combinations like 1 m3 and 50 m2 roof size, it is possible to achieve reliabilities of 80% and more. Comparing reliability from different design combinations shows that when tank size is increase from 0.5–1 m3, reliability increased by 8–11% for all models and the greatest increase was obtained for roof sizes less than 30 m2. A further increase of the tank volume to 2 m3 increased reliability by 15–16%. When tank volume is 5 m3, reliability increases by 15–25%. Increasing the volume to 10 m3 and more yields an increase in reliability by 20–26%. The greatest increase in reliability is recorded at roof sizes of 30 m2 or less. All models have almost similar predictions during this period and agree that with small roof sizes, 80% reliability is achievable even with relatively smaller tank volumes of 0.5 to 2 m3. More design combinations required for different reliabilities are presented in the supplementary material (Section 2.4).

3.3.15. Climate Change Effect on Reliability for SON Season (2060–2090)

From Figure 34 and Figure 35, most of the models predict an increase in reliability by over 40% while small deviations are recorded by other models for tank size of 2 to 5 m3. HADGEM2-ES and HADGEM2-CC predict the greatest increase in reliability. This is however only reflected with roof sizes under 50 m2 especially when the tank size is increased.

3.3.16. Design Requirements to Achieve 80% Reliability for SON Season (2060–2090)

Figure 36 and Figure 37 show that with small storage volumes of 0.5 and 1 m3, 80% reliability or more is achievable even with roof sizes as small as 50 m2 for the observed scenario. Other models also predict the same requirement. HADGEM2-ES and HADGEM2-CC however, show that 100% reliability is possible even with roof sizes as small as 20 m2 or less.
A further increase in tank size beyond 1 m2, is not necessary especially for HADGEM2-ES and HADGEM2-CC reliability predictions since almost 100% reliability is achieved at tank sizes ranging from 0.5 to 1 m3 as shown by Figure 38 and Figure 39 Increasing tank volume beyond 1 m3 only increases reliability by 3–4% with no reduction in roof size requirement. As Figure 36, Figure 37, Figure 38 and Figure 39 show, models converge when roof sizes are increased but greater differences are reflected when roof areas are small.

3.4. Water Security

As explained in Section 2.3, water security is defined as the ratio of frequency of having an empty tank to the number of days in the simulation. This was also analyzed per season and is presented in this section. Table 6, Table 7, Table 8 and Table 9 present estimated water security as predicted by the different models for the specified periods. The data presented are for a roof size of 30 m2 because this is representative of a typical roof area for rural households in Kabarole district.
As shown in Table 6, the models provide mixed estimates for water security. For instance, for the 2025–2055 period, BCC-CSM1.1, HADGEM2-ES and HADGEM2-ES models predict that a tank of 0.5 m3 capacity would be less likely to be empty by only 1–2% when compared to observed data. ACCESS1.0 and MIROC5 however predict that such a tank will be more likely to be empty by 4% and 17%, respectively. For the 2060–2090 period, however, most of the models predict that a 0.5m3 tank will be more likely to be empty by 1–27%. HADGEM2-ES, HADGEM2-ES and MIROC5 show the greatest deviation (27%) from observed scenario. Table 6 also shows that when tank volume is increase beyond 10 m3, there is no significant increase in water security thus is it more beneficial to increase roof area.
From Table 7, just like the MAM forecasts, the models provide mixed predictions for water security for the SON season. For instance, for the 2025–2055 period, ACCESS1.0, HADGEM2-ES and HADGEM2-ES models predict that a tank of 0.5 m3 capacity would be more likely to be empty by only 1% when compared to observed data. On the other hand, predictions for BCC-CSM1.1 and MIROC5 for the same tank capacity, show that such a tank will be less likely to be empty by 1–2% when compared to observed scenario. For the 2060–2090 period, ACCESS1.0, MIROC5 and CNRM-CM5 show that such a tank will be more likely to be empty by 1–3% when compared to observed scenario. However, HADGEM2-ES, HADGEM2-CC and BCC-CSM1.1 show that a 0.5 m3 tank will be less likely to be empty by 31%, 32% and 1%, respectively. Despite these contradictions, however, water security does not significantly increase when the tank size is increased beyond 5 m3. In fact, both HADGEM2-ES and HADGEM2-CC predict that a tank size as small as 1 m3 will be sufficient for the 2060–2090 period.
From Table 8, during the JJA dry season, all models predict an increase in water security except for ACCESS1.0 model, which predicts a reduction of water security by 1–3% for a 0.5 m3 tank for both periods. The rest of the models predict that a 0.5 m3 tank will be less empty by 3–31% for both periods. In addition, expanding the tank beyond 10 m3 does not significantly increase water security unless the roof size is increased as well.
From Table 9, for 2025–2055 period, most models except ACCESS1.0 predict that the likelihood of a 0.5 m3 tank being empty increases by 1–8% from the observed scenario. The ACCESS1.0 model, however does not deviate much from observed scenario. The models still show conflicting forecasts for the 2060–2090 period, but the decrease and increase are by only 1–2% from observed scenario. Like the JJA dry season, expanding the tank beyond 10 m3 does not significantly increase water security unless the roof size is increased too.

4. Discussion

Due to the high costs required for construction of bigger houses, most households in rural areas in Uganda have roof sizes as small as 30 m2 or less. In addition, the high cost of purchasing or building bigger tank capacities makes it hard for such households to have tank sizes larger than 2 m3. Despite these limitations, the results show that smaller tank and roof sizes will be sufficient for 80% reliability during most of the rain seasons. Contrary to findings by Rahman et al. [17], reliability increases with changes in projected rainfall during the SON rain season for 2060–2090 period while no significant changes are observed for the 2025–2055 period. Unlike in Australia where larger tank sizes will be required, for Kabarole district, the increase in reliability will mean that even low volumes and roof areas will be sufficient to maintain 80% reliability. In fact, with small roof sizes of 30 m2 and tank volumes of 1 m3, more than 80% reliability will be achievable during the SON season for 2060–2090 period. Under current observation, this can only be achieved with a roof size of 50 m2. For MAM rain season (2025–2055), considering the worst-case scenario, a roof size of 60–65 m2 and tank volume of 5 m3 will be needed during this period which is double the current requirement. For the 2060–2090 MAM season, the worst-case scenario predicts a drastic decline in reliability of over 40% which is more evident with smaller roof sizes. The implication is that for households to maintain 80% reliability, it is imperative that roof size is increased to 60 m2 or more and tank size increased to 5 m3. This is almost double the current requirement of 35 m2 with a 5 m3 tank volume.
During the dry season of DJF (2025–2055), current observation shows that unless roof sizes are higher than 200 m2, it is not possible to achieve 80% reliability with low storage volumes of 0.5 or 1 m3. Although there are some deviations in model predictions, generally, rural households will need a larger roof area and tank volume if 80% reliability is to be achieved. Considering the worst-case scenario, a roof size of 85 m2 and 5 m3 tank volume will be sufficient to maintain 80% reliability during this period. This is in line with findings by Rahman et al. [17] who found out that reliability will be negatively affected by climate change in Australia in the dry season. For the 2060–2090 period, although reliability is expected to increase, small tank sizes of 2 m3 or less will still not be sufficient to maintain 80% reliability even with larger roof sizes both under observed scenario and all model projections. When the worst-case scenario is considered, a 5 m3 tank volume and 60–70 m2 roof size will be sufficient to achieve 80% reliability. Projections for 2025–2055 JJA dry season show that for attainment of 80% reliability, a tank size of 5 m3 with corresponding roof size of 50–90 m2 will be sufficient under observed scenario. Other models do not predict any significant changes in reliability from observed scenario except for MIROC5 which predicts a much smaller roof size of 40 m2. For design purposes however, it is always advisable to account for the worst-case scenario which in this case is the current observation. For 2060–2090, MIROC predicts very high reliabilities compared to observed scenario which would necessitate small roof sizes and tank volumes for the attainment of 80% reliability. Under the observed scenario, a tank size of 5 m3 and roof size of 50–100 m2 will be appropriate to ensure 80% system’s reliability during this season. While this is still true for other model predictions, projections from MIROC5 show that roof areas as small as 30 m2 will be sufficient. It is worth noting that although JJA and DJF are considered dry seasons in Uganda, they still get 20–30% rain days compared to over 40% rain days in MAM and SON rain seasons. While the dry period length (consecutive days without rain) varies from 30–65 days in the dry season, the longest dry period length in the rain season is 15 days. However, the seasonal rainfall totals of MAM and SON are double the seasonal rainfall totals of JJA and DJF. Londra et al. [12,45] demonstrated that tank size is strongly affected by the dry period length. This could explain the need for low tank volumes even in dry seasons for Kabarole district. The same pattern is observed for the different climate change model predictions. The biggest water security reduction is recorded during the MAM season which is a 27% decrease from observed scenario. This is predicted by MIROC5 in 2060–2090 and a decrease in water security of 17% for 2025–2055 period. DJF period is also expected to experience reduced water security by 1–8% for both periods and tank size of 0.5 m3. The other periods are projected to experience increased water security compared to observed scenario. It is thus imperative that households harness the increased water volumes in the seasons of SON and JJA to cater for the reductions in water security during the DJF and MAM seasons.

5. Conclusions

This paper assessed the effect of climate change on reliability of rainwater harvesting systems for Kabarole district, Uganda using an ensemble of 6 best performing GCMs. Seasonal analysis was performed based on the two (2) rain seasons of March, April, May (MAM) and September, October, November (SON) and the two (2) dry seasons of June, July, August (JJA) and December, January, February (DJF). While MIROC5 predicts a decline in daily rainfall during the rain seasons and an increase in the dry seasons, other models do not predict significant deviations of daily rainfall from current observation for the 2025–2055 period. However, greater deviations are predicted by all models for the 2060–2090 period. While an increase in reliability is predicted for the SON season, MAM season is projected to experience the greatest reduction in reliability for the 2055–2090 period. This corresponds to a reduction in water security of 27% from current observation. For the dry seasons, most models predict a slight decline in reliability and water security except MIRCO5 that predicts otherwise. Overall, the study recommends an increase in both roof and tank size from the current average of 30 m2 to 50 m2 and tank volume of 5 m3. However, the uncertainties in climate change projections exacerbated by the limited meteorological data are some of the limitations of this study.

Supplementary Materials

The following are available online at https://www.mdpi.com/2073-4441/10/1/71/s1.

Acknowledgments

Special thanks go to the Flemish Interuniversity Council—Inter University Cooperation (VLIR-IUC) programme for funding this research and Mountains of the Moon University staff for the constant encouragement, advice and providing an excellent working environment. The Ministry of Water and Environment is appreciated for availing historical data used in the simulations. The Authors also thank the 3 anonymous reviewers for their comments that greatly improved the quality of the paper.

Author Contributions

Violet Kisakye built the rainwater simulation model and wrote the paper, Mary Akurut generated the daily rainfall projections due to climate change and contributed to the writing of the paper while Bart Van der Bruggen reviewed and streamlined the paper.

Conflicts of Interest

The authors declare no conflict of interest.

References

  1. Mankad, A.; Tapsuwan, S. Review of socio-economic drivers of community acceptance and adoption of decentralised water systems. J. Environ. Manag. 2011, 92, 380–391. [Google Scholar] [CrossRef] [PubMed]
  2. Intergovernmental Panel on Climate Change (IPCC). Climate Change 2007: Contribution of Working Group III to the Fourth Assessment Report of the Intergovernmental Panel on Climate Change; Cambridge University Press: Cambridge, UK; New York, NY, USA, 2007. [Google Scholar]
  3. Kandji, S.T.; Verchot, L.; Mackensen, J. Climate Change and Variability in the Southern Africa: Impacts and Adaptation Strategies in the Agricultural Sector; World Agroforestry Centre: Nairobi, Kenya, 2006. [Google Scholar]
  4. Nicholson, S. A Review of Climate Dynamics and Climate Variability in Eastern Africa. In Limnology, Climatology and Paleoclimatology of the East African Lakes; Johnson, T.C., Odada, E.O., Whittaker, K.T., Eds.; Gordon and Breach Publishers: Amsterdam, The Netherlands, 1996; pp. 25–56. [Google Scholar]
  5. Shongwe, M.E.; van Oldenborgh, G.J.; Hurk, B. Projected Changes in Mean and Extreme Precipitation in Africa under Global Warming. Part II: East Africa. J. Clim. 2011, 24, 3718–3733. [Google Scholar] [CrossRef]
  6. Kansiime, M.K.; Wambugu, S.K.; Shisanya, C.A. Perceived and Actual Rainfall Trends and Variability in Eastern Uganda: Implications for Community Preparedness and Response. J. Nat. Sci. Res. 2013, 3, 179–195. [Google Scholar]
  7. Hisali, E.; Birungi, P.; Buyinza, F. Adaptation to climate change in Uganda: Evidence from micro level data. Glob. Environ. Chang. 2011, 21, 1245–1261. [Google Scholar] [CrossRef]
  8. Stocker, T.F.; Qin, D.; Plattner, G.-K.; Tignor, M.; Allen, S.K.; Boschung, J.; Nauels, A.; Xia, Y.; Bex, V.; Midgley, P.M.; et al. Technical Summary. In Climate Change 2013: The Physical Science Basis. Contribution of Working Group I to the Fifth Assessment Report of the Intergovernmental Panel on Climate Change; Joussaume, S., Penner, J., Tangang, F., Eds.; Cambridge University Press: Cambridge, UK; New York, NY, USA, 2013; pp. 33–115. [Google Scholar]
  9. Rautenbach, H.; Botai, J.; Wasswa, F.; Beucher, O. Regional-Scale Climate Change Projections of Annual, Seasonal and Monthly Near-Surface Temperatures and Rainfall in Uganda; University of Pretoria: Pretoria, South Africa, 2014. [Google Scholar]
  10. Domènech, L.; Heijnen, H.; Saurí, D. Rainwater harvesting for human consumption and livelihood improvement in rural Nepal: Benefits and risks. Water Environ. J. 2012, 26, 465–472. [Google Scholar] [CrossRef]
  11. Kahinda, J.M.; Taigbenu, A.E.; Boroto, J.R. Domestic rainwater harvesting to improve water supply in rural South Africa. Phys. Chem. Earth 2007, 32, 1050–1057. [Google Scholar] [CrossRef]
  12. Londra, P.A.; Theocharis, A.T.; Baltas, E.; Tsihrintzis, V.A. Optimal Sizing of Rainwater Harvesting Tanks for Domestic Use in Greece. Water Resour. Manag. 2015, 29, 4357–4377. [Google Scholar] [CrossRef]
  13. Gould, J. A review of the development, current status and future potential of rainwater catchment systems for household supply in Africa. In Proceedings of the 6th International Conference on Rainwater Catchment Systems, Nairobi, Kenya, 1–6 August 1993; pp. 27–31. [Google Scholar]
  14. Pacey, A.; Cullis, A. Rainwater Harvesting: The Collection of Rainfall and Runoff in Rural Areas; Intermediate Technology Publications: London, UK, 1986. [Google Scholar]
  15. Ntale, K.; Naturinda, N.; Rubarenzya, H.; Kyamugambi, K. The rainwater harvesting strategy for Uganda. In Proceedings of the 31st WEDC International Conference: Maximising the Benefits from Water and Environmental Sanitation, Kampala, Uganda, 31 October–4 November 2005. [Google Scholar]
  16. Bulcock, L.M.; Schulze, R.E. Climate Change and Rainwater Harvesting in South Africa: A Case Study. In Proceedings of the 16th SANCIAHS National Hydrology Symposium, Pretoria, South Africa, 1–3 October 2012; p. 6. [Google Scholar]
  17. Rahman, A.; Haque, M.M.; Samali, B. Evaluation of climate change impacts on rainwater harvesting. J. Clean. Prod. 2016, 137, 60–69. [Google Scholar]
  18. Kahinda, J.; Taigbenu, A.E.; Boroto, R.J. Domestic rainwater harvesting as an adaptation measure to climate change in South Africa. Phys. Chem. Earth Parts A/B/C 2010, 35, 742–751. [Google Scholar] [CrossRef]
  19. Wallace, C.D.; Bailey, R.T.; Arabi, M. Rainwater catchment system design using simulated future climate data. J. Hydrol. 2015, 529, 1798–1809. [Google Scholar] [CrossRef]
  20. Akurut, M.; Willems, P.; Niwagaba, C. Potential Impacts of Climate Change on Precipitation over Lake Victoria, East Africa, in the 21st Century. Water 2014, 6, 2634–2659. [Google Scholar] [CrossRef] [Green Version]
  21. Ministry of Finance, Planning and Economic Development, The Republic of Uganda. Uganda Participatory Poverty Assessment Process: Kabarole District UPPAP-PPA Report; Ministry of Finance, Planning and Economic Development, The Republic of Uganda: Kampala, The Republic of Uganda, 2000.
  22. Rahman, A.; Hajani, E. Reliability and Cost Analysis of a Rainwater Harvesting System in Peri-Urban Regions of Greater Sydney, Australia. Water 2014, 6, 945–960. [Google Scholar] [CrossRef]
  23. Imteaz, M.A.; Ahsan, A.; Naser, J.; Rahman, A. Reliability analysis of rainwater tanks in Melbourne using daily water balance model. Resour. Conserv. Recycl. 2011, 56, 80–86. [Google Scholar] [CrossRef]
  24. Mehrabadi, H.R.M.; Saghafian, B.; Fashi, H.F. Assessment of residential rainwater harvesting efficiency for meeting non-potable water demands in three climate conditions. Resour. Conserv. Recycl. 2013, 73, 86–93. [Google Scholar] [CrossRef]
  25. Ghisi, E.; Bressan, D.L.; Martini, M. Rainwater tank capacity and potential for potable water savings by using rainwater in the residential sector of southeastern Brazil. Build. Environ. 2007, 42, 1654–1666. [Google Scholar] [CrossRef]
  26. Pachpute, J.S.; Tumbo, S.D.; Sally, H.; Mul, M.L. Sustainability of Rainwater Harvesting Systems in Rural Catchment of Sub-Saharan Africa. Water Resour. Manag. 2009, 23, 2815–2839. [Google Scholar] [CrossRef]
  27. Khastagir, A.; Jayasuriya, N. Optimal sizing of rain water tanks for domestic water conservation. J. Hydrol. 2010, 381, 181–188. [Google Scholar] [CrossRef]
  28. Sturm, M.; Zimmermann, M.; Schütz, K.; Urban, W.; Hartung, H. Rainwater harvesting as an alternative water resource in rural sites in central northern Namibia. Phys. Chem. Earth Parts A/B/C 2009, 34, 776–785. [Google Scholar] [CrossRef]
  29. Van der Sterren, M.; Rahman, A.; Dennis, G.R. Implications to stormwater management as a result of lot scale rainwater tank systems: A case study in Western Sydney, Australia. Water Sci. Technol. 2012, 65, 1475. [Google Scholar] [CrossRef] [PubMed]
  30. Fulton, L.V.; Musal, M.R.; Mediavilla, F.A.M. Construction analysis of rainwater harvesting systems. In Proceedings of the 2012 Winter Simulation Conference, Berlin, Germany, 9–12 December 2012; pp. 617–627. [Google Scholar]
  31. Ghimire, S.R.; Johnston, J.M. Ecohydrology & Hydrobiology Impacts of domestic and agricultural rainwater harvesting systems on watershed hydrology: A case study in the Albemarle-Pamlico river basins (USA). Integr. Med. Res. 2013, 13, 159–171. [Google Scholar]
  32. Onyutha, C.; Tabari, H.; Rutkowska, A.; Nyeko-Ogiramoi, P.; Willems, P. Comparison of different statistical downscaling methods for climate change rainfall projections over the Lake Victoria basin considering CMIP3 and CMIP5. J. Hydro-Environ. Res. 2016, 12, 31–45. [Google Scholar] [CrossRef]
  33. Van Uytven, E.; Willems, P. Climate Perturbation Tool—Manual; KU Leuven, Hydraulics Section: Lirias, KU Leuven, Leuven, Belgium, 2015. [Google Scholar]
  34. Ntegeka, V.; Baguis, P.; Roulin, E.; Willems, P. Developing tailored climate change scenarios for hydrological impact assessments. J. Hydrol. 2014, 508, 307–321. [Google Scholar] [CrossRef]
  35. Nyeko-Ogiramoi, P. Climate Change Impacts on Hydrological Extremes and Water Resources in Lake Victoria Catchments, Upper Nile Basin; Lirias, KU Leuven: Leuven, Belgium, 2011. [Google Scholar]
  36. Willems, P.; Vrac, M. Statistical precipitation downscaling for small-scale hydrological impact investigations of climate change. J. Hydrol. 2011, 402, 193–205. [Google Scholar] [CrossRef]
  37. Rees, D.G.; Nyakaana, S.; Thomas, T.H. Very-Low-Cost Roofwater Harvesting in East Africa (Based on a Feasibility Study Performed in the Great Lakes Region during May–July 2000); Working Paper; University of Warwick: Warwick, UK, 2000. [Google Scholar]
  38. Howard, G.; Bartram, J. Domestic Water Quantity, Service Level and Health; WHO: Geneva, Switzerland, 2003; p. 39. [Google Scholar]
  39. Uganda Bureau of Statistics (UBOS). National Population and Housing Census 2014; Provisional Results; UBOS: Kampala, Uganda, 2014. [Google Scholar]
  40. Parker, A.H.; Youlten, R.; Dillon, M.; Nussbaumer, T.; Carter, R.C.; Tyrrel, S.F.; Webster, J. An assessment of microbiological water quality of six water source categories in north-east Uganda. J. Water Health 2010, 8, 550–560. [Google Scholar] [CrossRef] [PubMed] [Green Version]
  41. Baguma, D.; Loiskandl, W. Rainwater harvesting technologies and practises in rural Uganda: A case study. Mitig. Adapt. Strateg. Glob. Chang. 2010, 15, 355–369. [Google Scholar] [CrossRef]
  42. World Health Organization (WHO); United Nations International Children’s Emergency Fund (UNICEF). Global Water Supply and Sanitation Assessment 2000 Report; WHO: Geneva, Switzerland, 2000. [Google Scholar]
  43. Pathak, N.; Heijnen, H. Rainwater Harvesting and Health Aspects-Working on WHO Guidance; University of Hawaii: Honolulu, HI, USA, 2004. [Google Scholar]
  44. Taylor, T.; Markandya, A.; Mwebaze, T.; Sebbit, A.; Rautenbach, H. Economic Assessment of the Impacts of Climate Change in Uganda; Case Study on Water and Energy Sector Impacts in the Mpanga River Catchment; Ministry of Water and Environment, Climate Change Unit: Kampala, Uganda, 2015.
  45. Londra, P.A.; Theocharis, A.T.; Baltas, E.; Tsihrintzis, V.A. Assessment of rainwater harvesting tank size for livestock use. Water Sci. Technol. Water Supply 2017, 17, ws2017136. [Google Scholar] [CrossRef]
Figure 1. Location of Kabarole district on the Ugandan map (Source: Google maps).
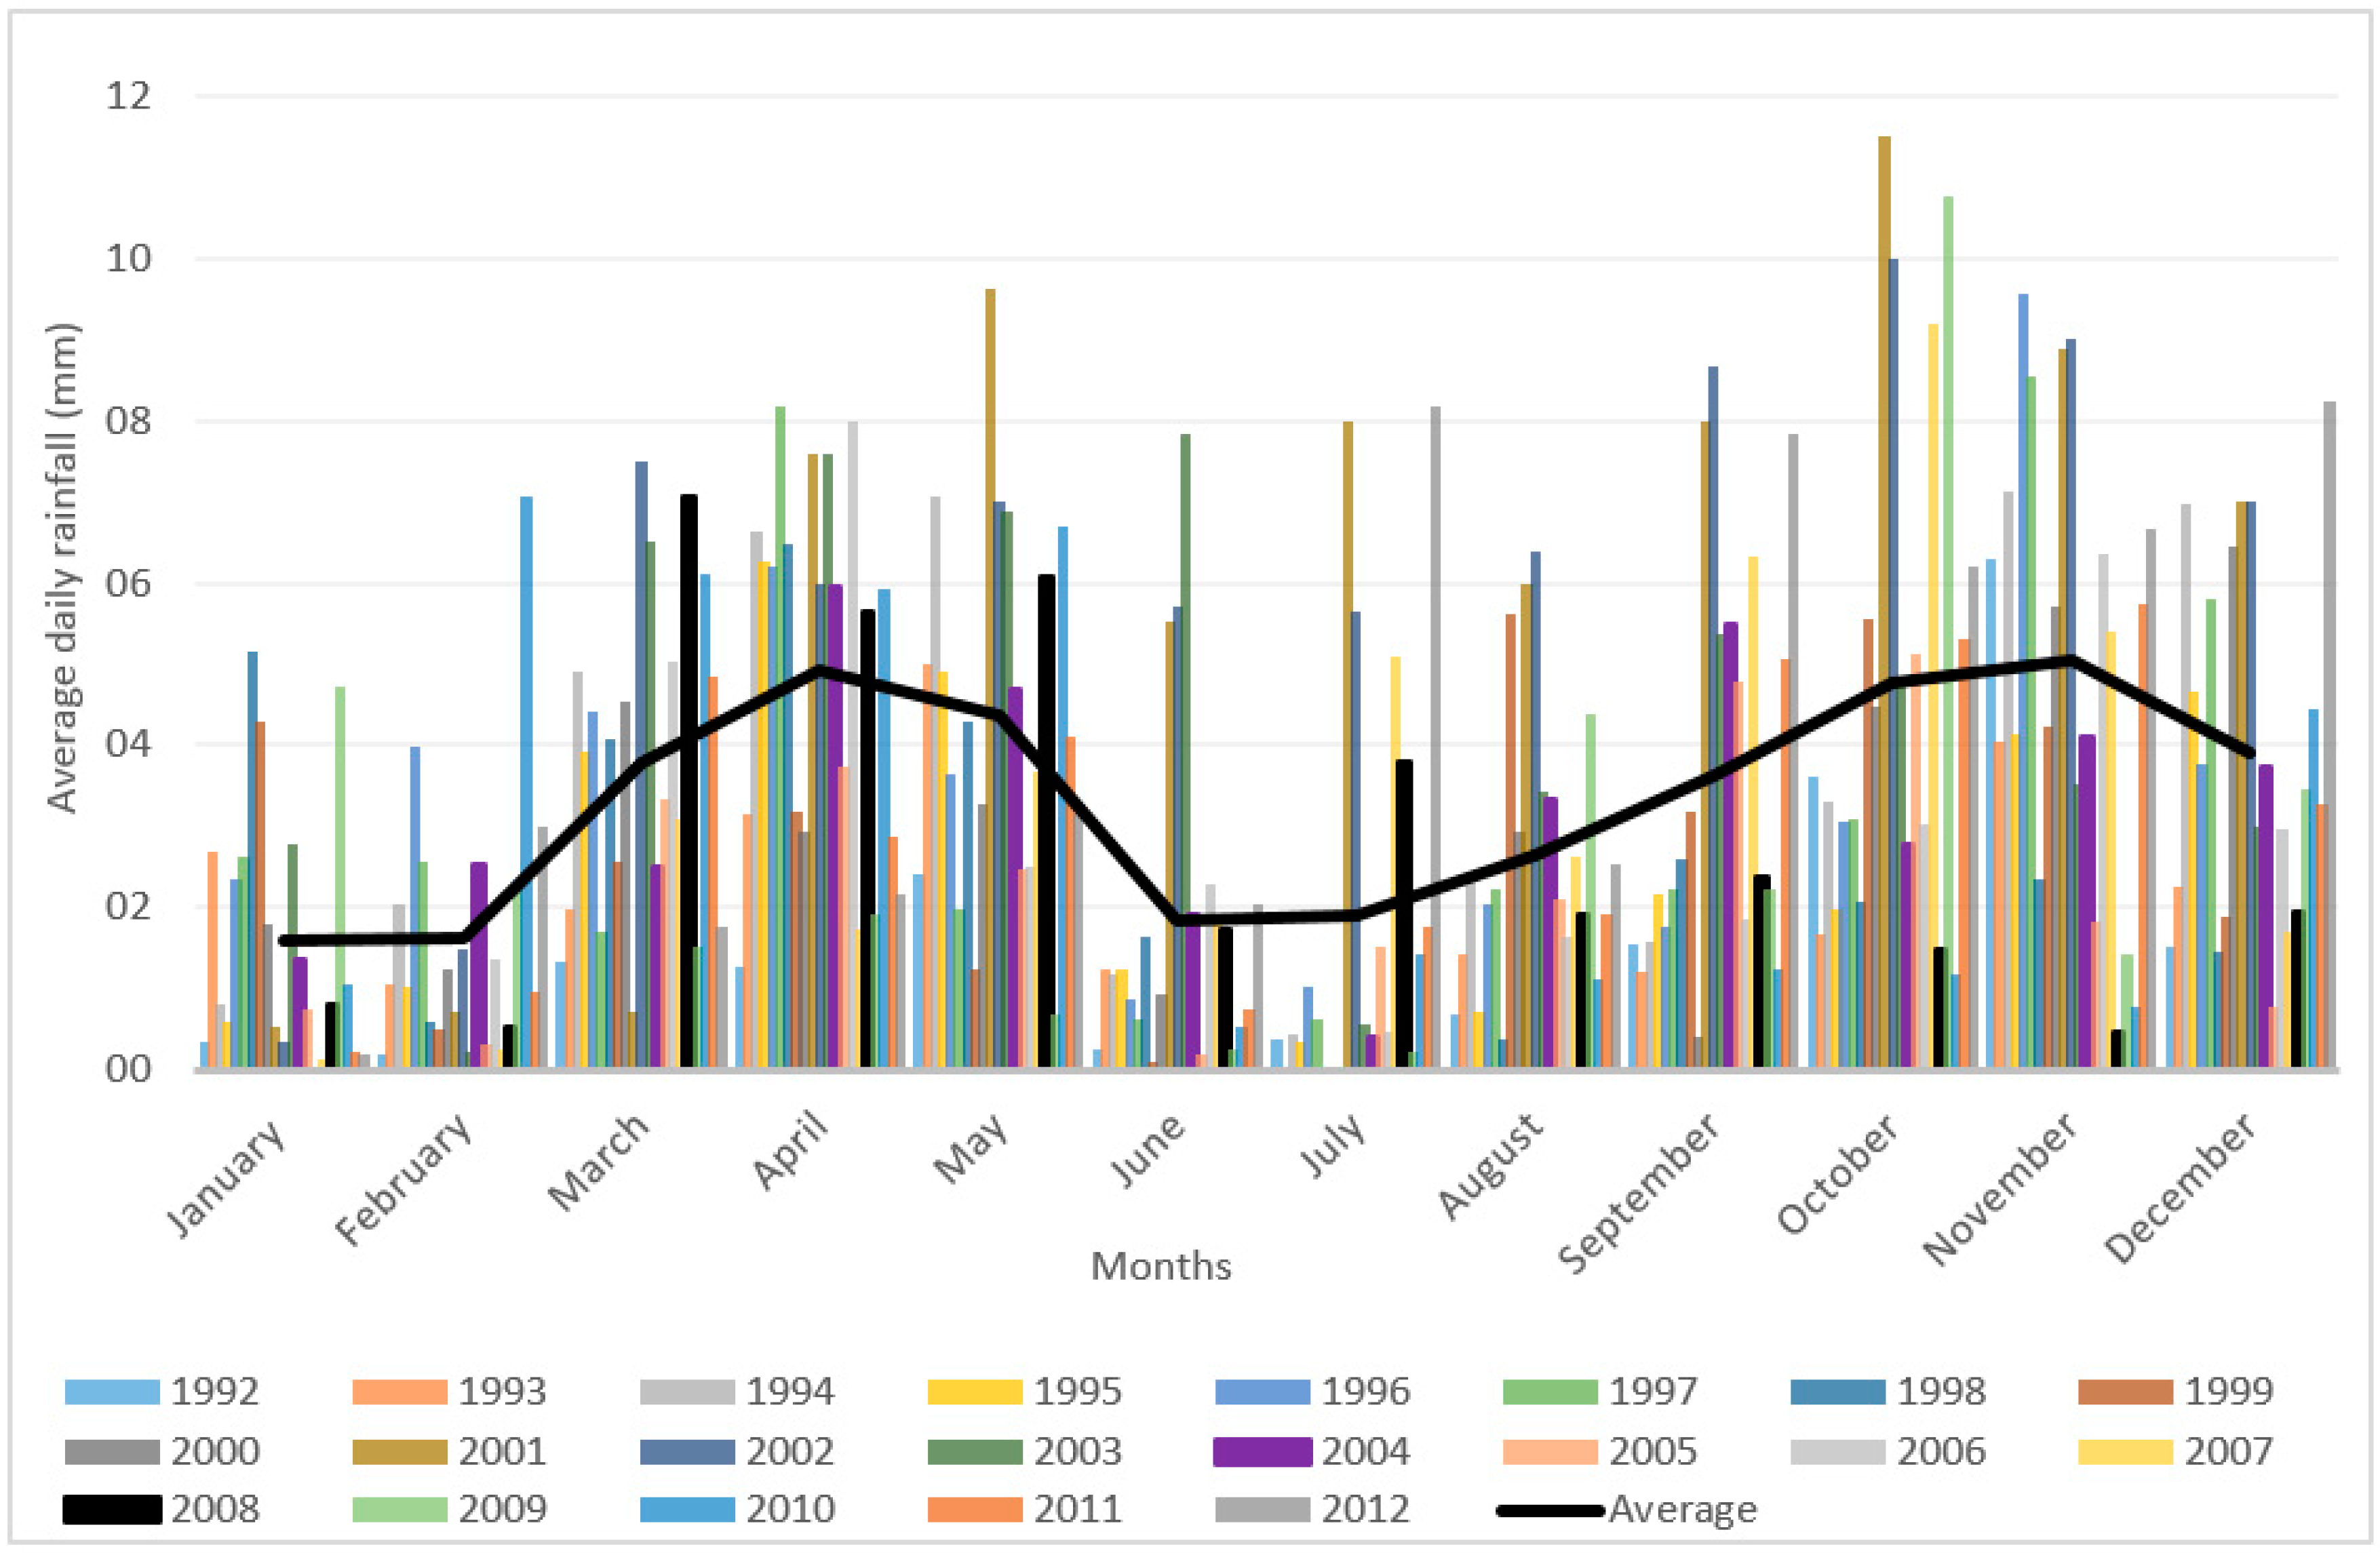
Water 10 00071 g001
Figure 2. Daily observed rainfall for Kyembogo station (1992–2012).
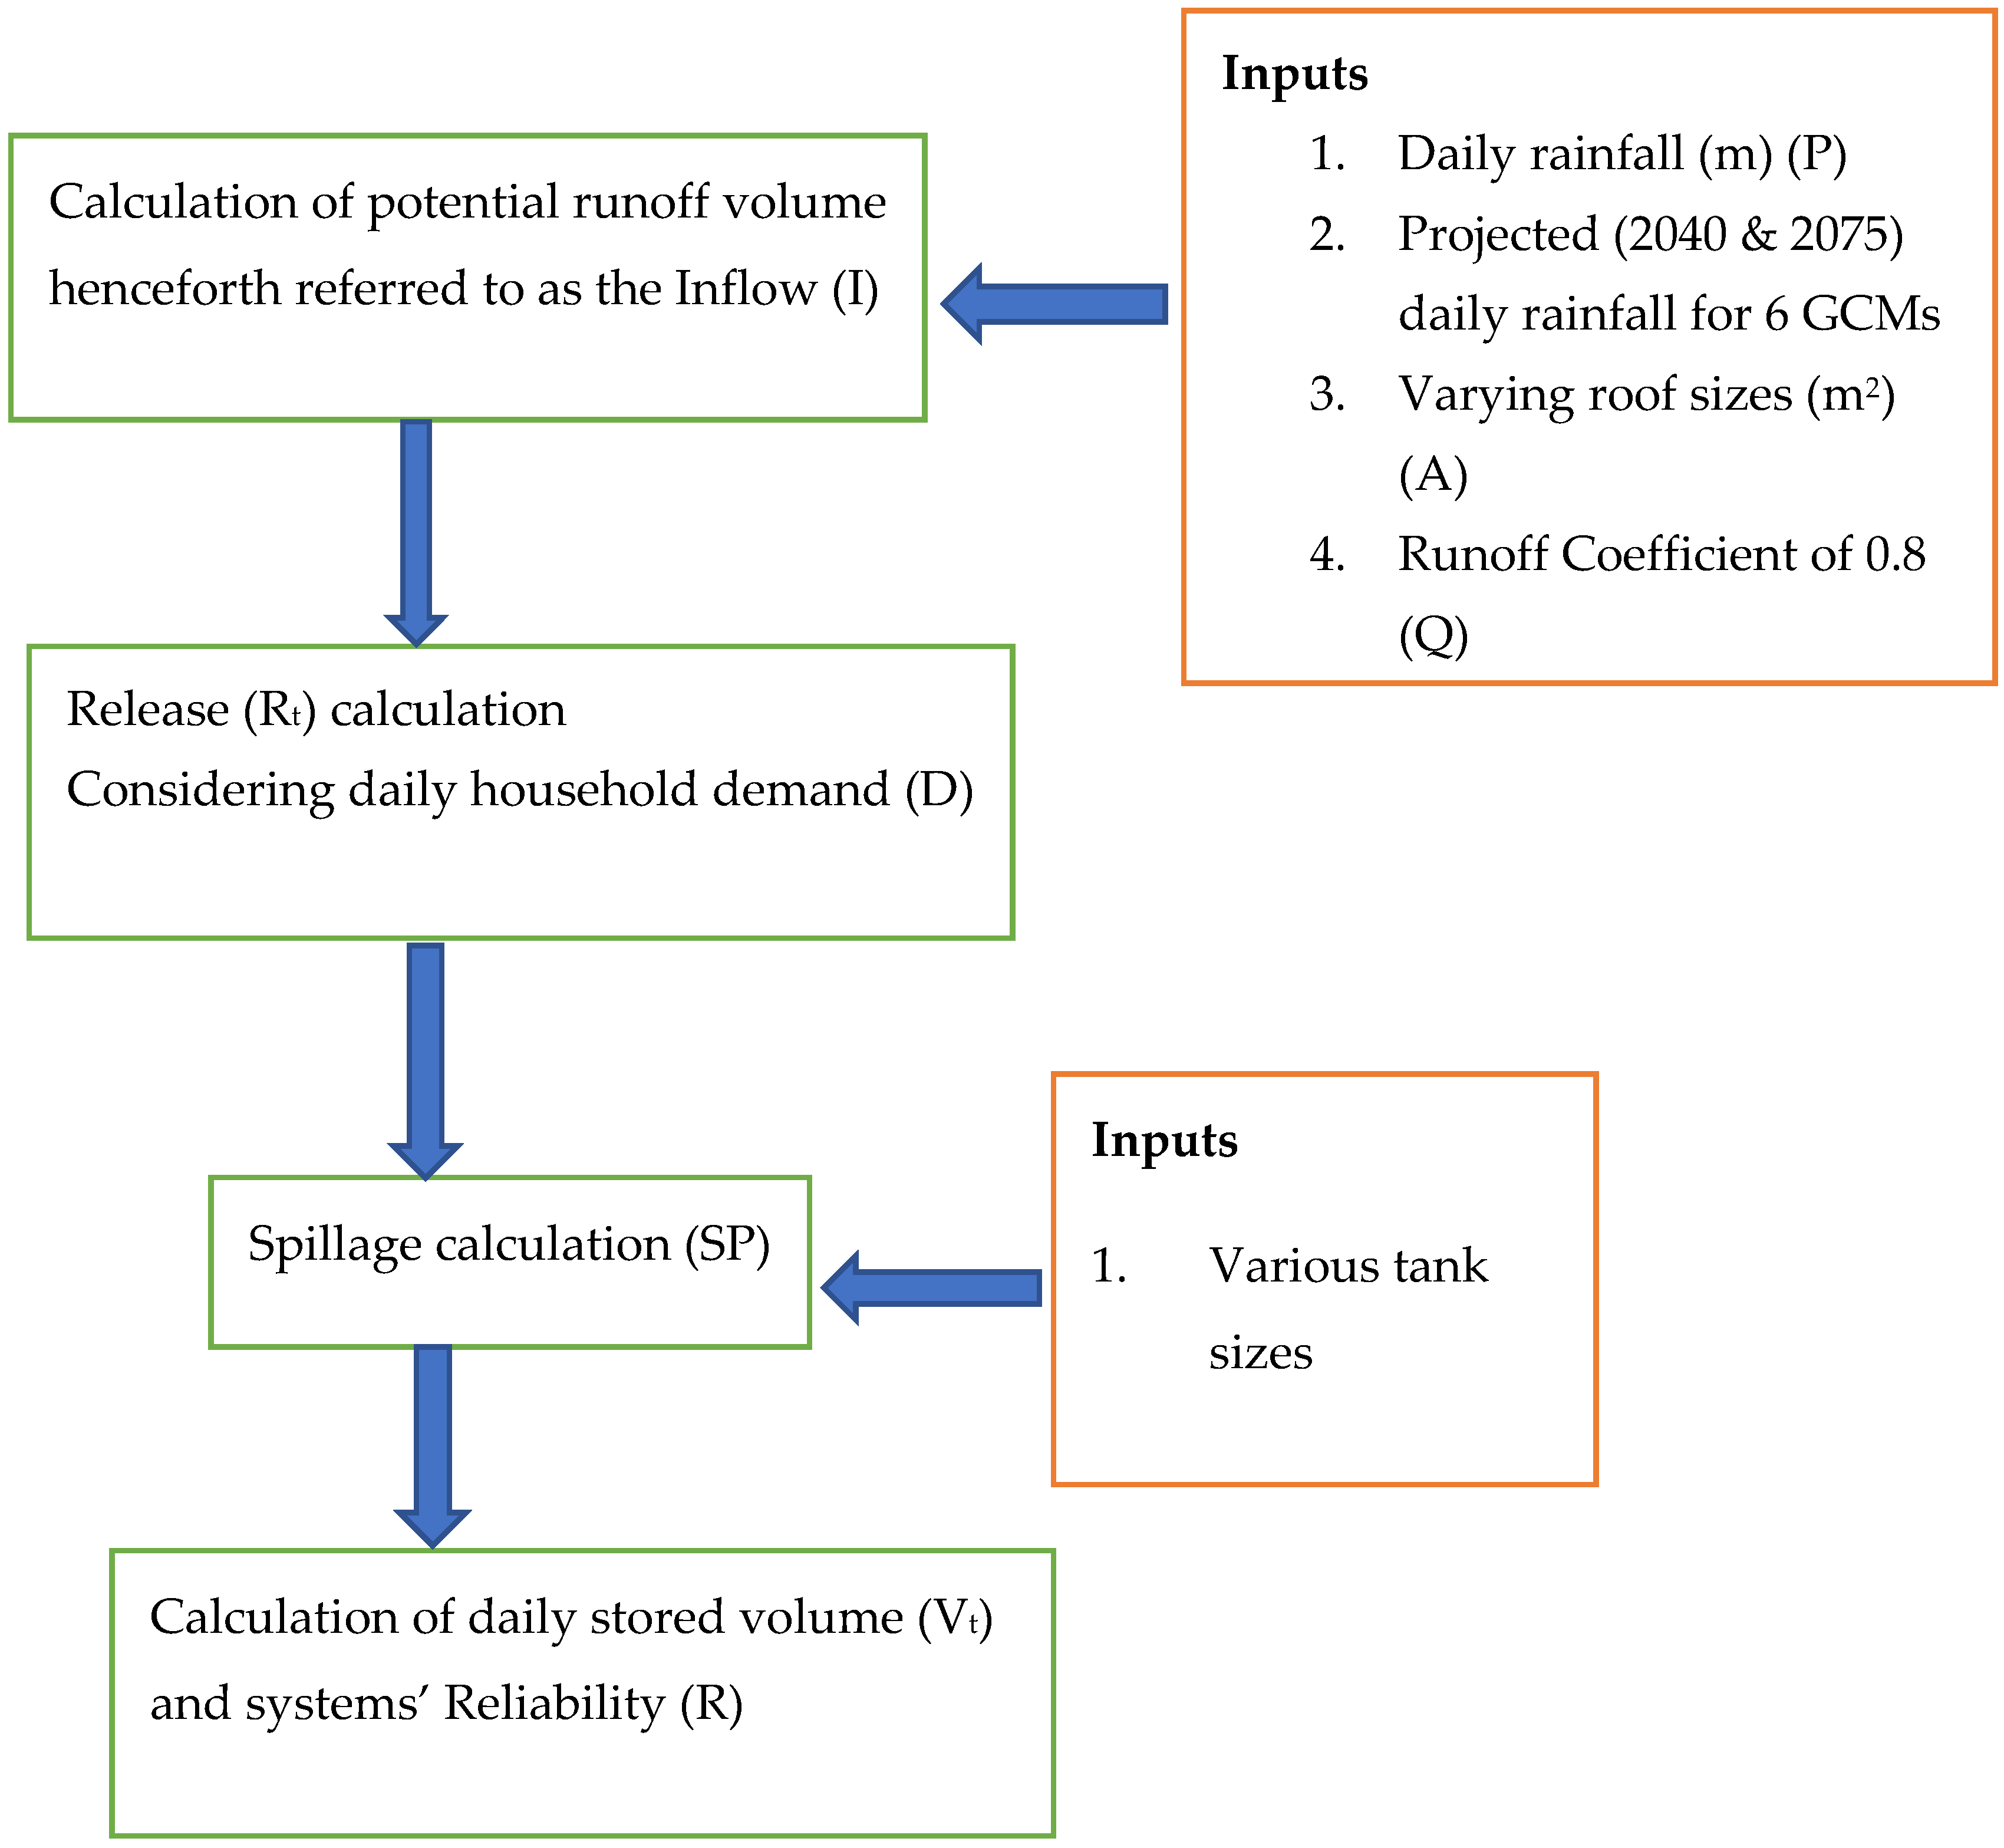
Water 10 00071 g002
Figure 3. Summary of steps taken in estimation of reliability of rainwater harvesting systems with climate change and varying design combinations.
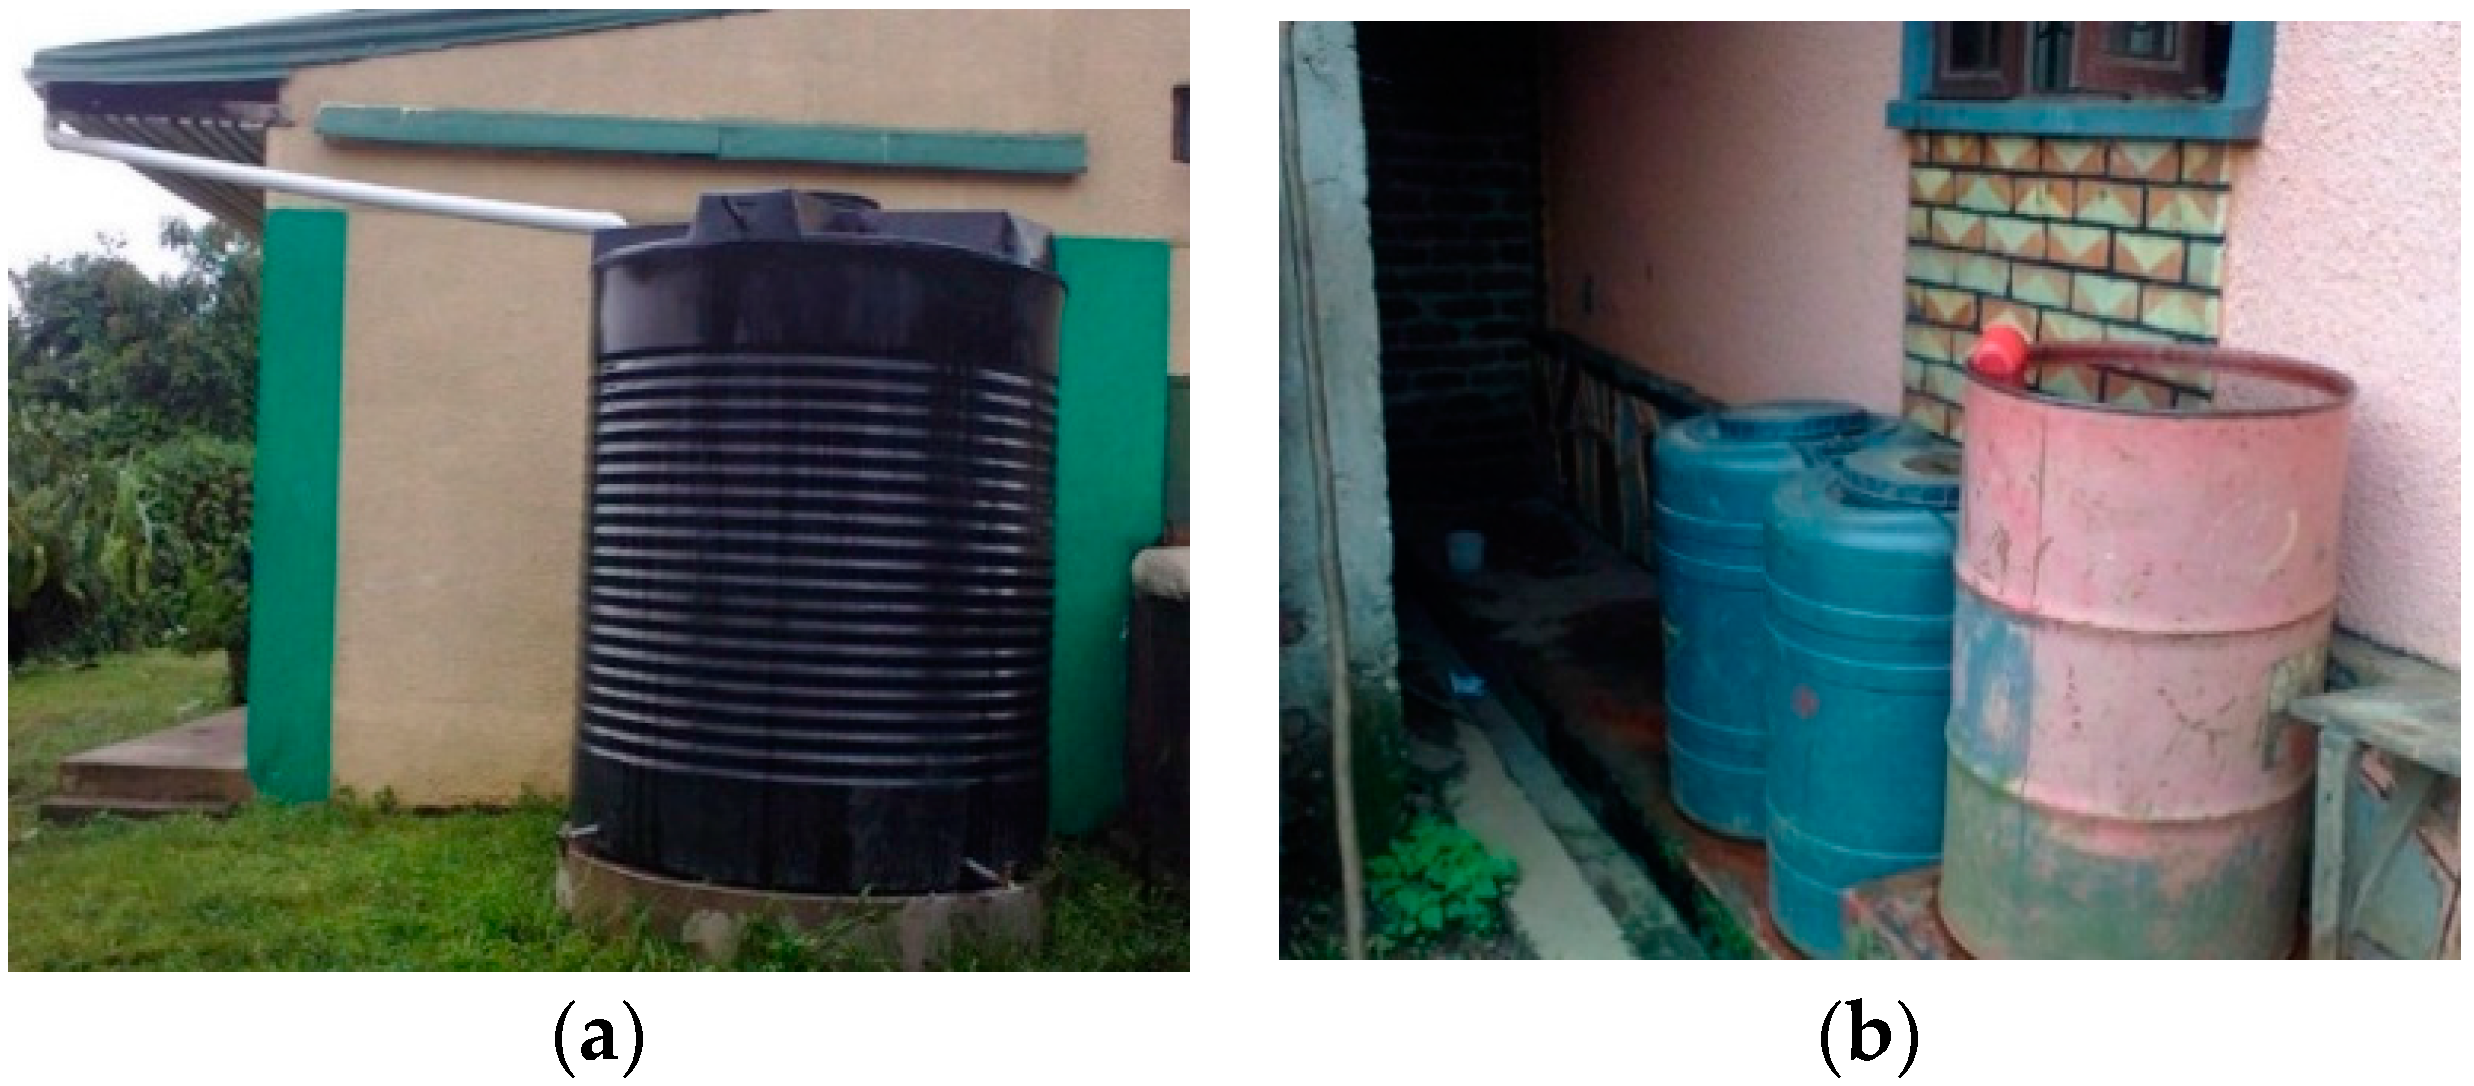
Water 10 00071 g003
Figure 4. Illustrates the difference between formal and informal rainwater harvesting systems. (a) Formal harvesting systems; (b) Informal harvesting systems.
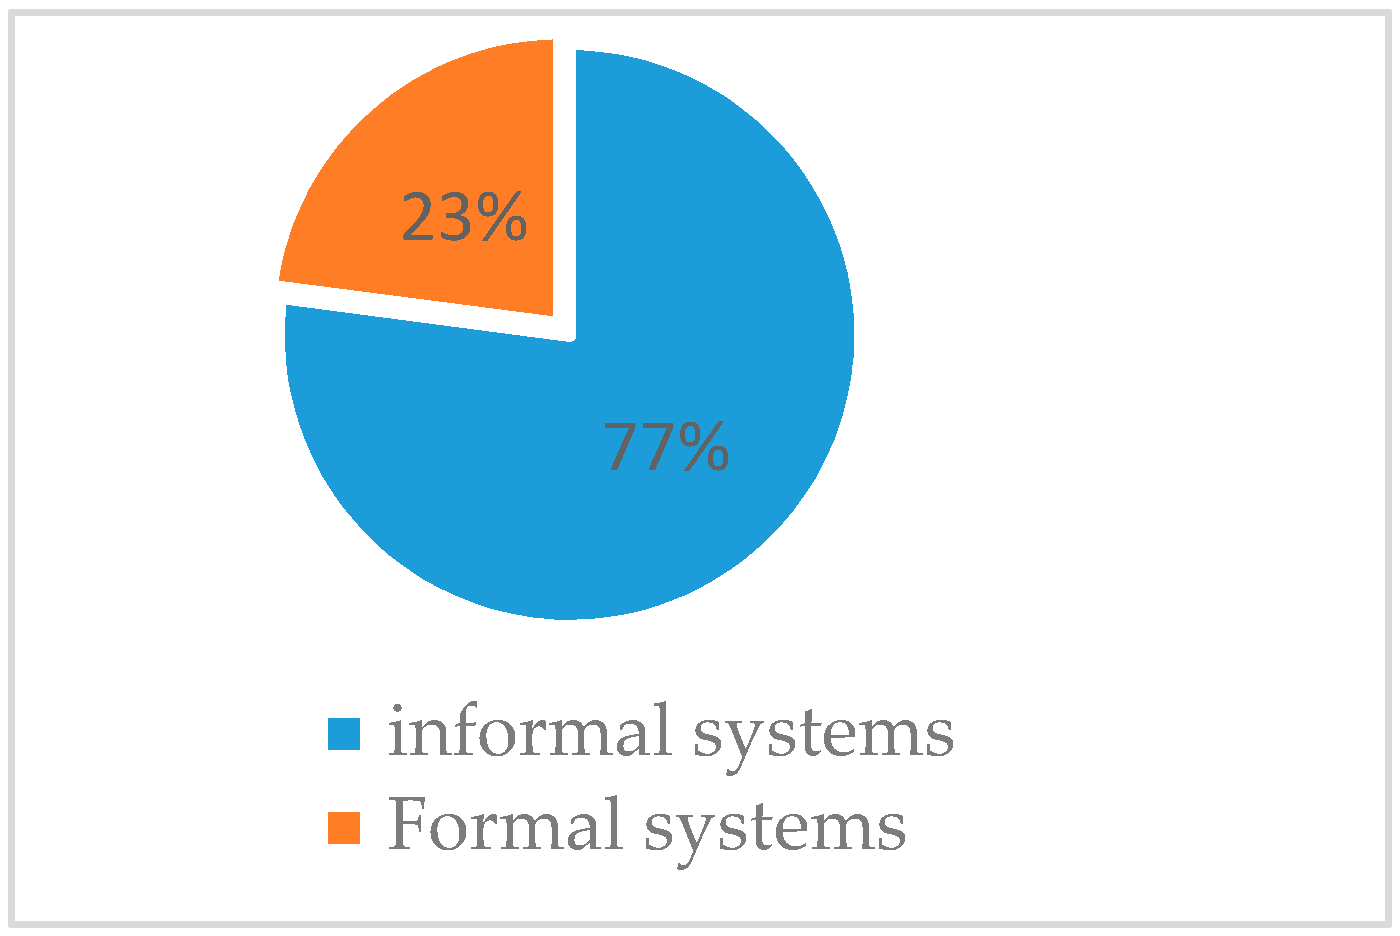
Water 10 00071 g004
Figure 5. Proportion of households practicing both technologies.
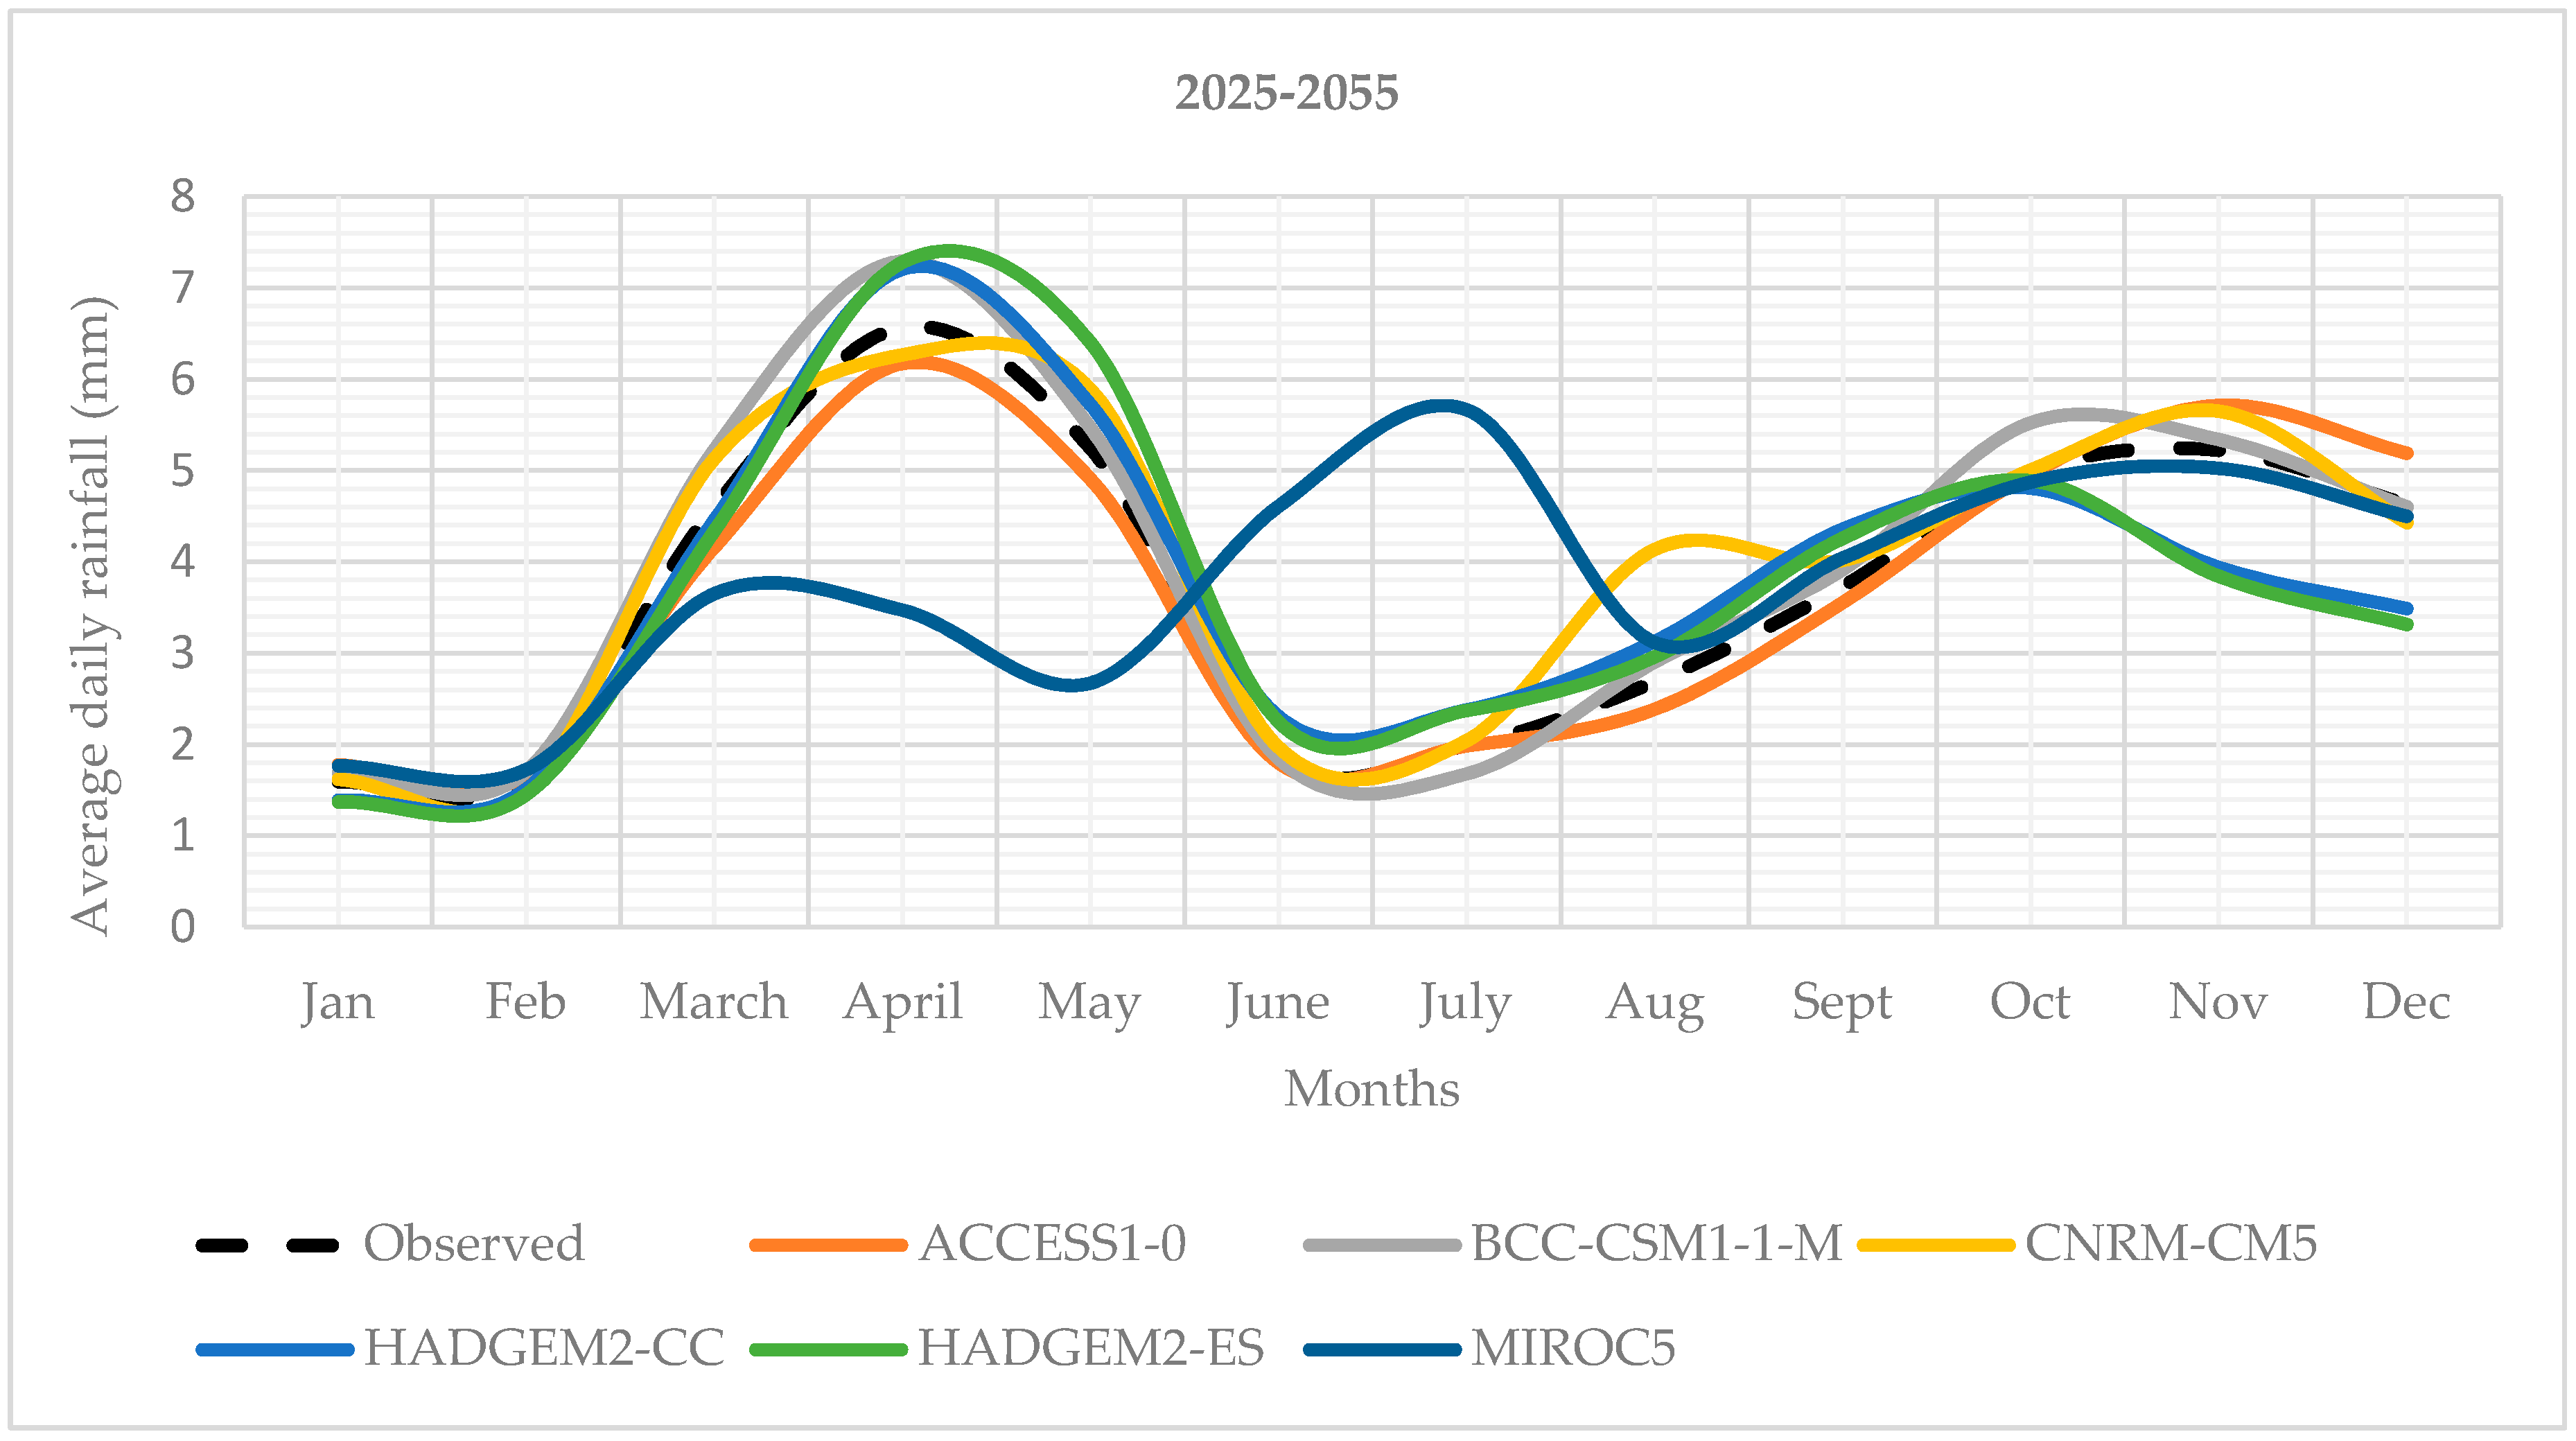
Water 10 00071 g005
Figure 6. Climate change prediction of daily average rainfall for 2025–2055.
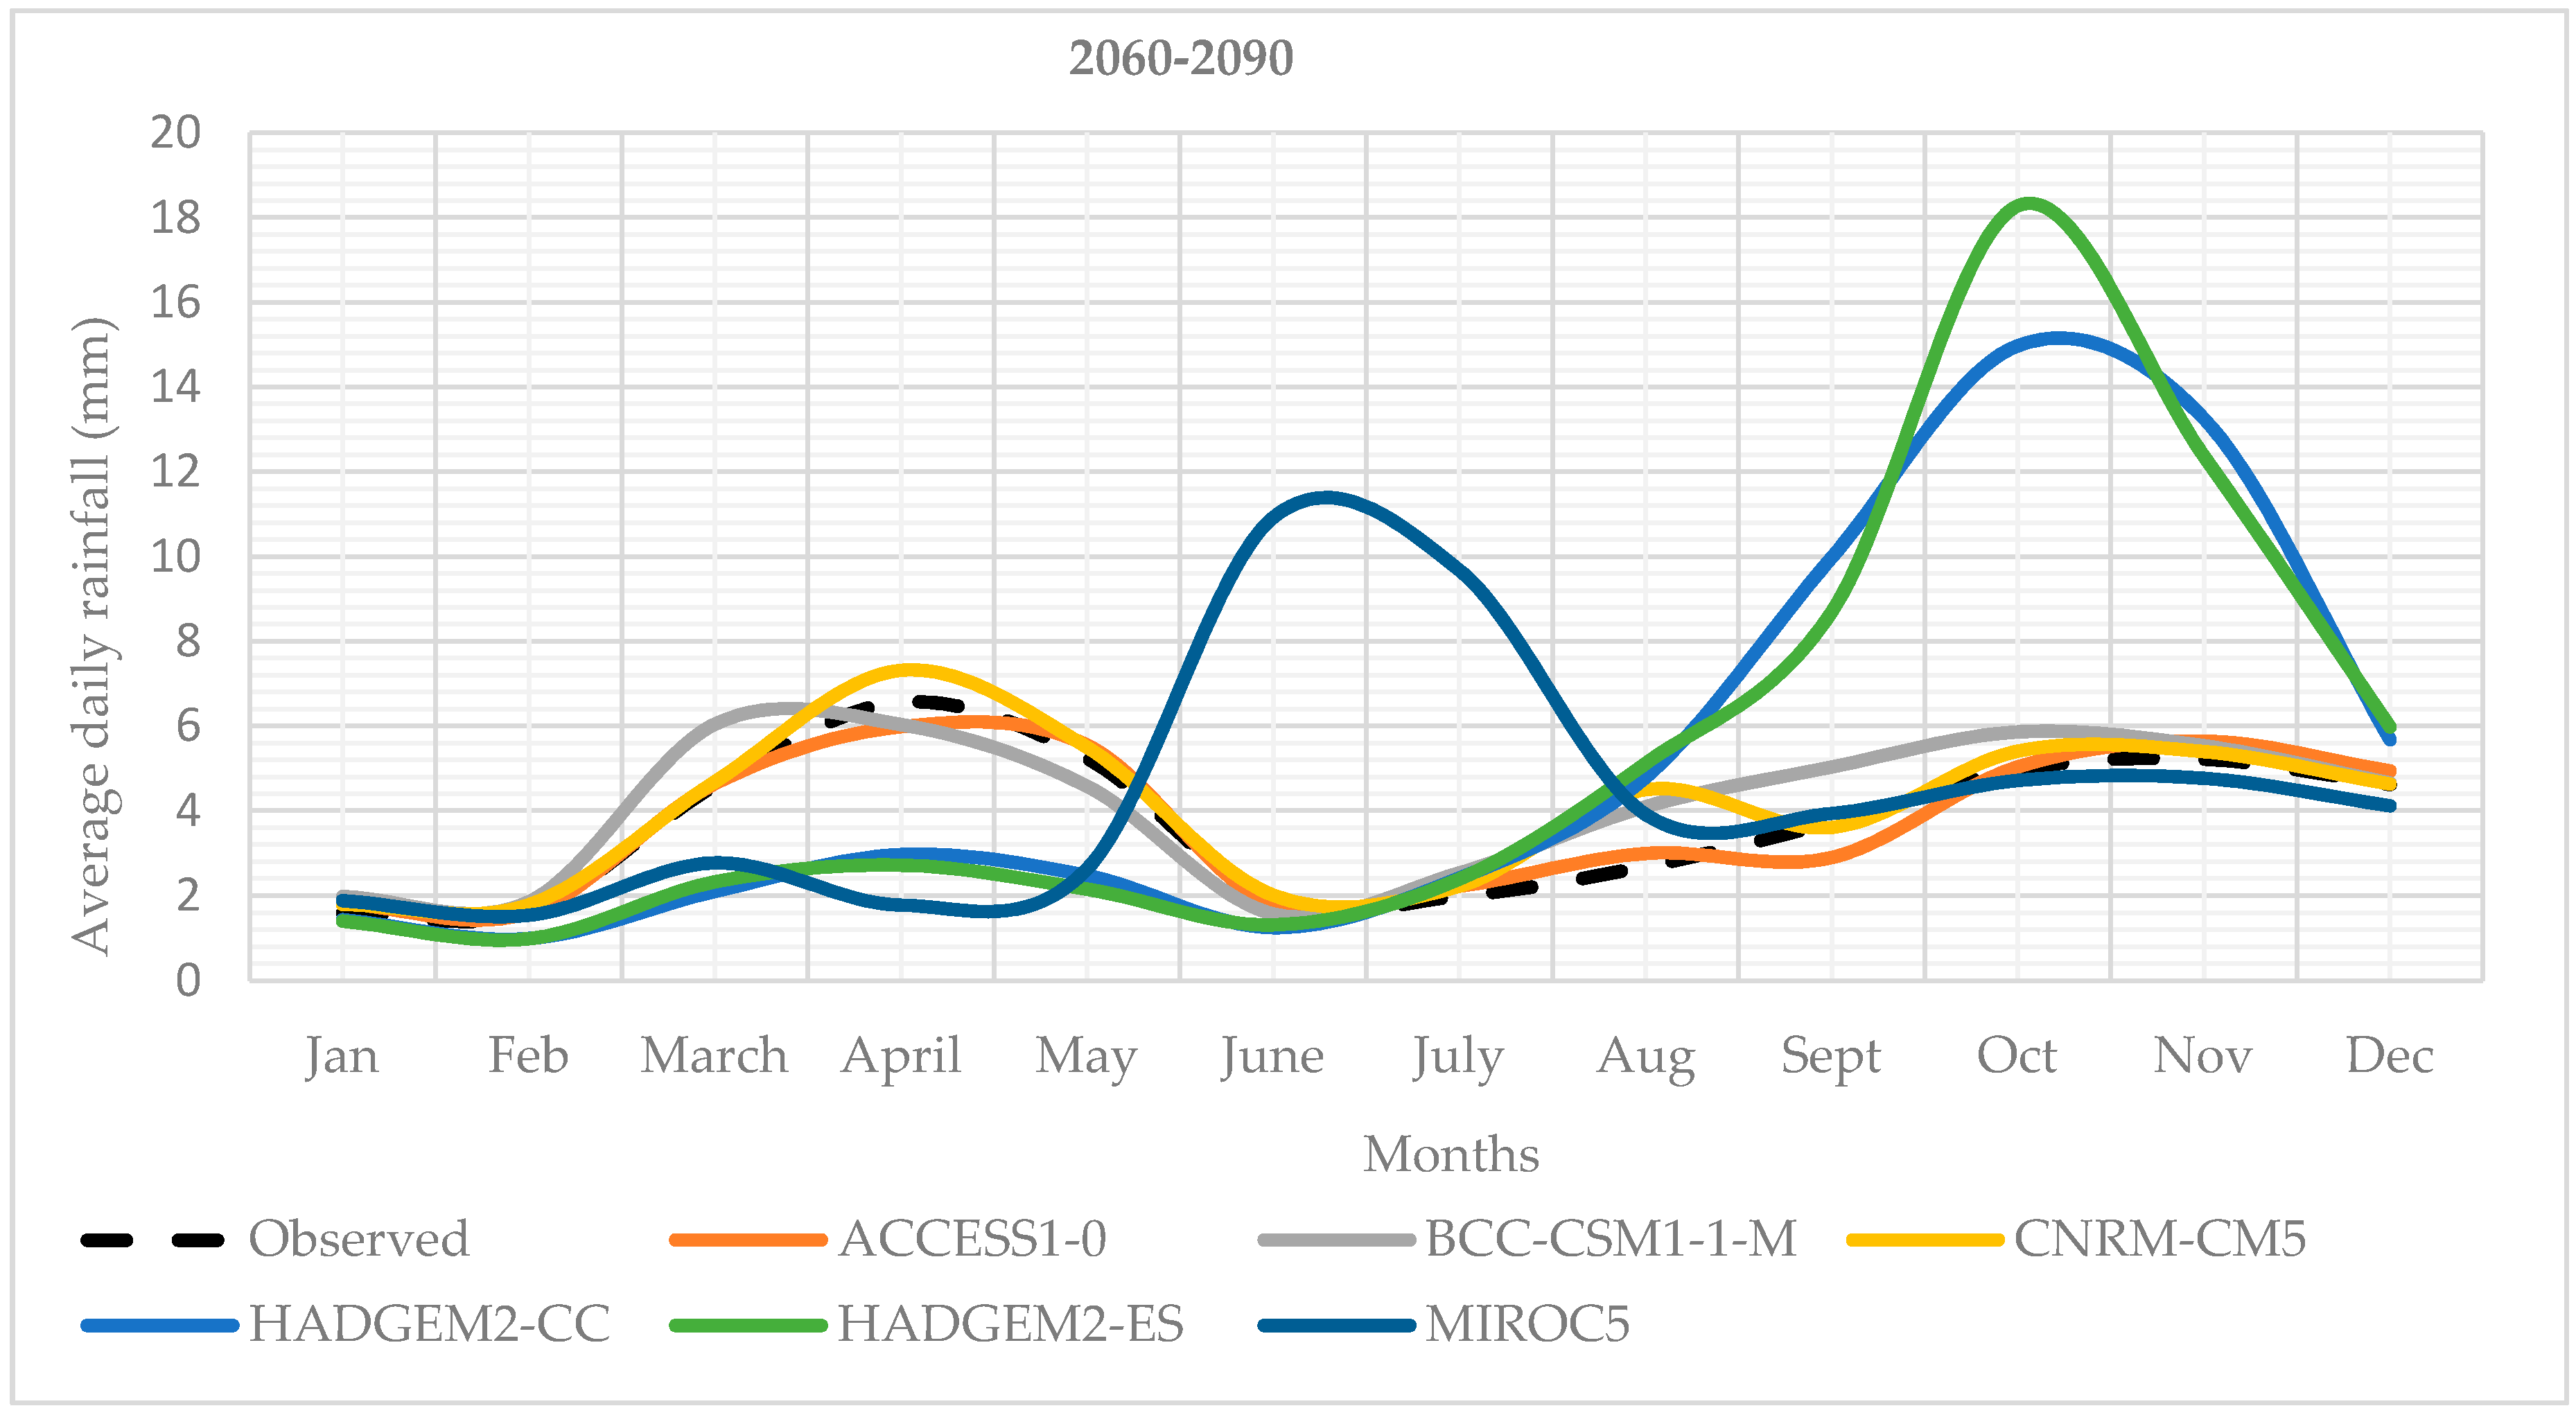
Water 10 00071 g006
Figure 7. Climate change prediction of daily average rainfall for 2060–2090.
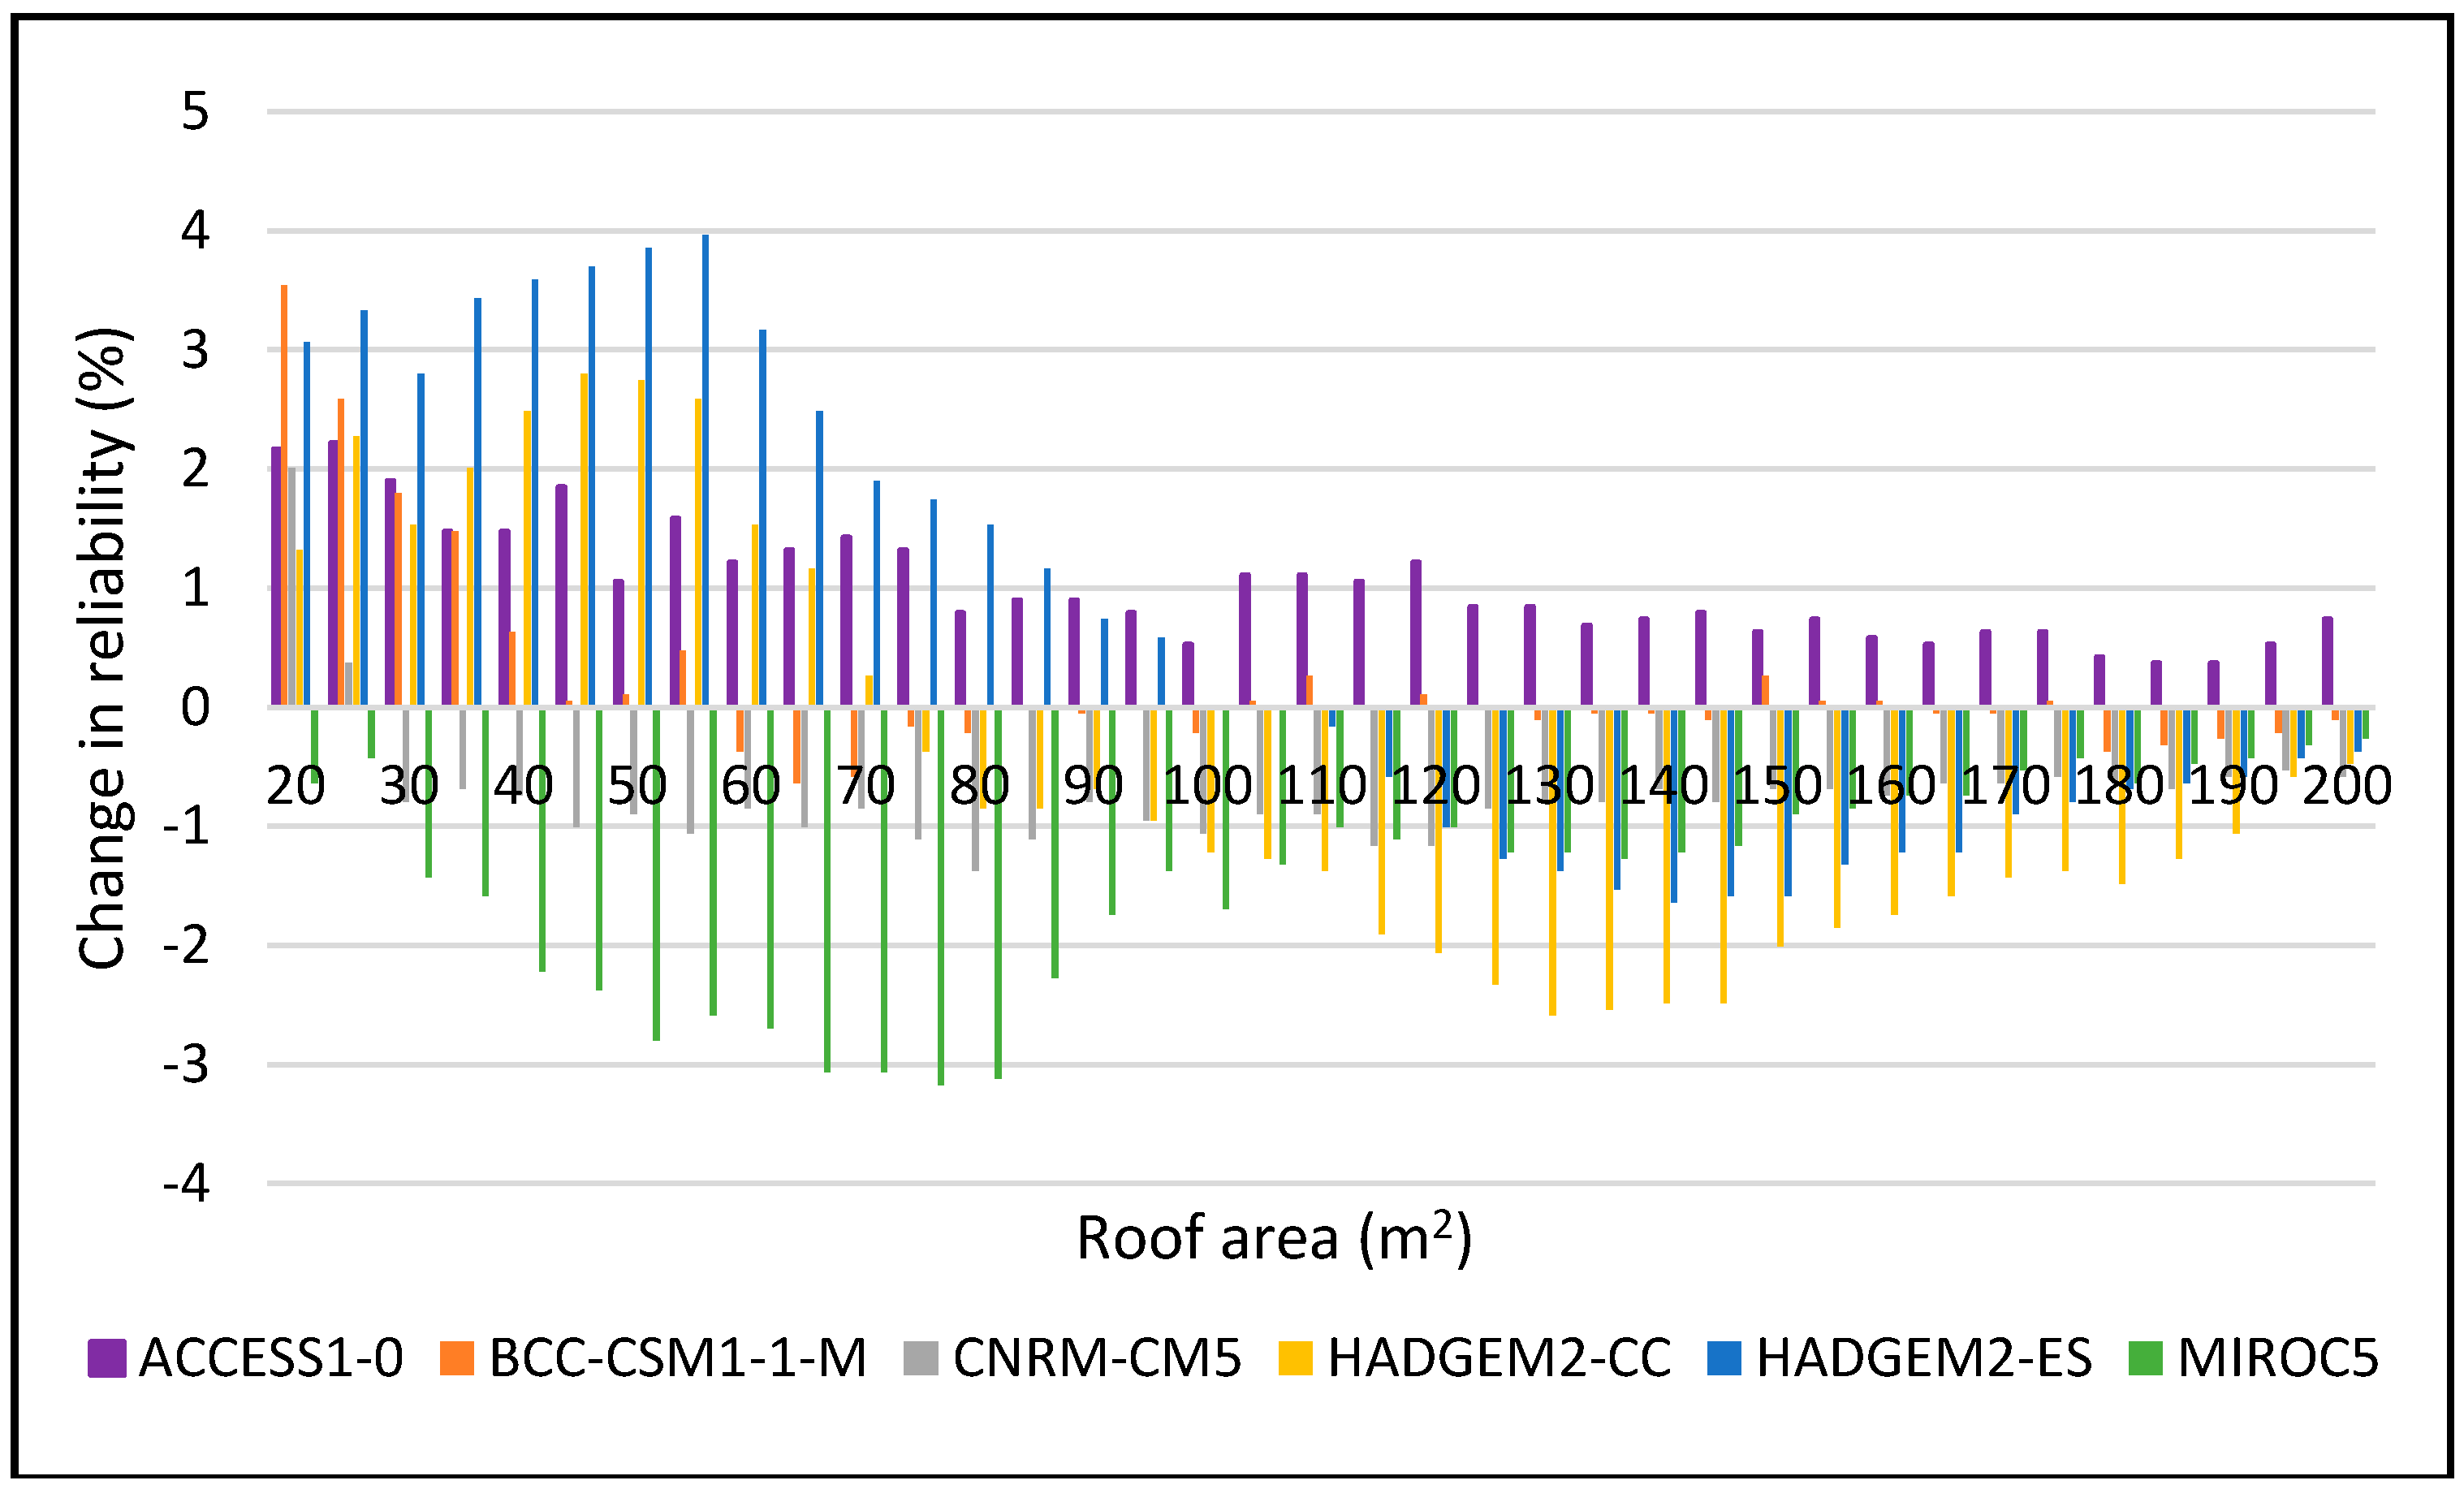
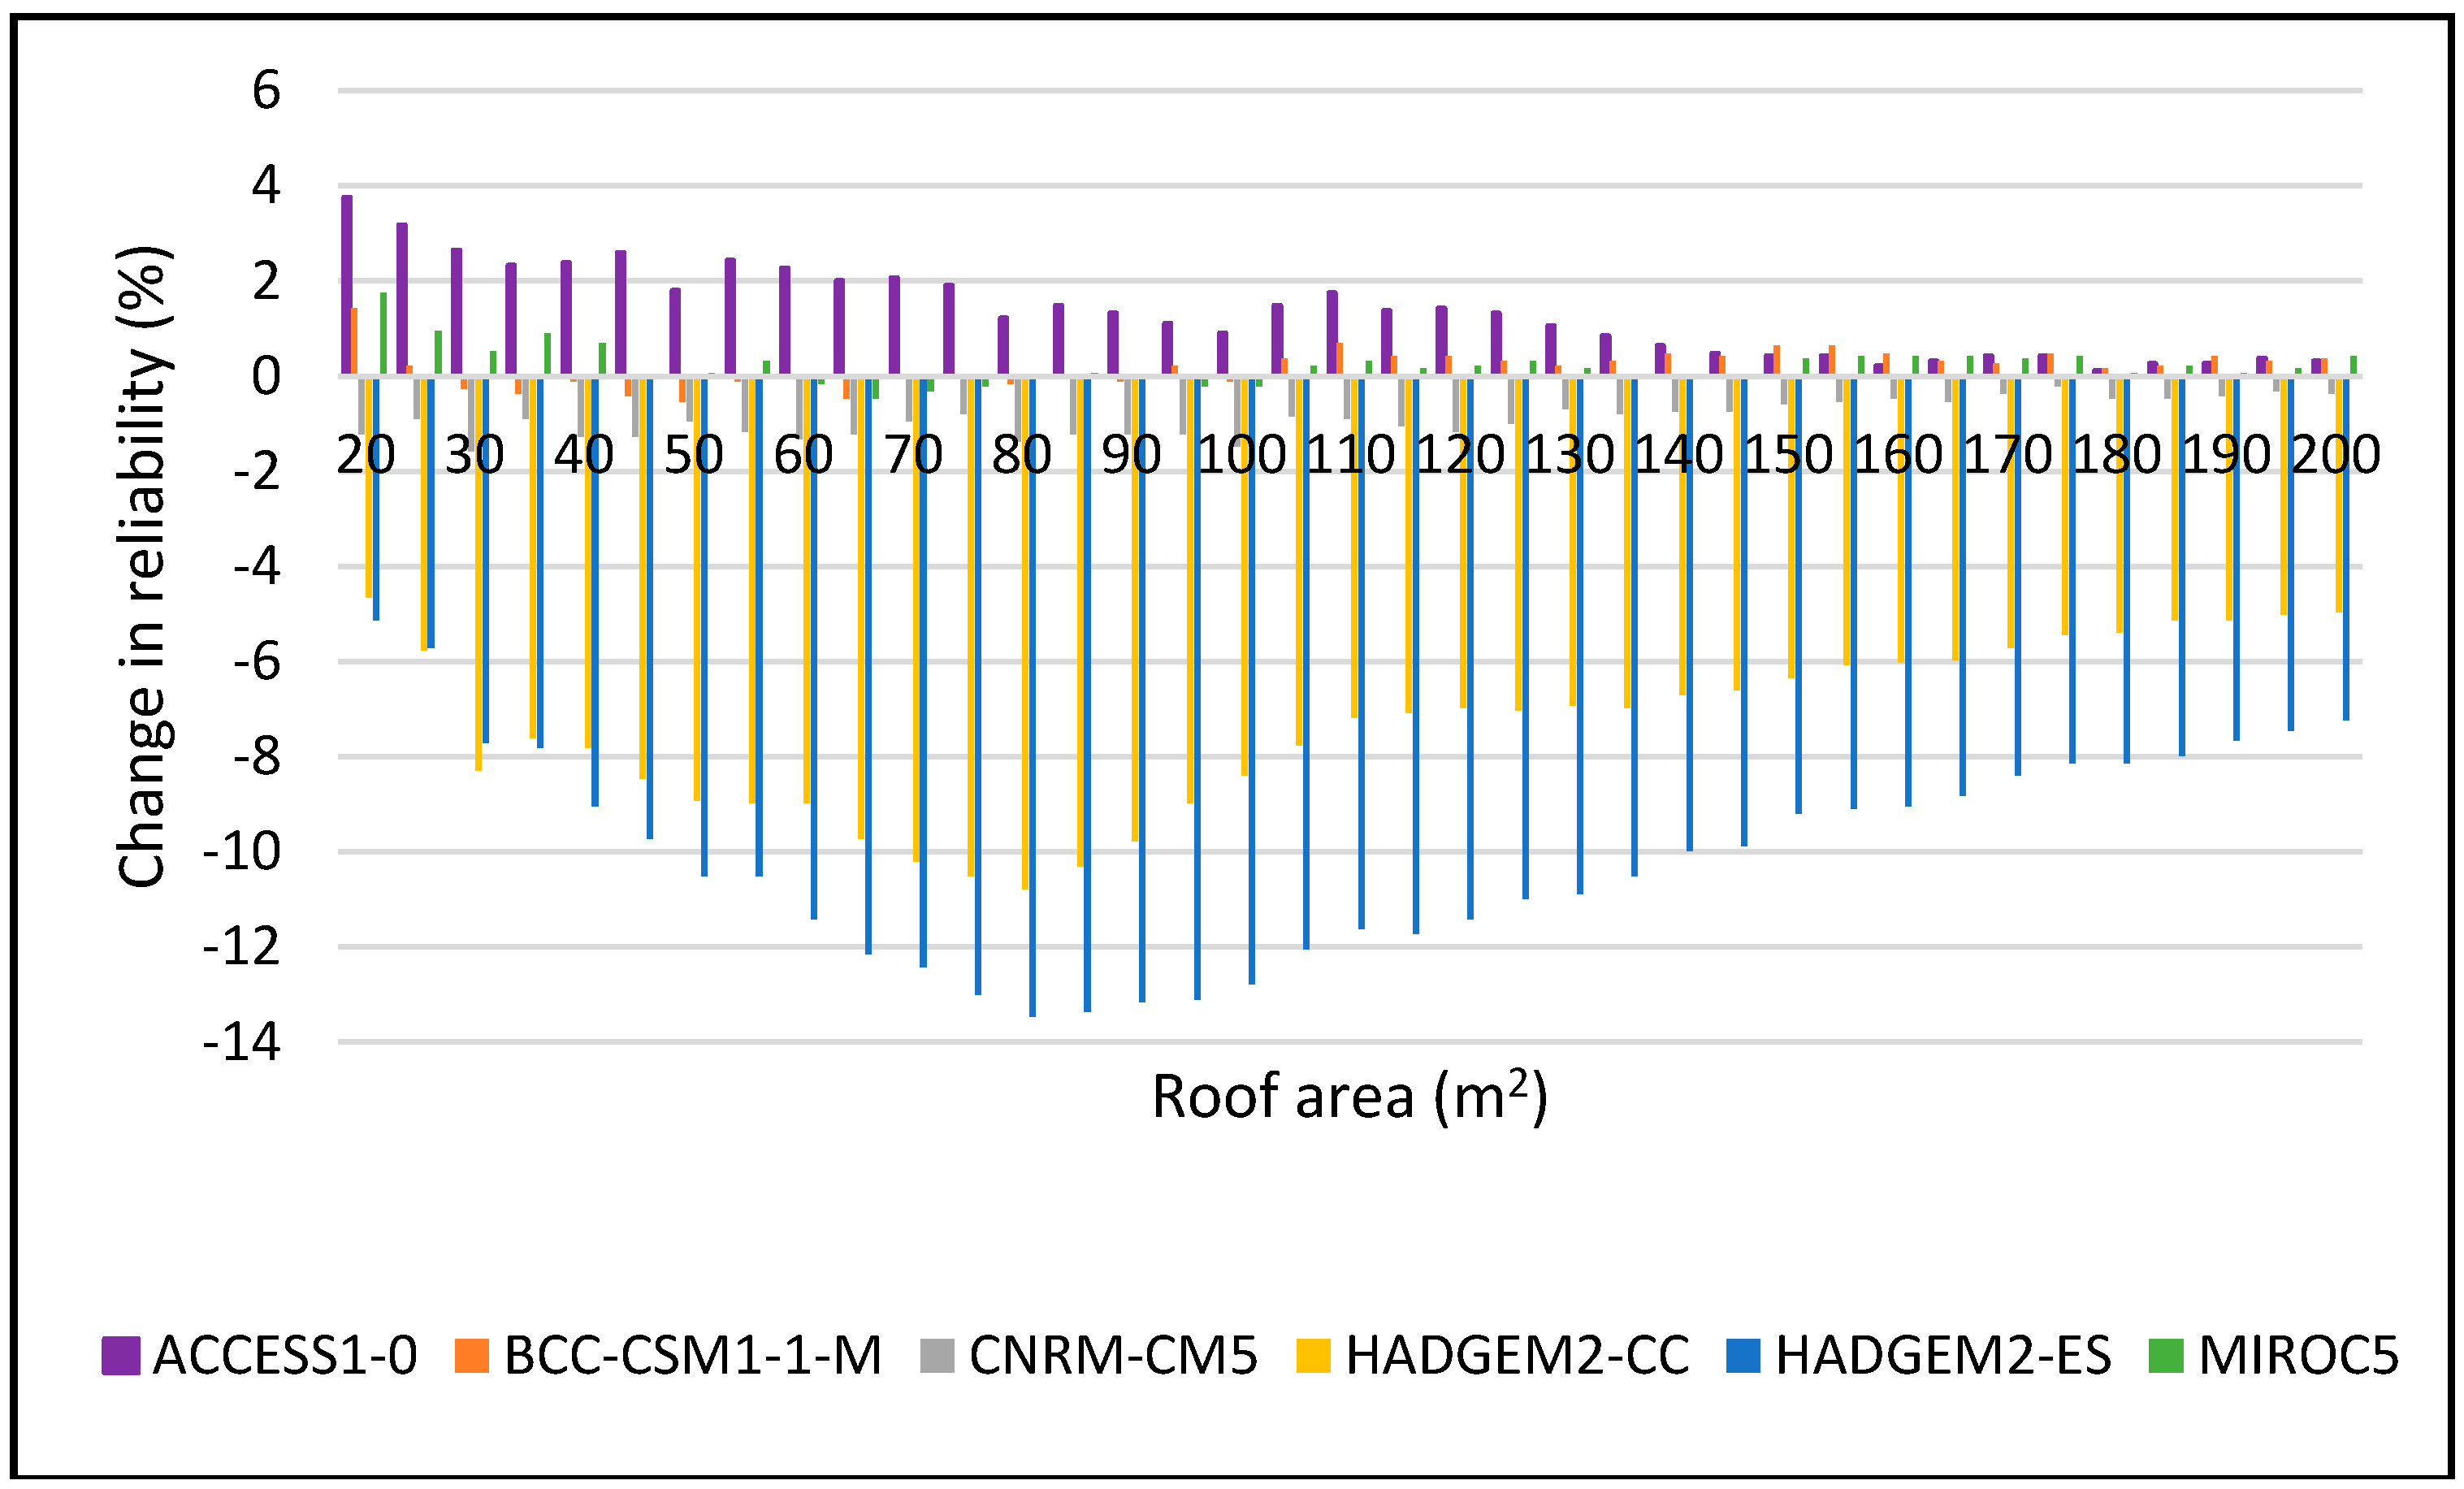
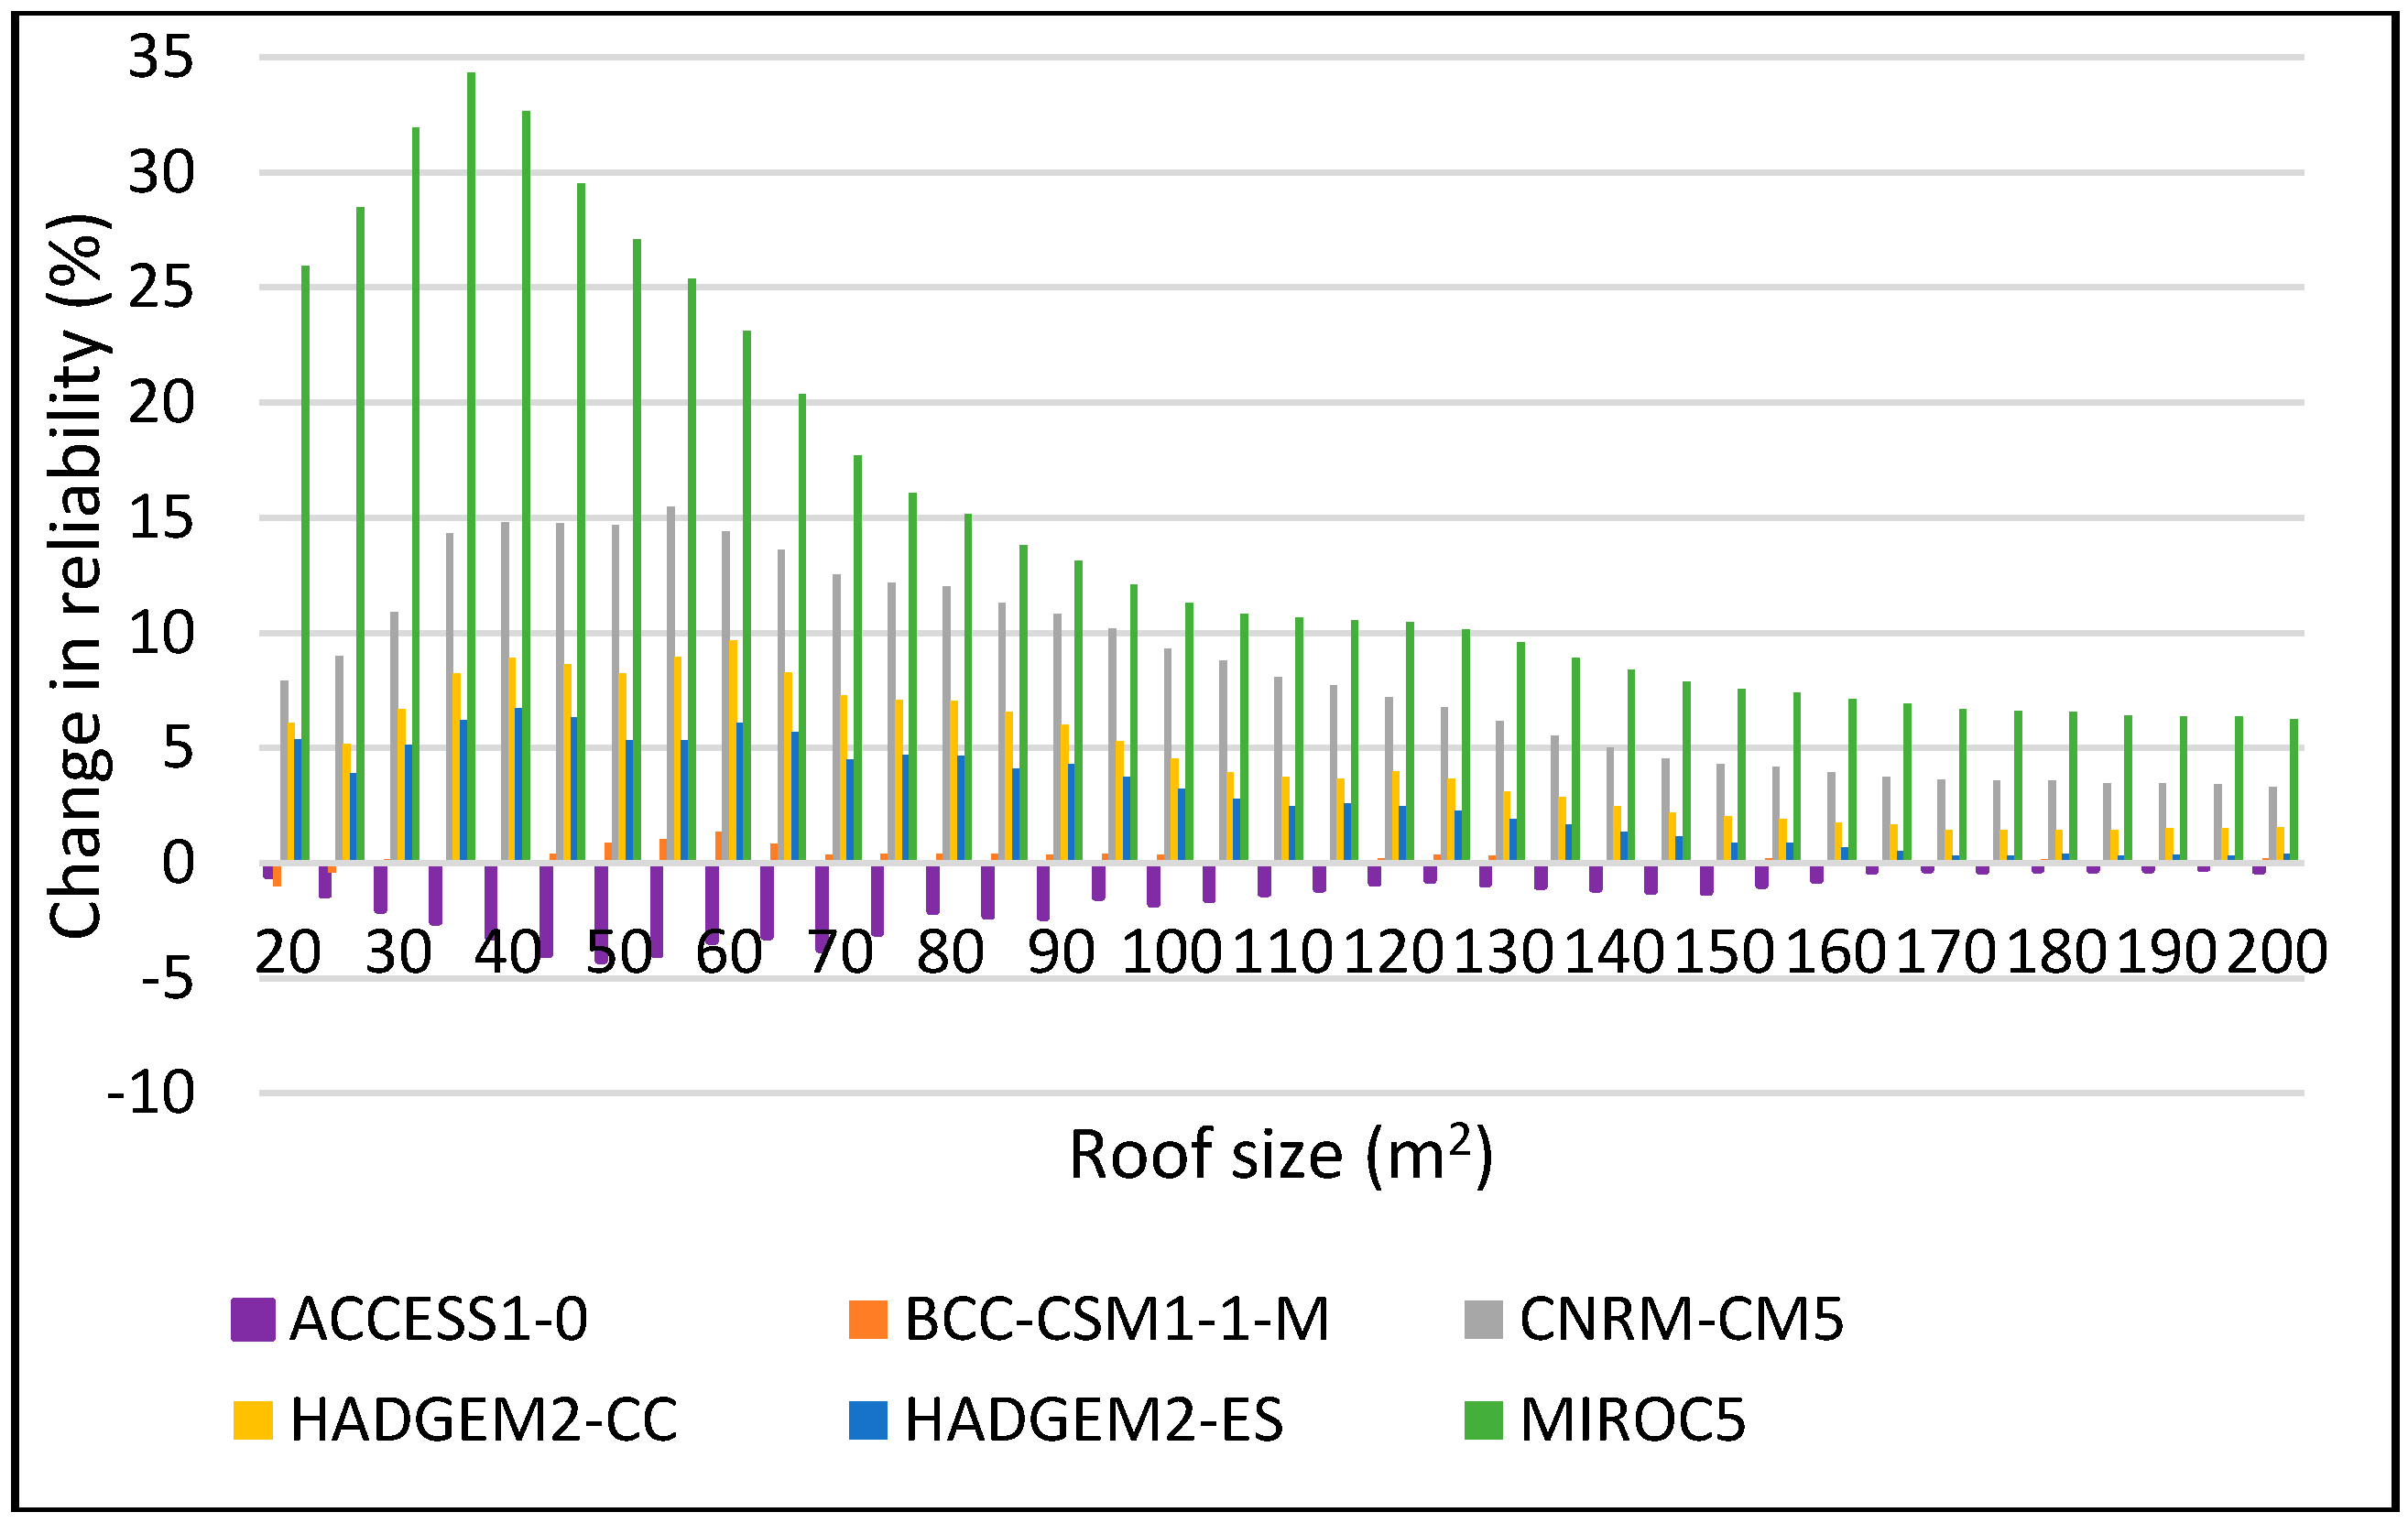
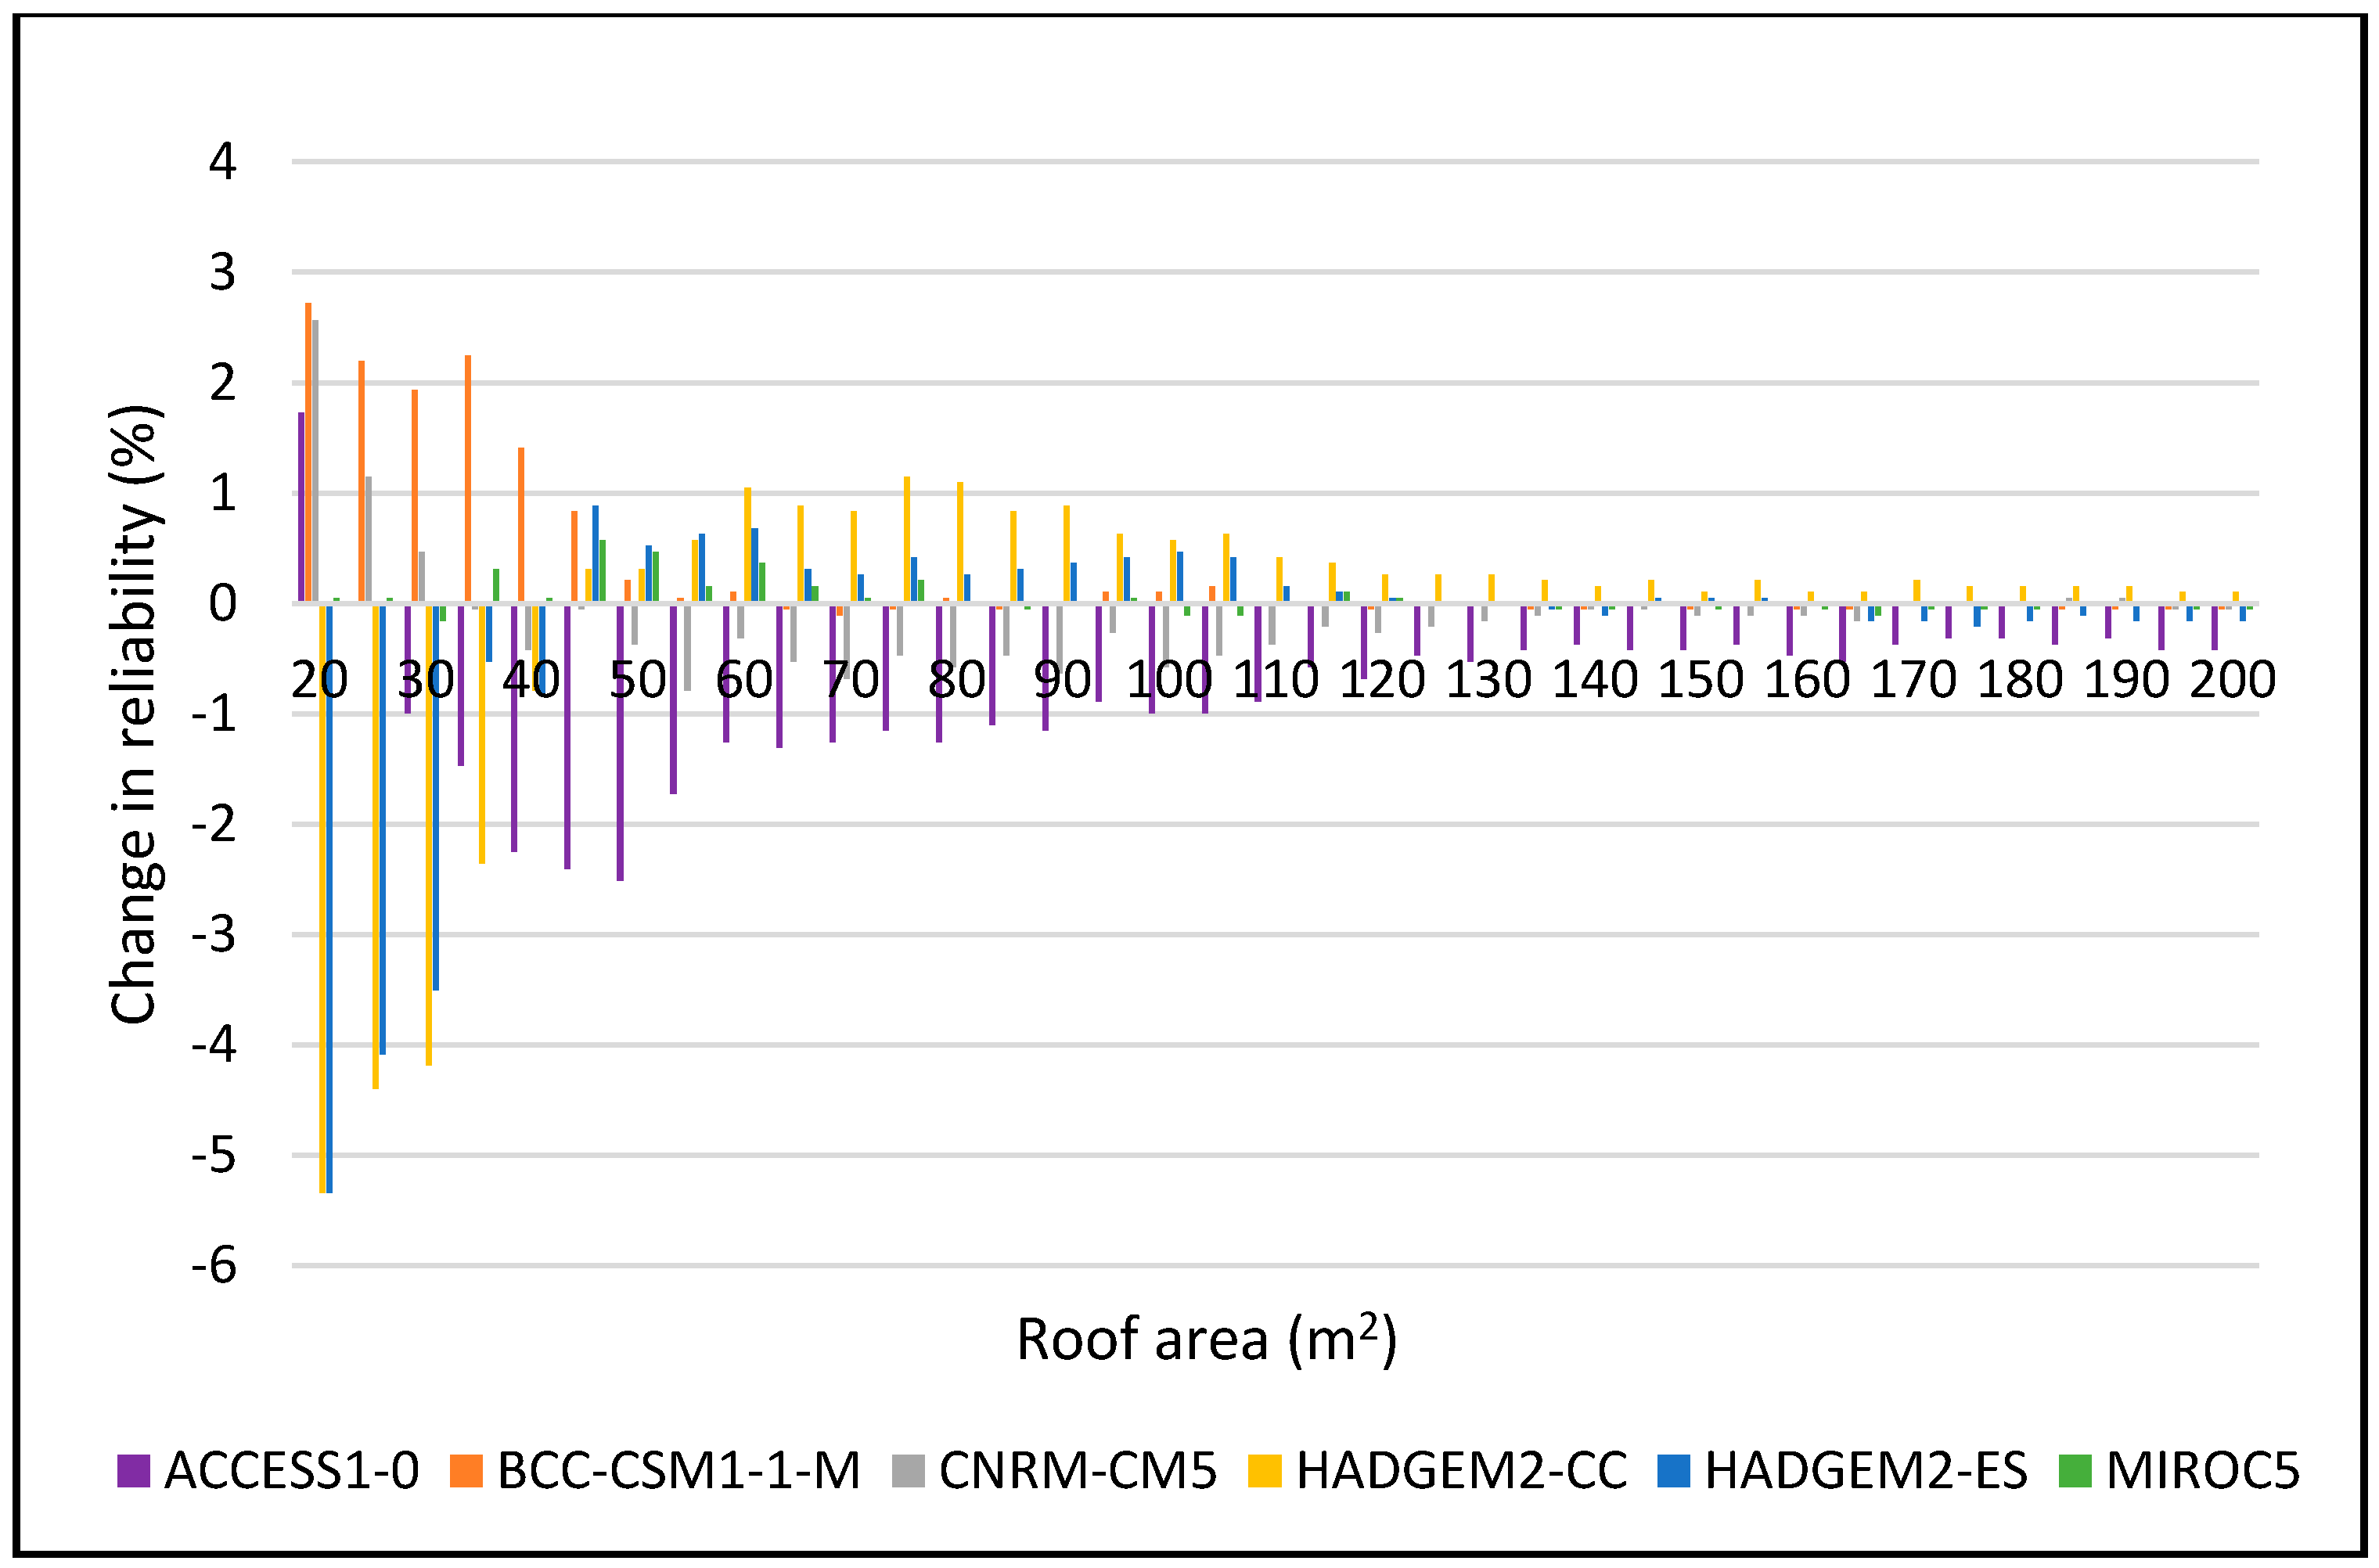
Water 10 00071 g007
Figure 8. Change in reliability for DJF 2025–2055 period for 2 m3.
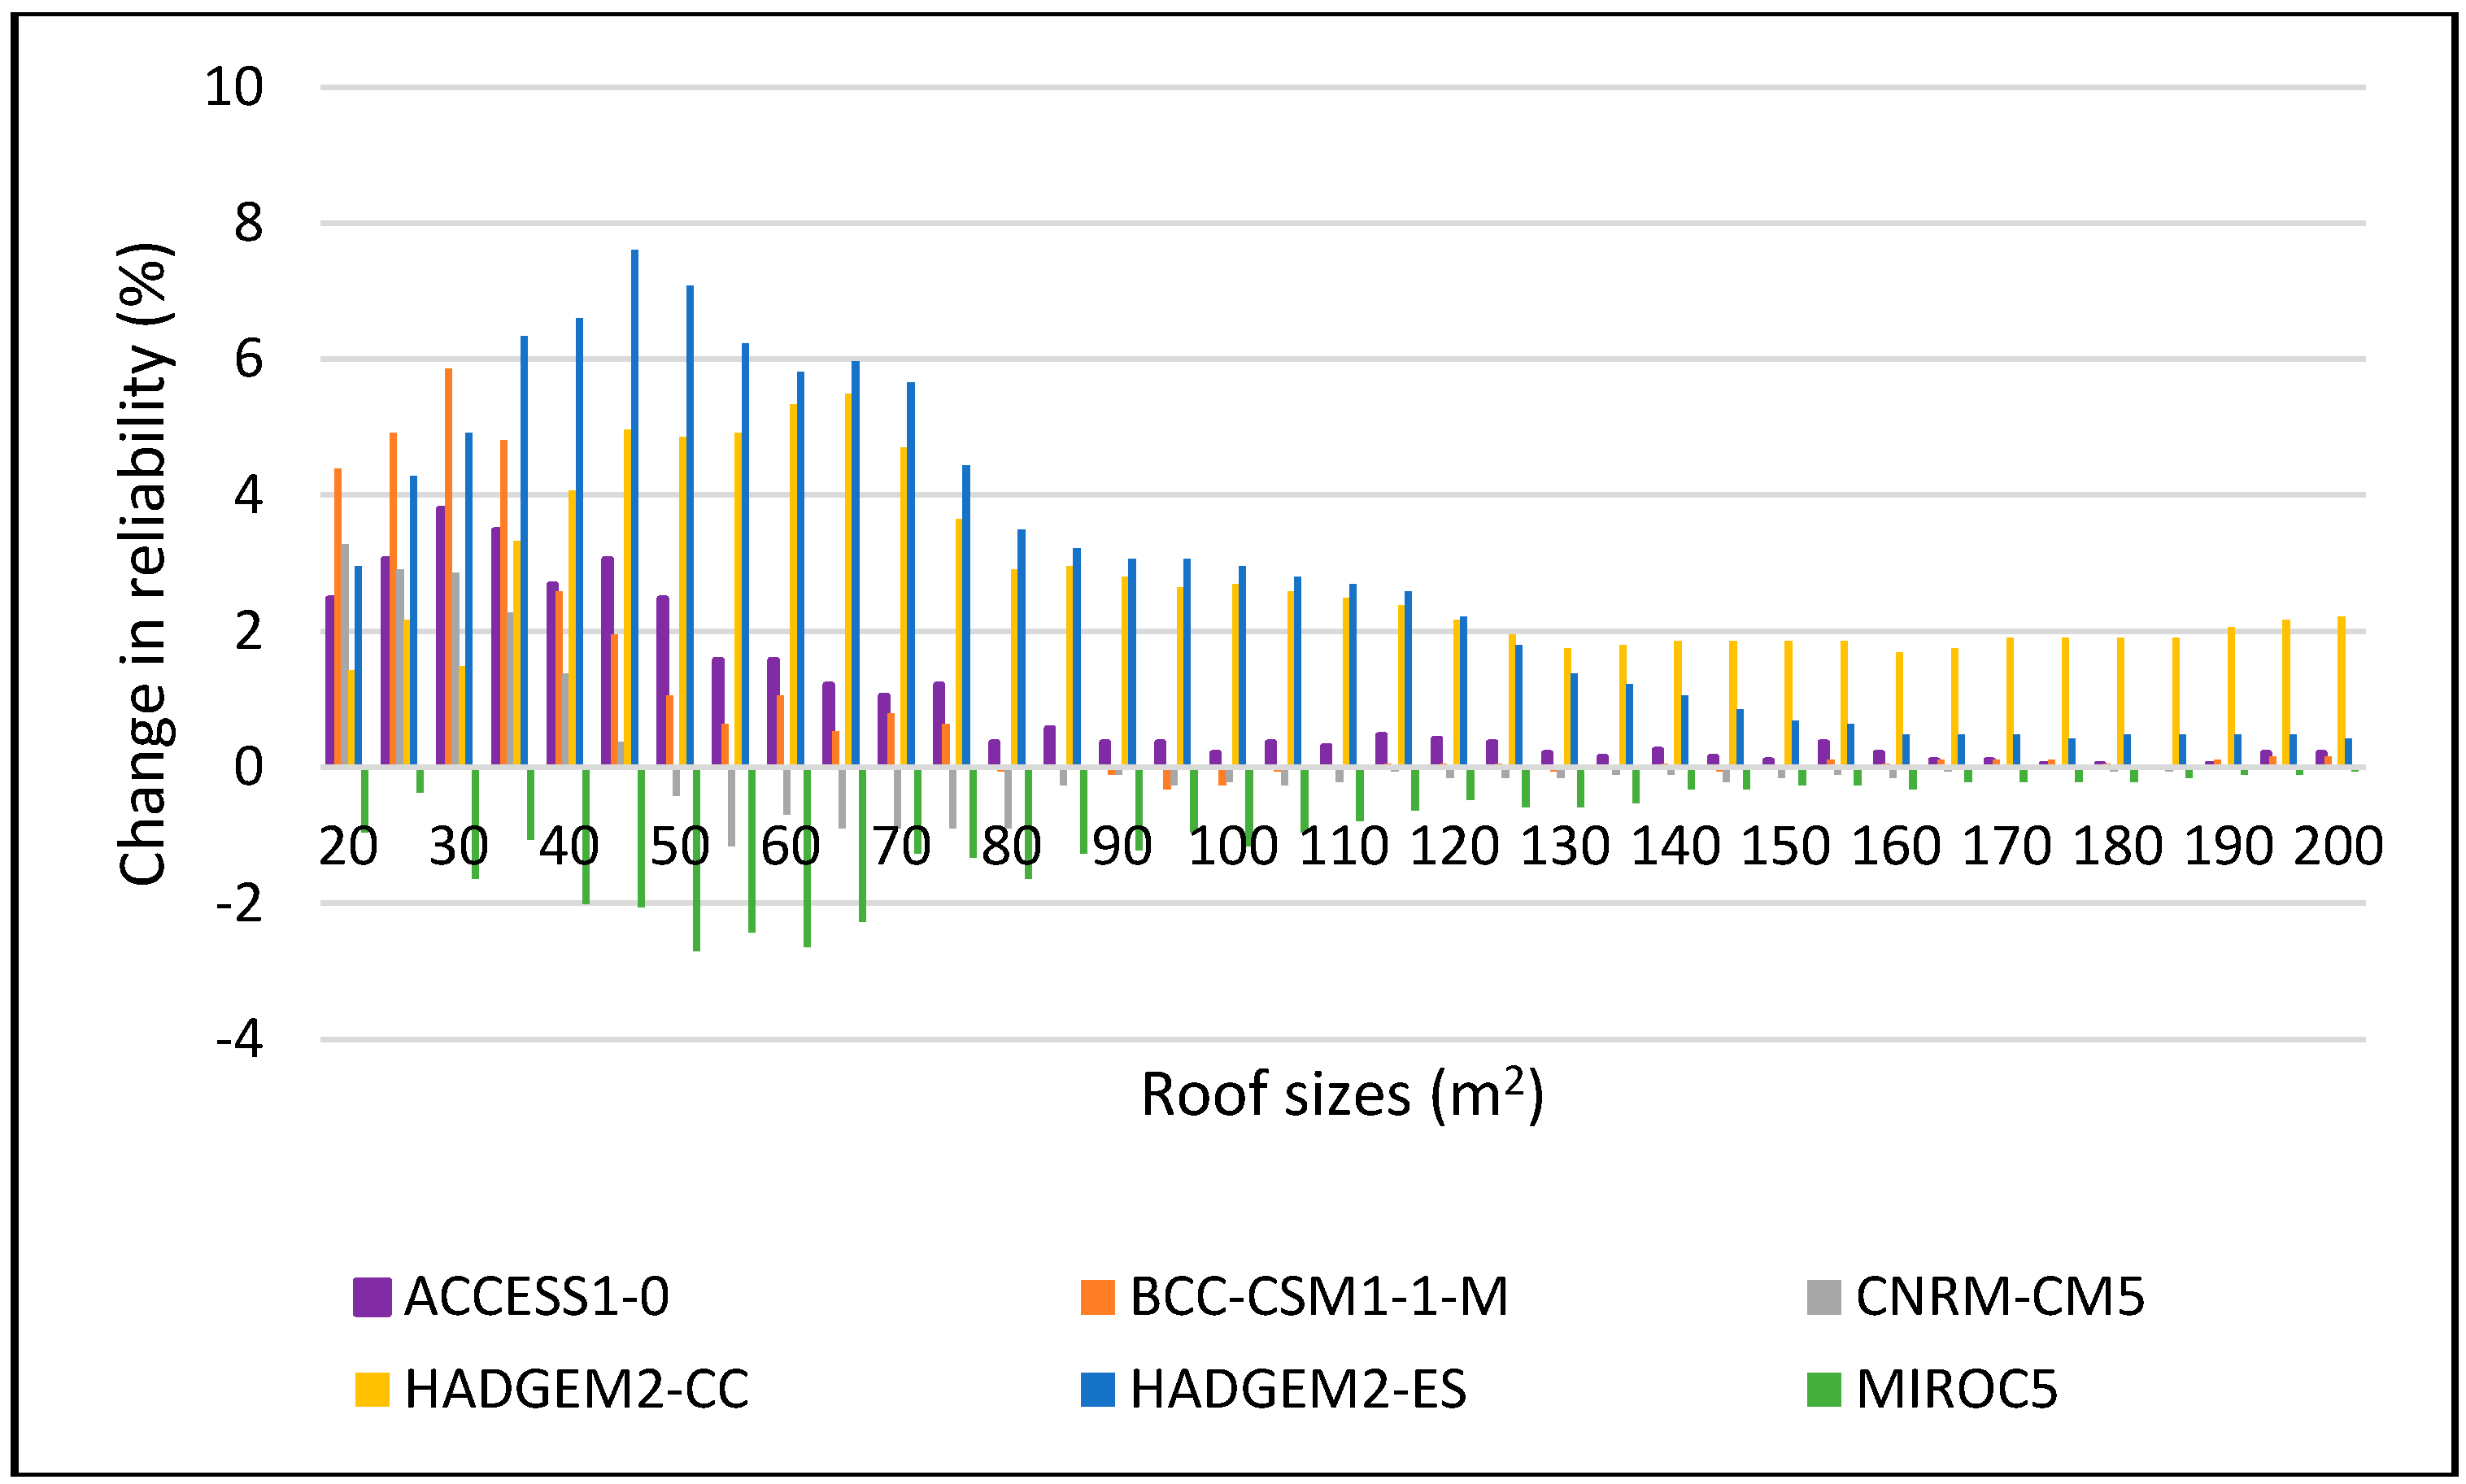
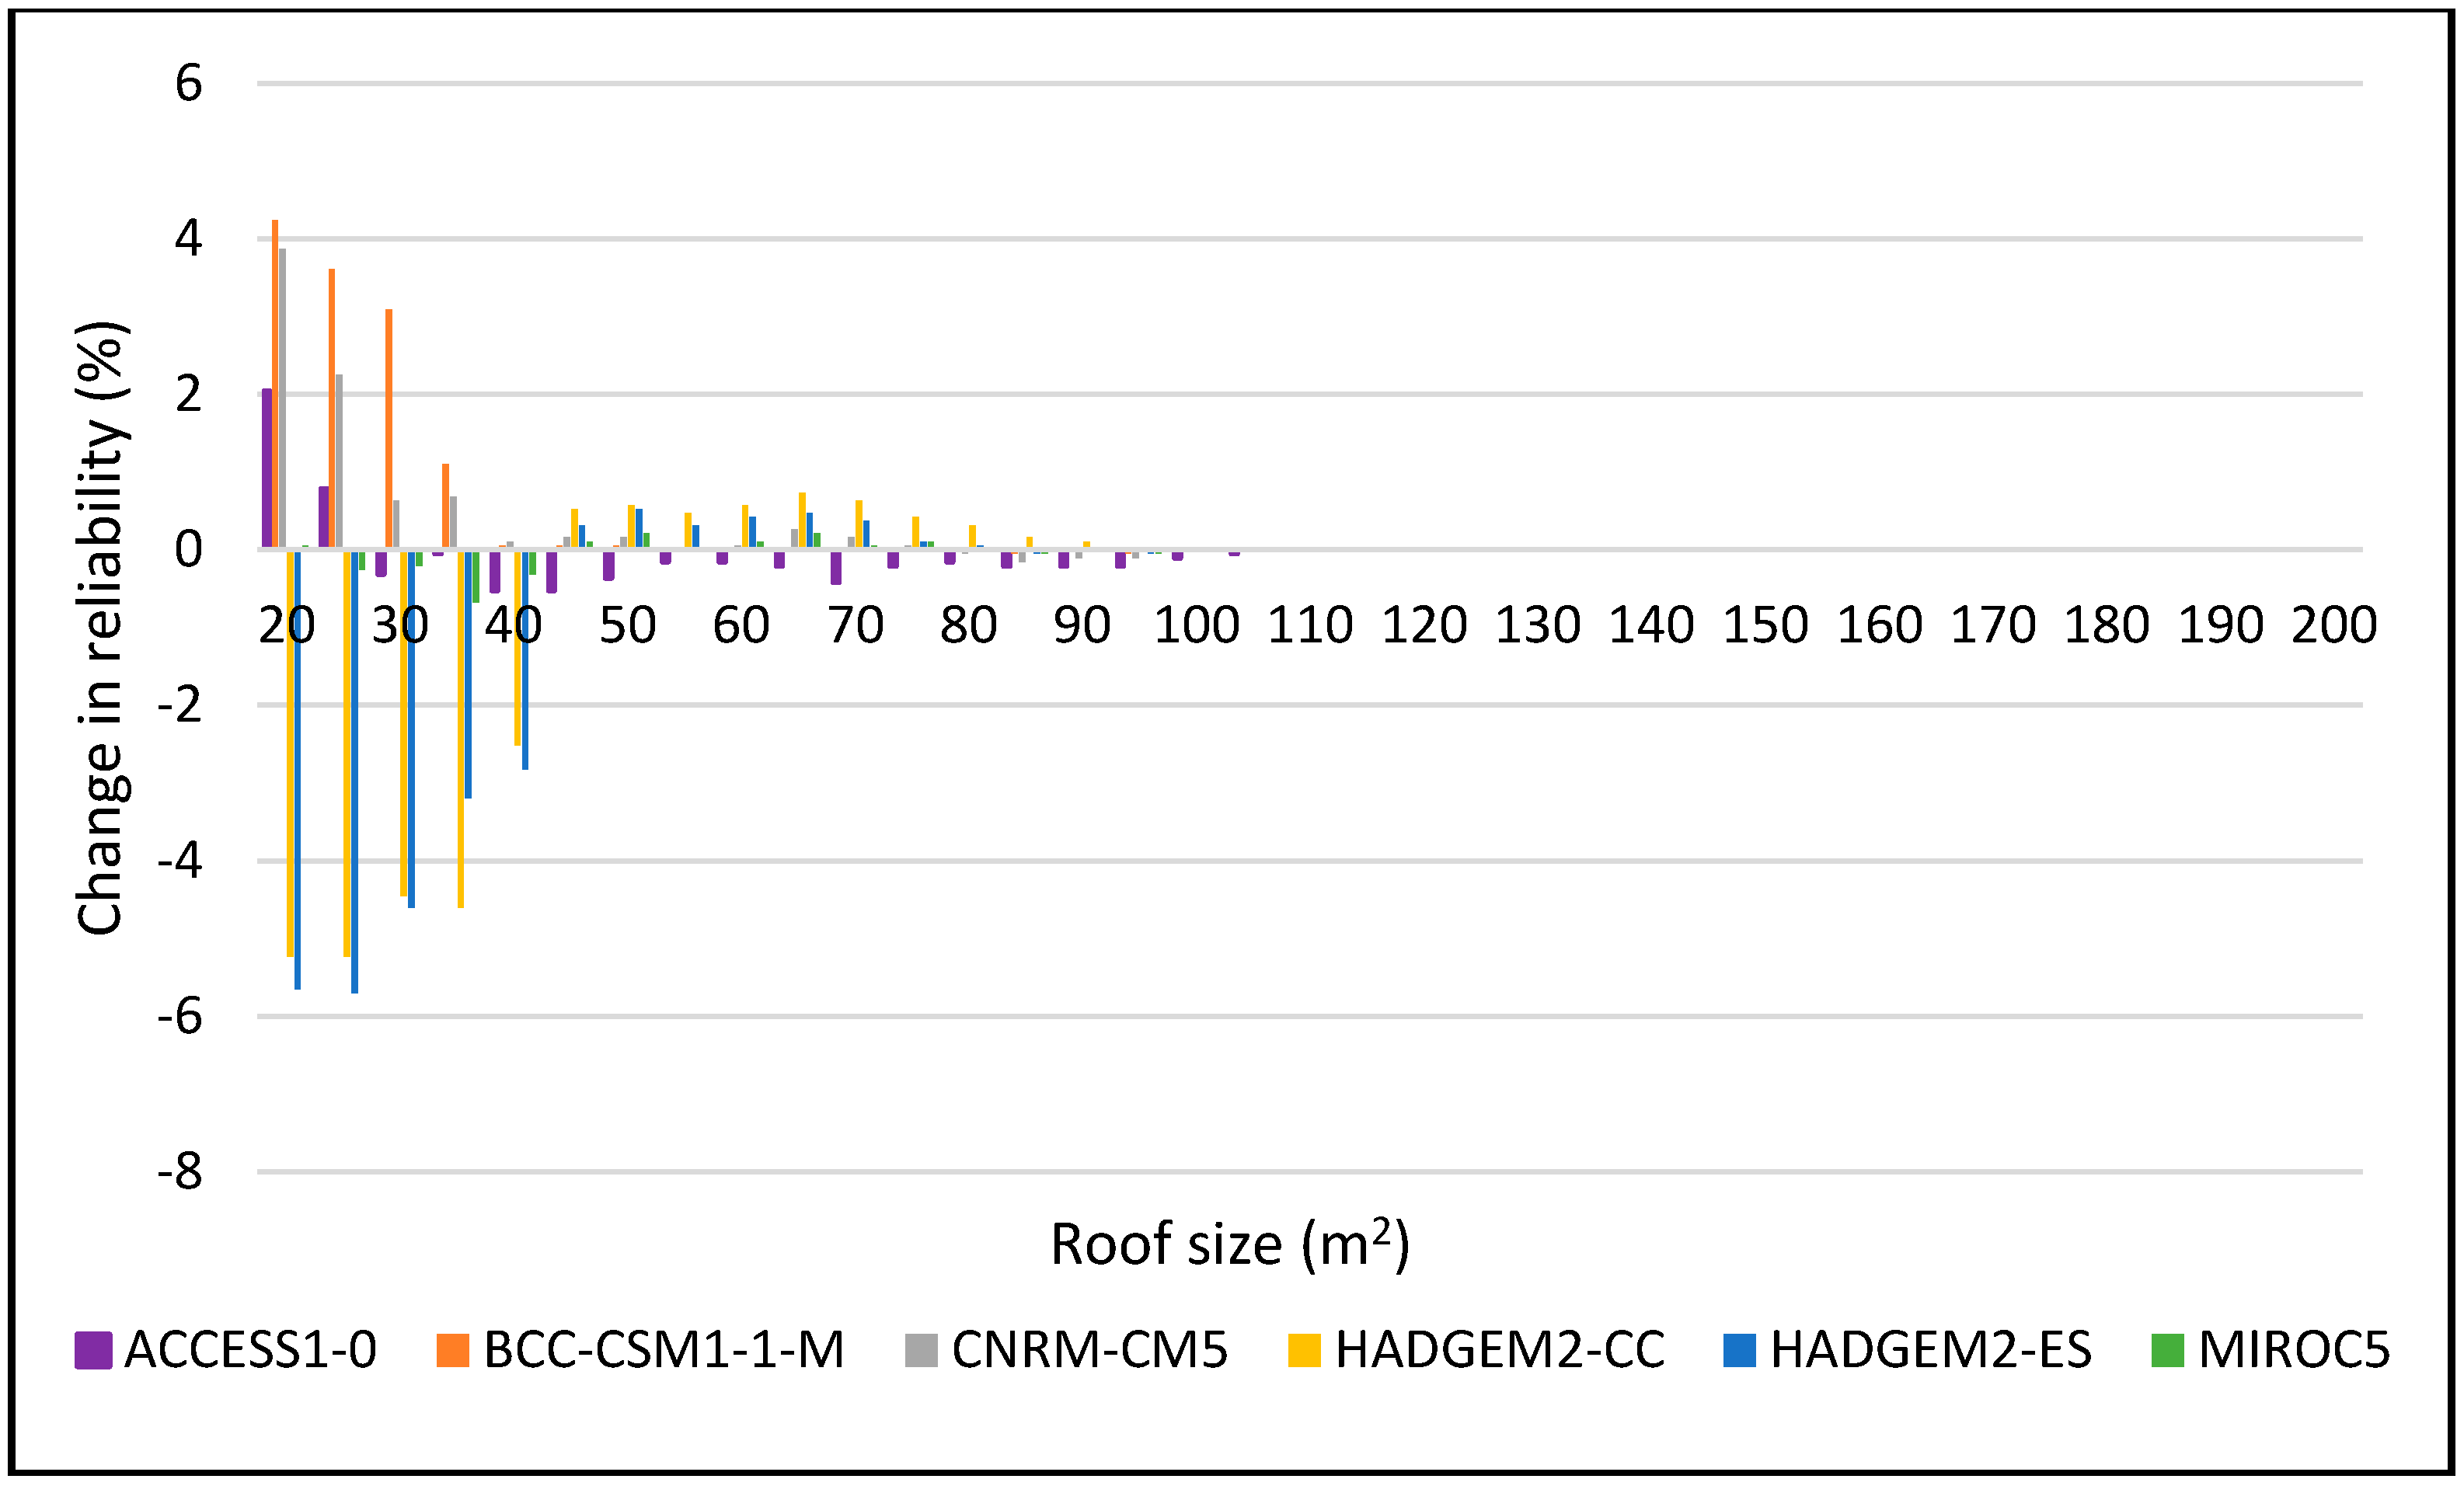
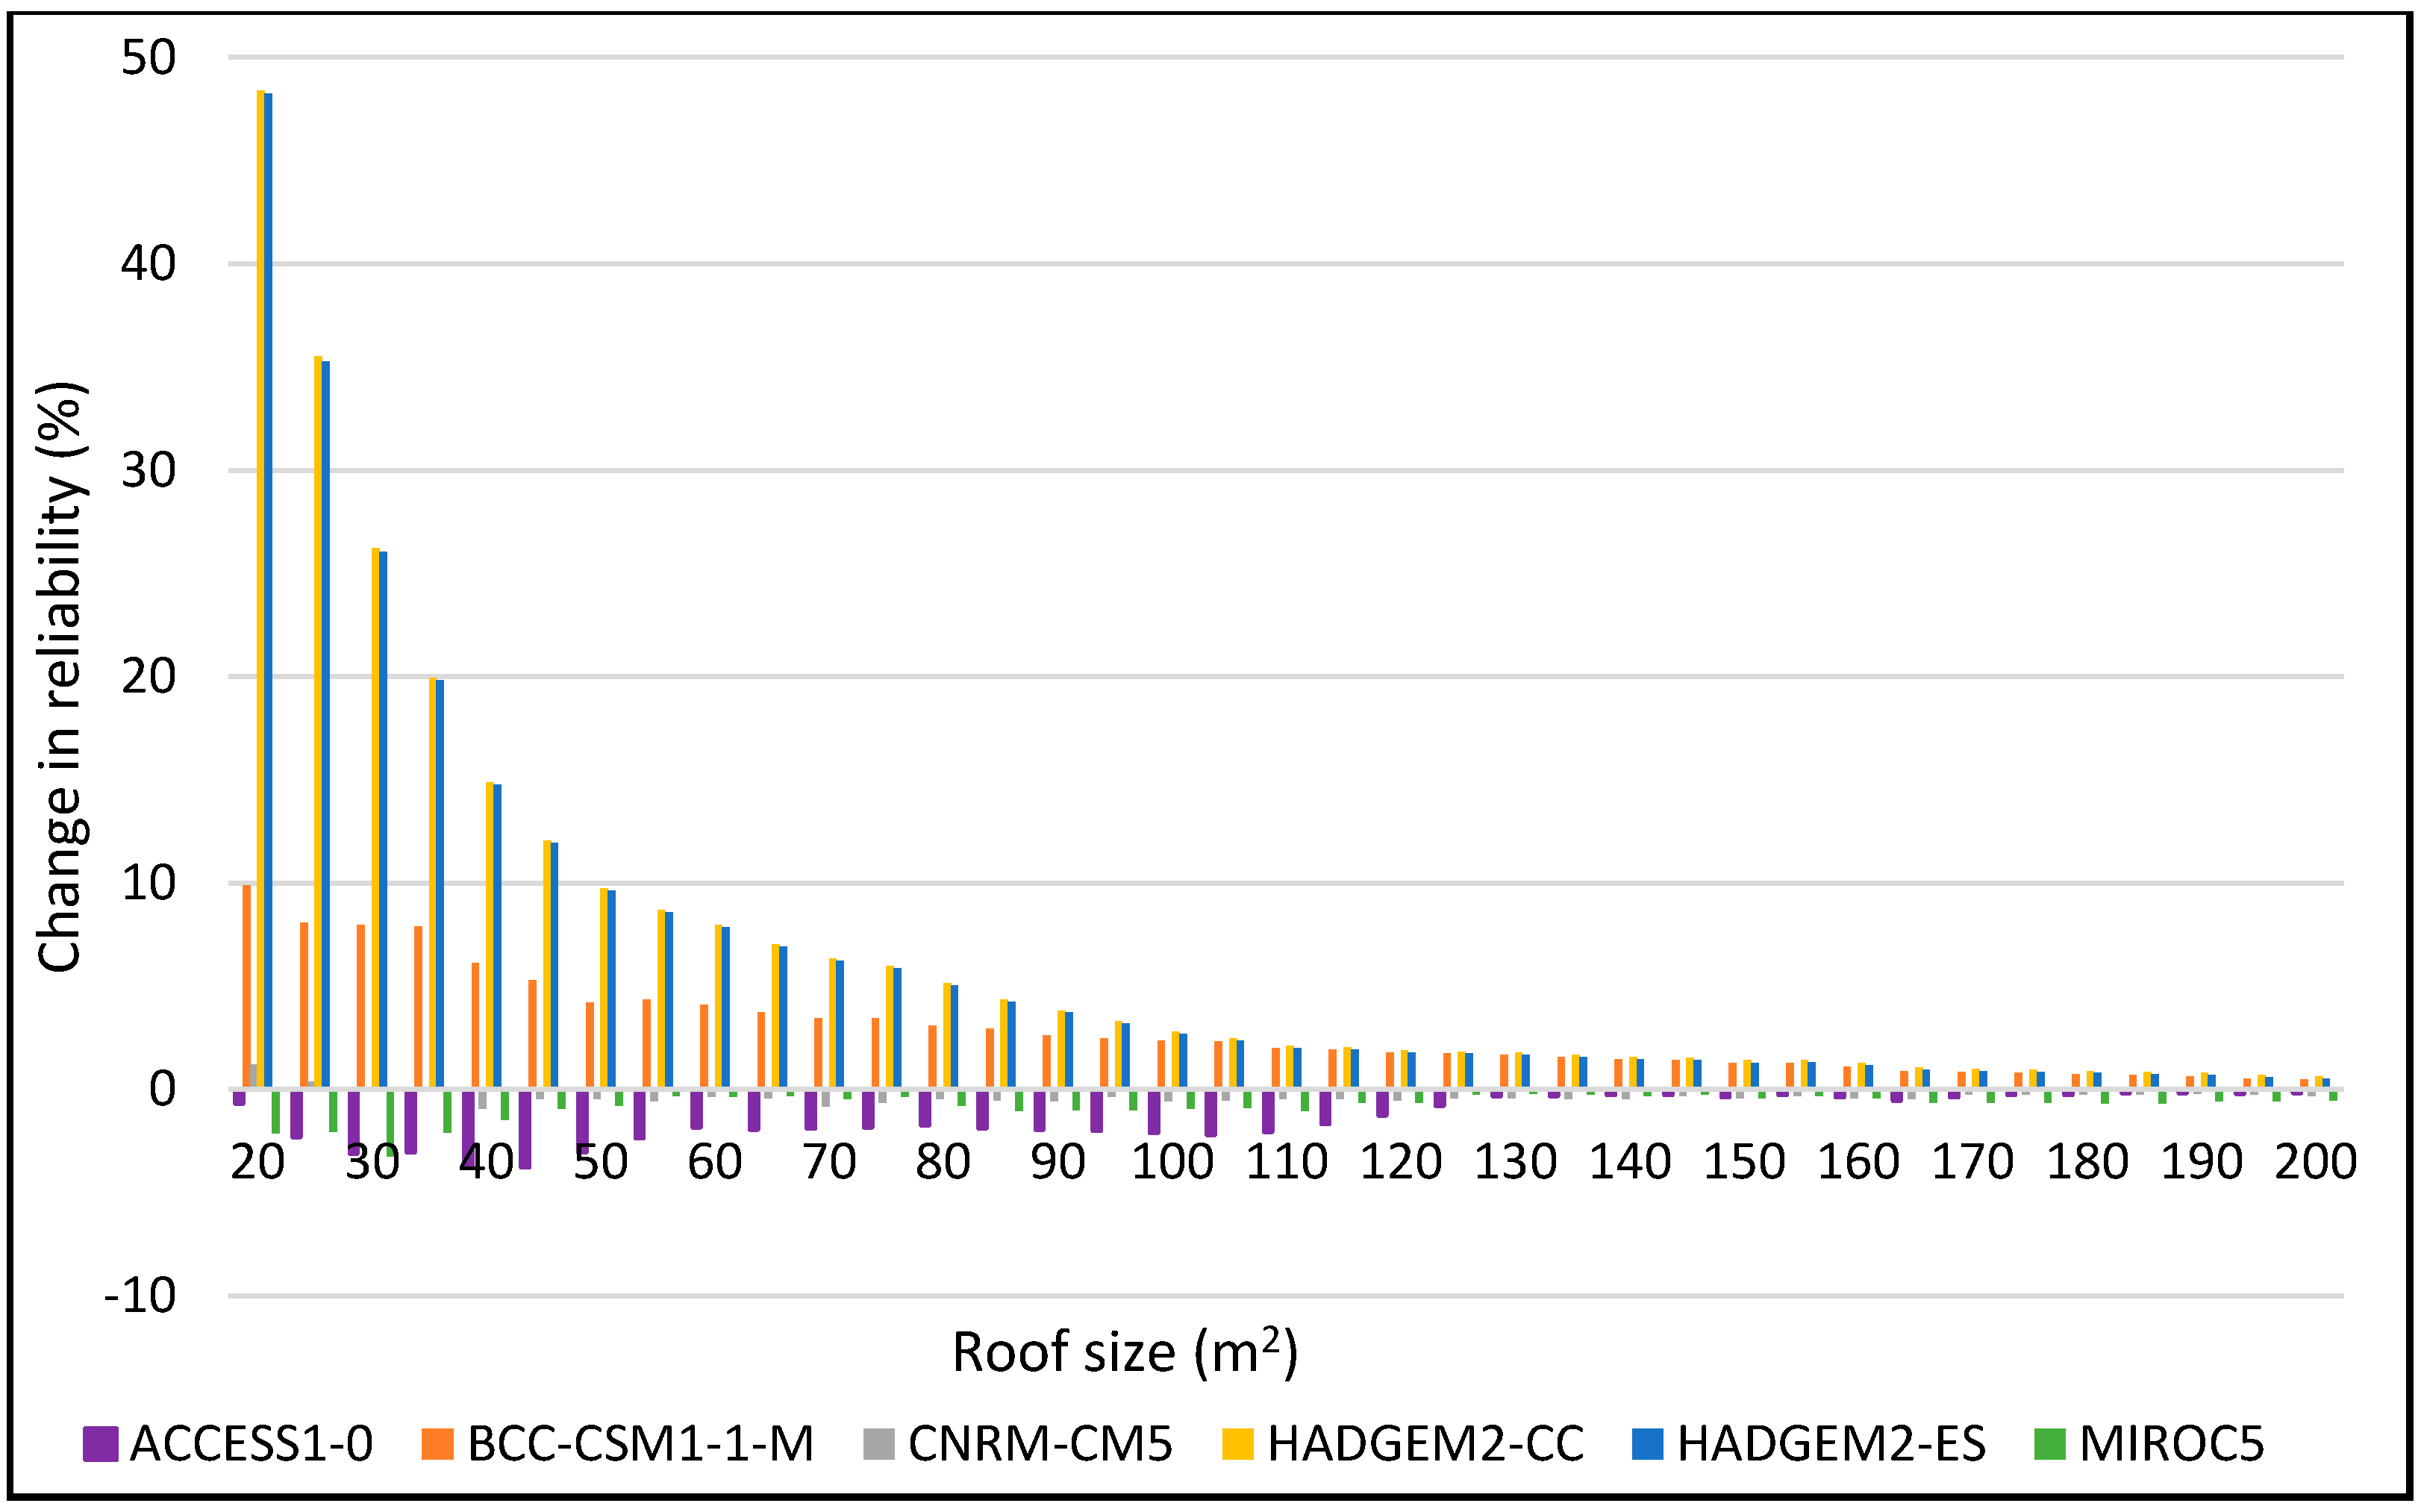
Water 10 00071 g008
Figure 9. Change in reliability for DJF 2025–2055 period for 5 m3.
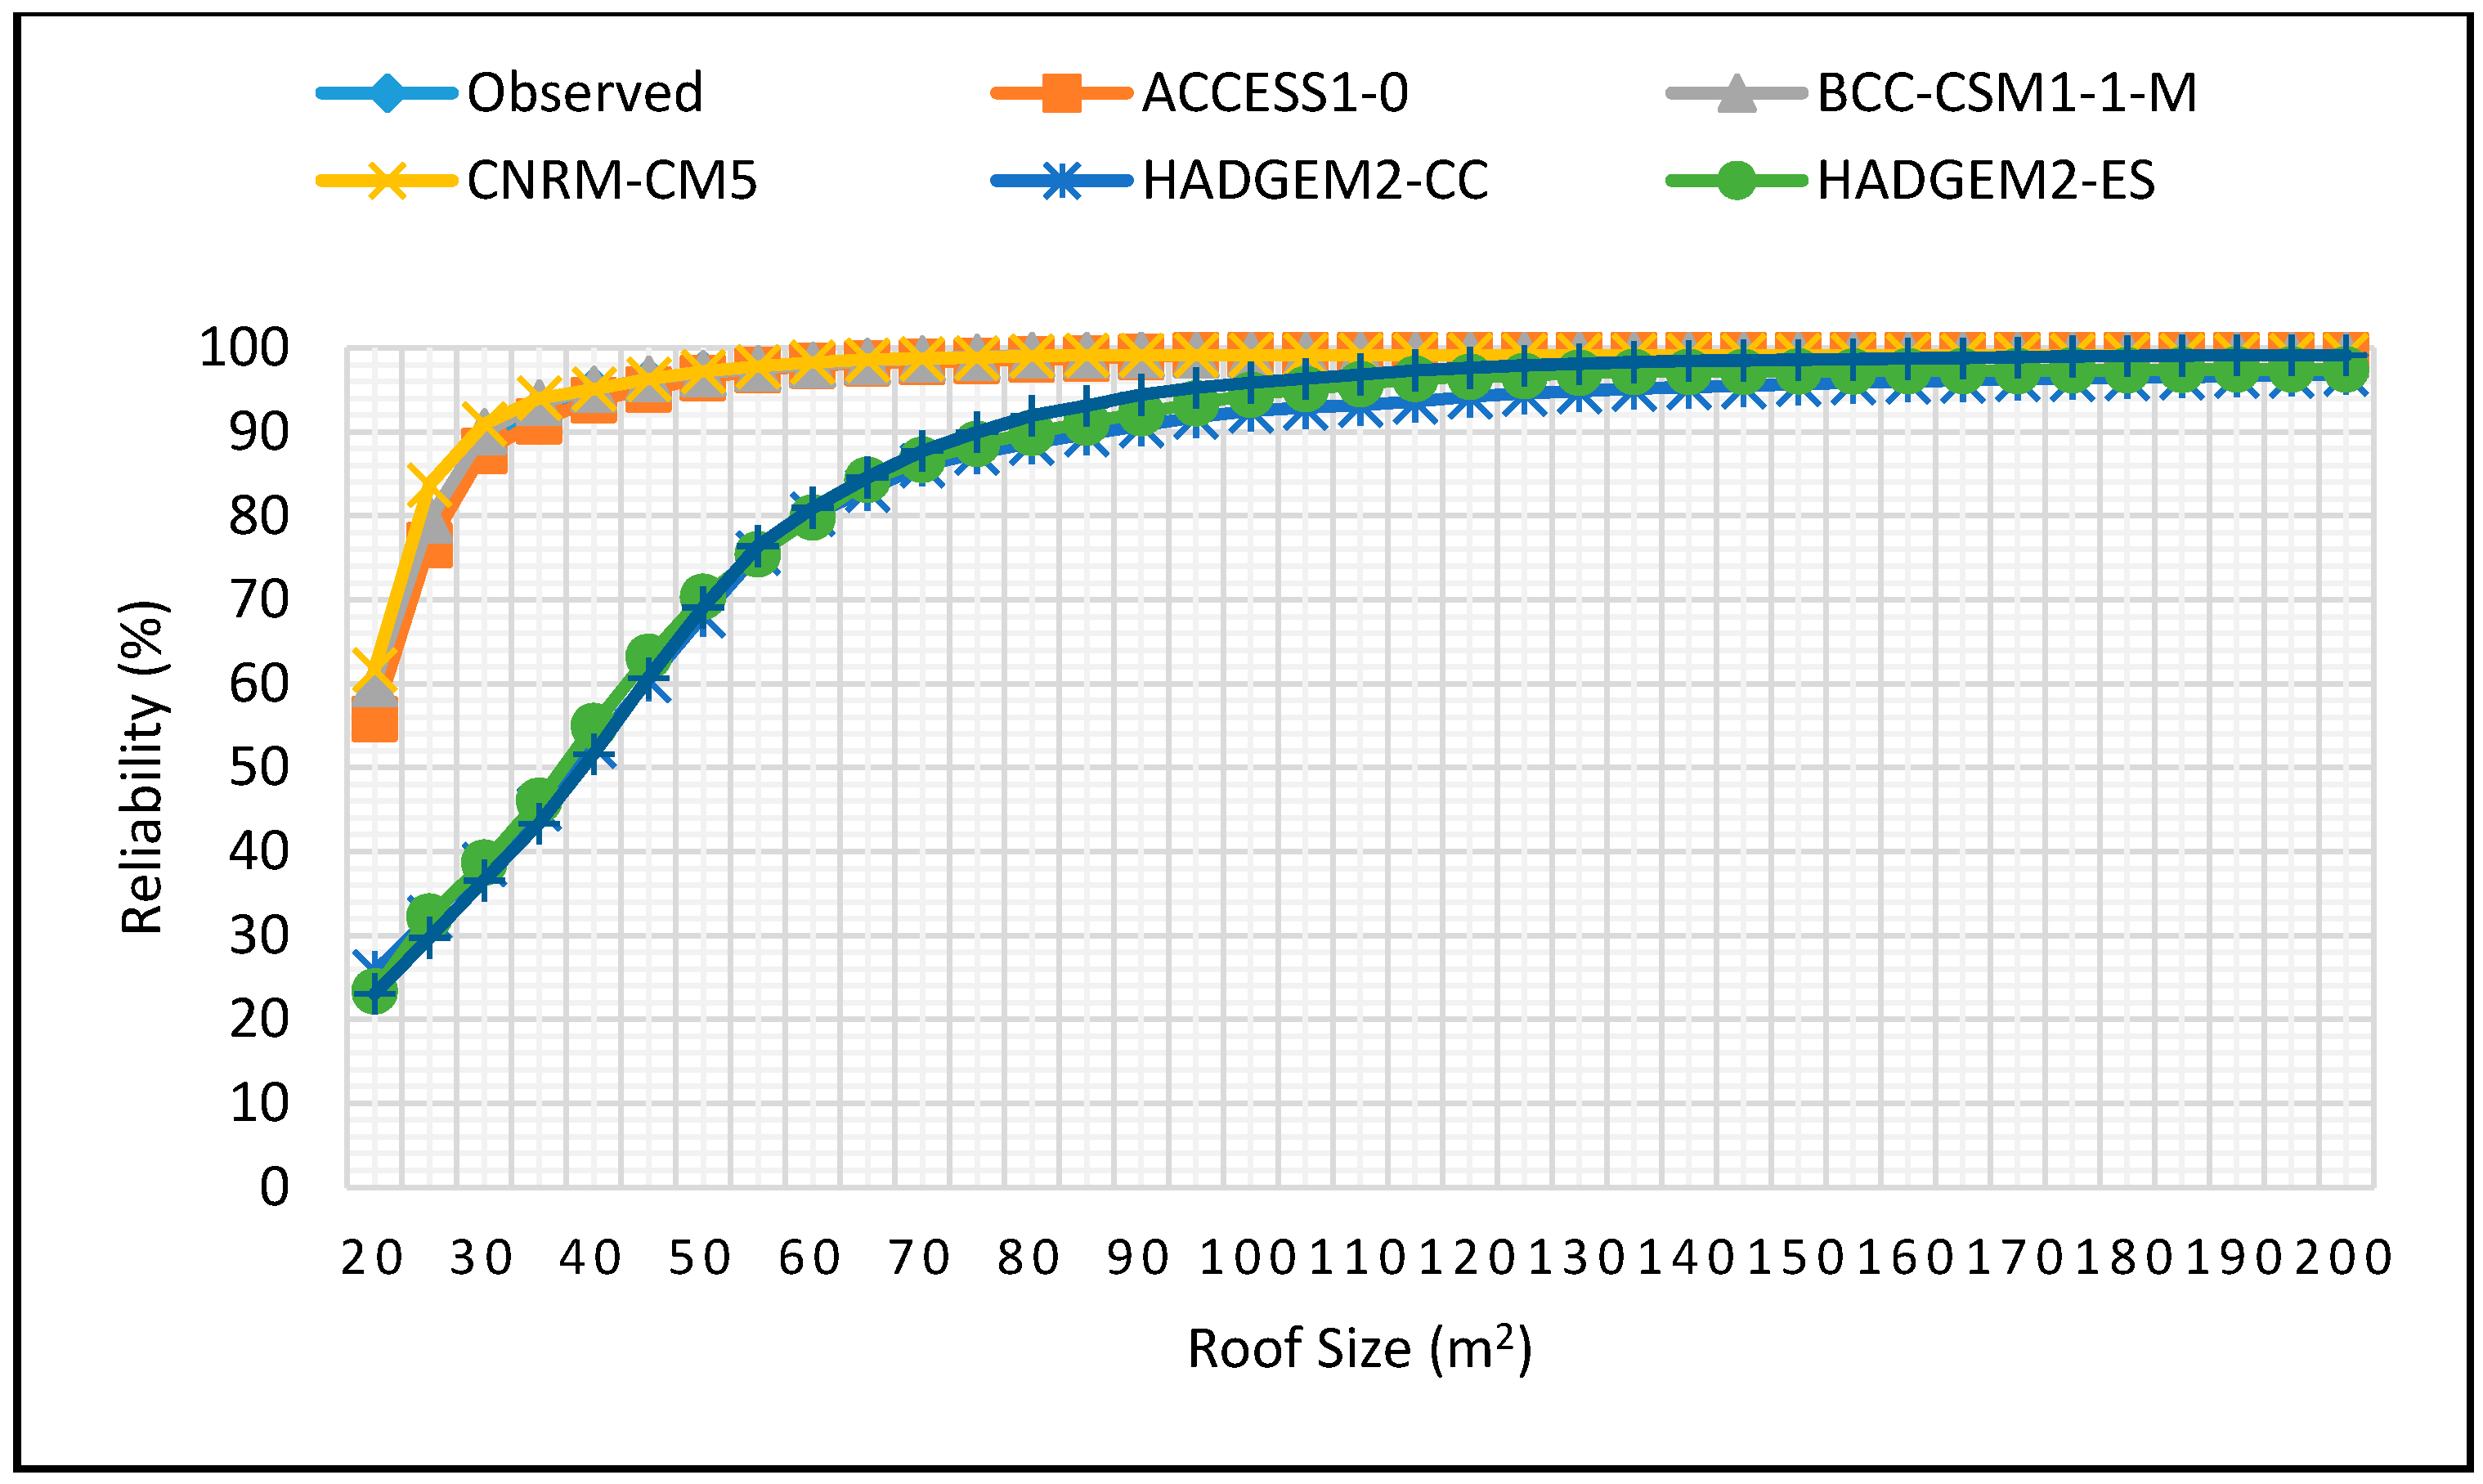
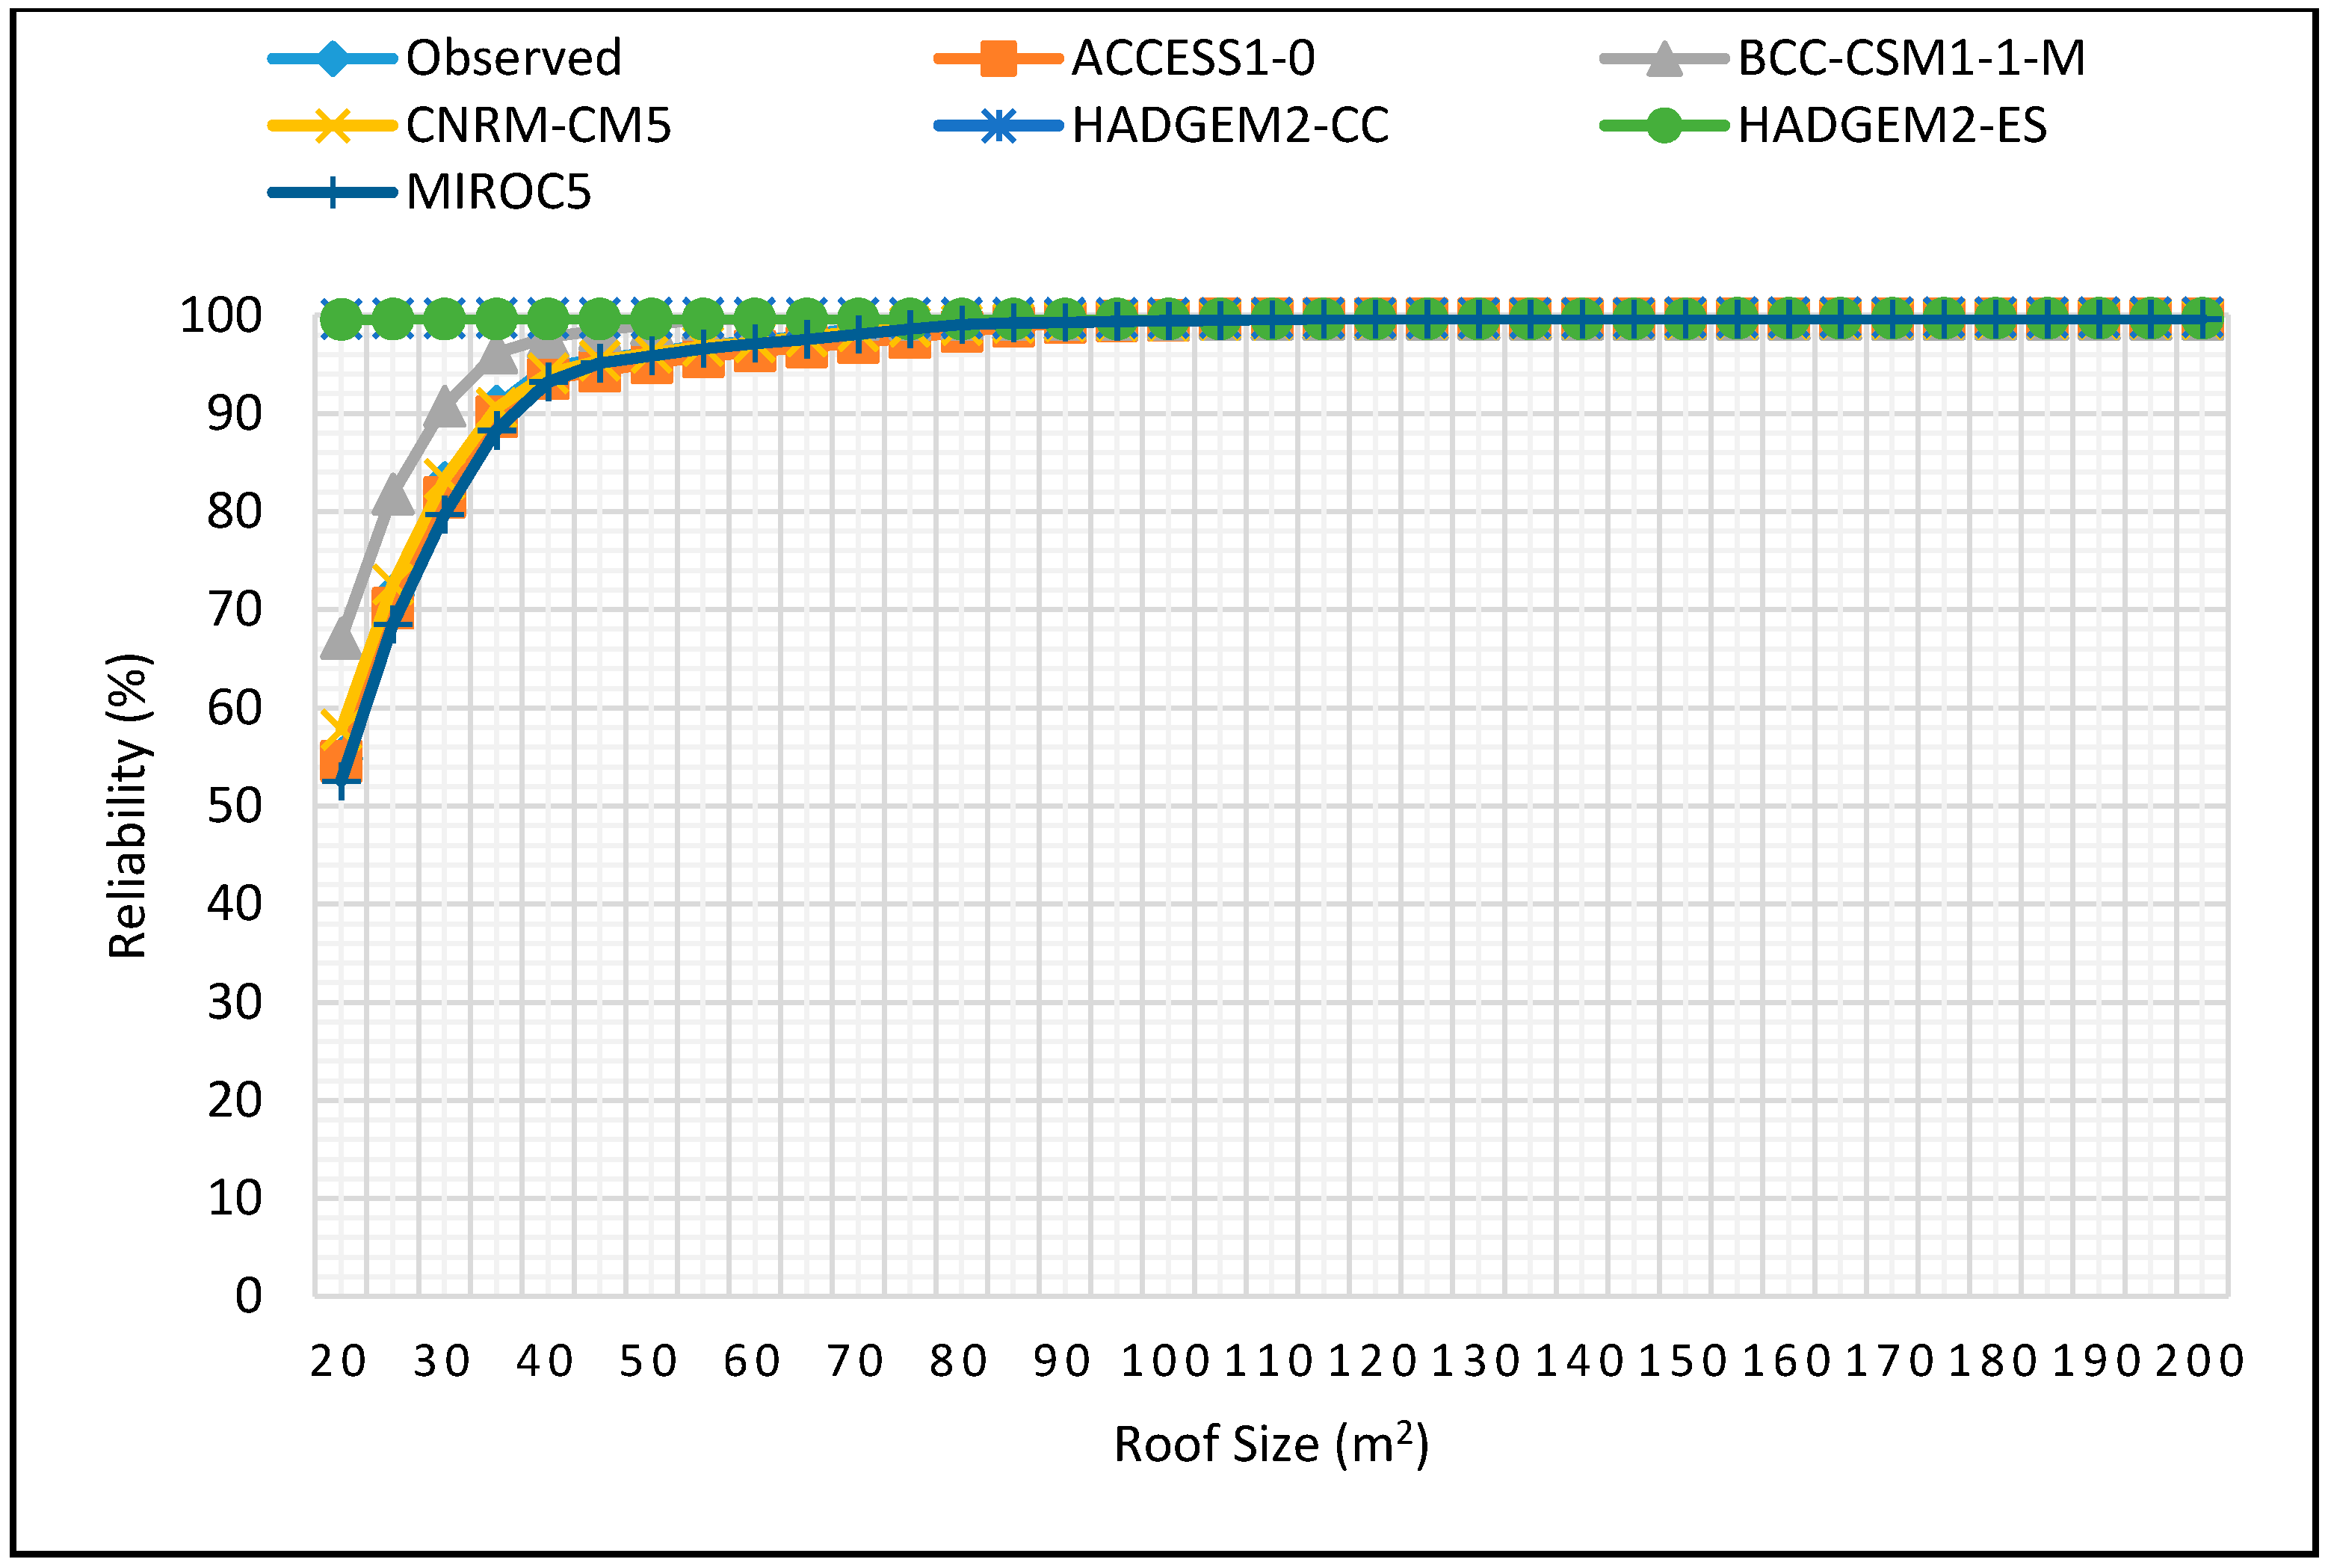
Water 10 00071 g009
Figure 10. Reliability projections for DJF season for 0.5 m3 tank size for 2025–2055.
Water 10 00071 g010
Figure 11. Reliability projections for DJF season for 1 m3 tank size for 2025–2055.
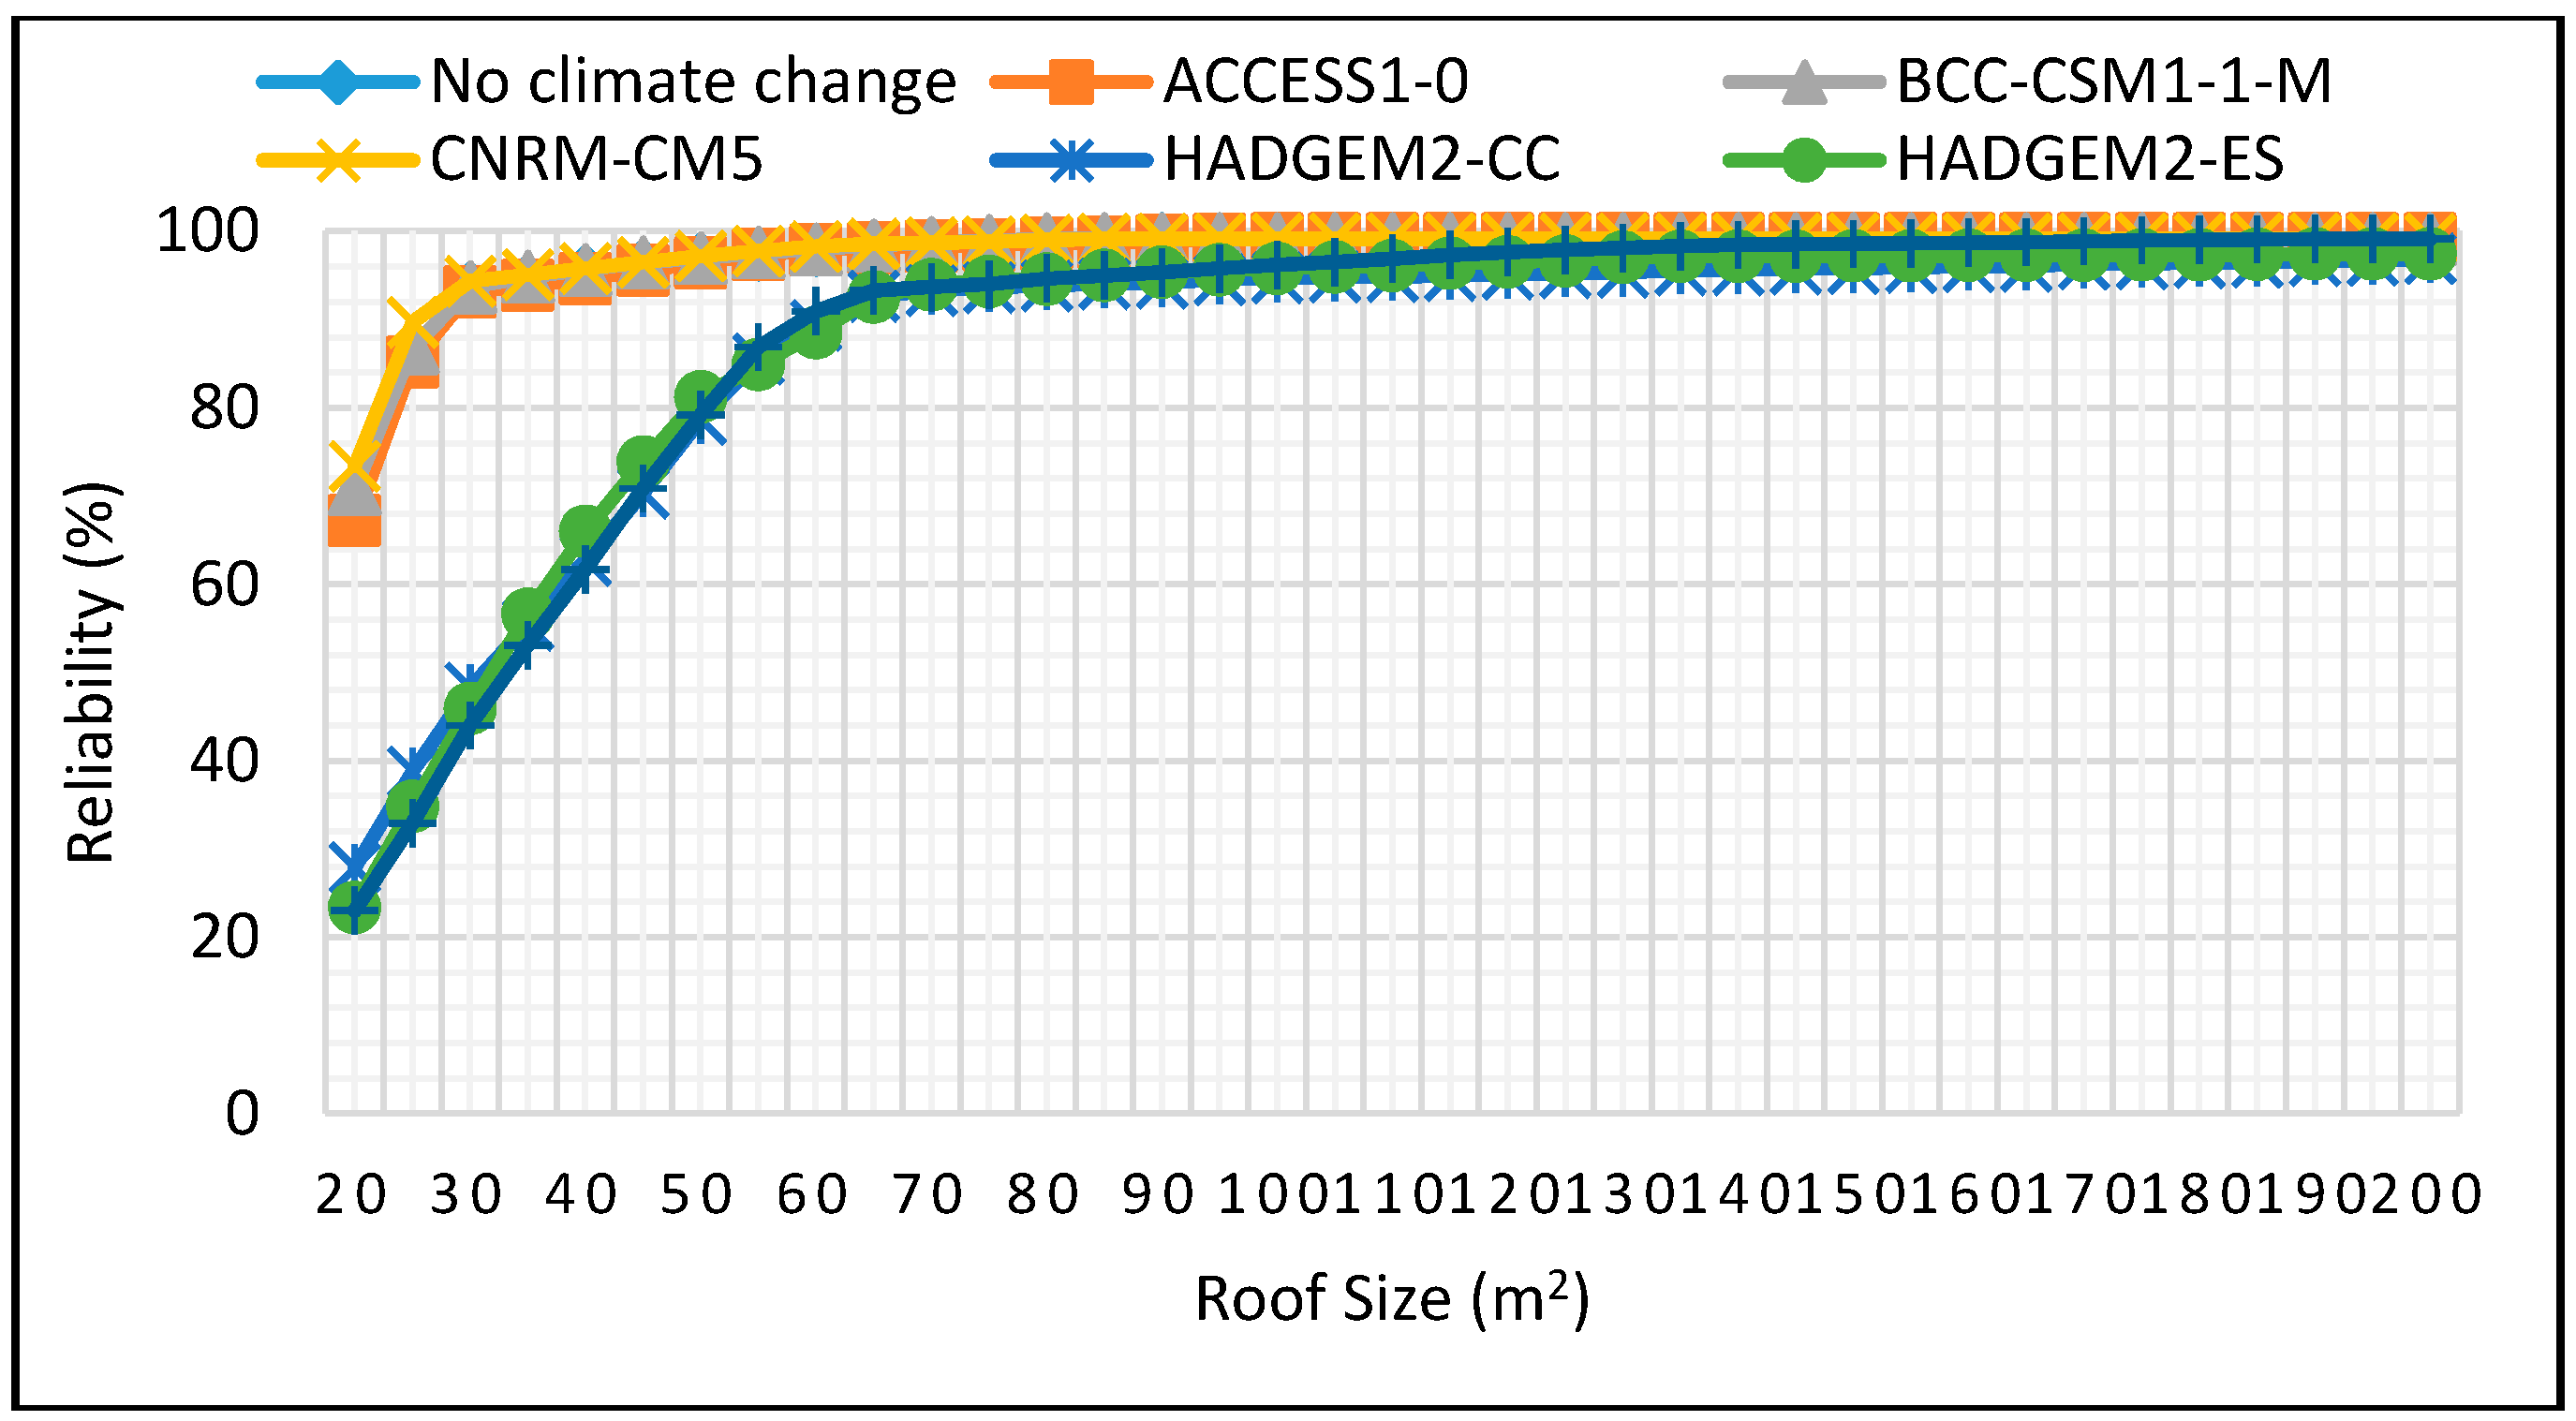
Water 10 00071 g011
Figure 12. Reliability projections for DJF season for 2 m3 tank size for 2025–2055.
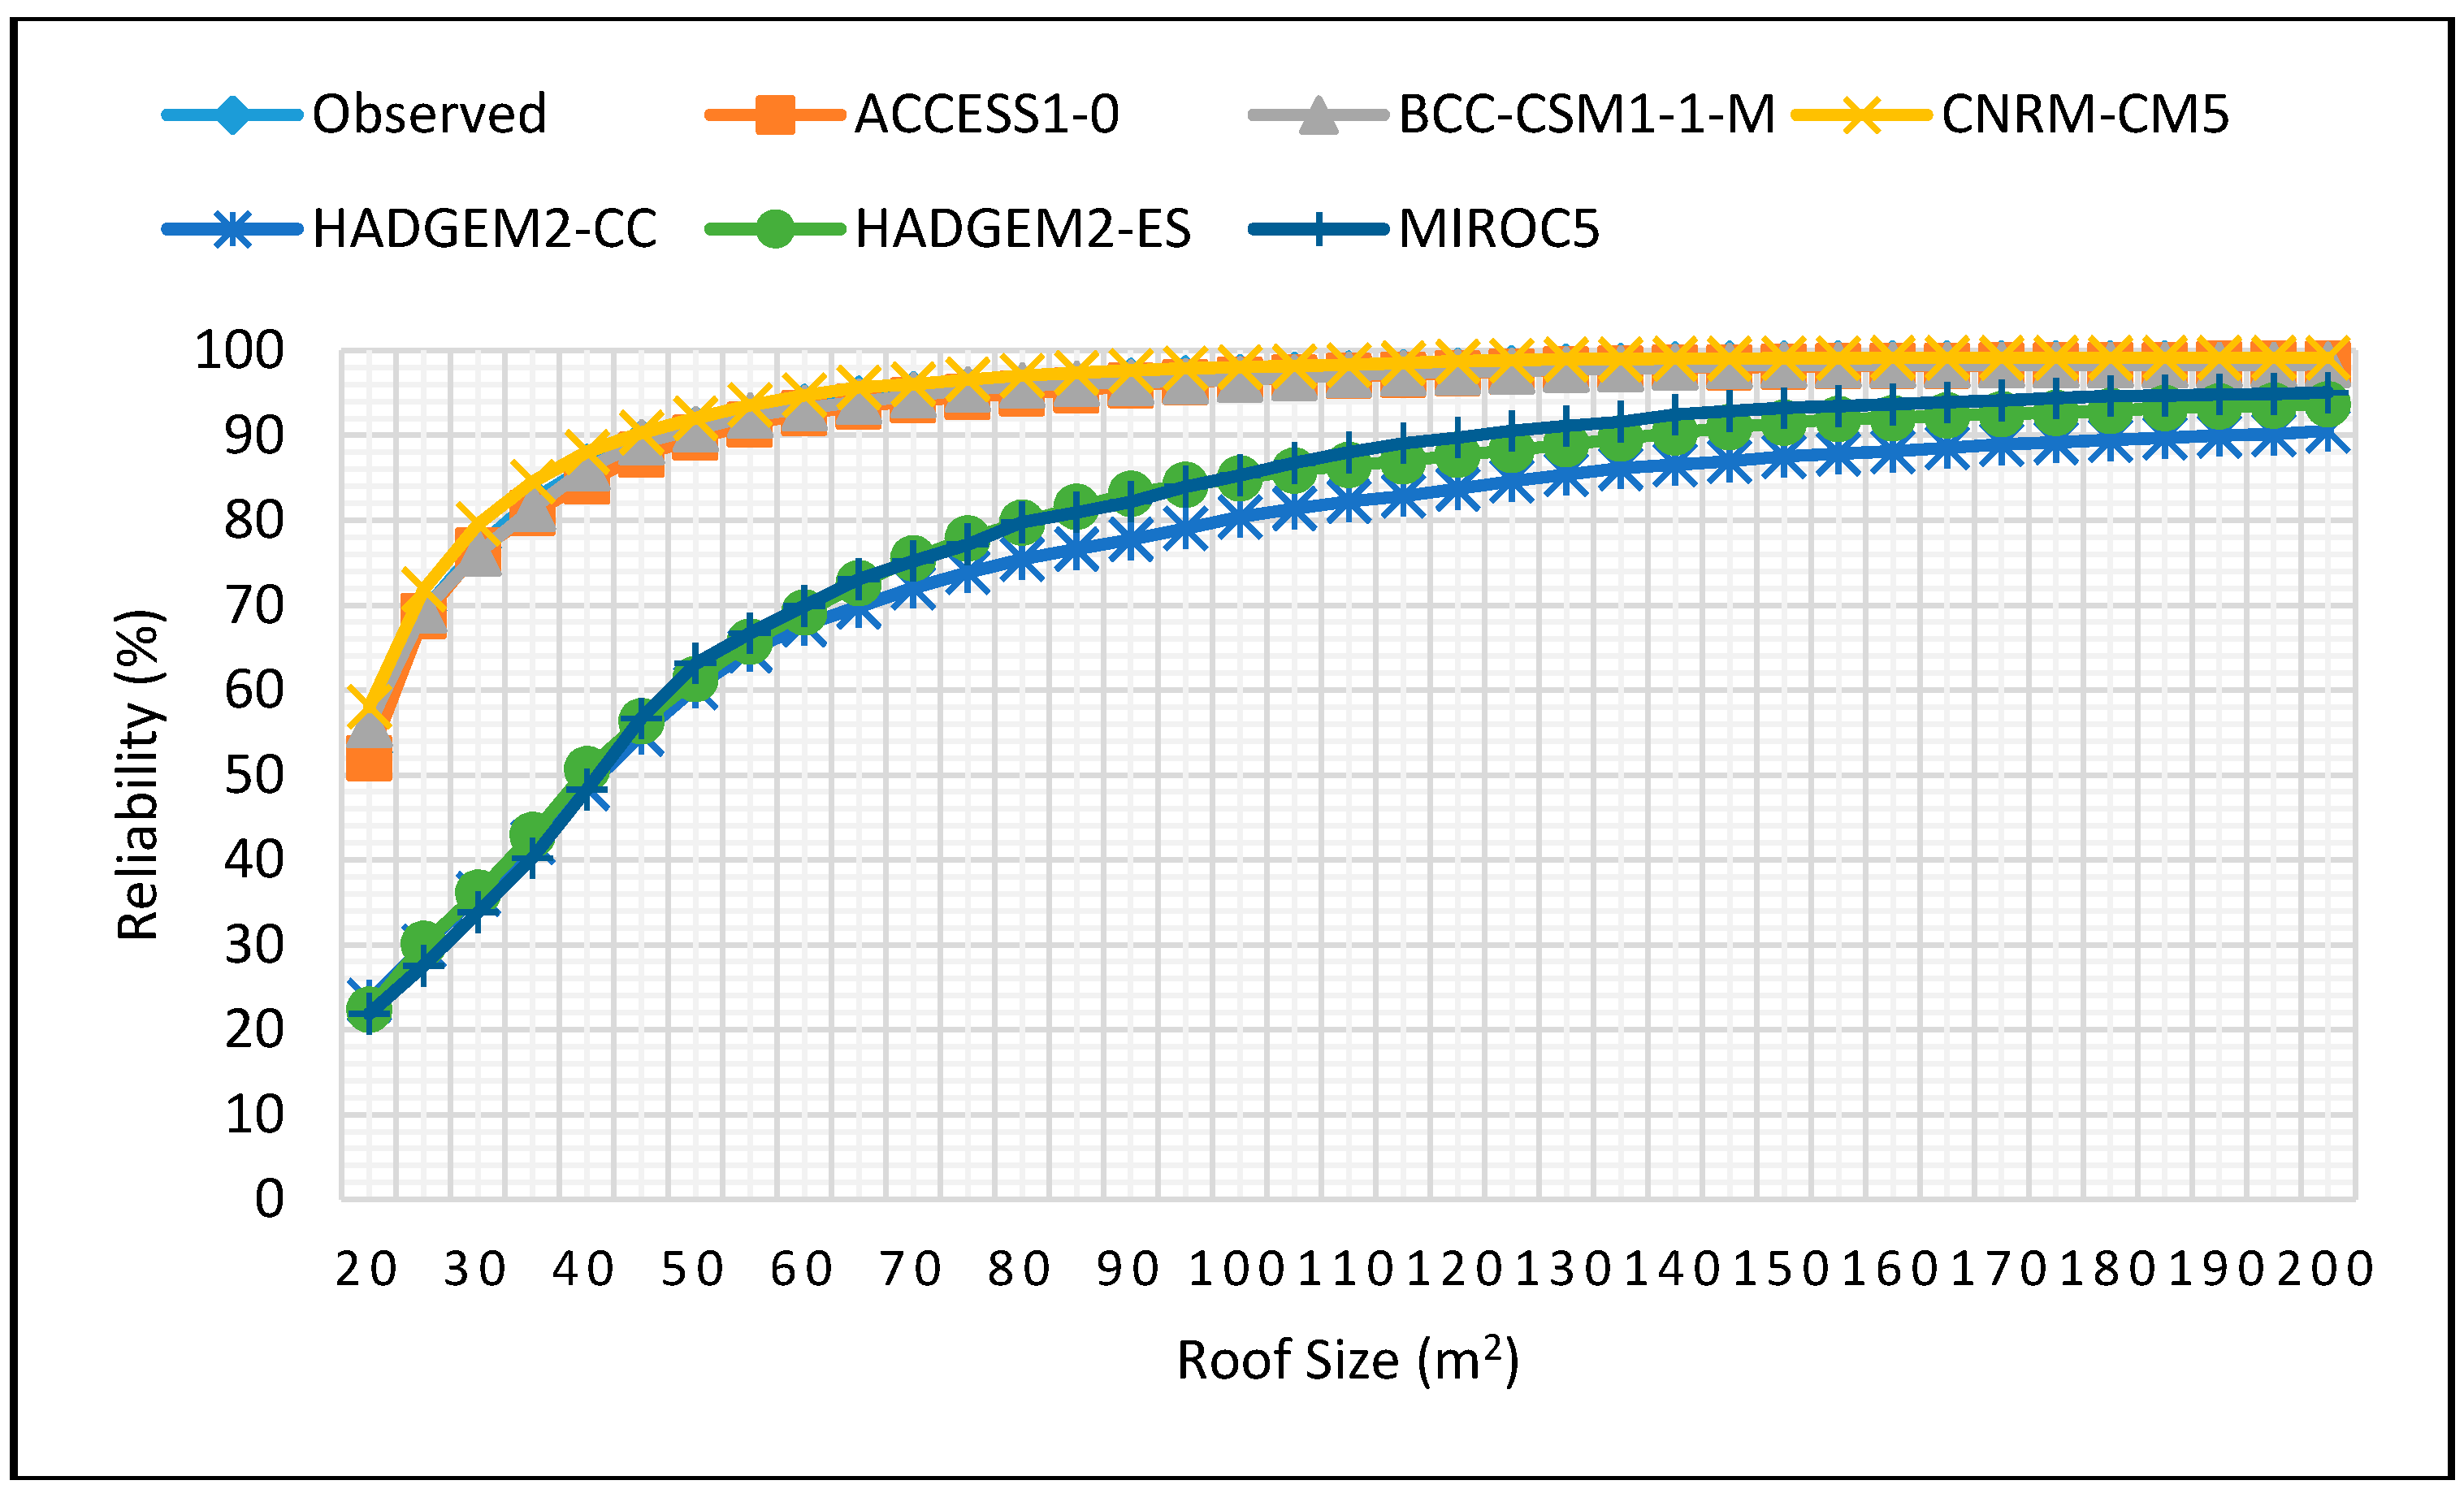
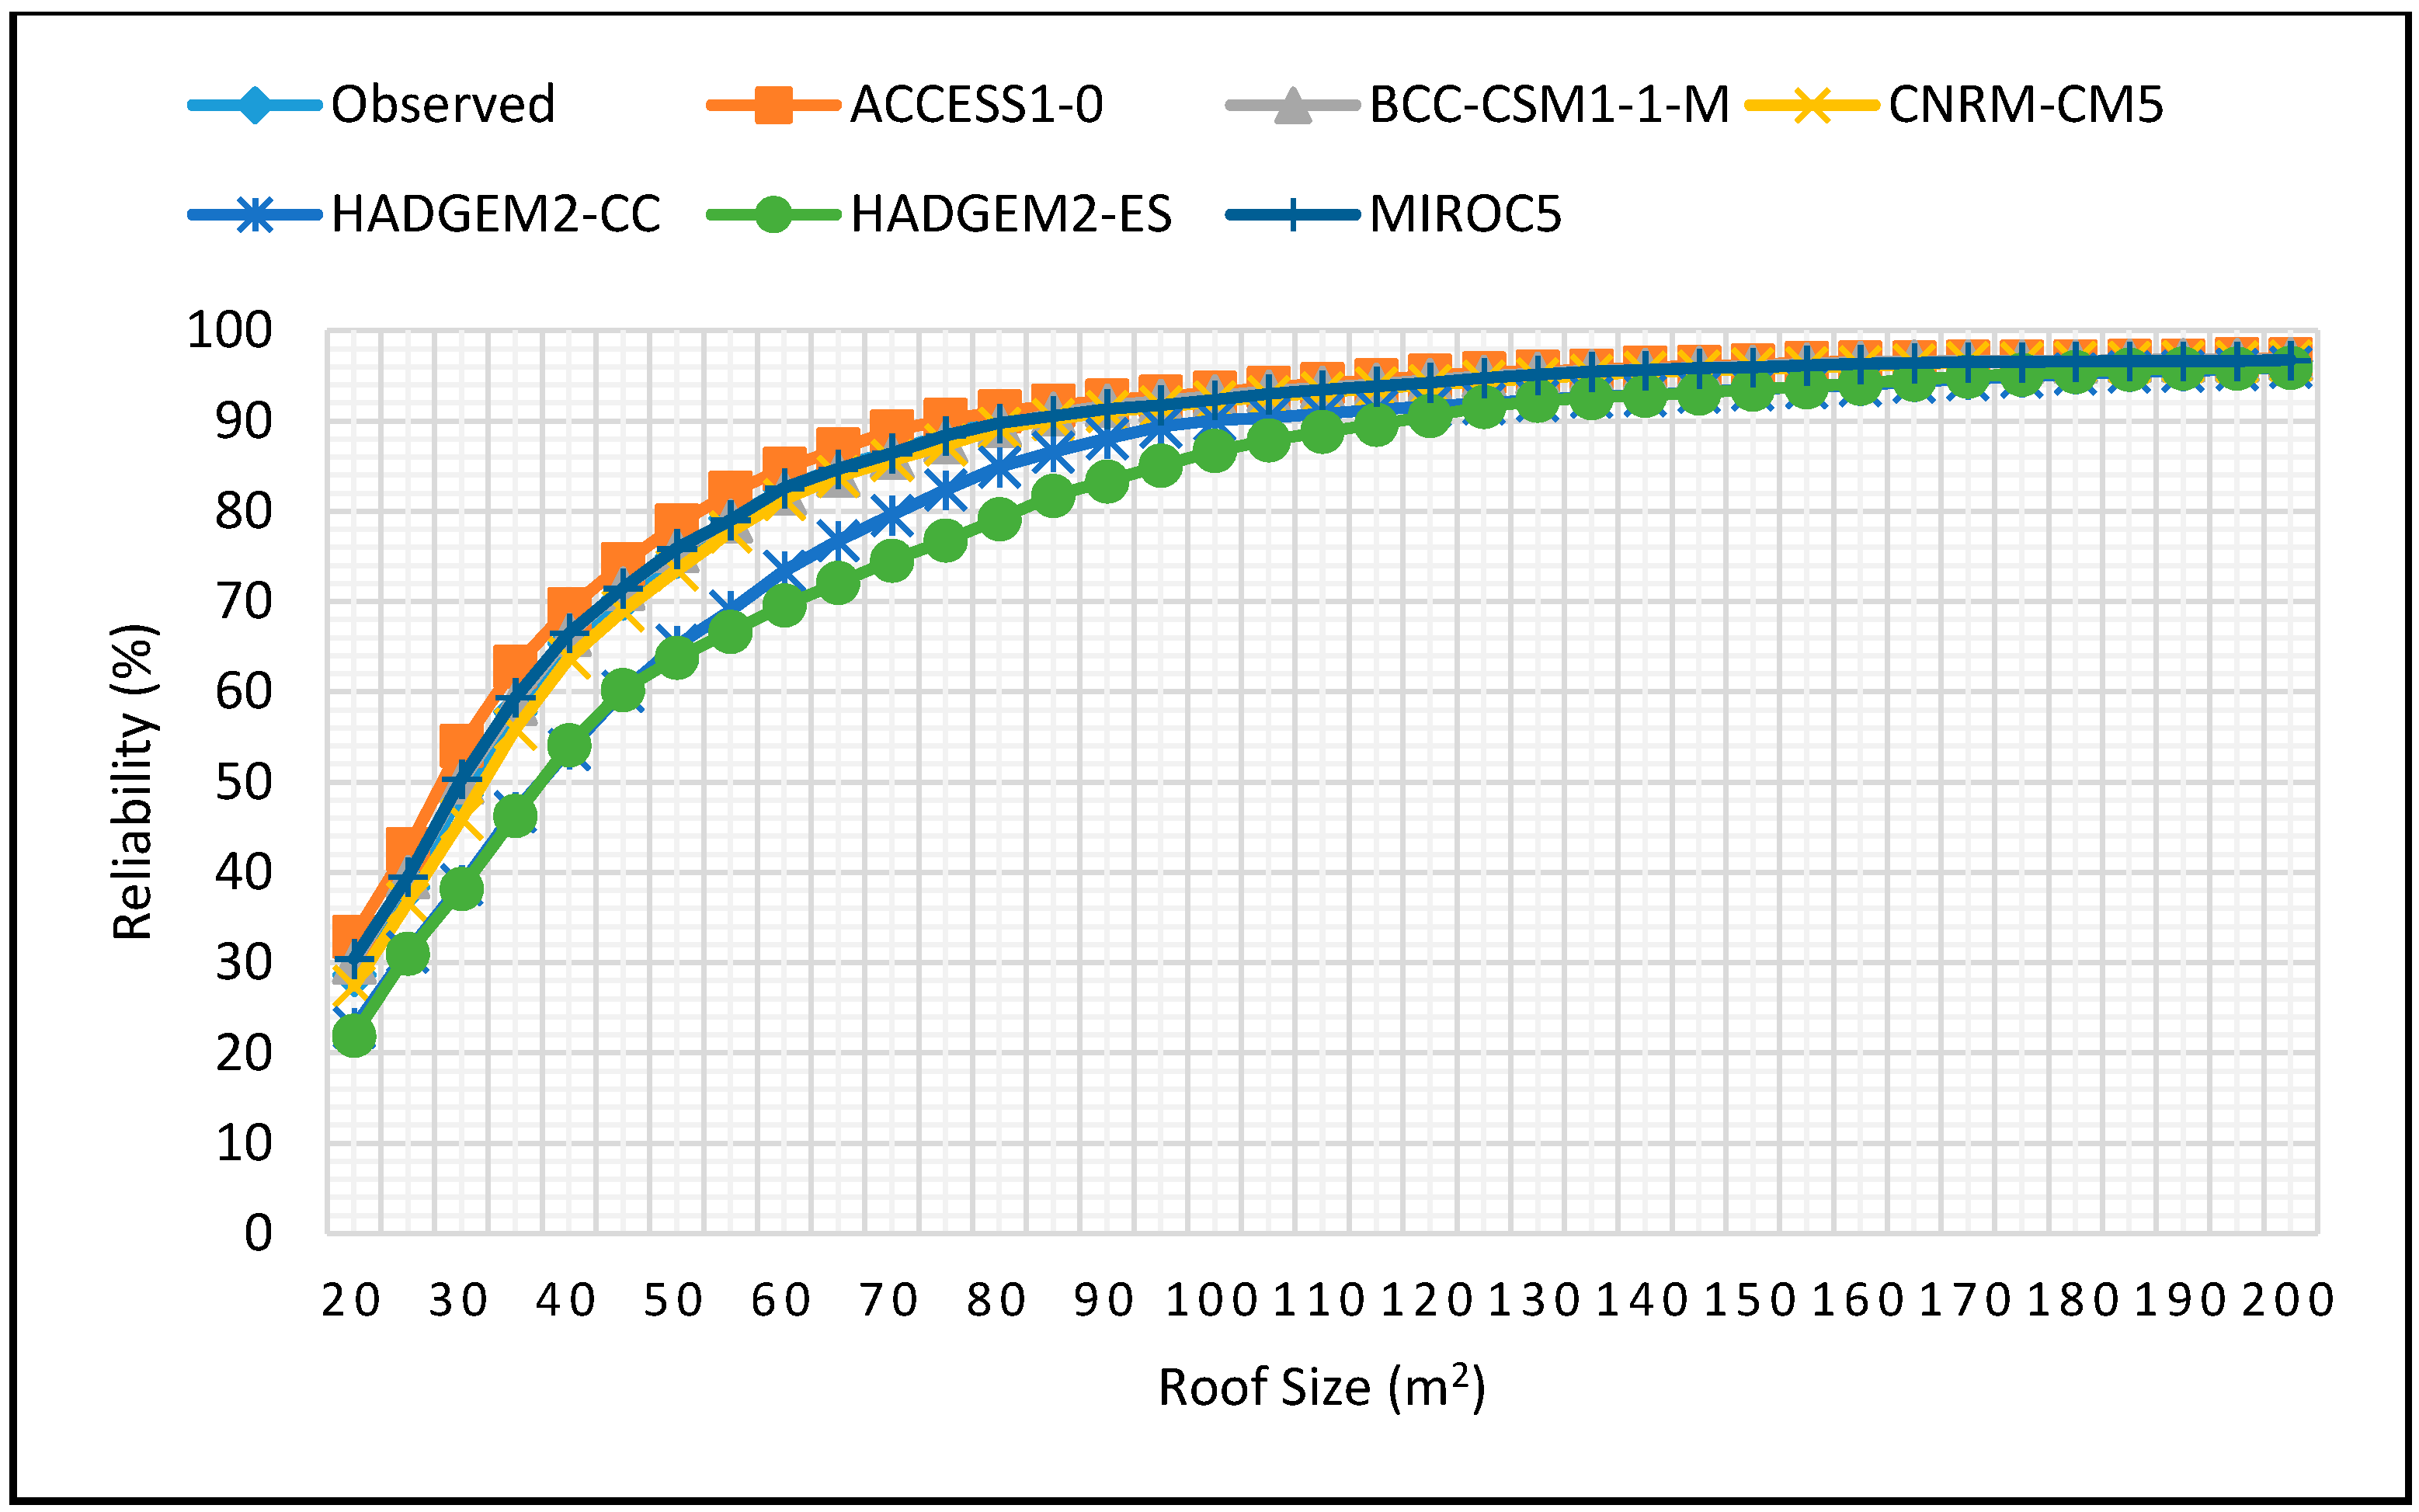
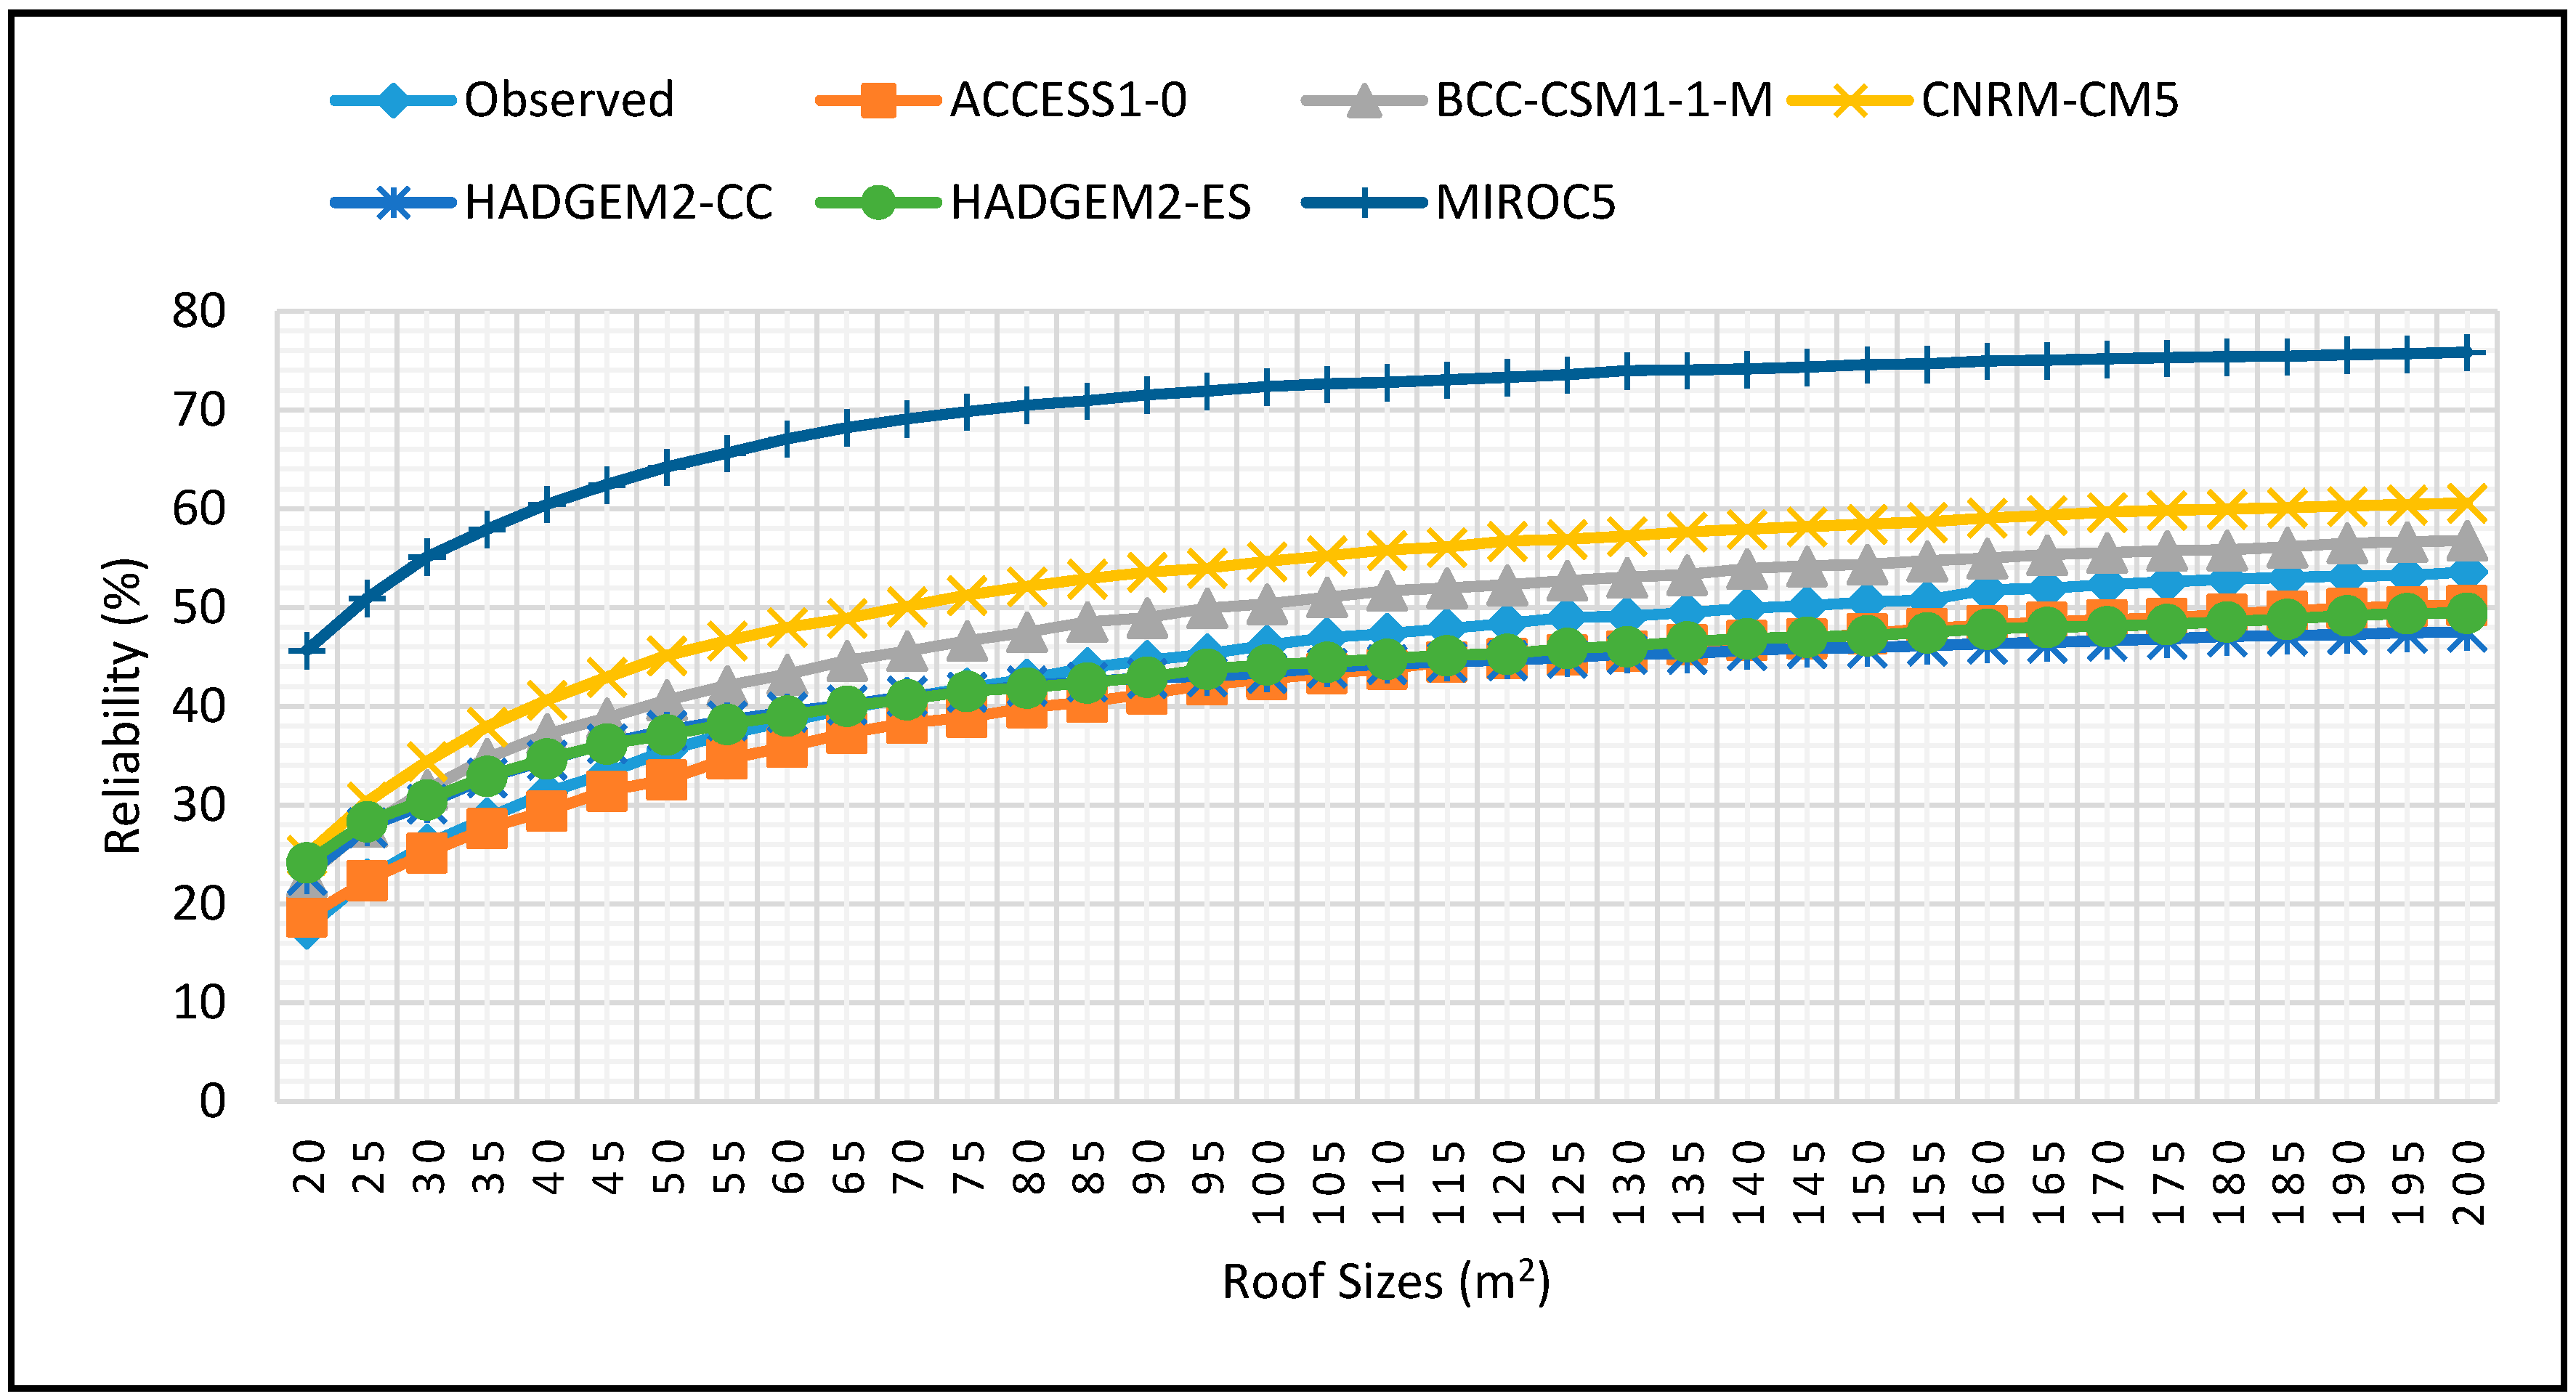
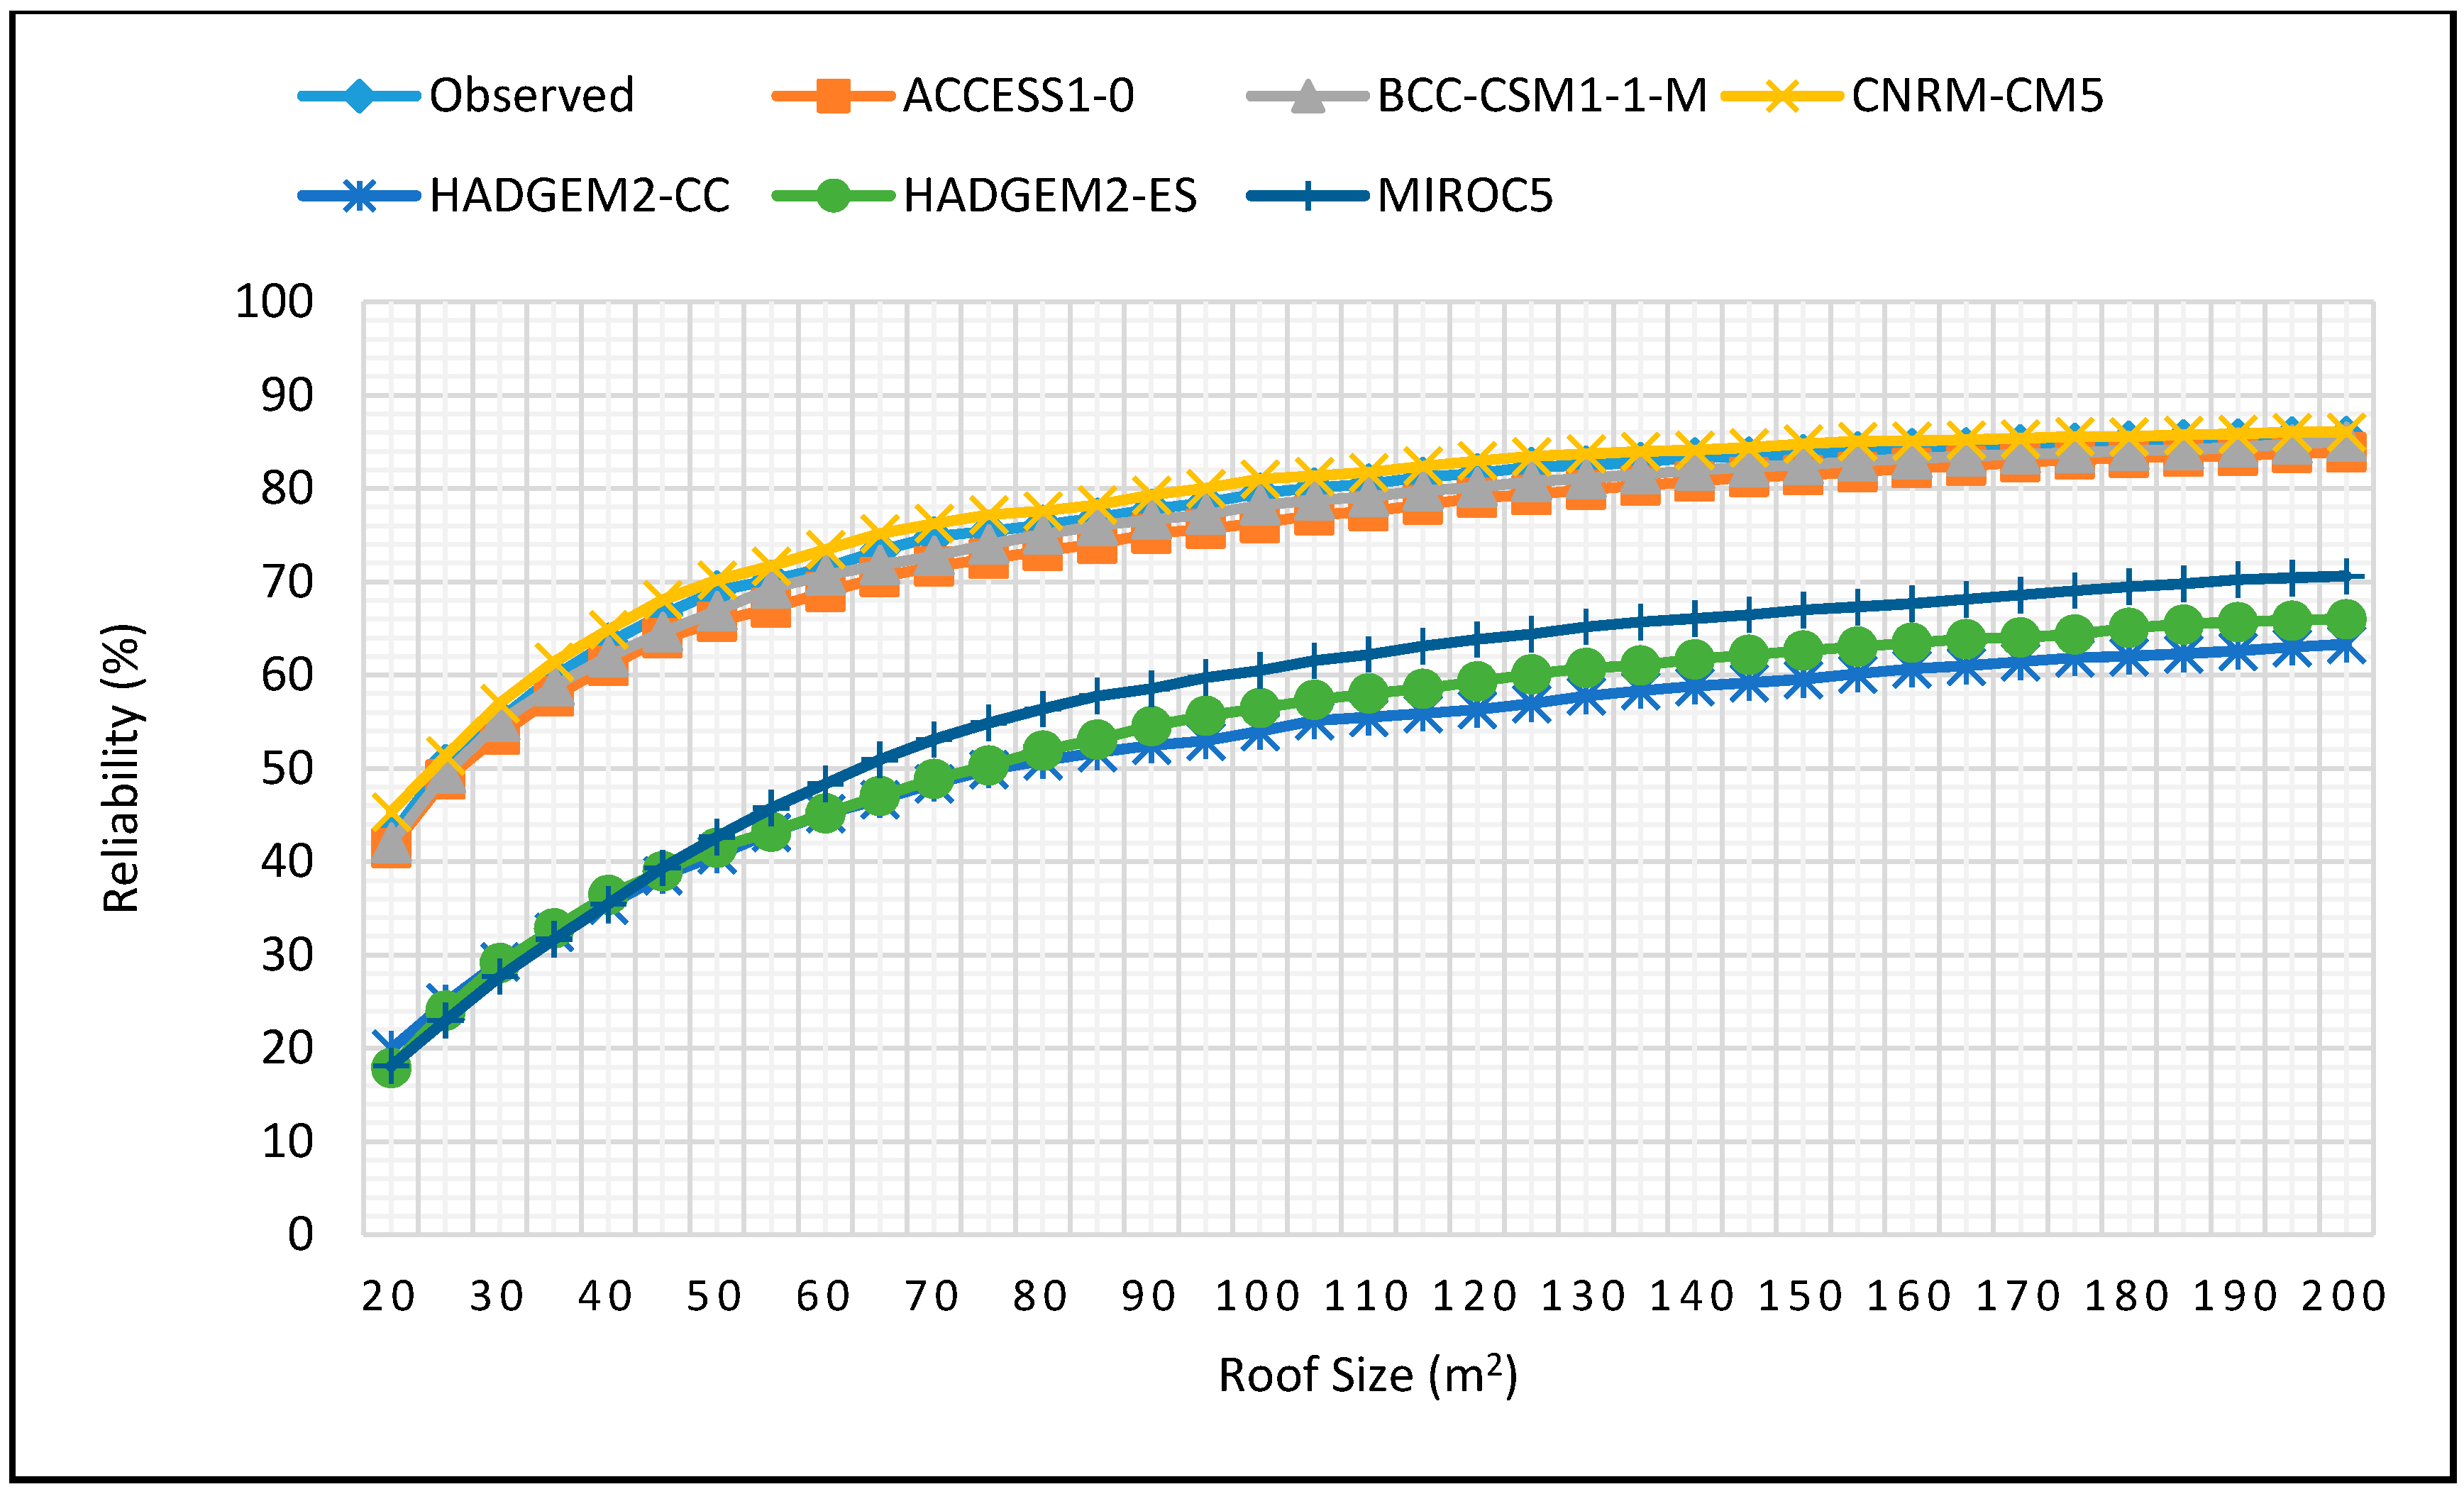
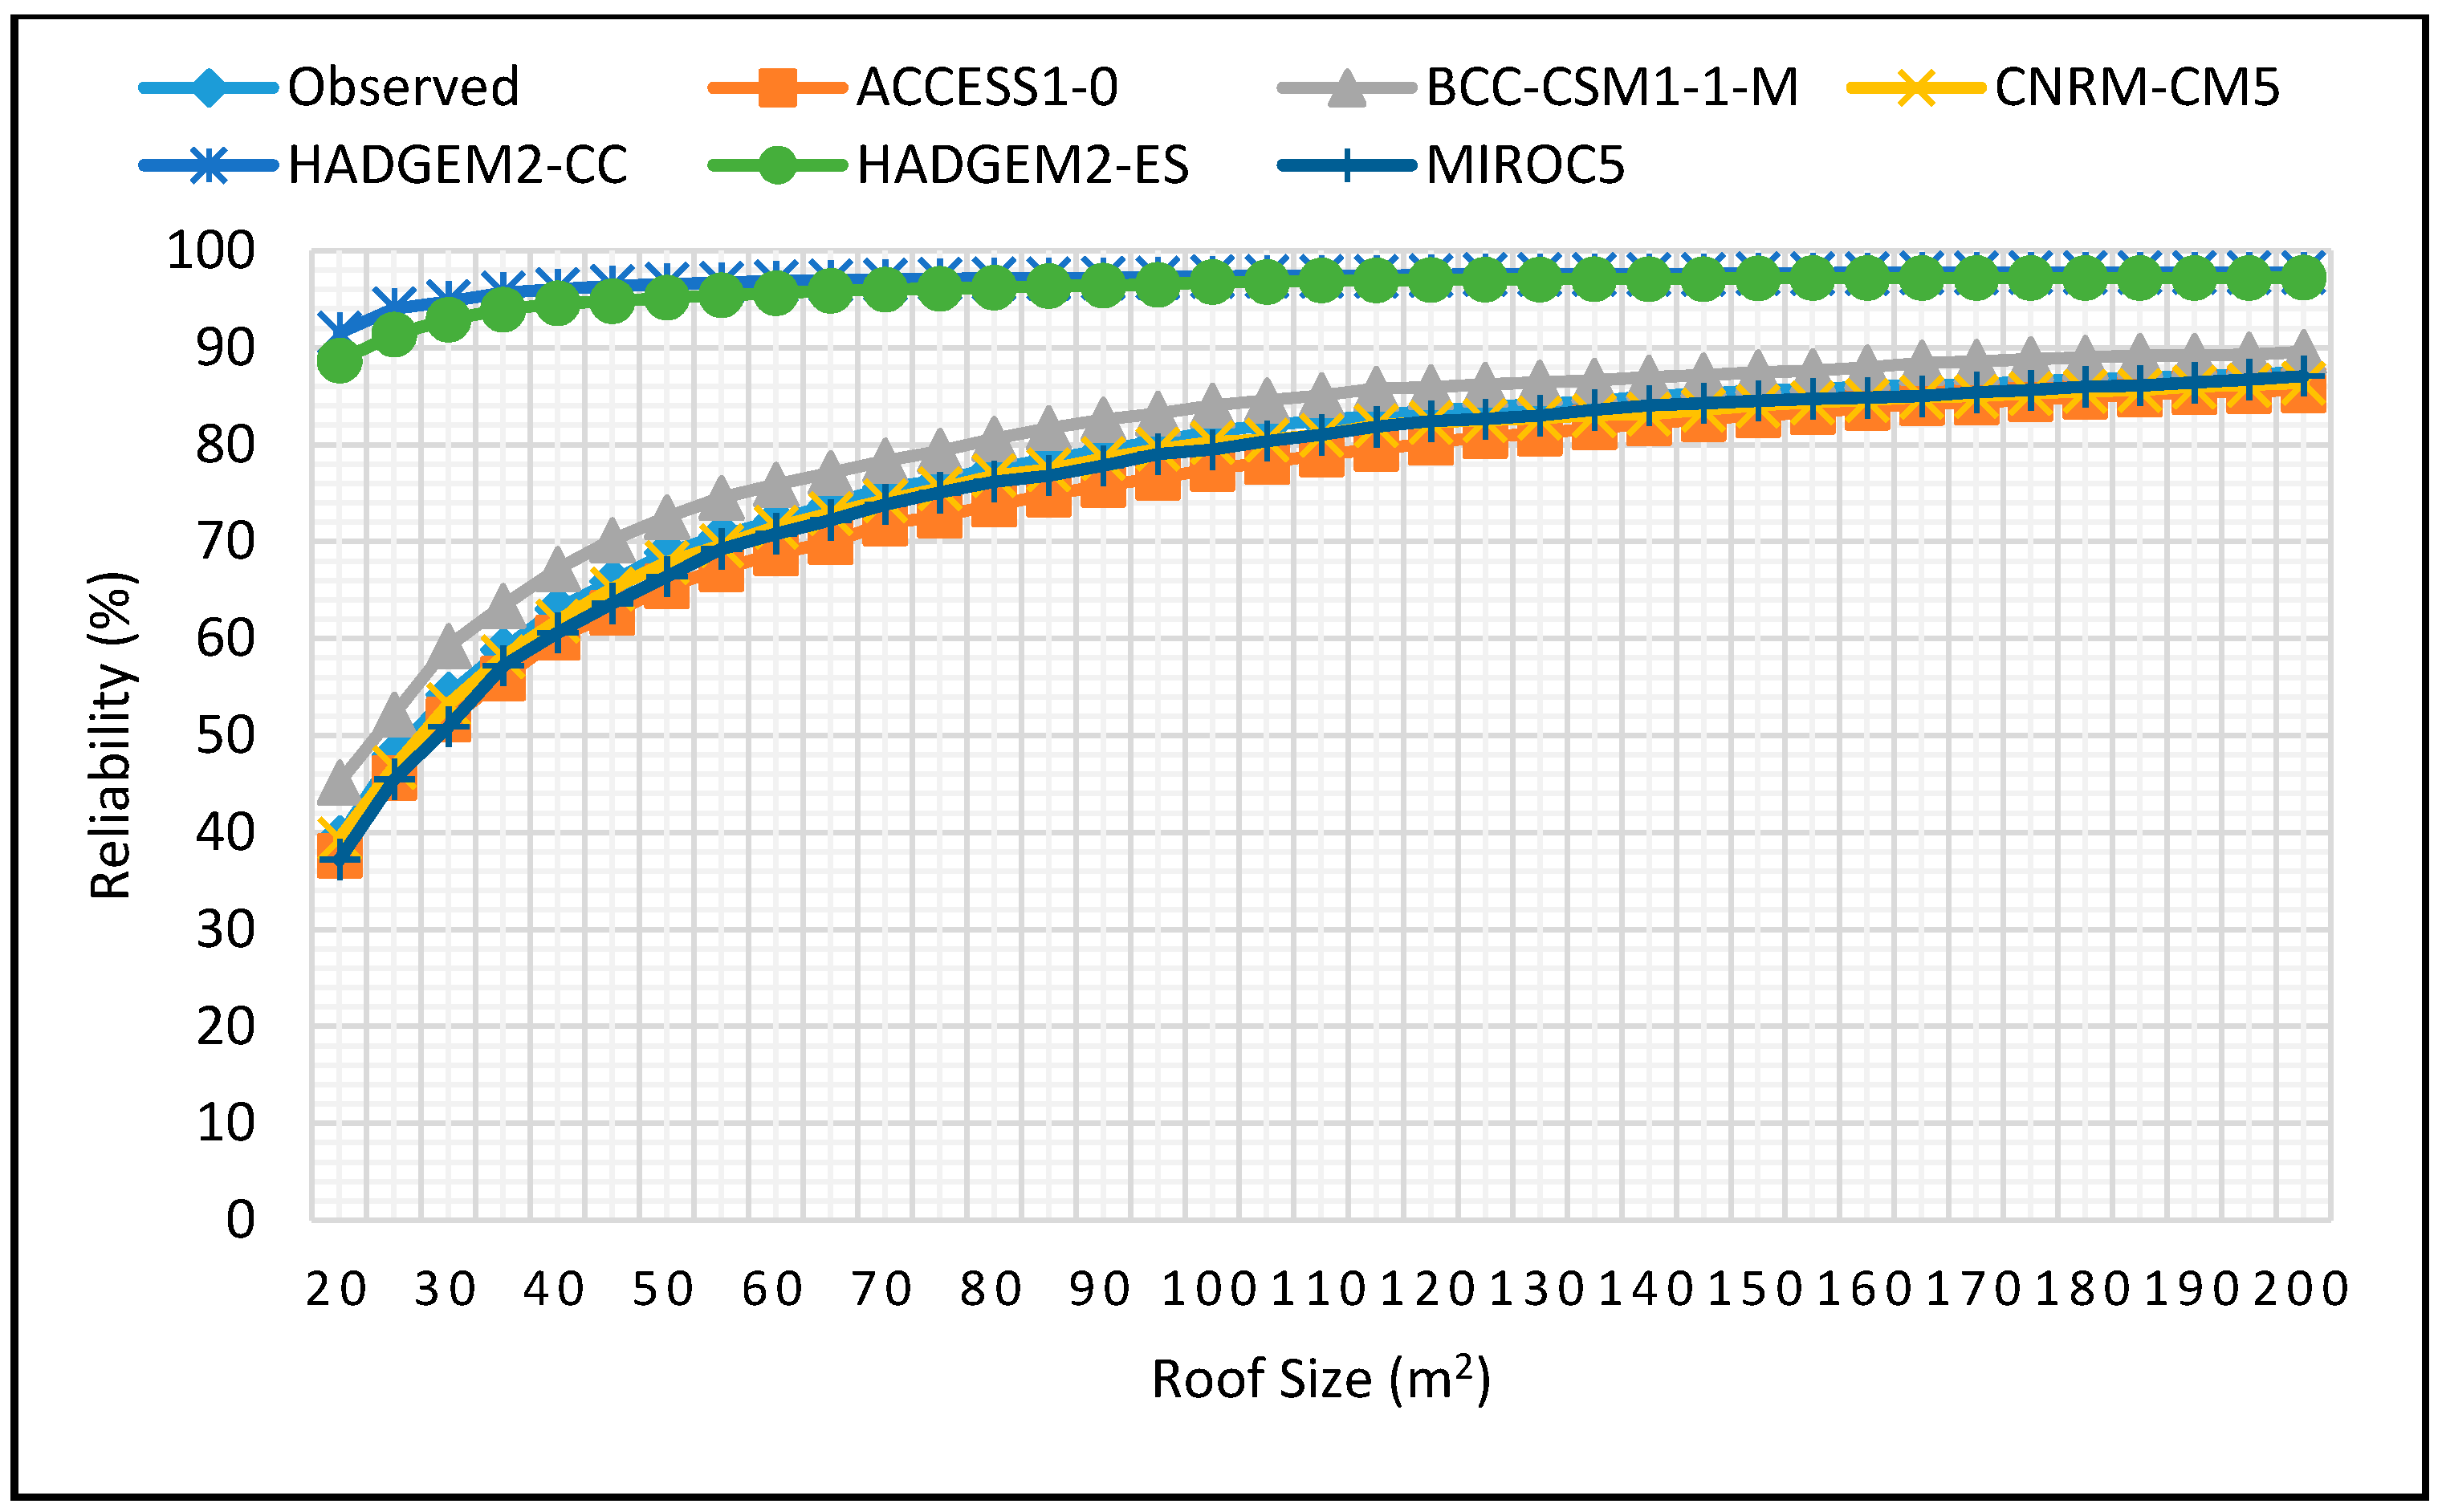
Water 10 00071 g012
Figure 13. Reliability projections for DJF season for 5 m3 tank size for 2025–2055.
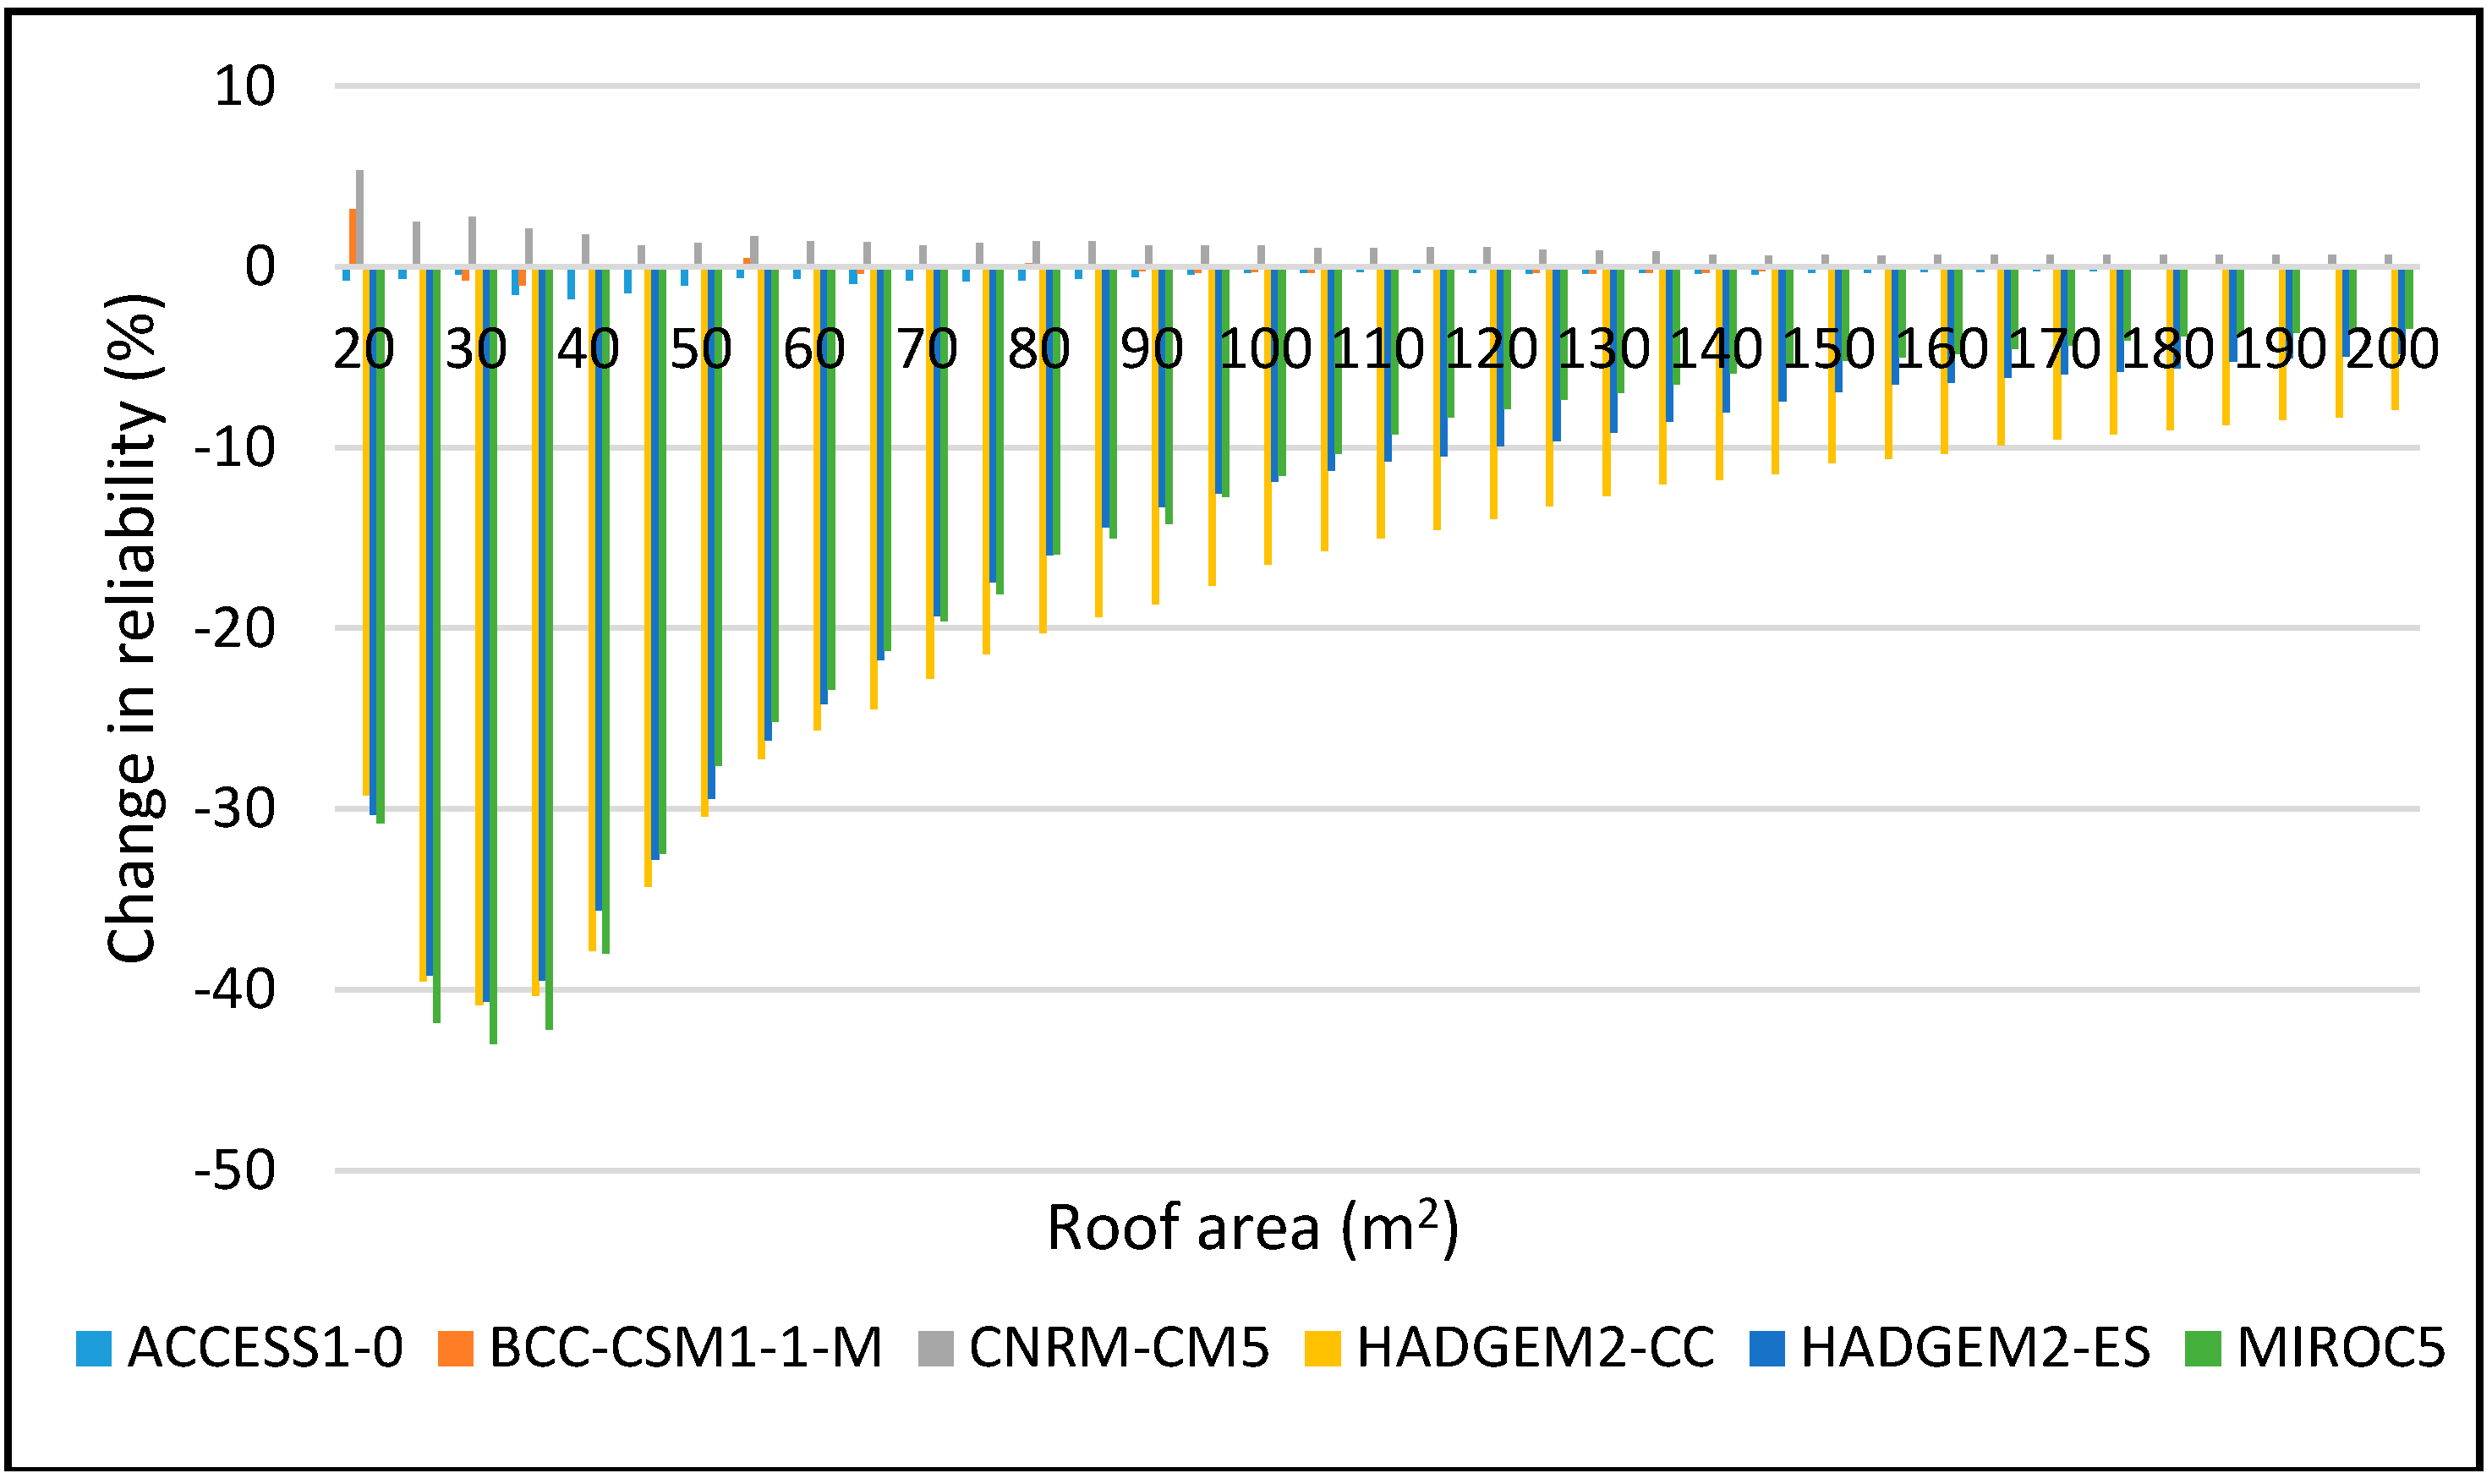
Water 10 00071 g013
Figure 14. Change in reliability for DJF 2060–2090 period for 2 m3.
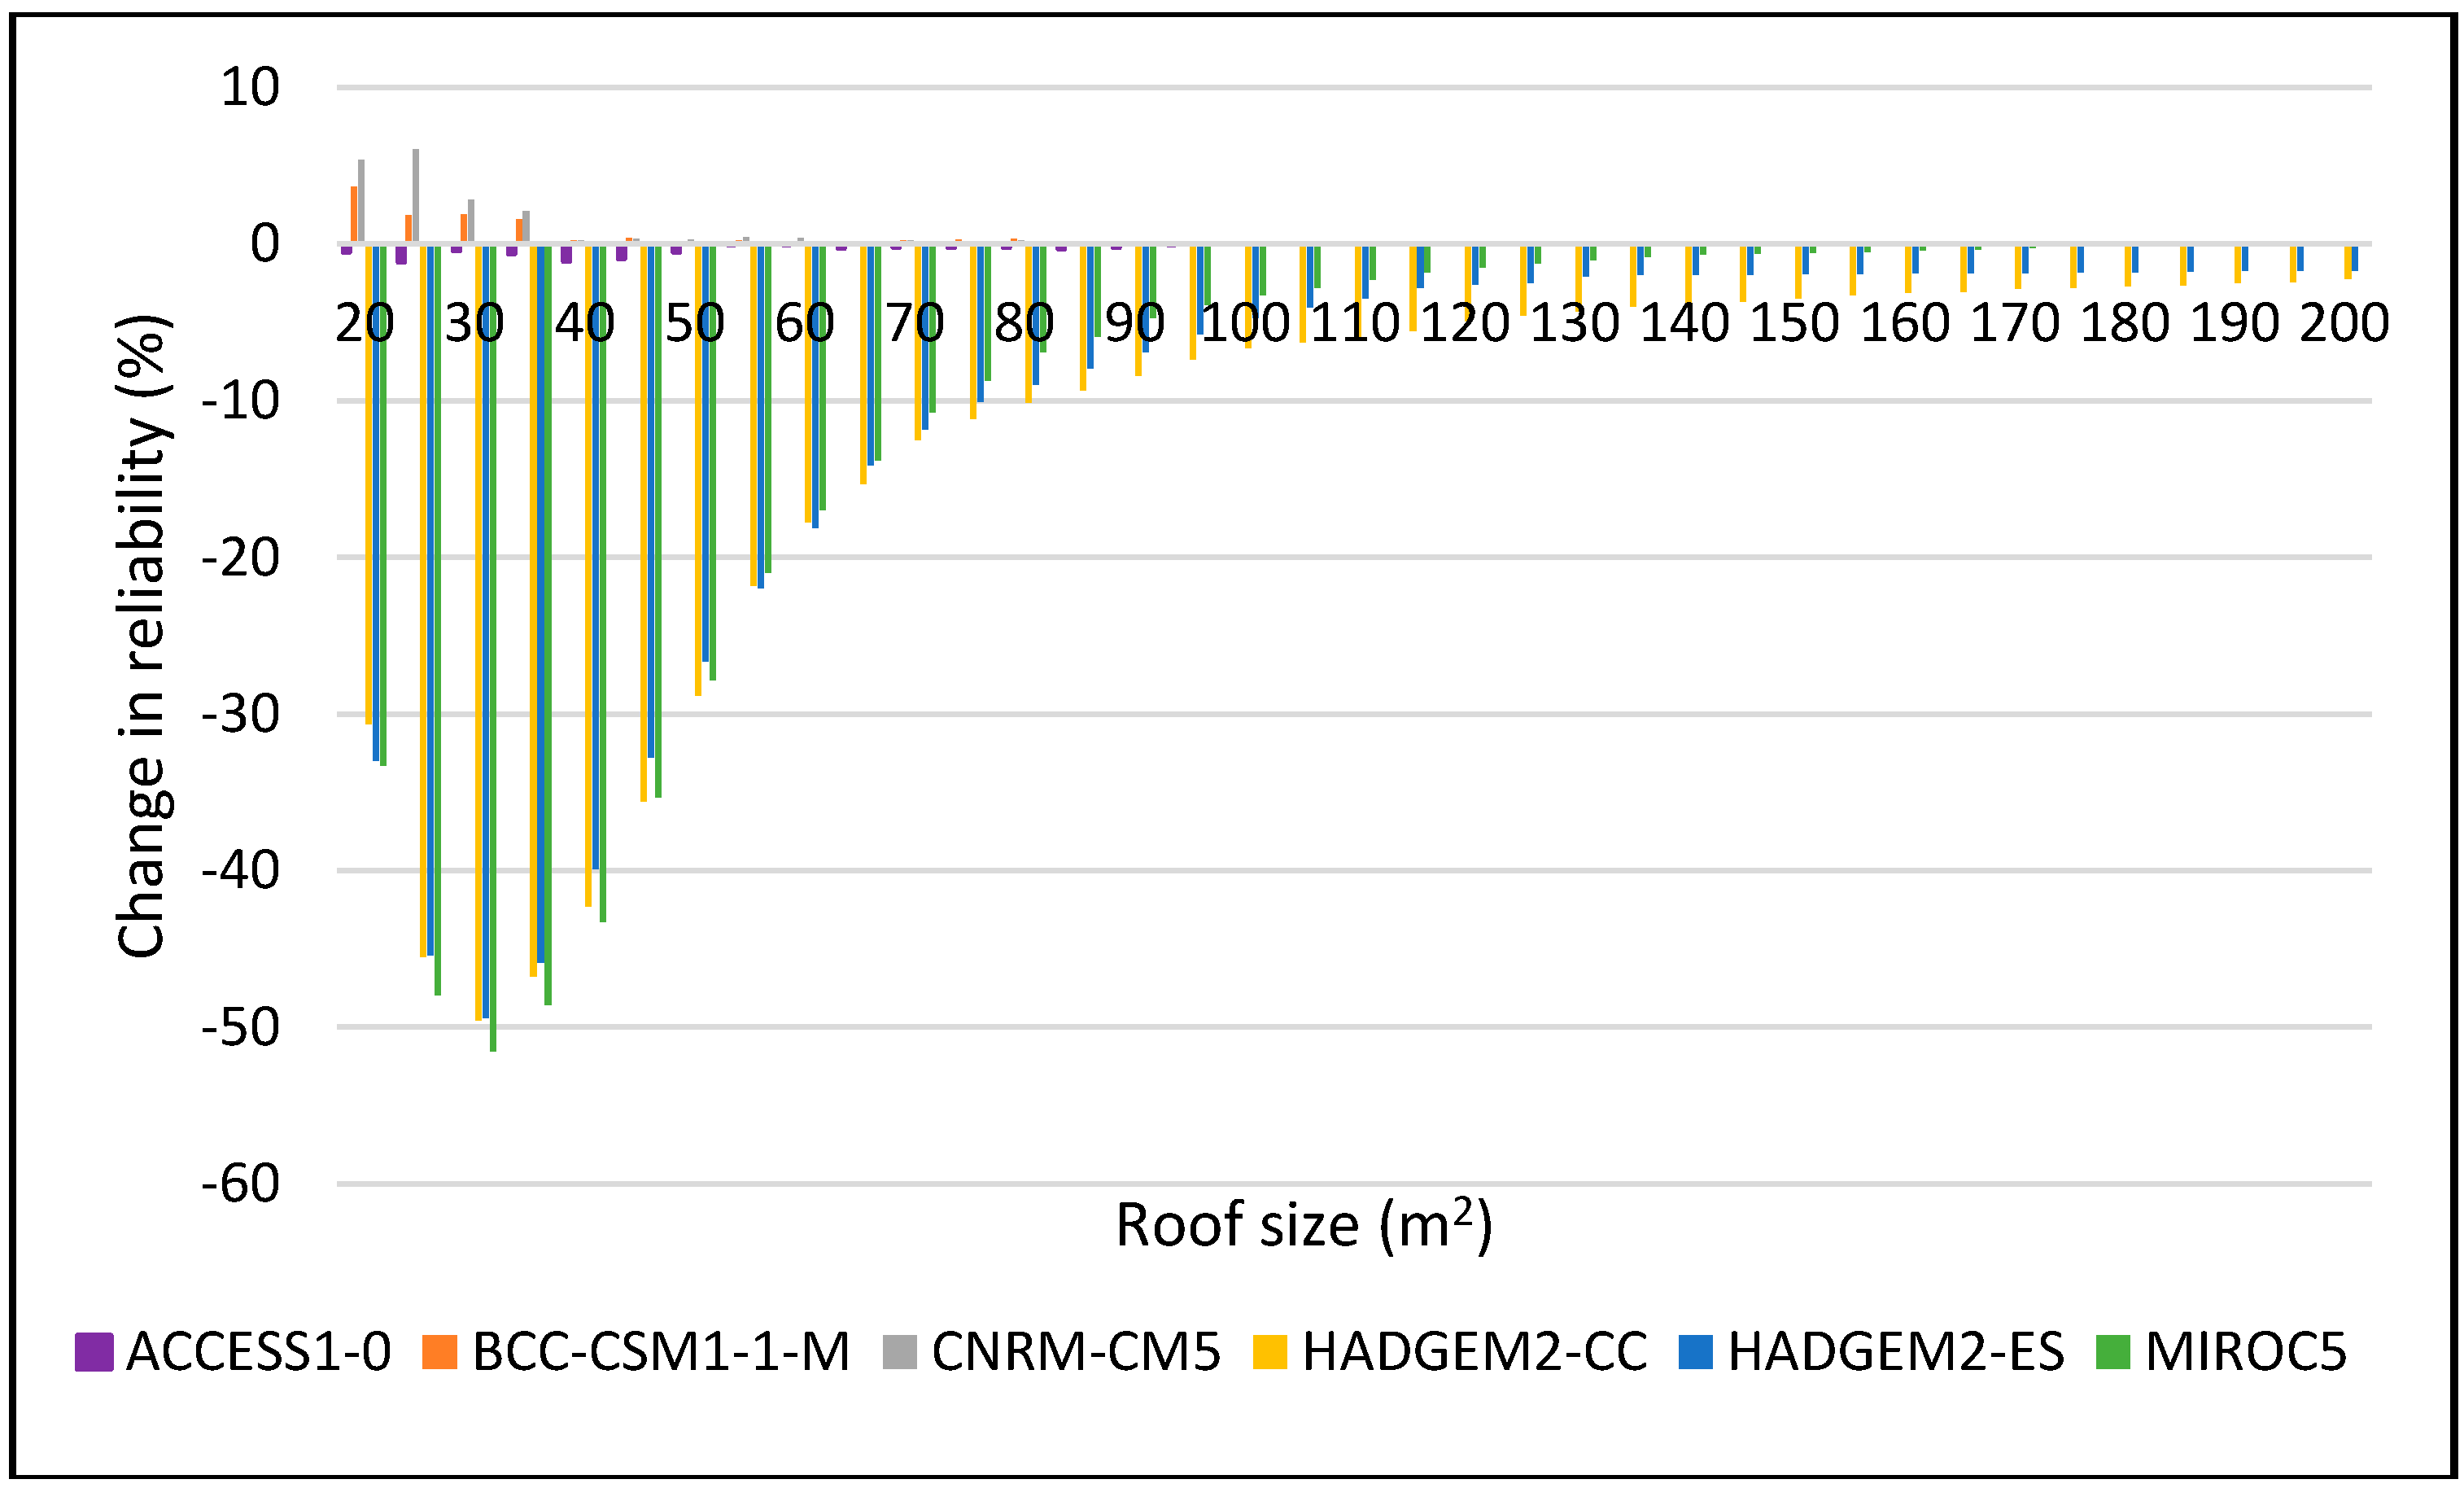
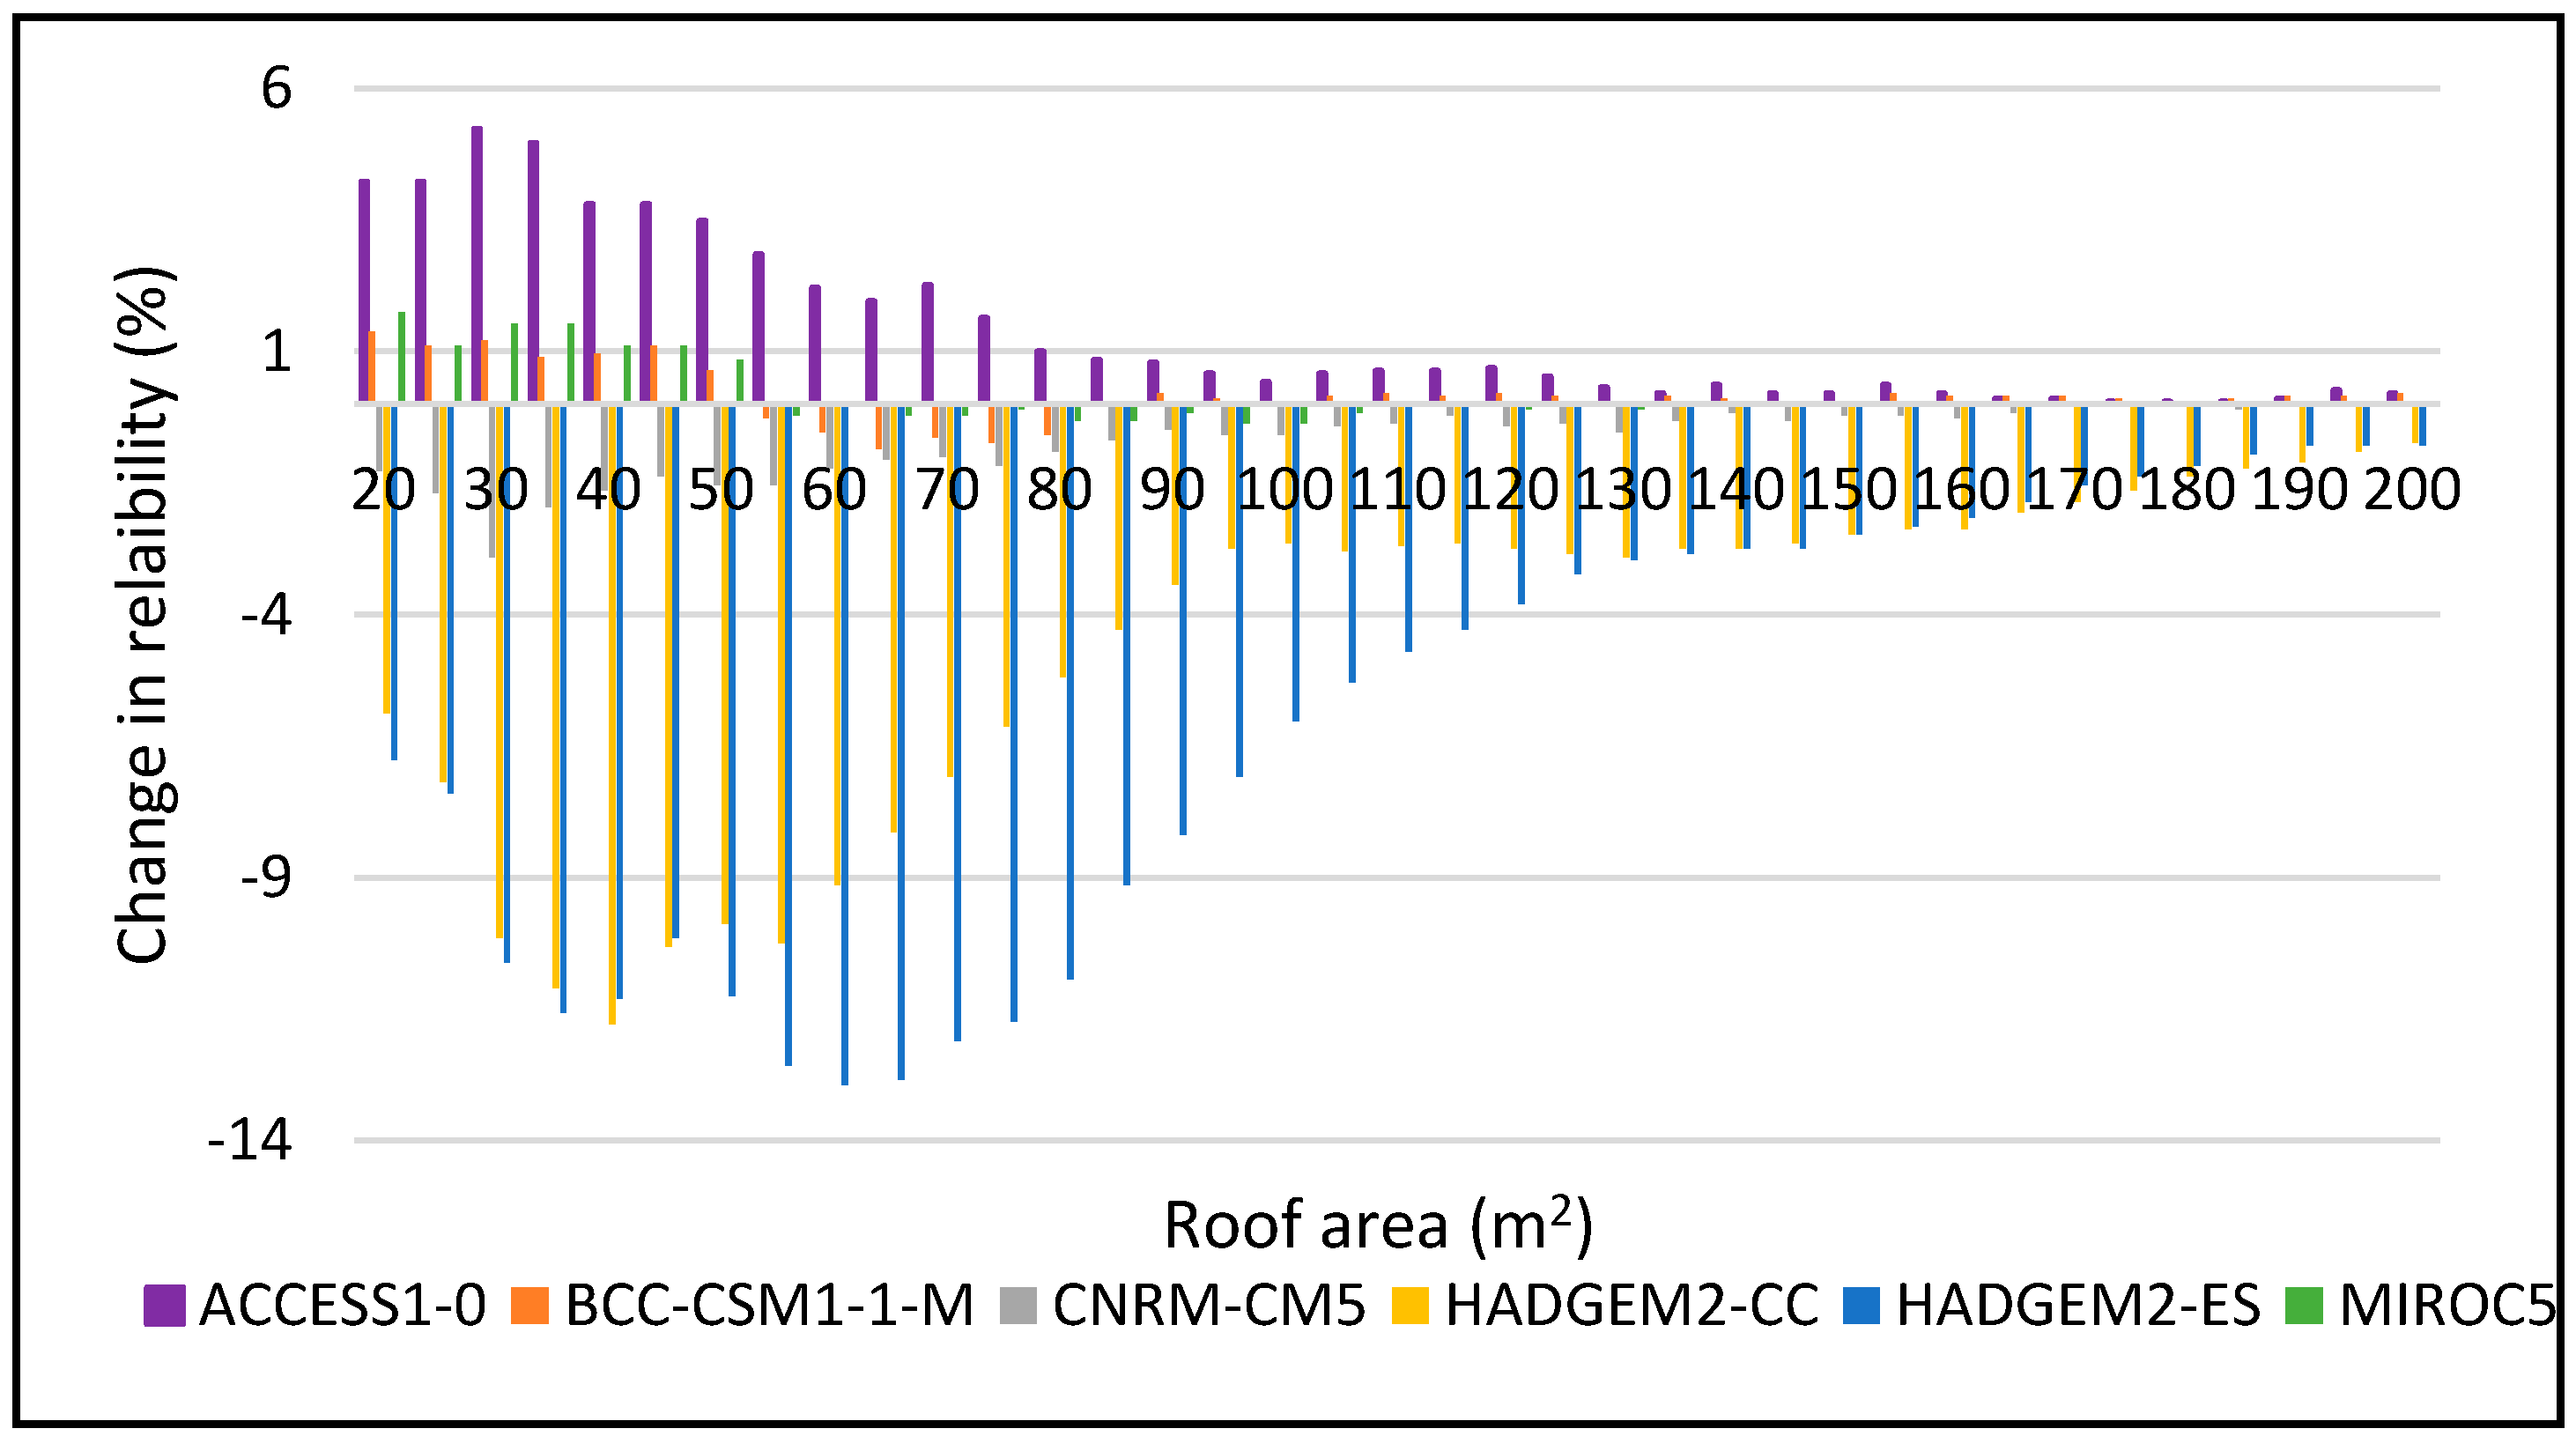
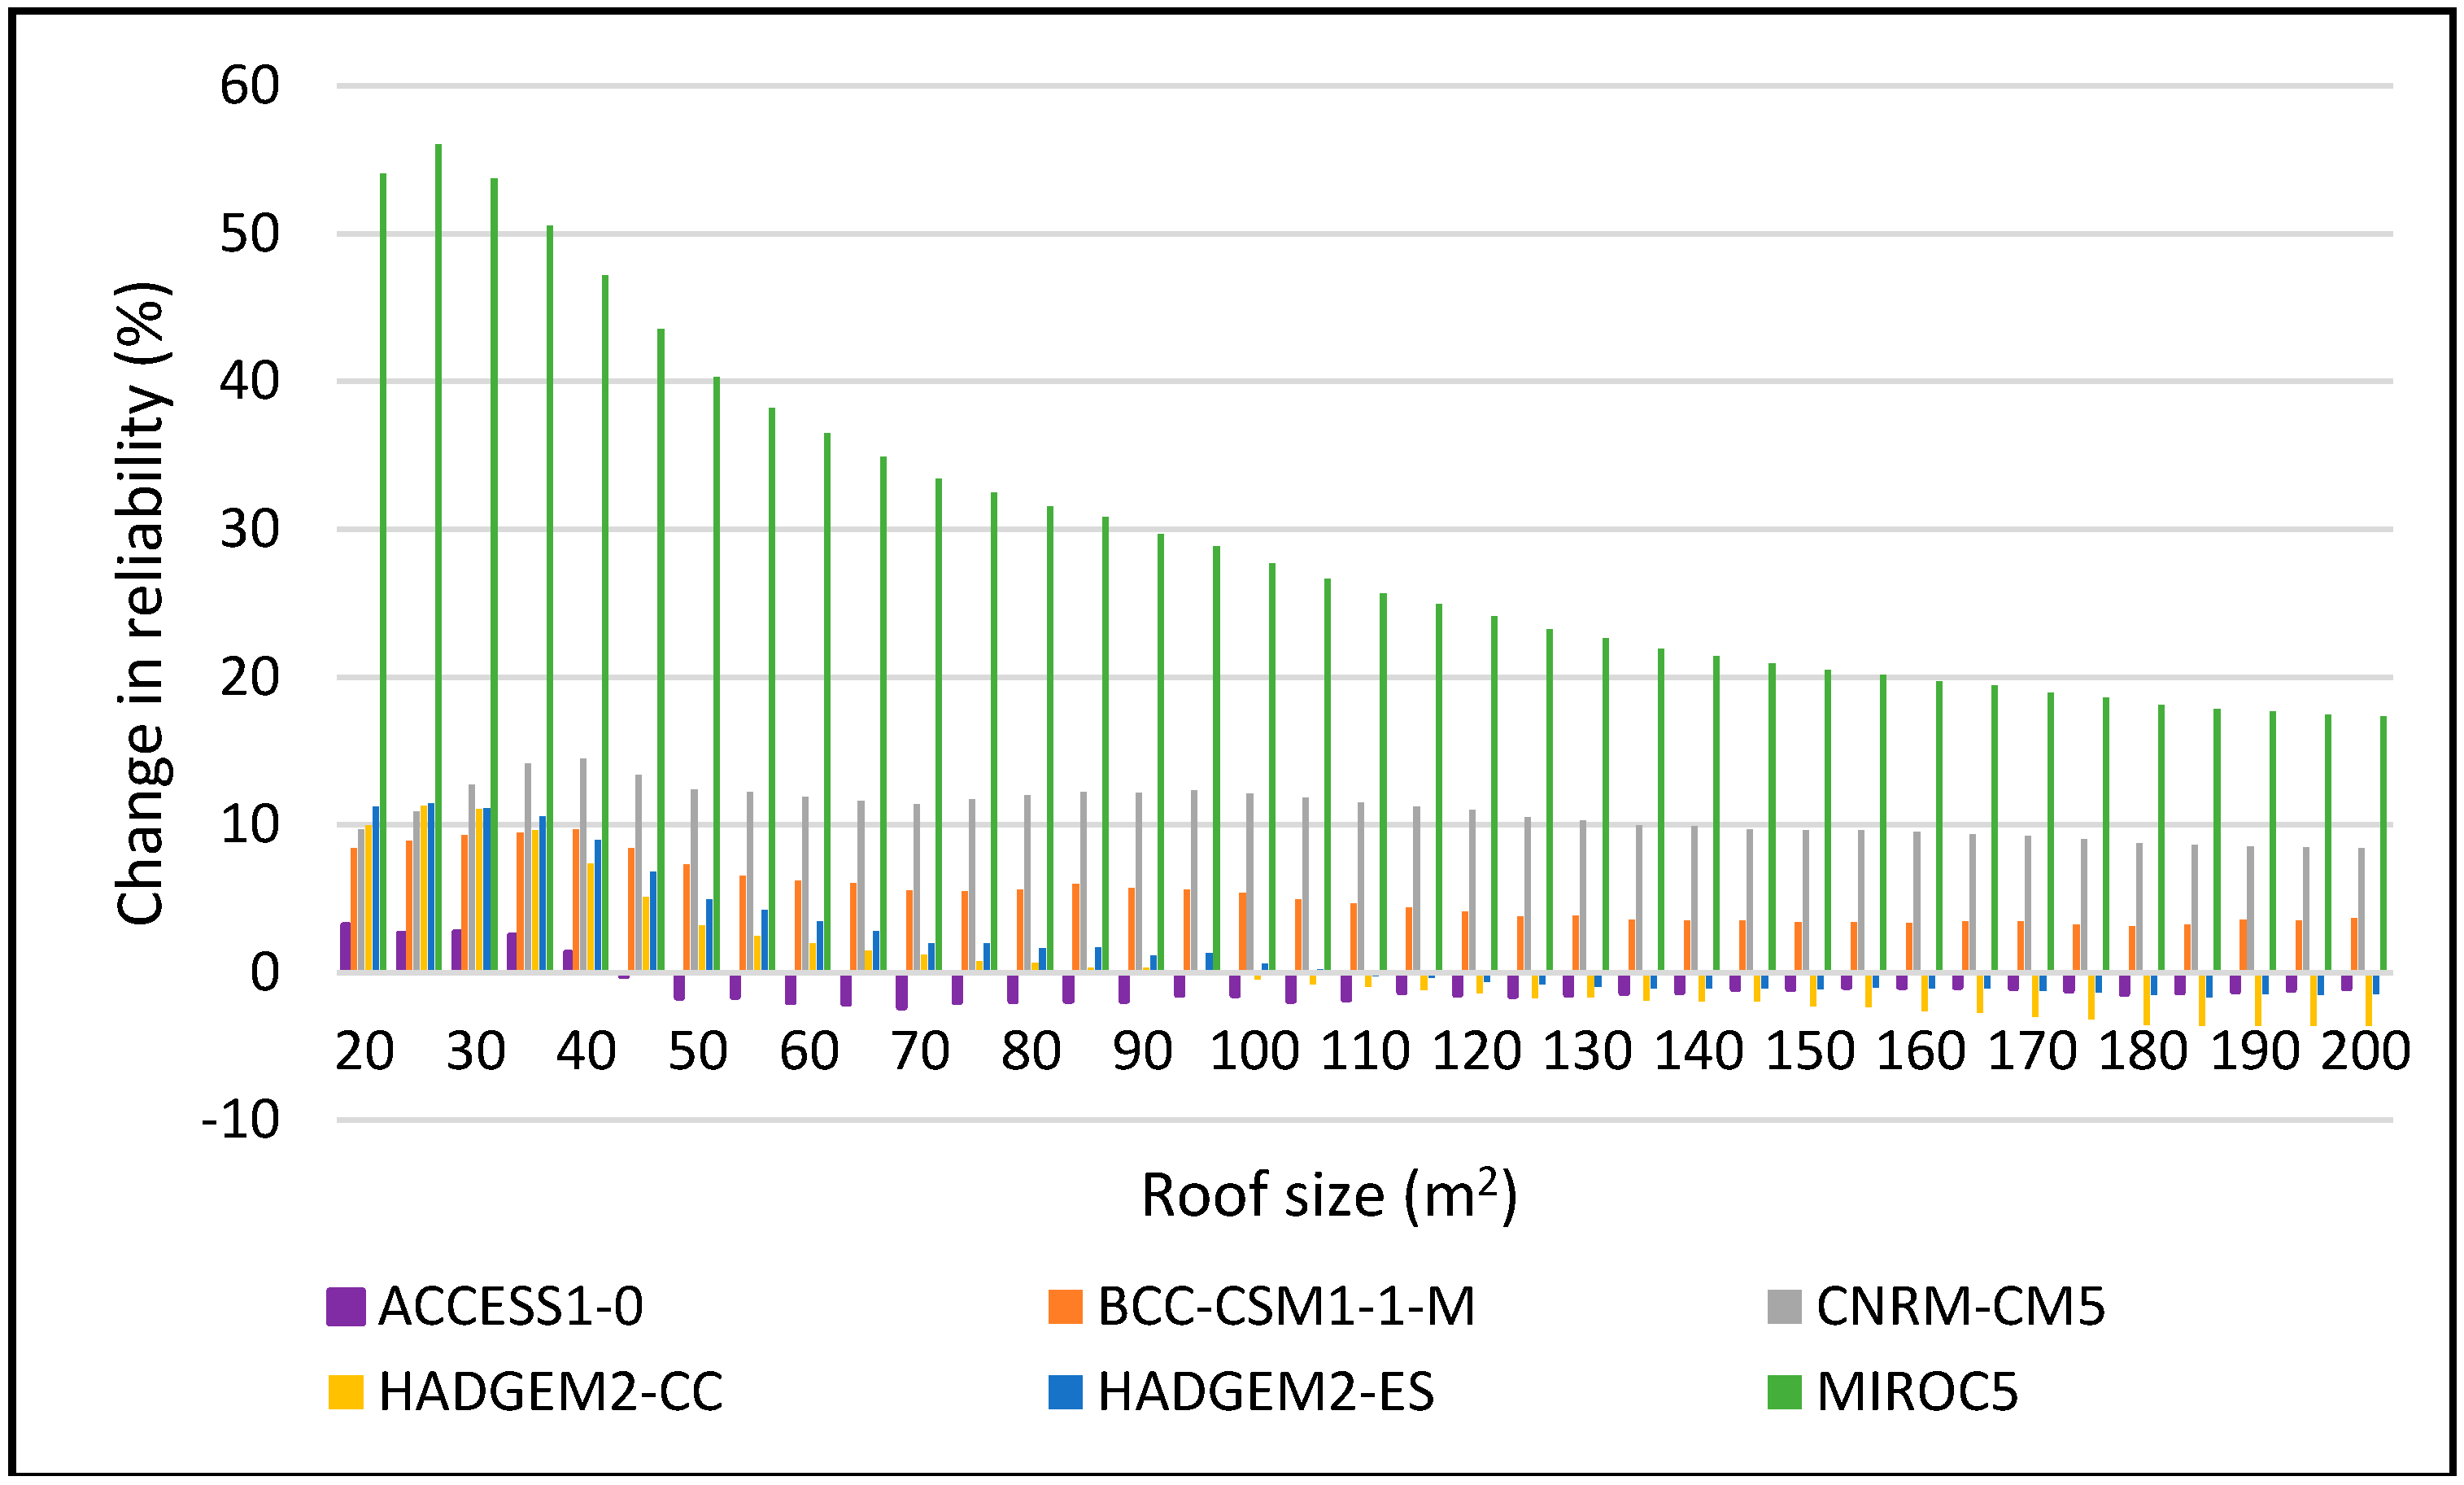
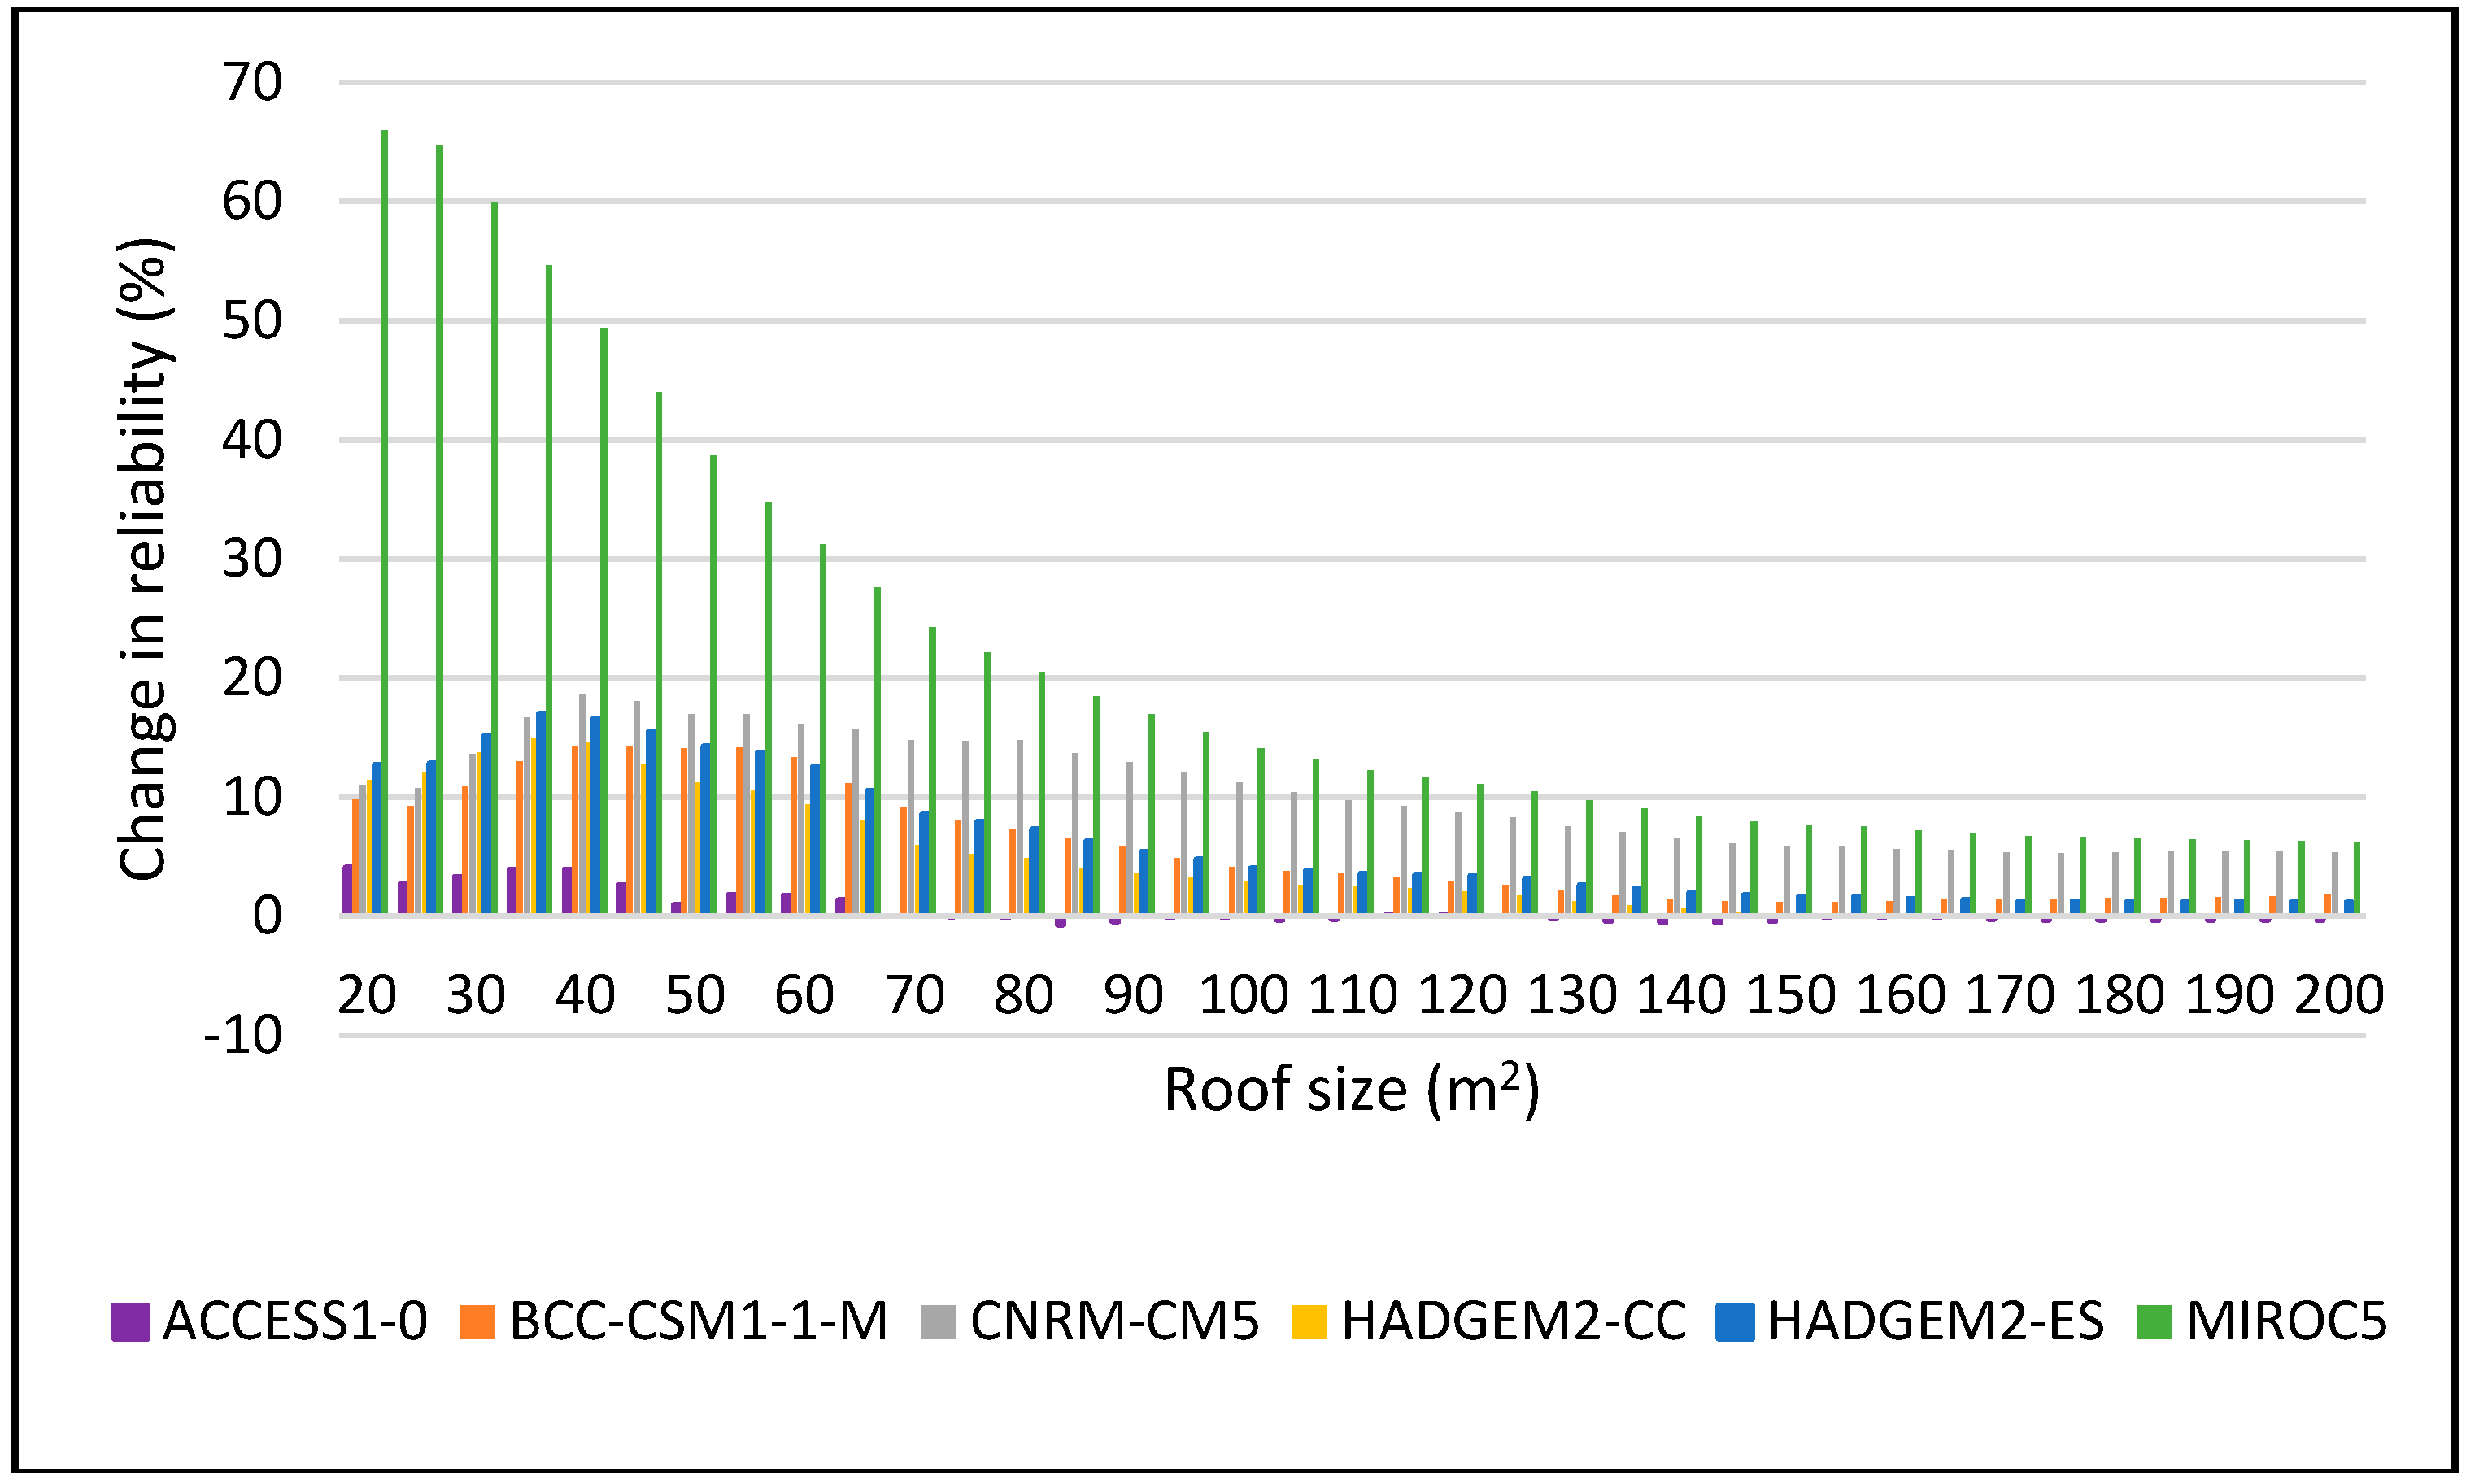
Water 10 00071 g014
Figure 15. Change in reliability for DJF 2060–2090 period for 5 m3.
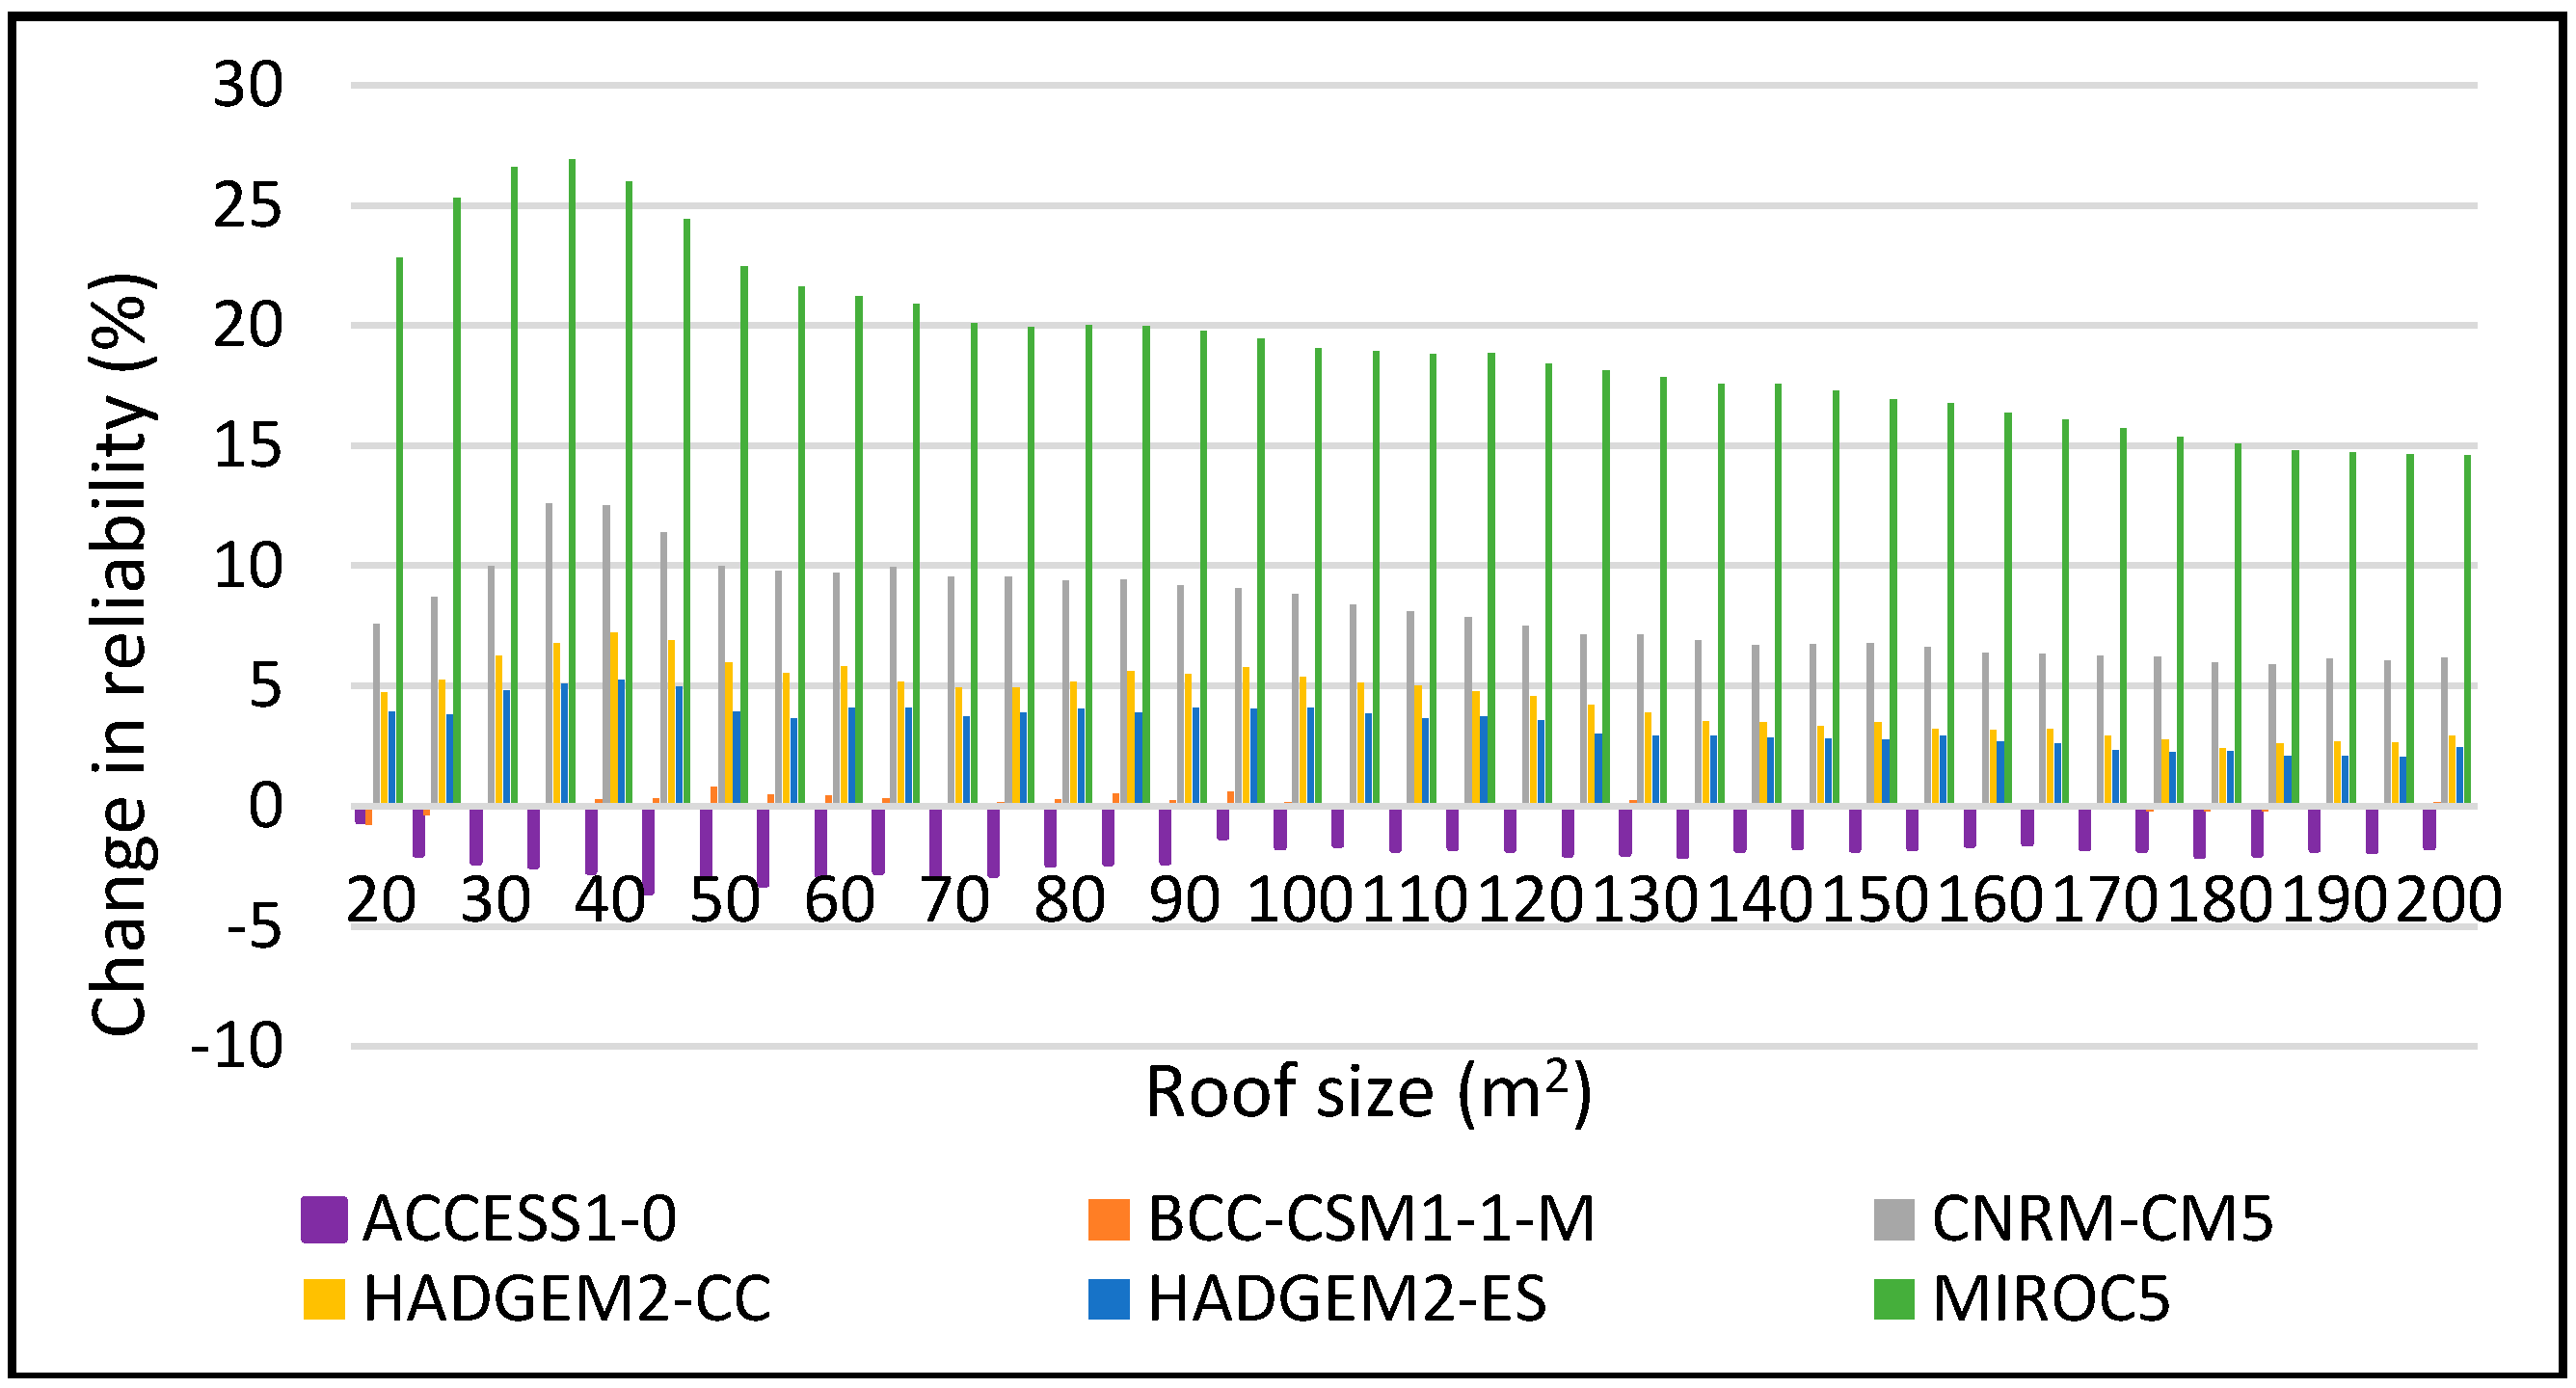
Water 10 00071 g015
Figure 16. JJA Change in reliability for 2 m3 during 2025–2055.
Water 10 00071 g016
Figure 17. JJA Change in reliability for 5 m3 during 2025–2055.
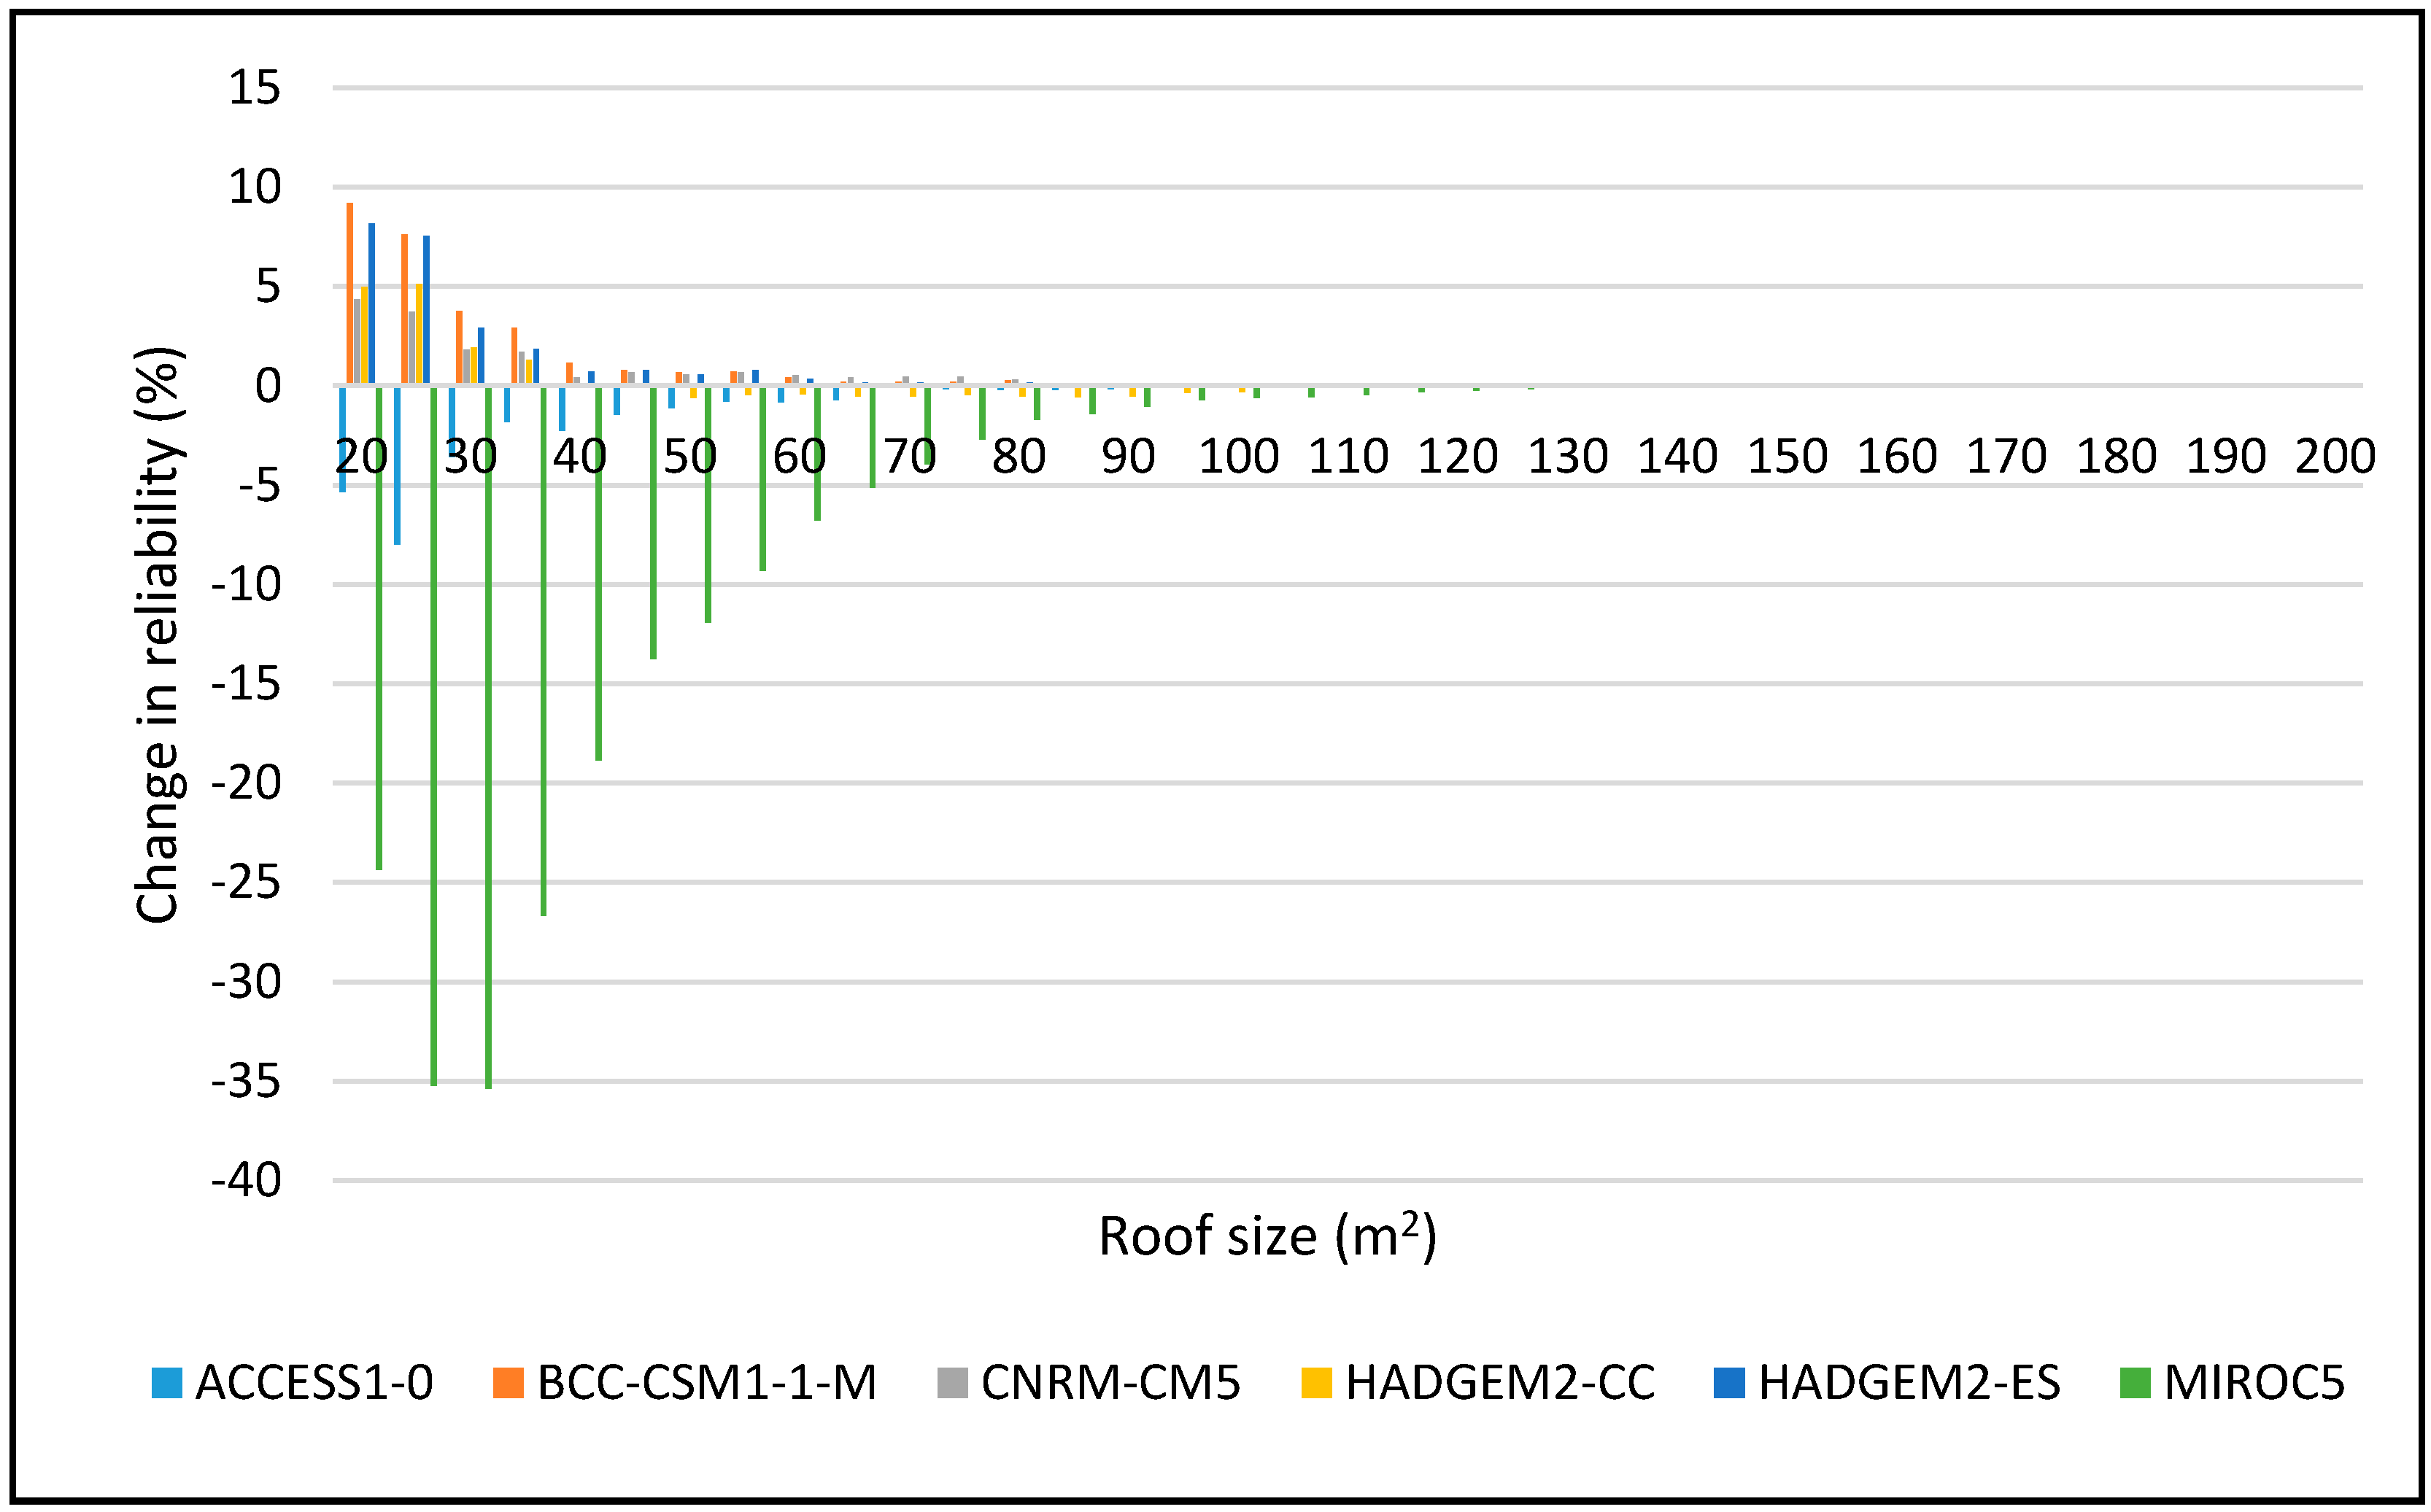
Water 10 00071 g017
Figure 18. JJA showing change in reliability for 2060–2090 period for 2 m3.
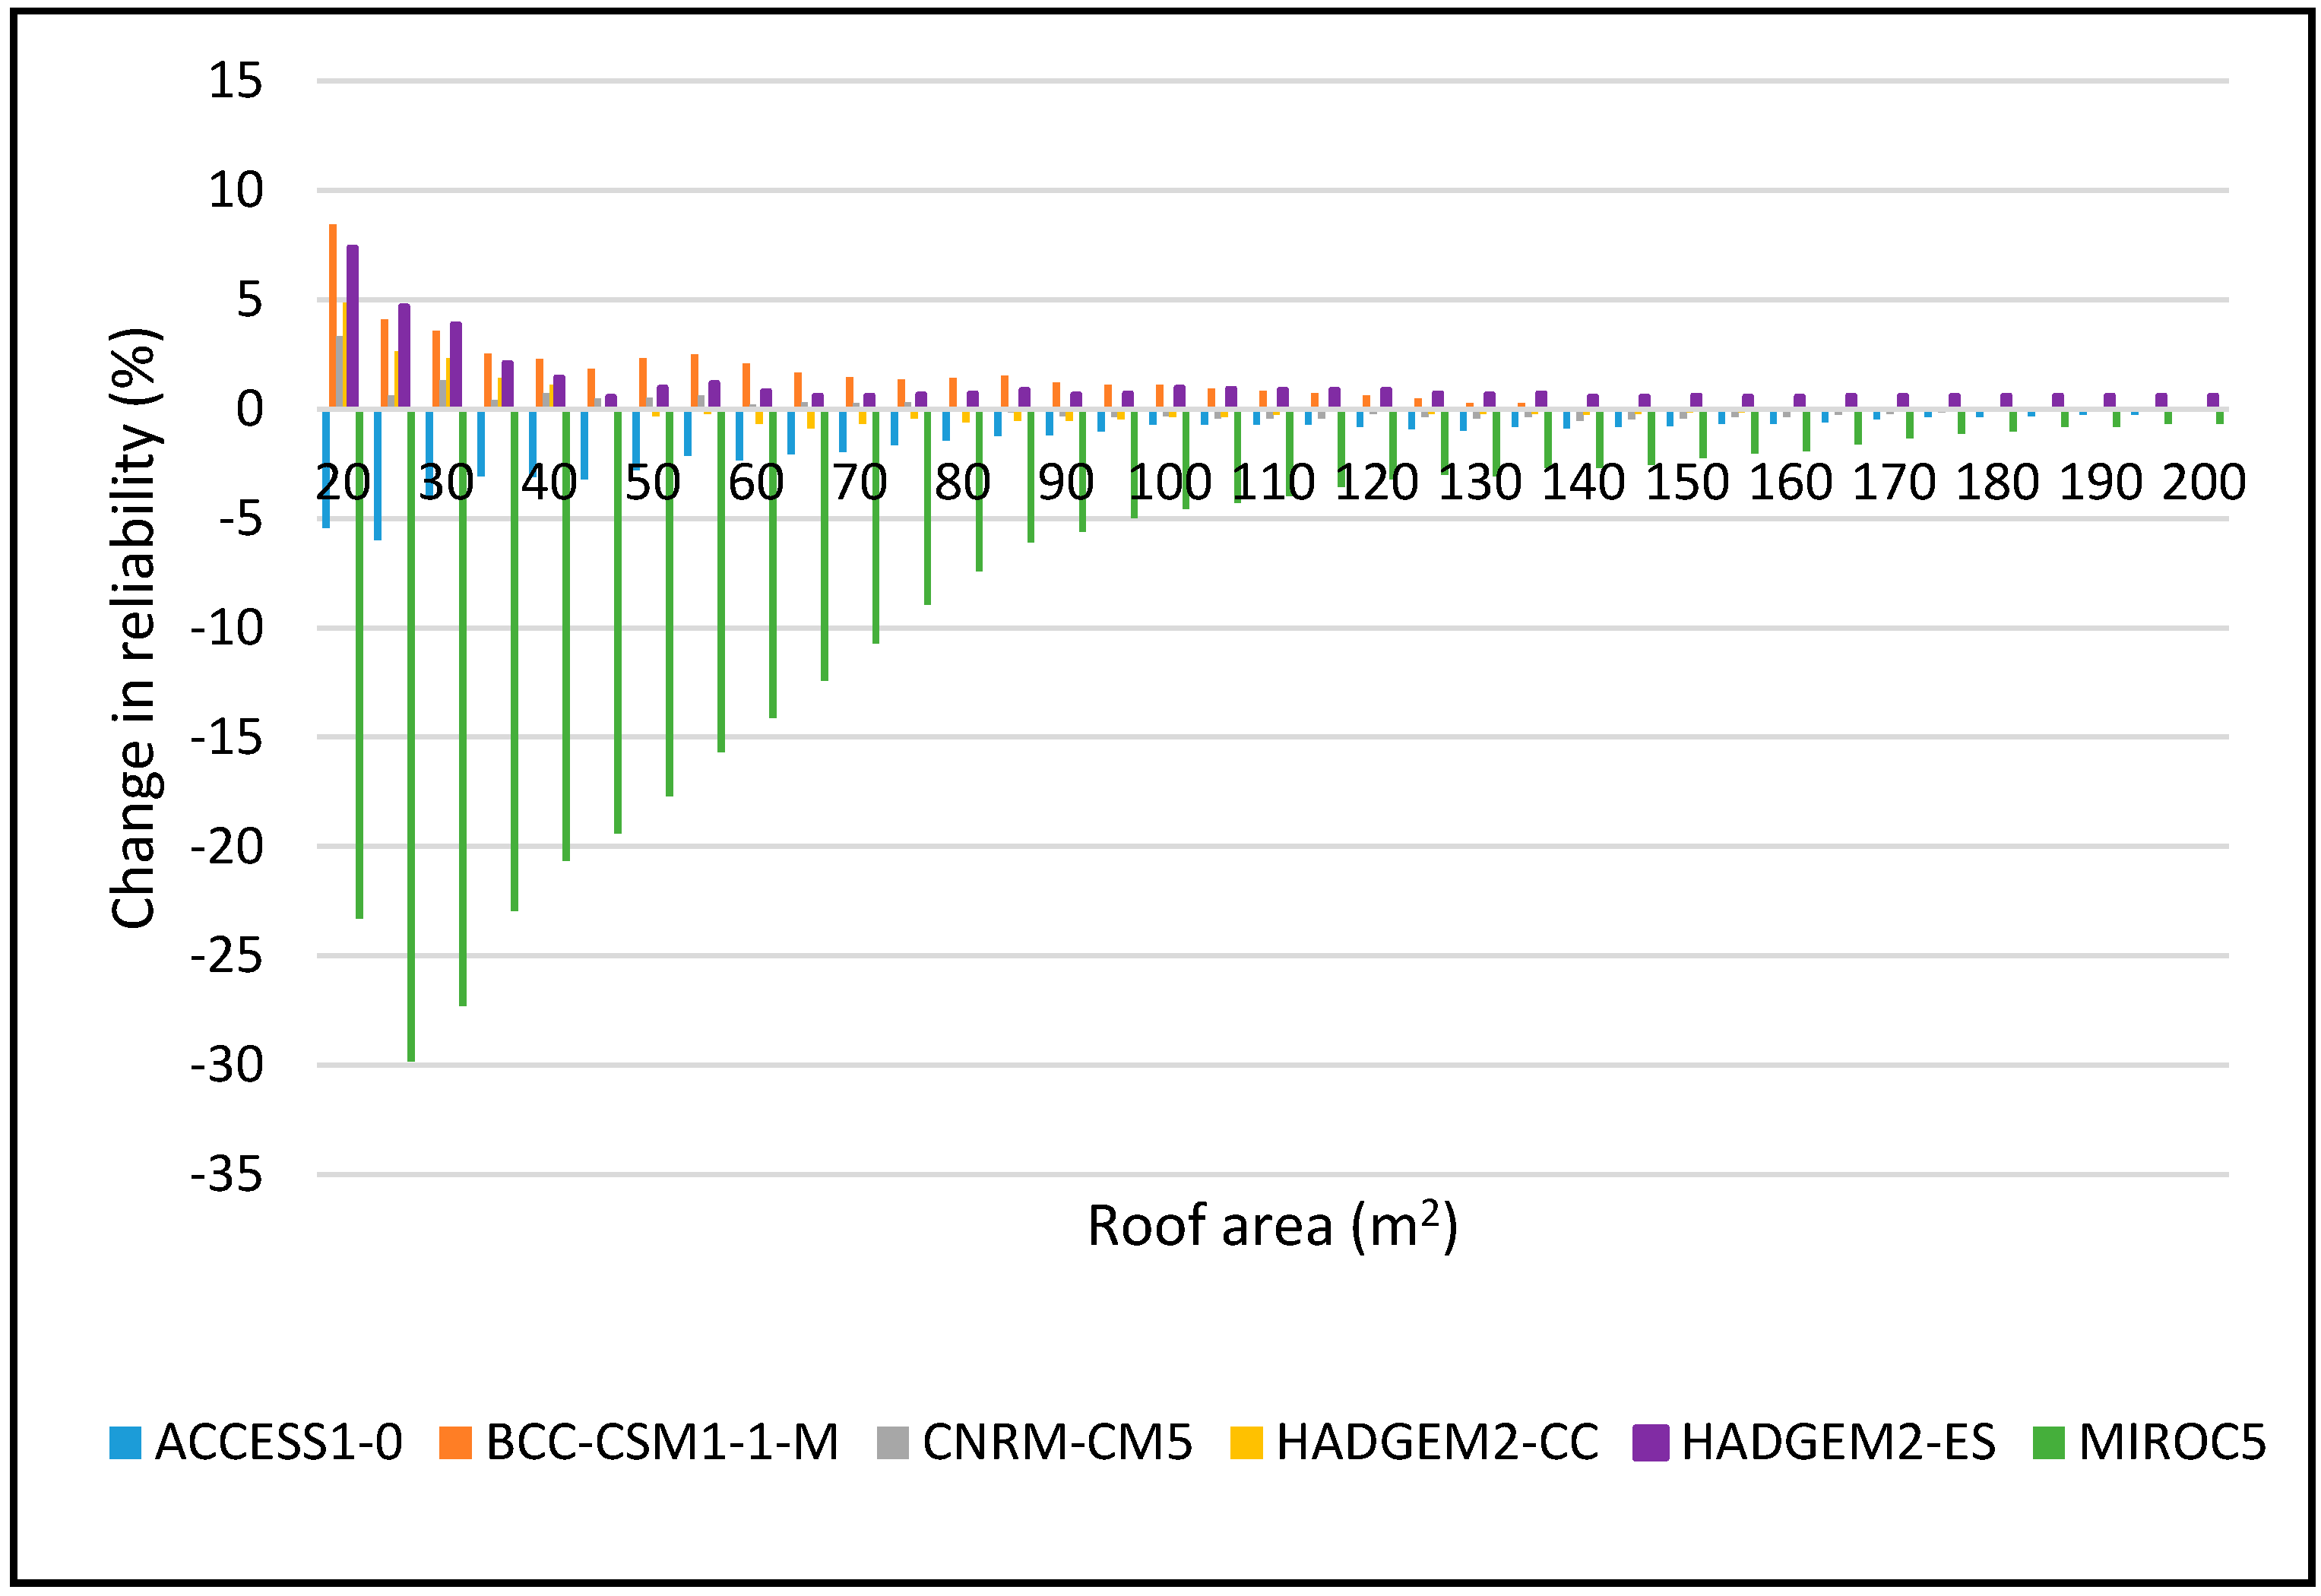
Water 10 00071 g018
Figure 19. JJA showing change in reliability for 2060–2090 period for 5 m3.
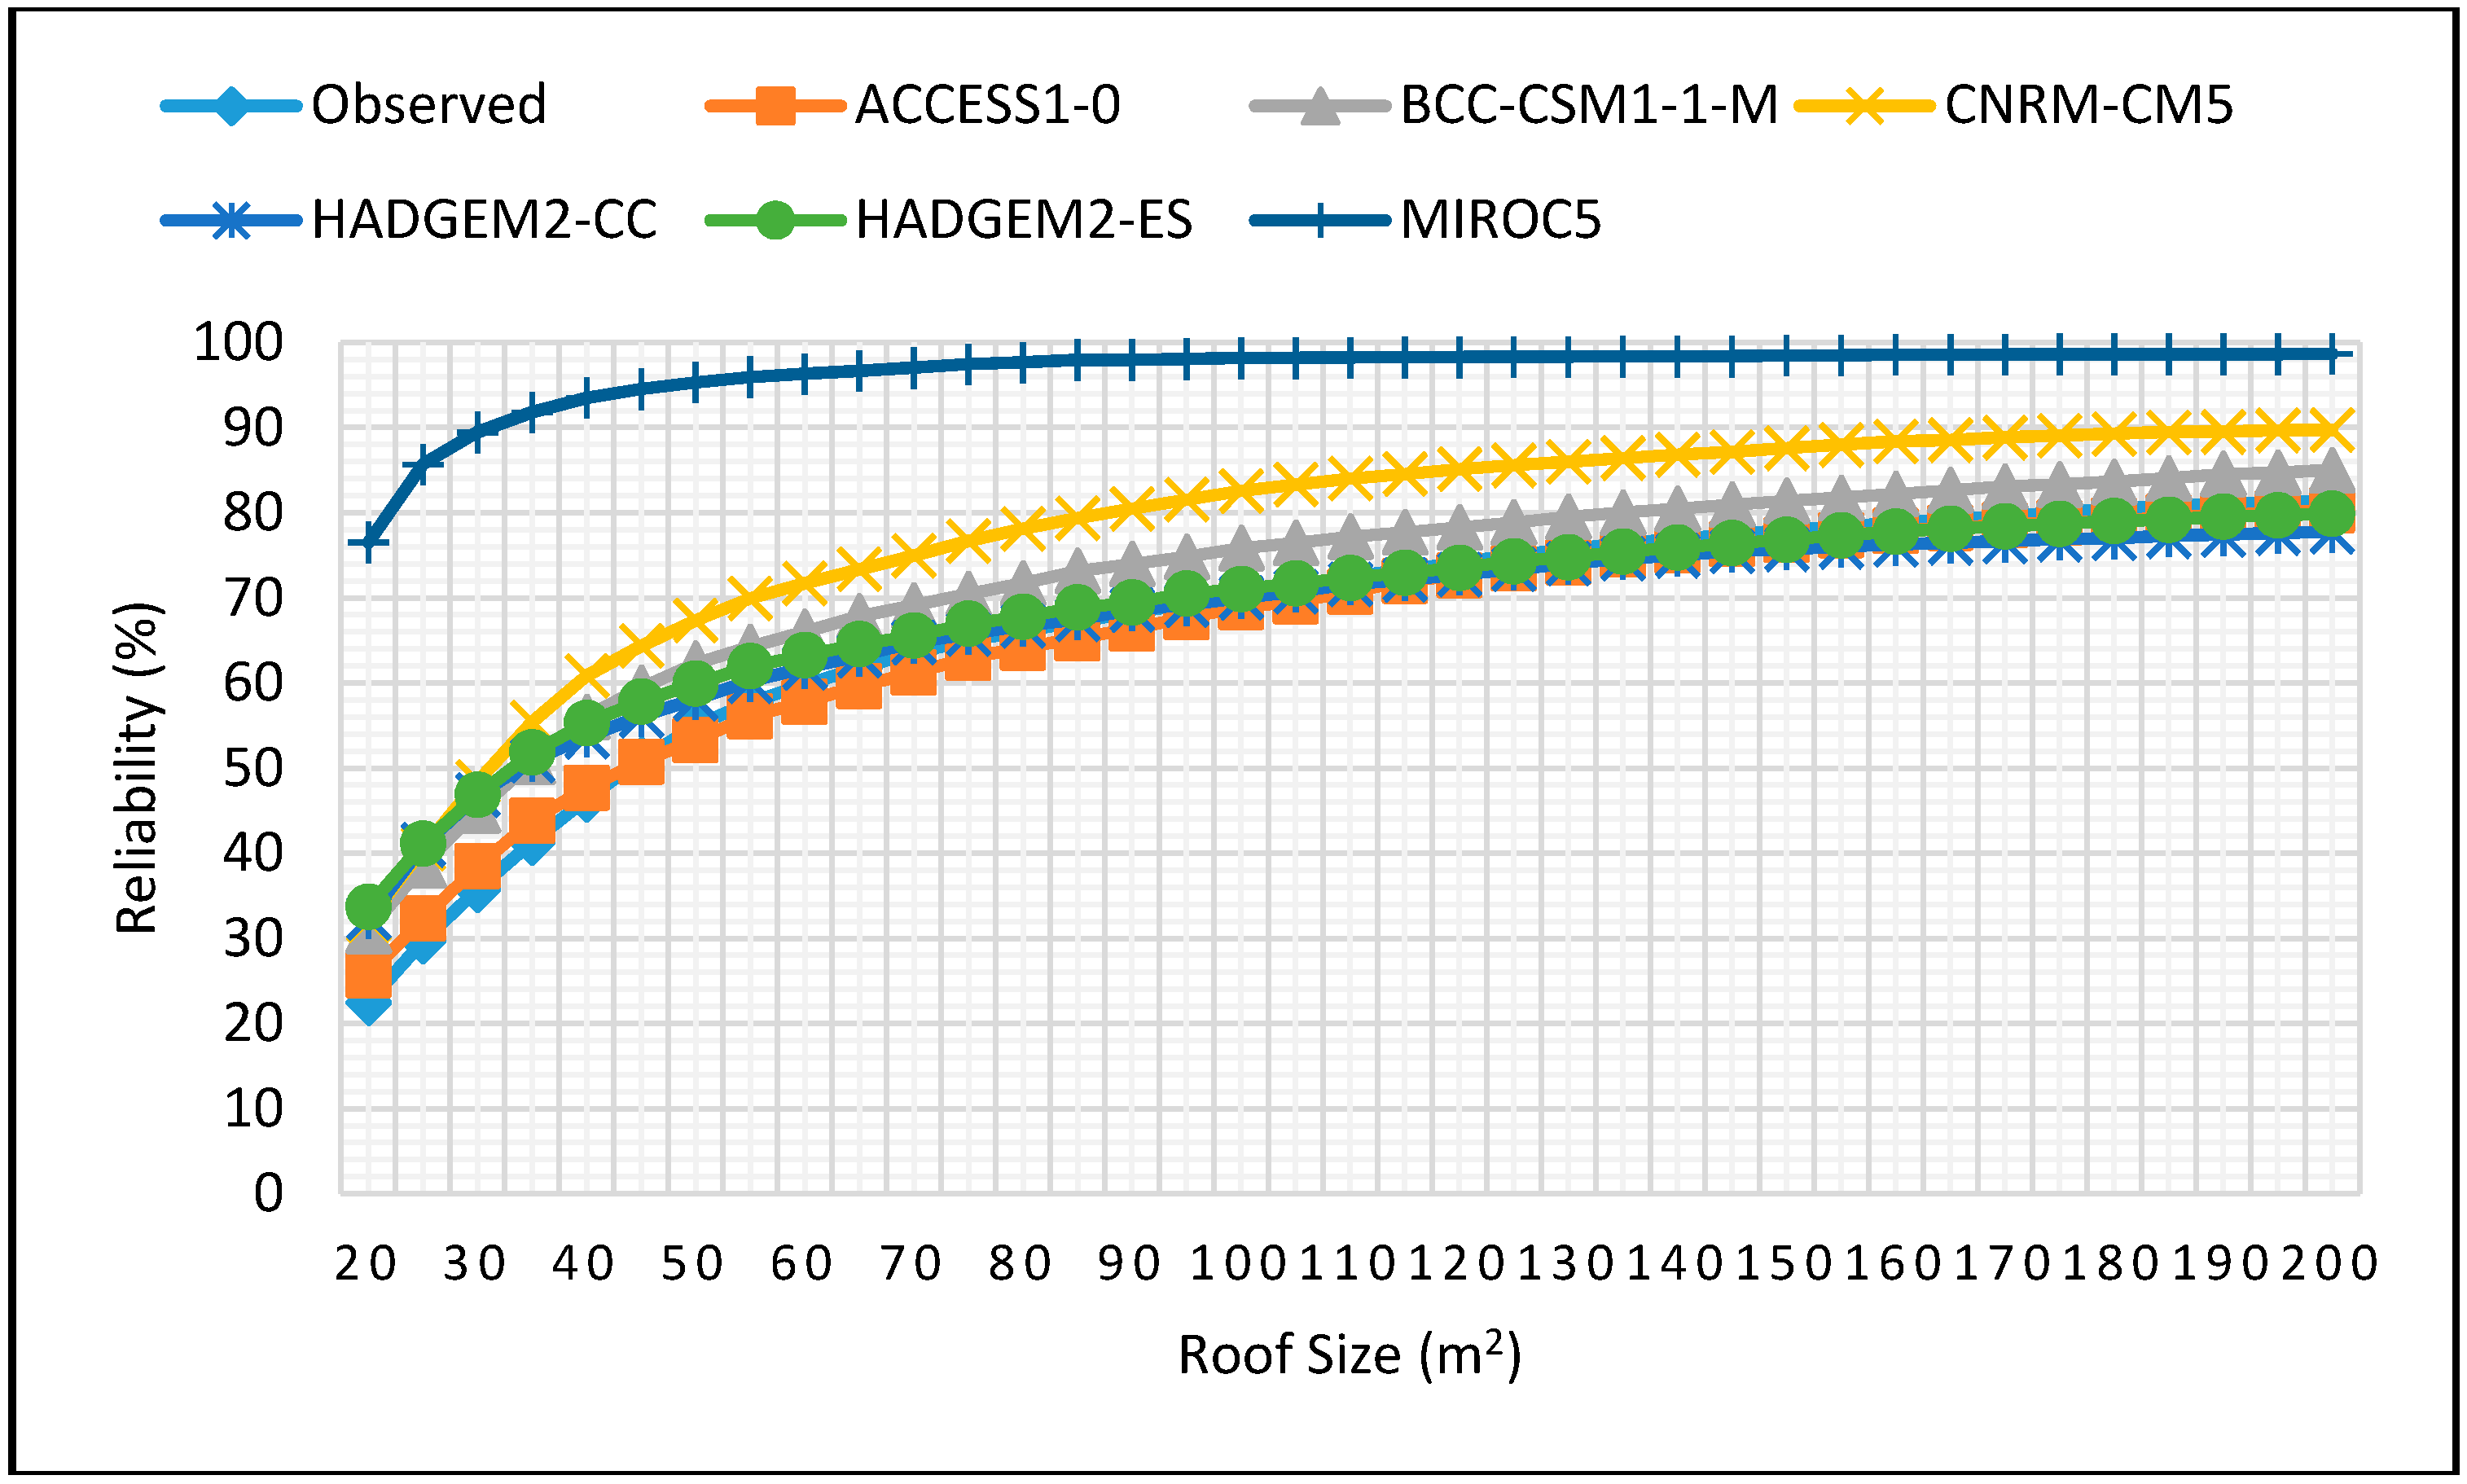
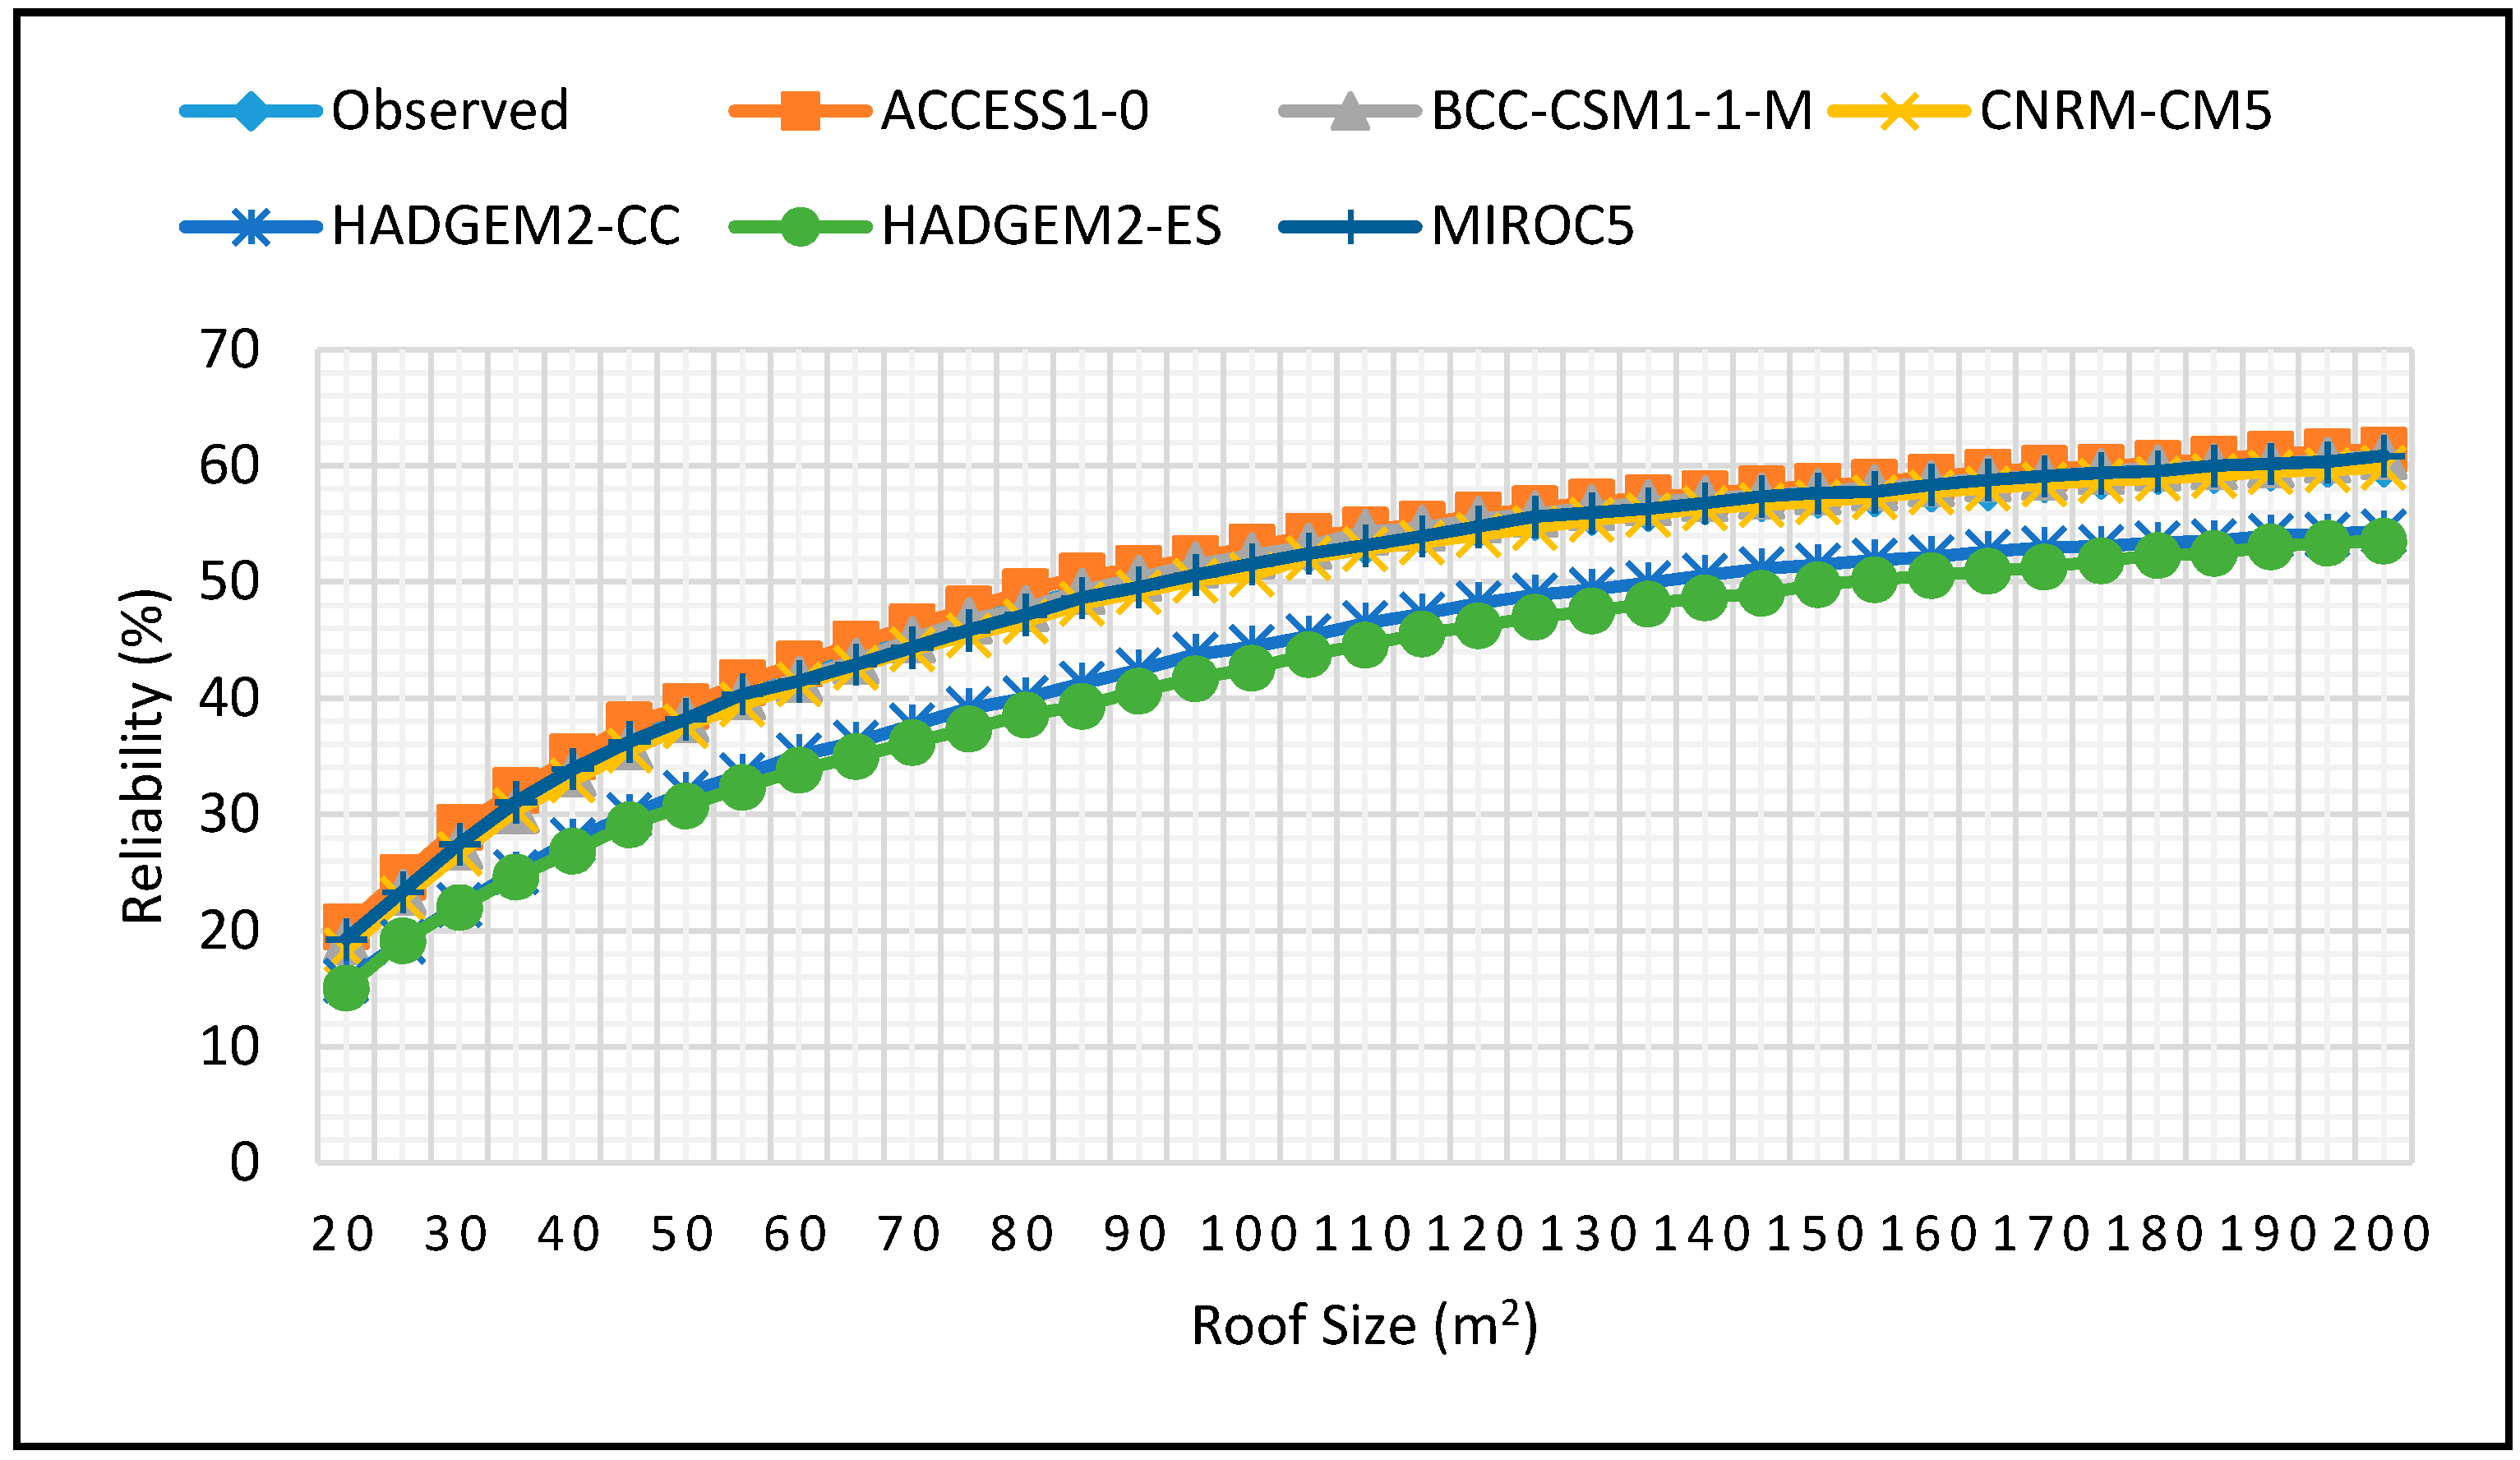
Water 10 00071 g019
Figure 20. Reliability projections for JJA season for 0.5 m3 tank size for 2060–2090 period.
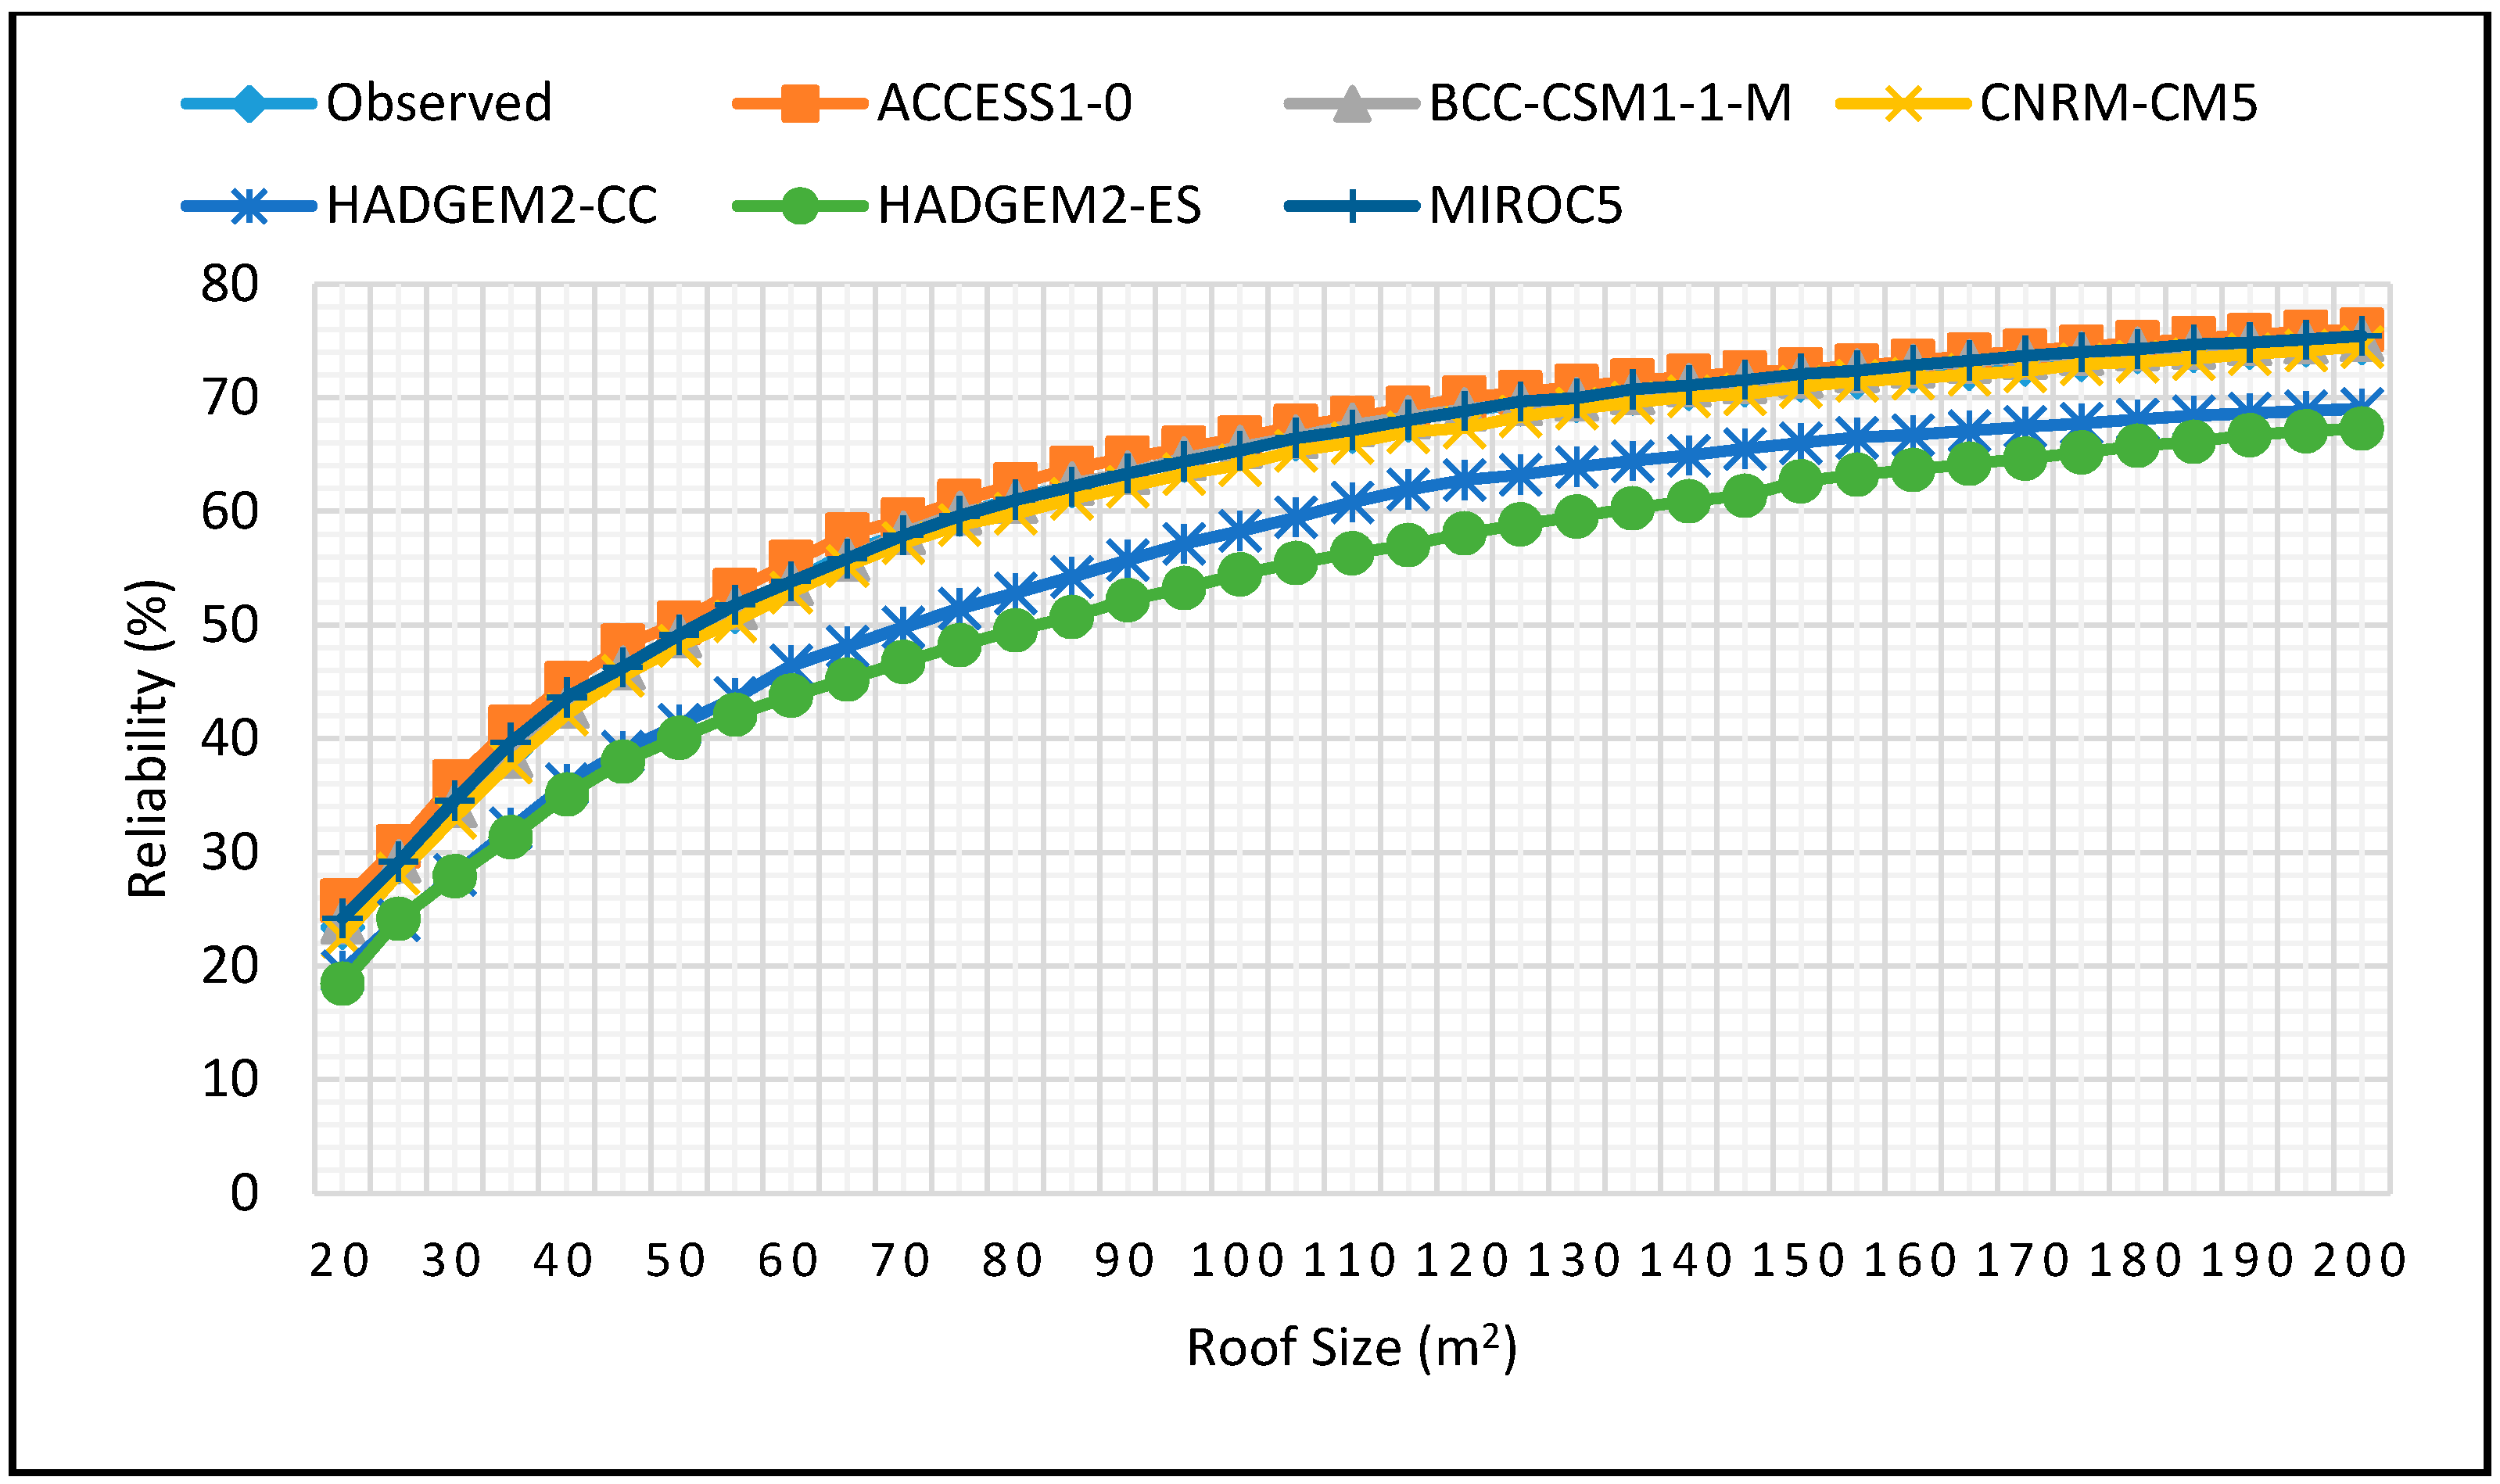
Water 10 00071 g020
Figure 21. Reliability projections for JJA season for 1 m3 tank size for 2060–2090 period.
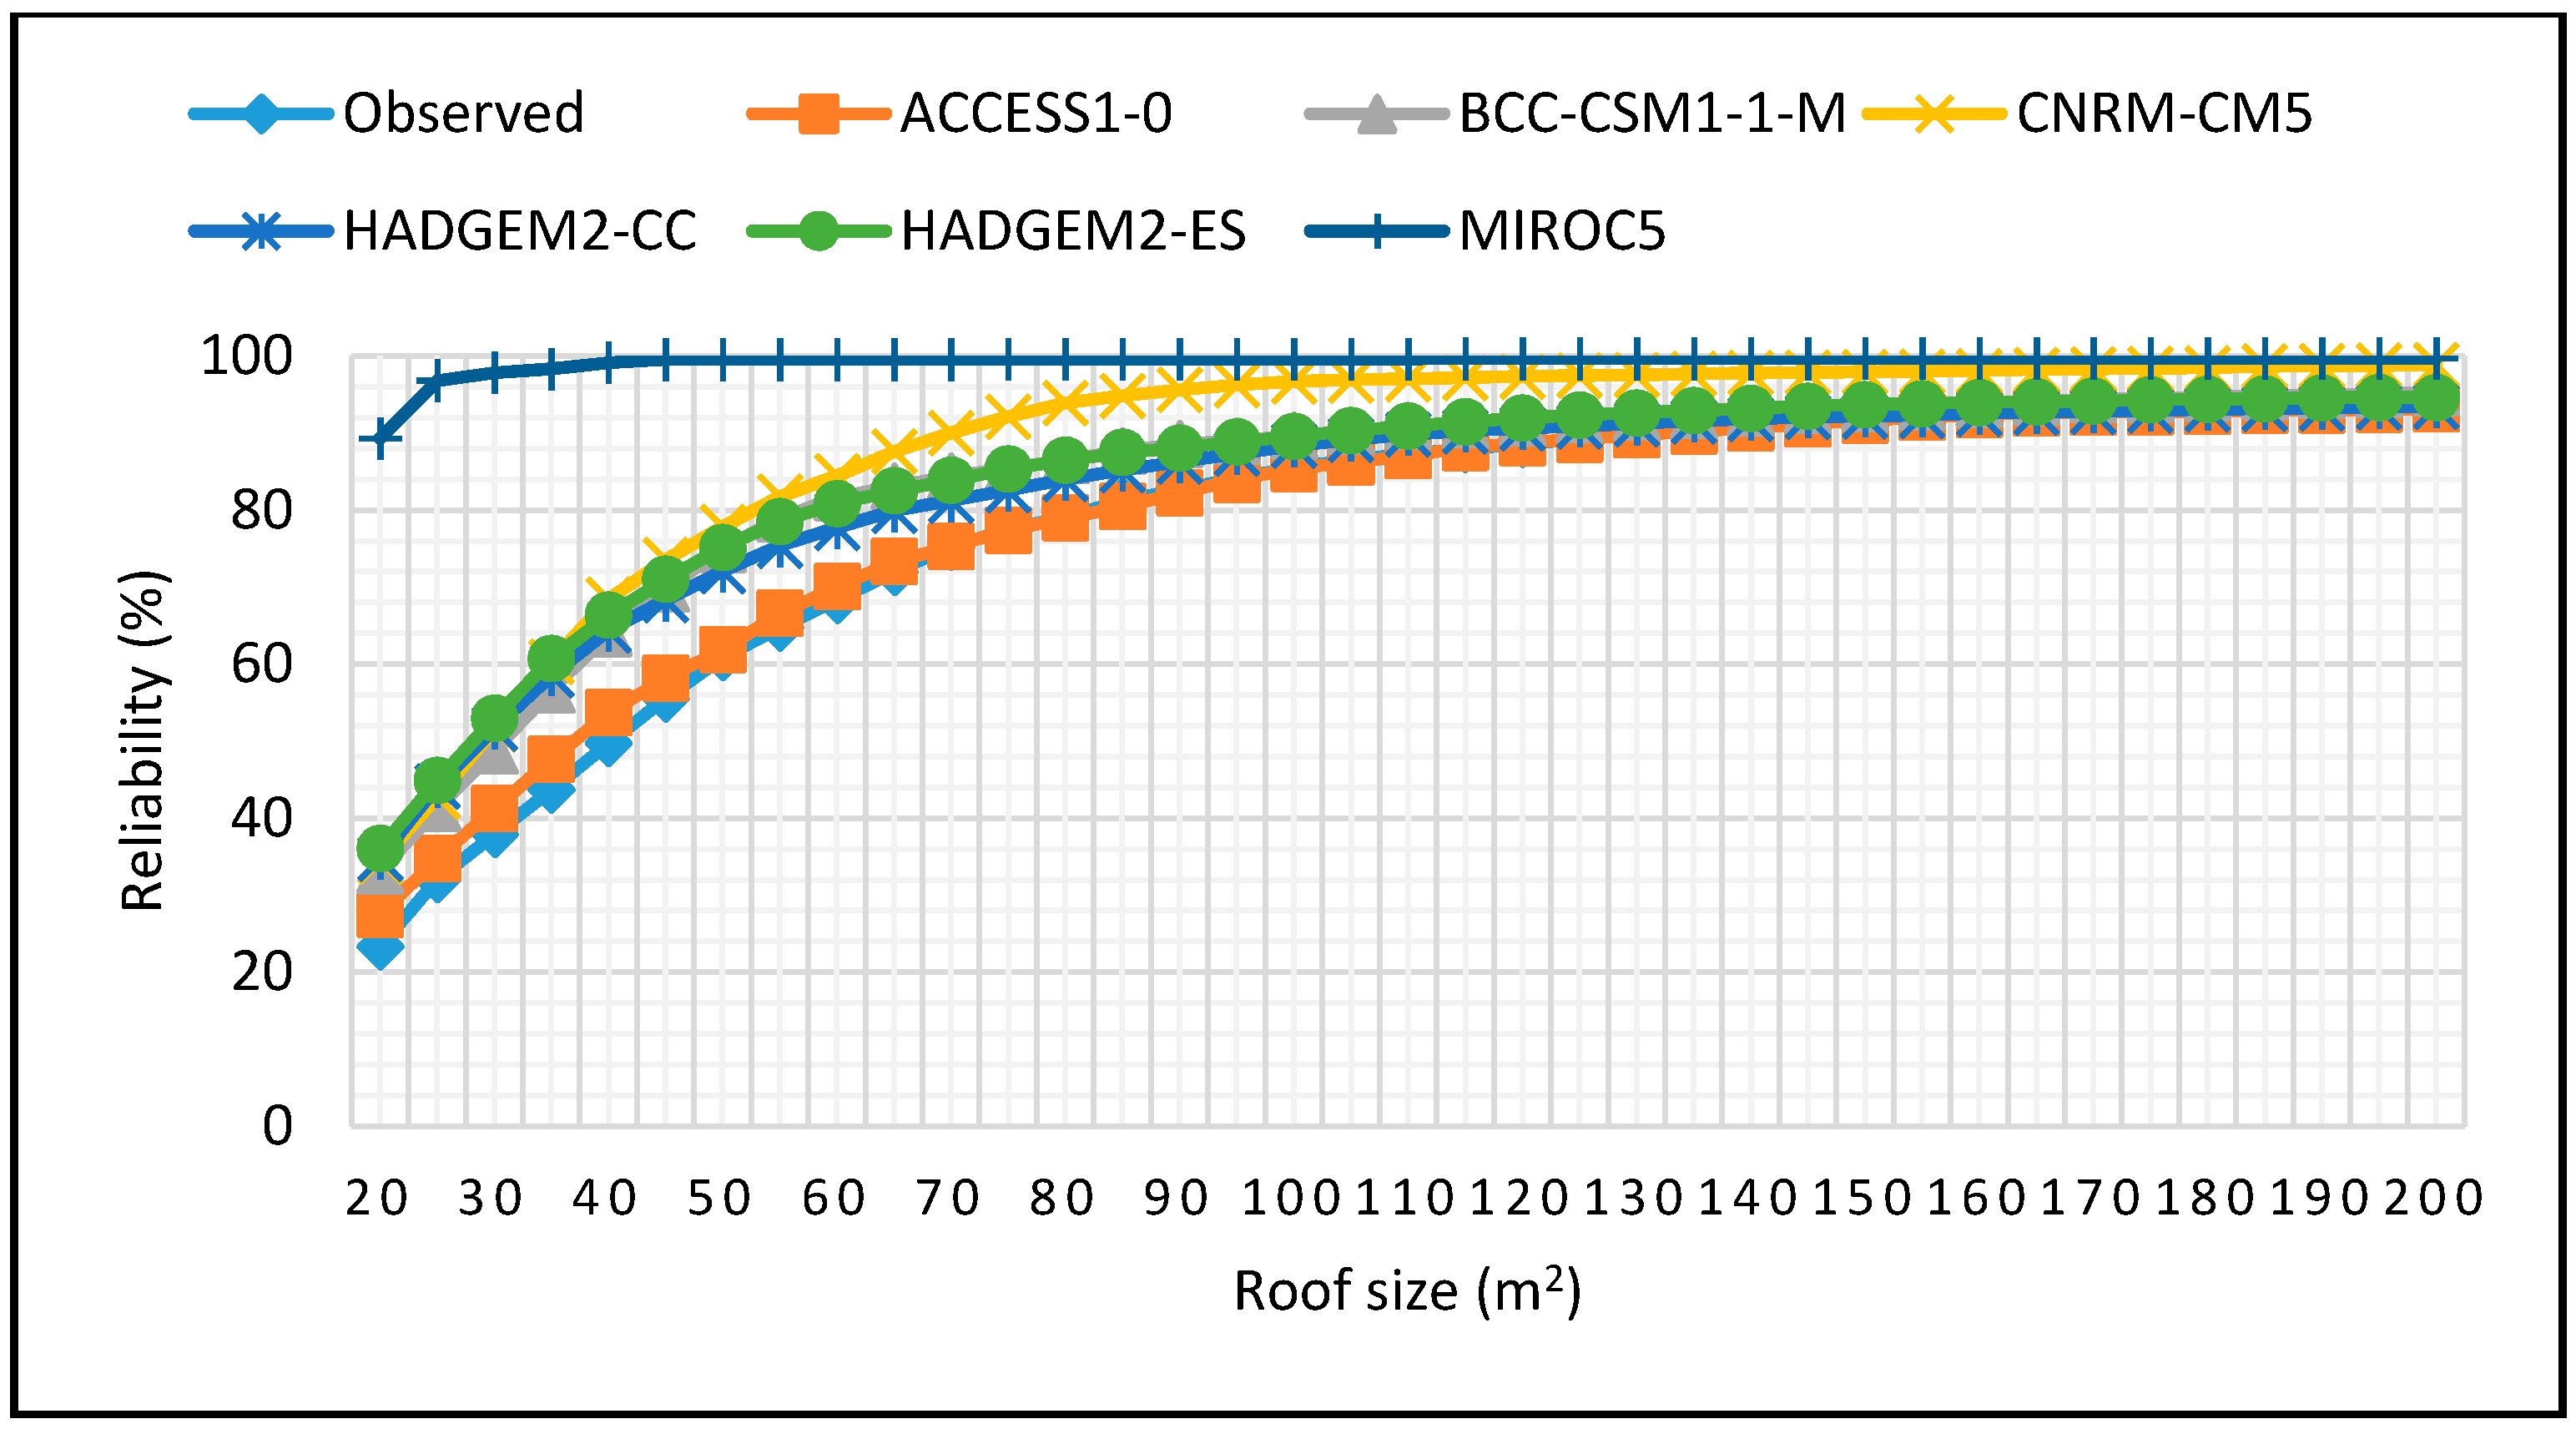
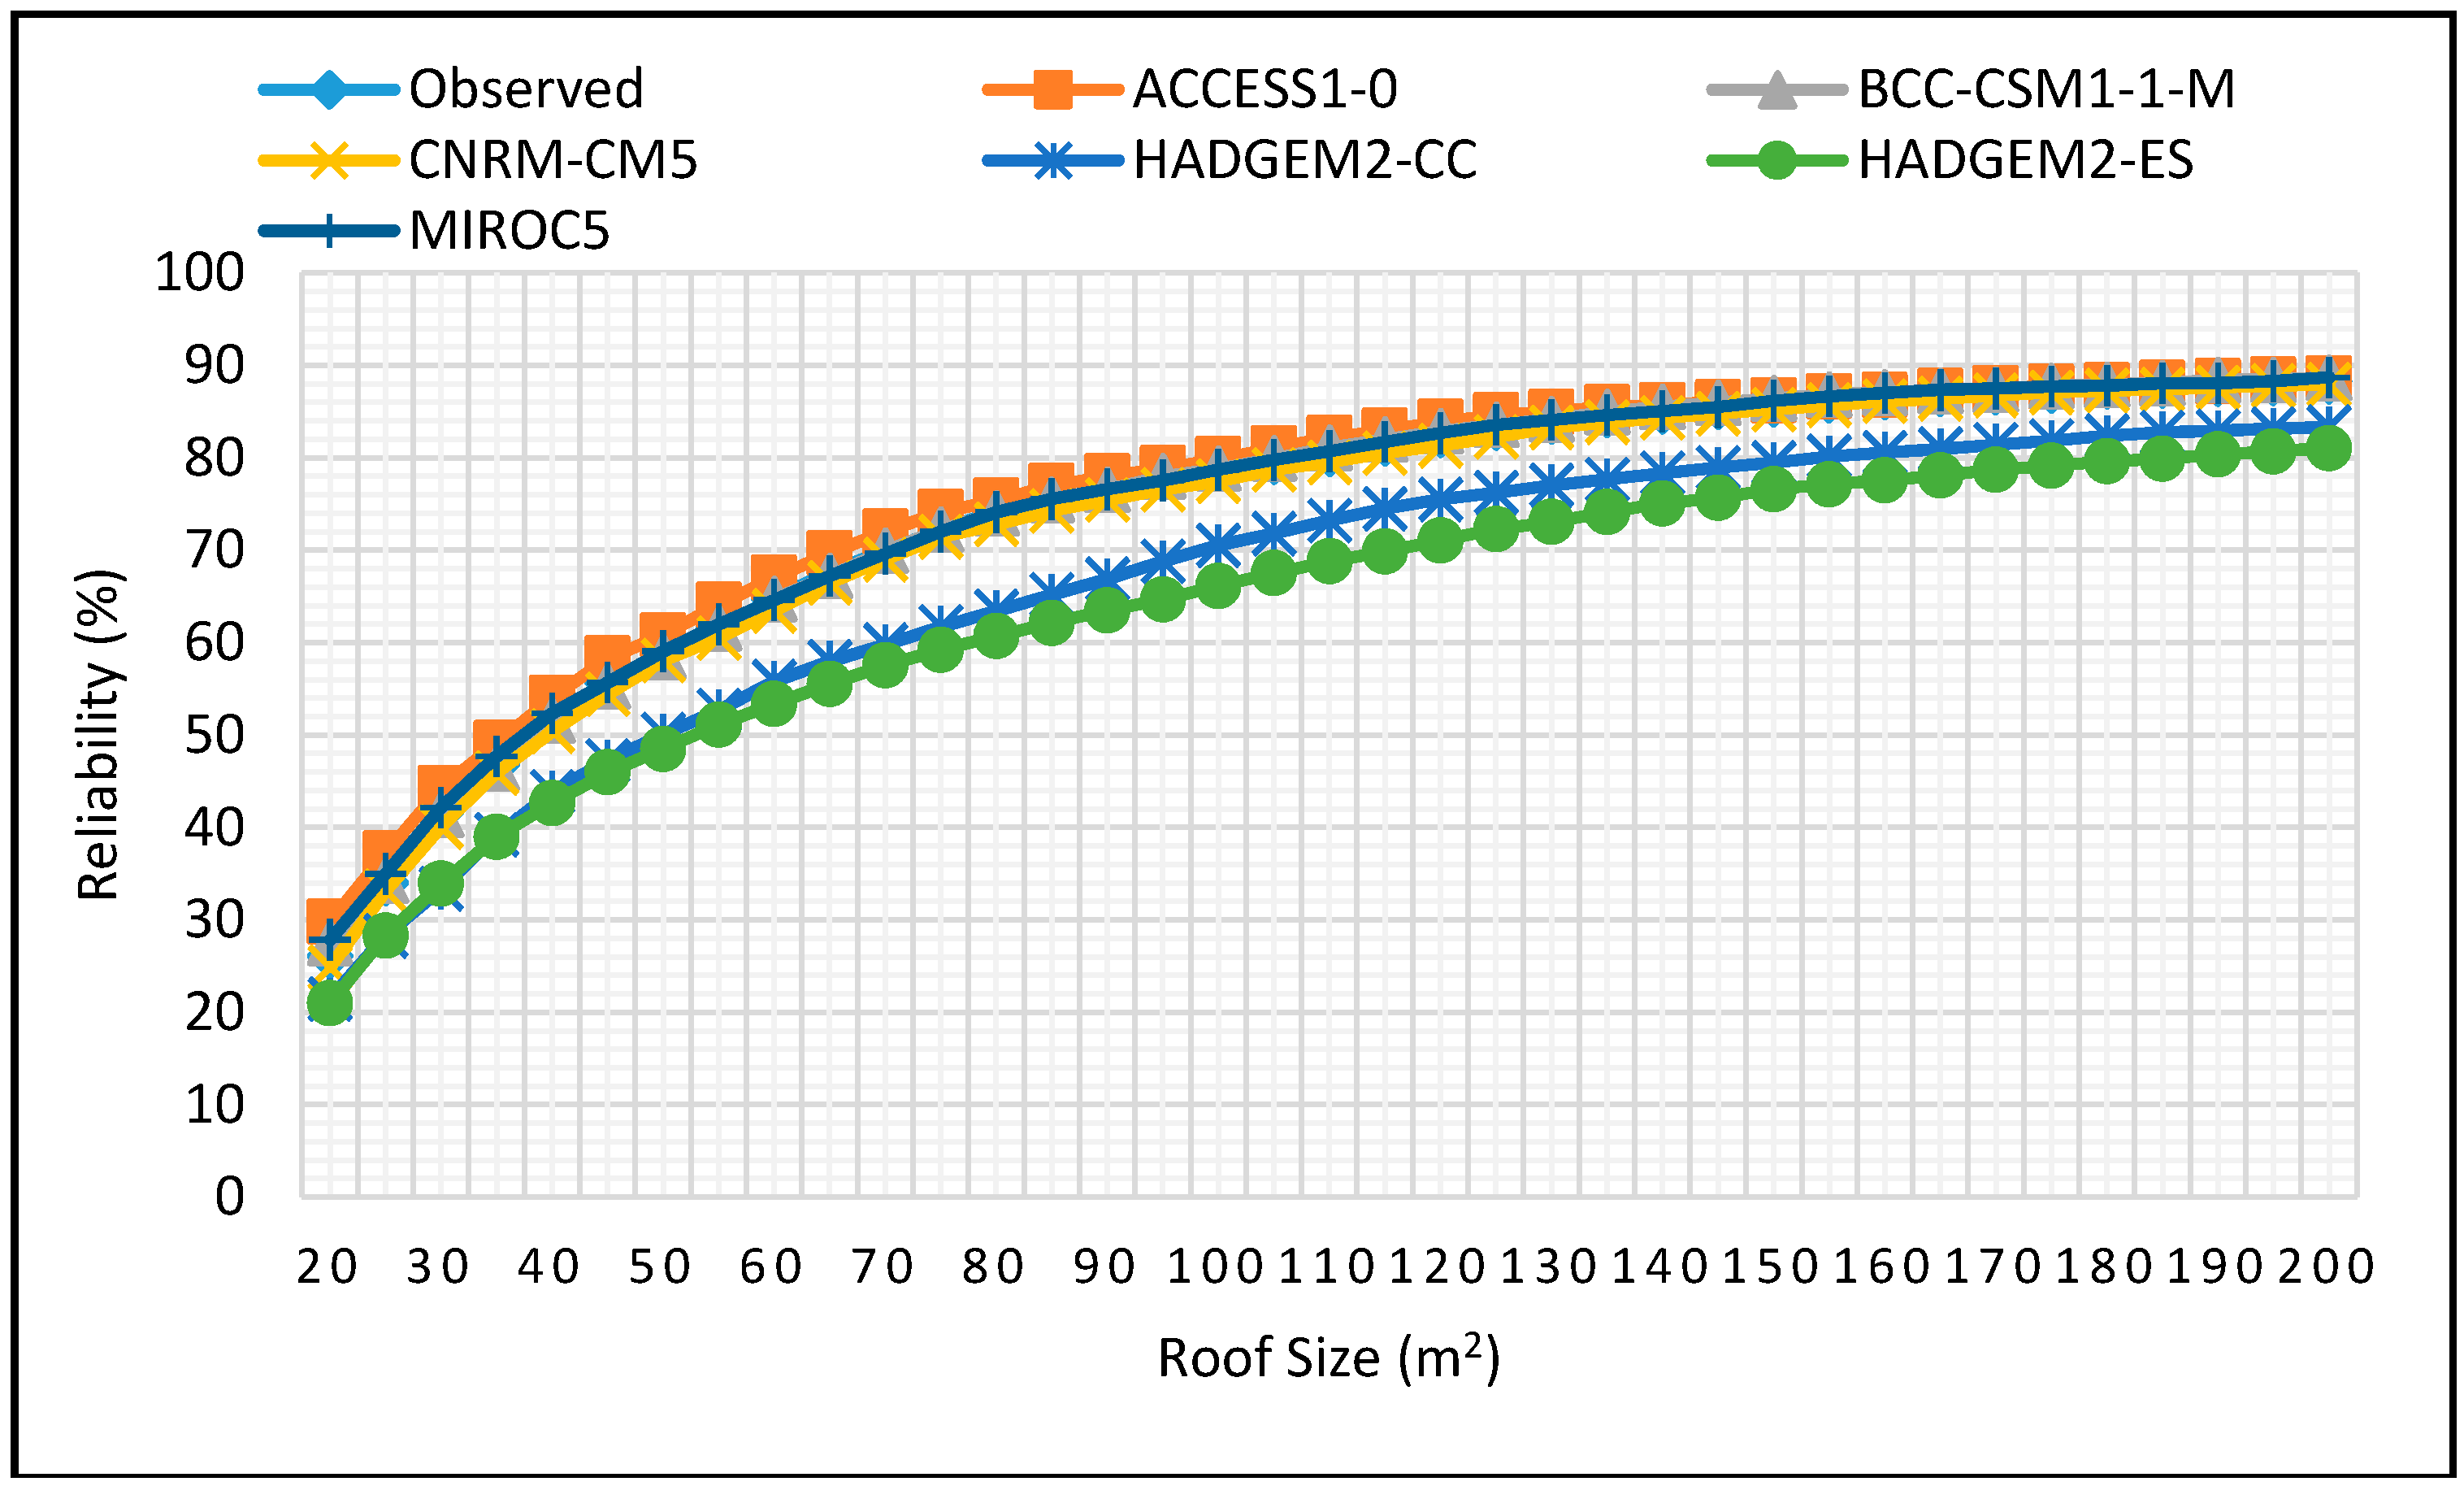
Water 10 00071 g021
Figure 22. Reliability projections for JJA season for 2 m3 tank size for 2060–2090 period.
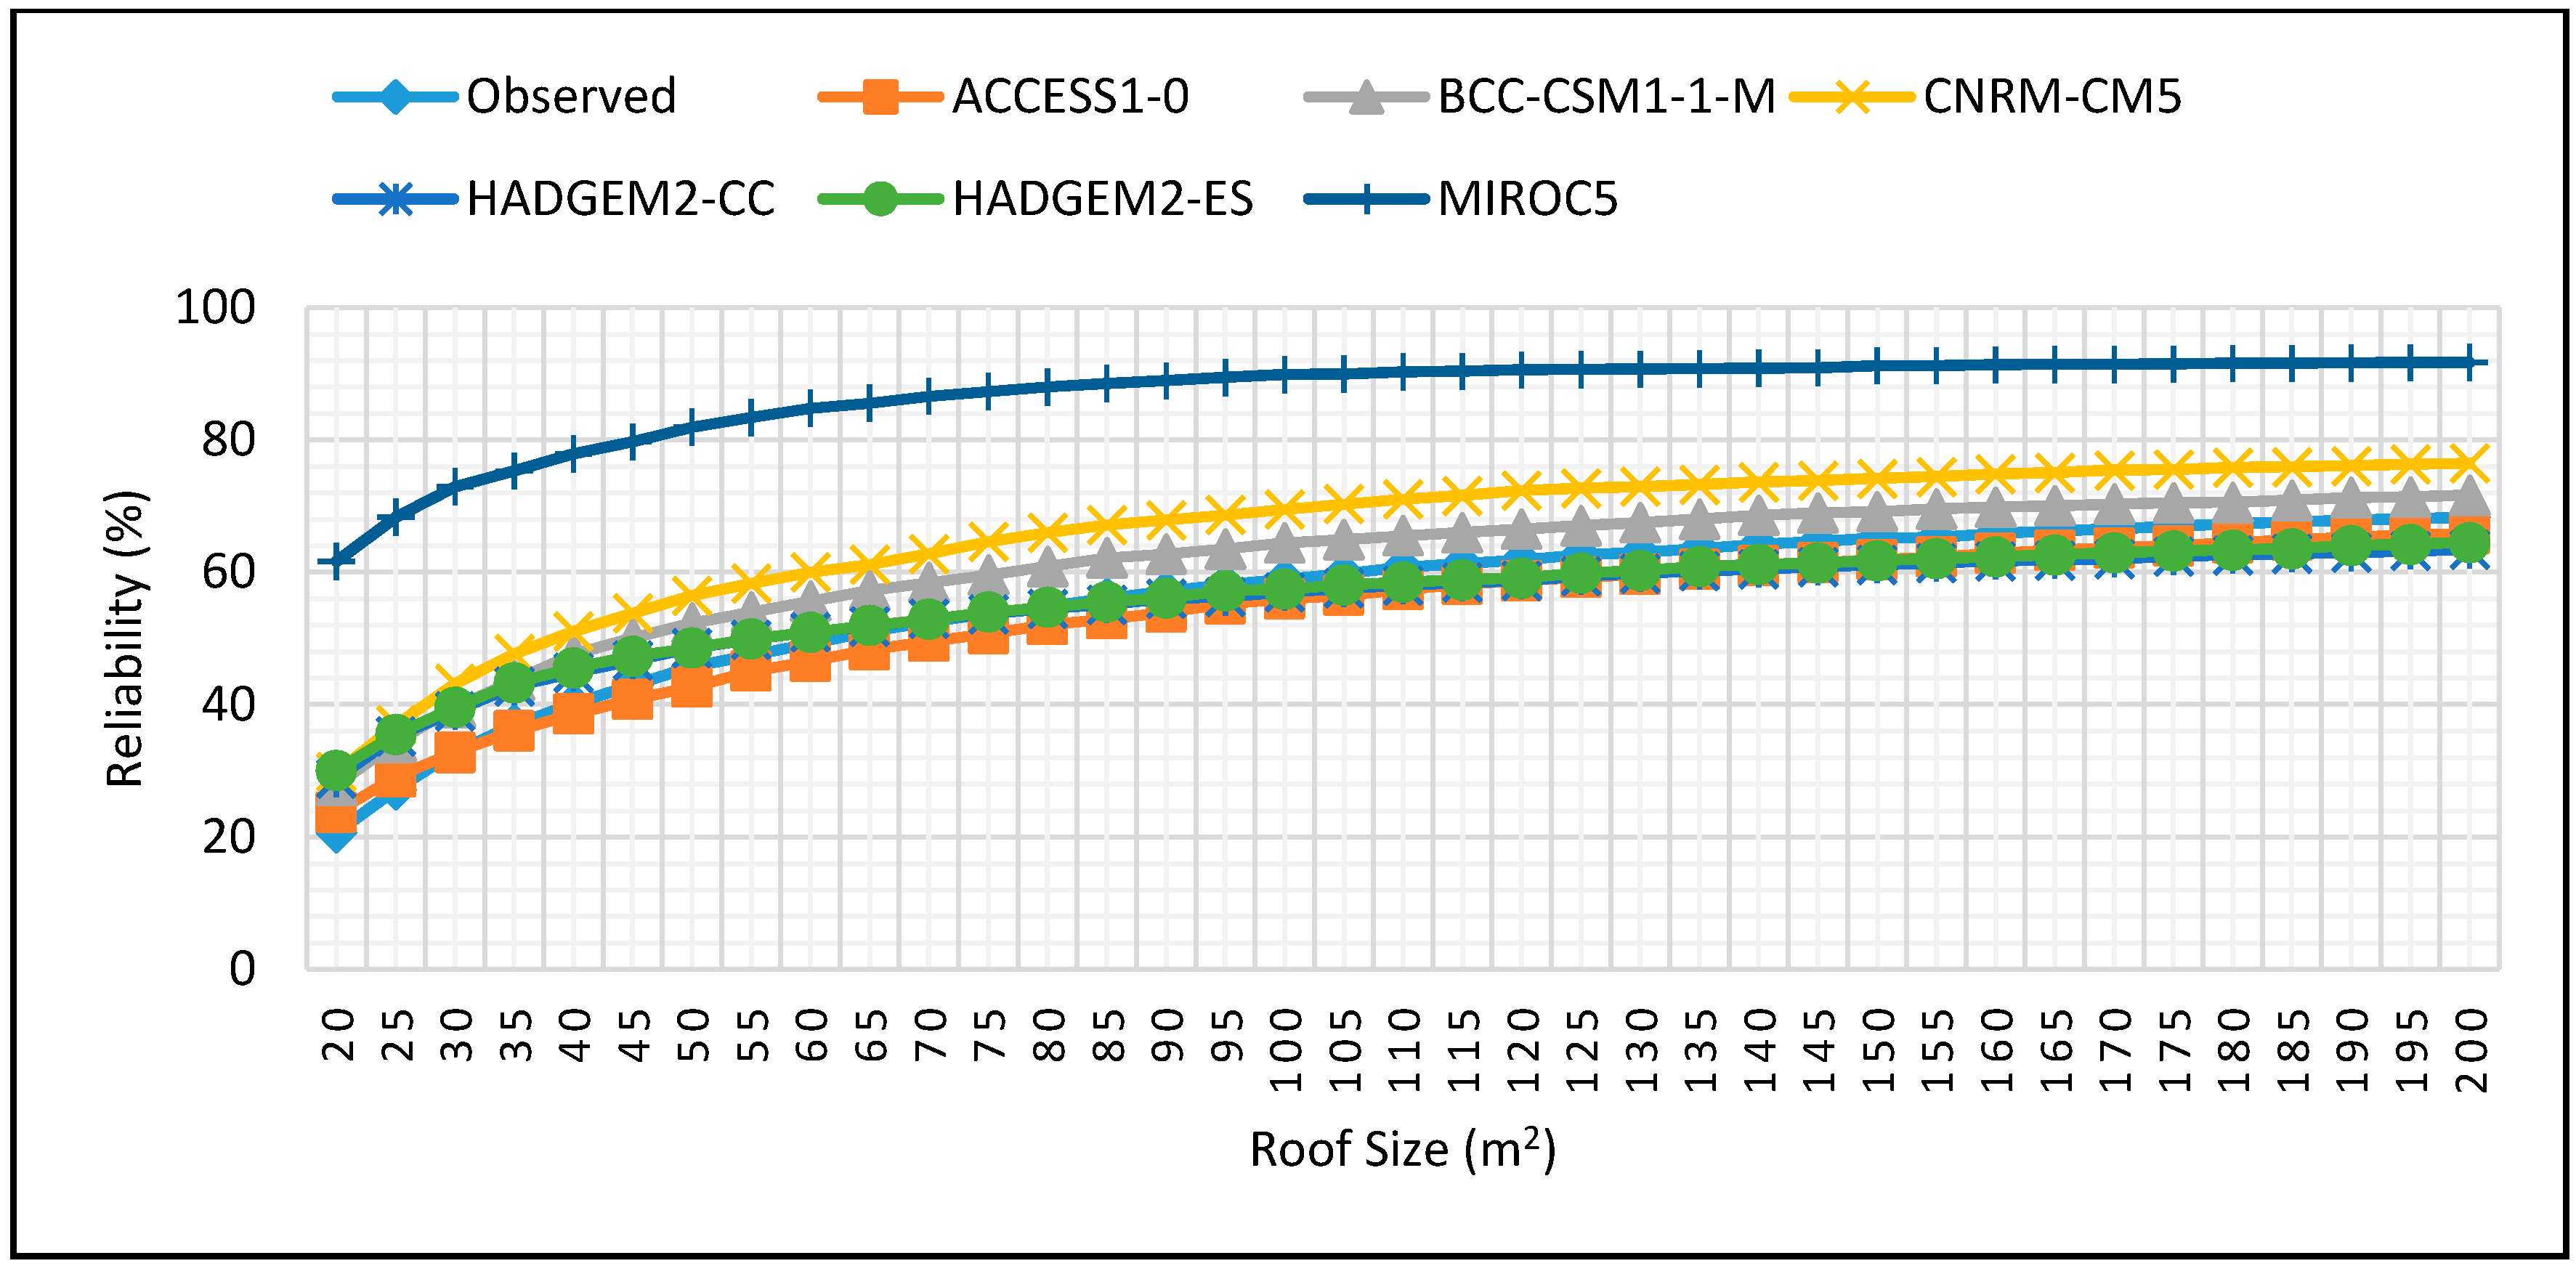
Water 10 00071 g022
Figure 23. Reliability projections for JJA season for 5 m3 tank size for 2060–2090 period.
Water 10 00071 g023
Figure 24. Change in reliability for MAM 2025–2055 period for 2 m3 tank size.
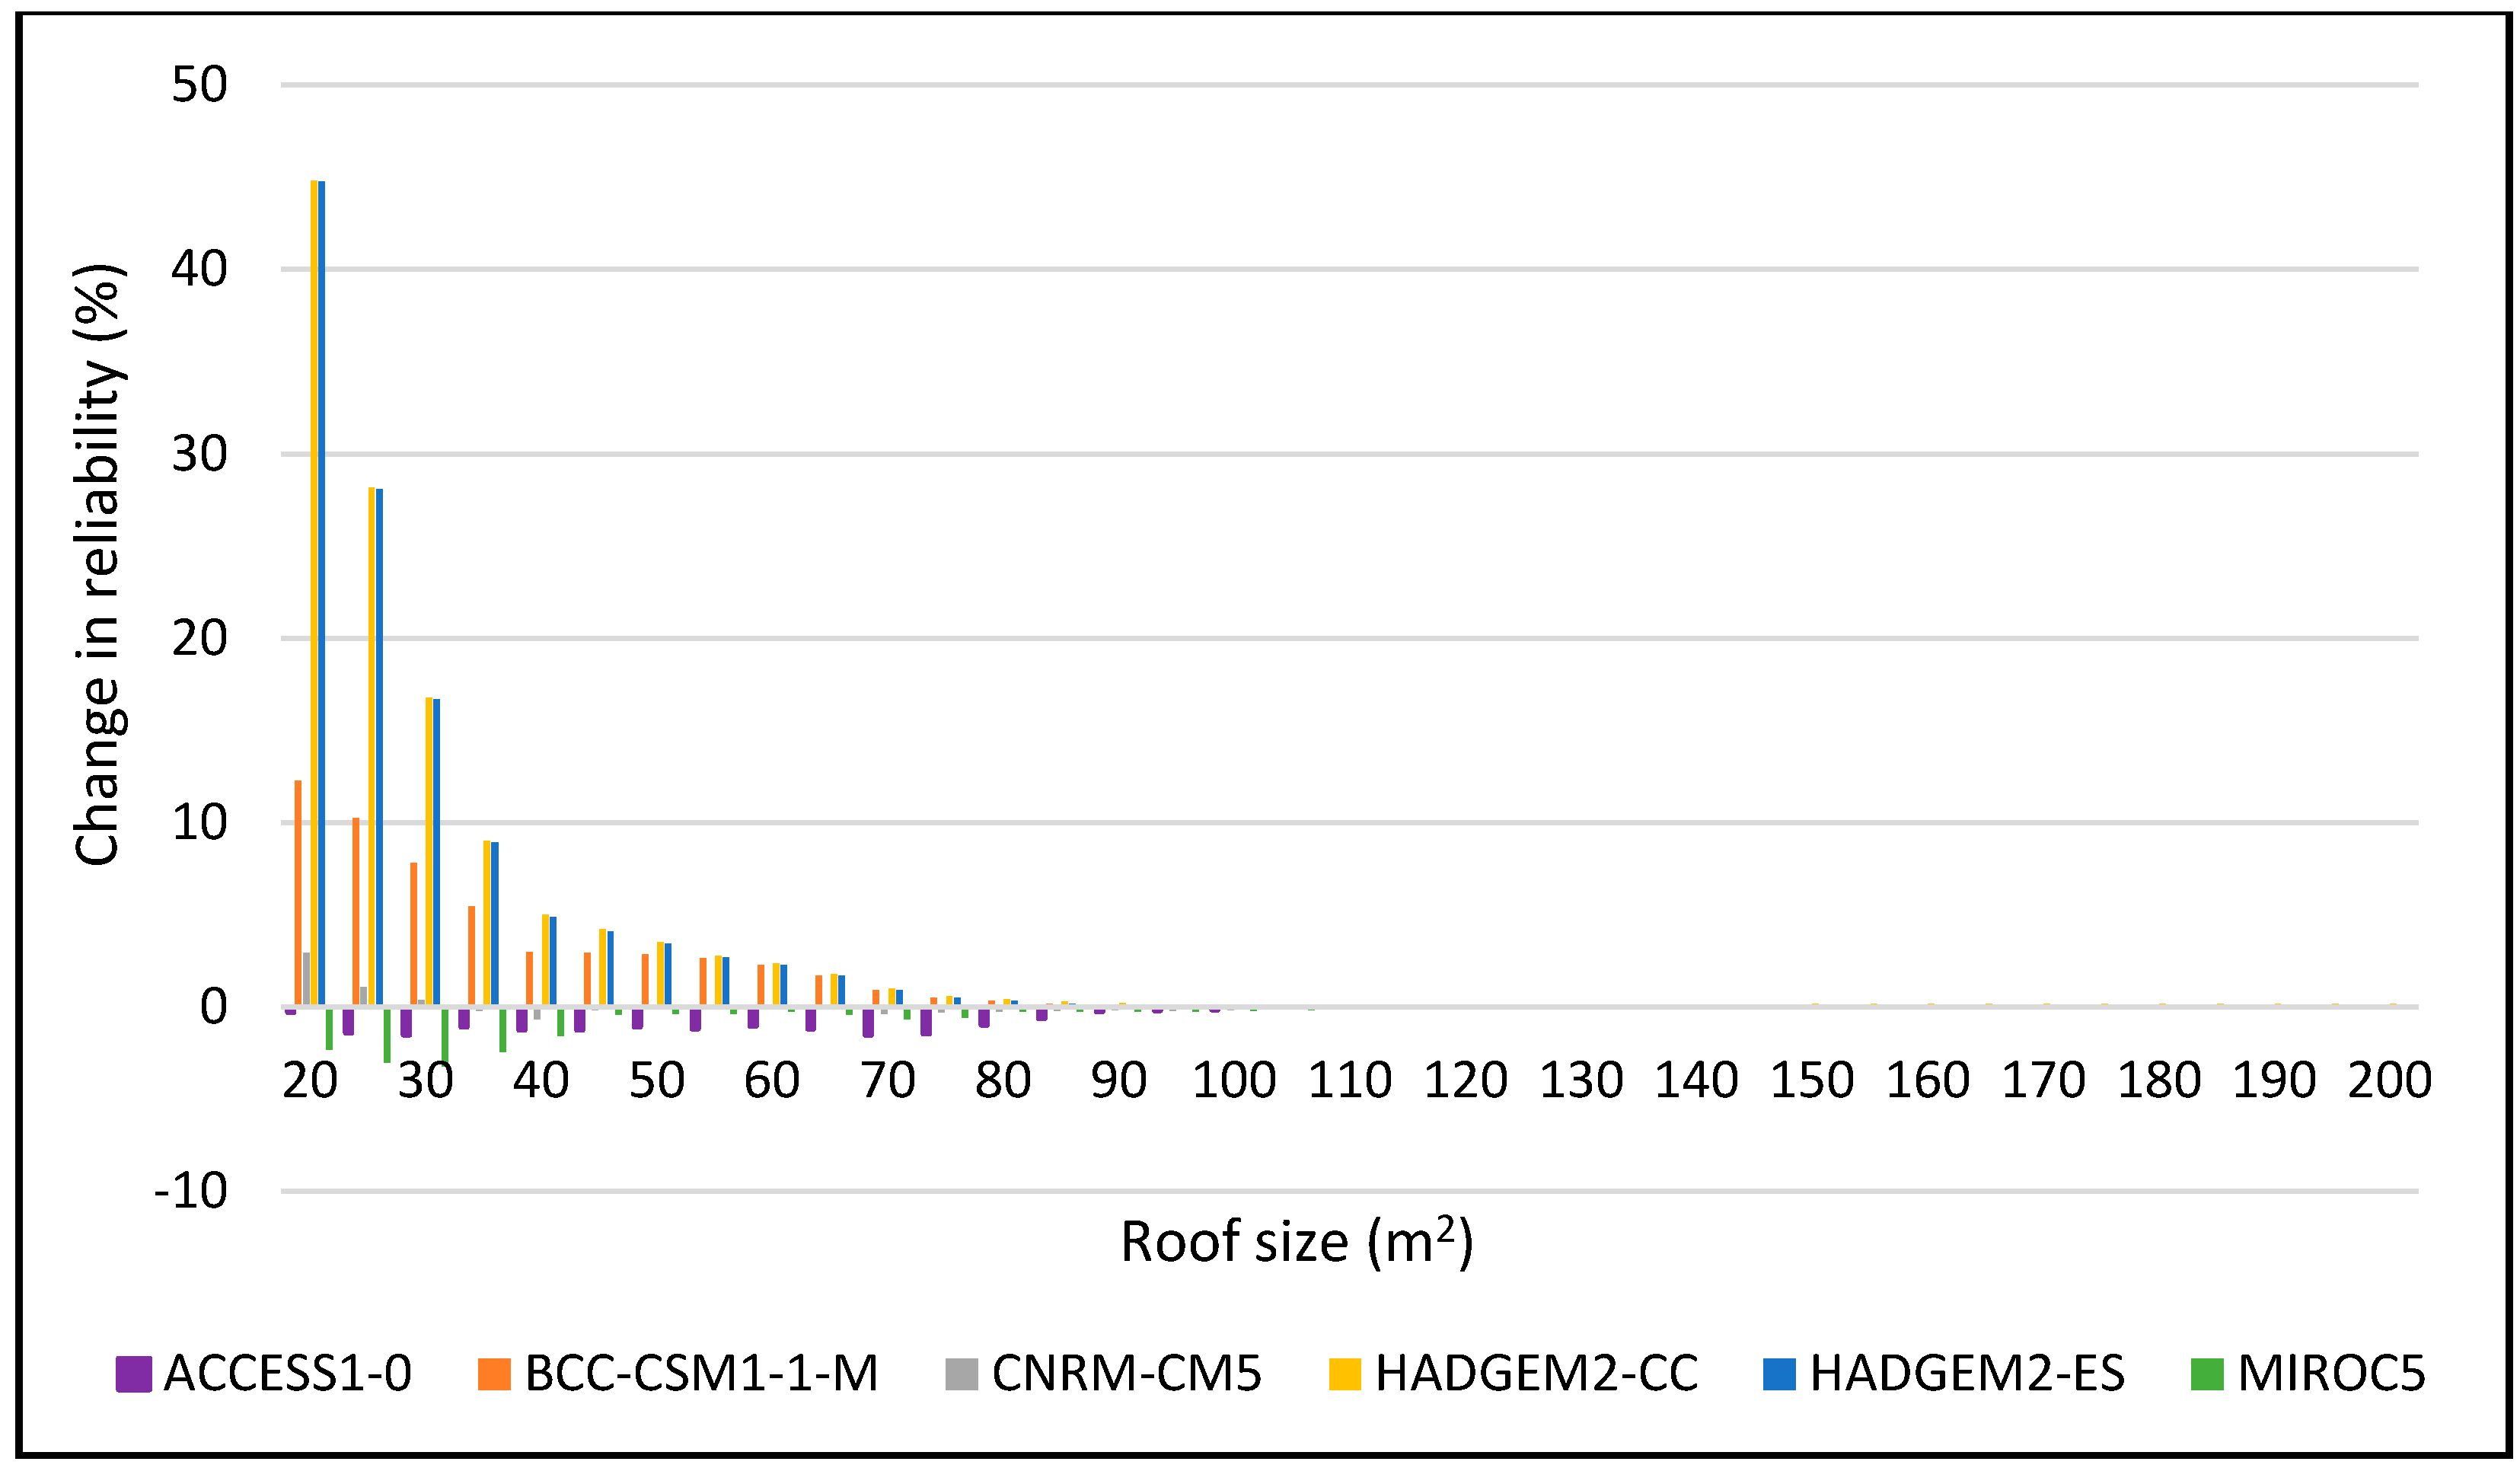
Water 10 00071 g024
Figure 25. Change in reliability for MAM 2025–2055 period for 5 m3 tank size.
Water 10 00071 g025
Figure 26. Change in reliability for MAM 2060–2090 period for 2 m3 tank size.
Water 10 00071 g026
Figure 27. Change in reliability for MAM 2060–2090 period for 5 m3 tank size.
Water 10 00071 g027
Figure 28. Reliability projections for MAM season for 0.5 m3 tank size for 2060–2090 period.
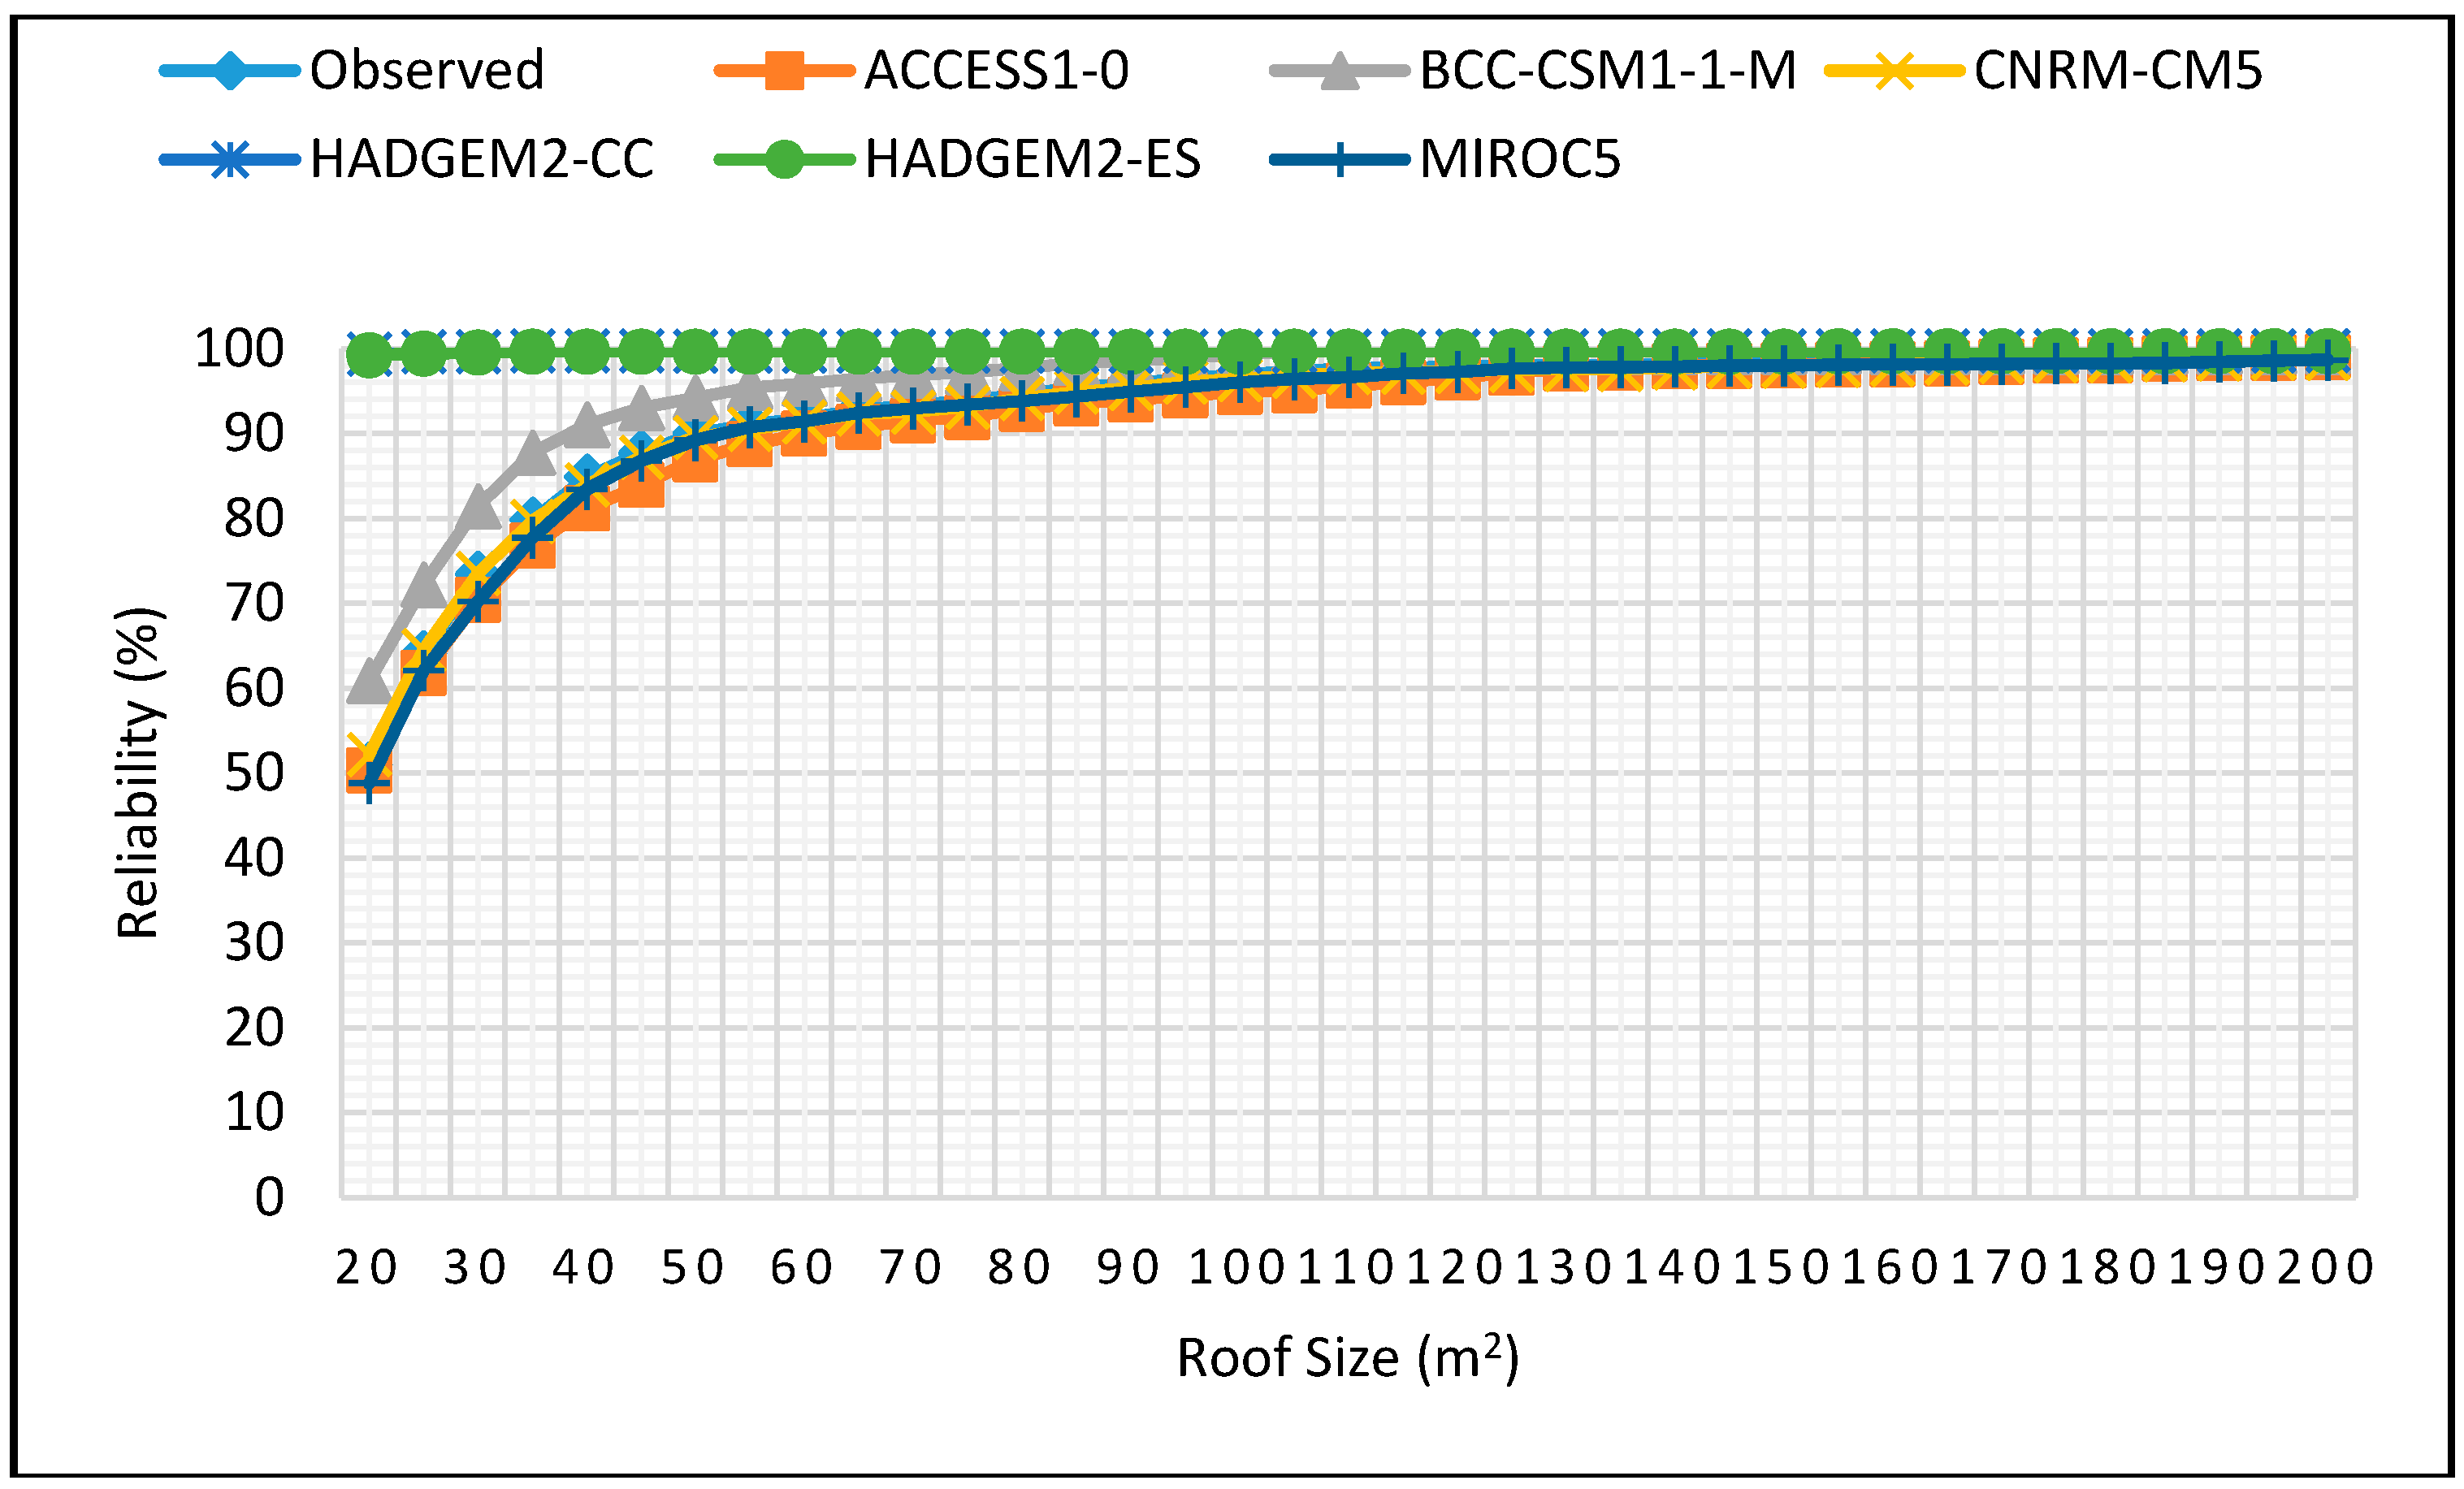
Water 10 00071 g028
Figure 29. Reliability projections for MAM season for 2 m3 tank size for 2060–2090 period.
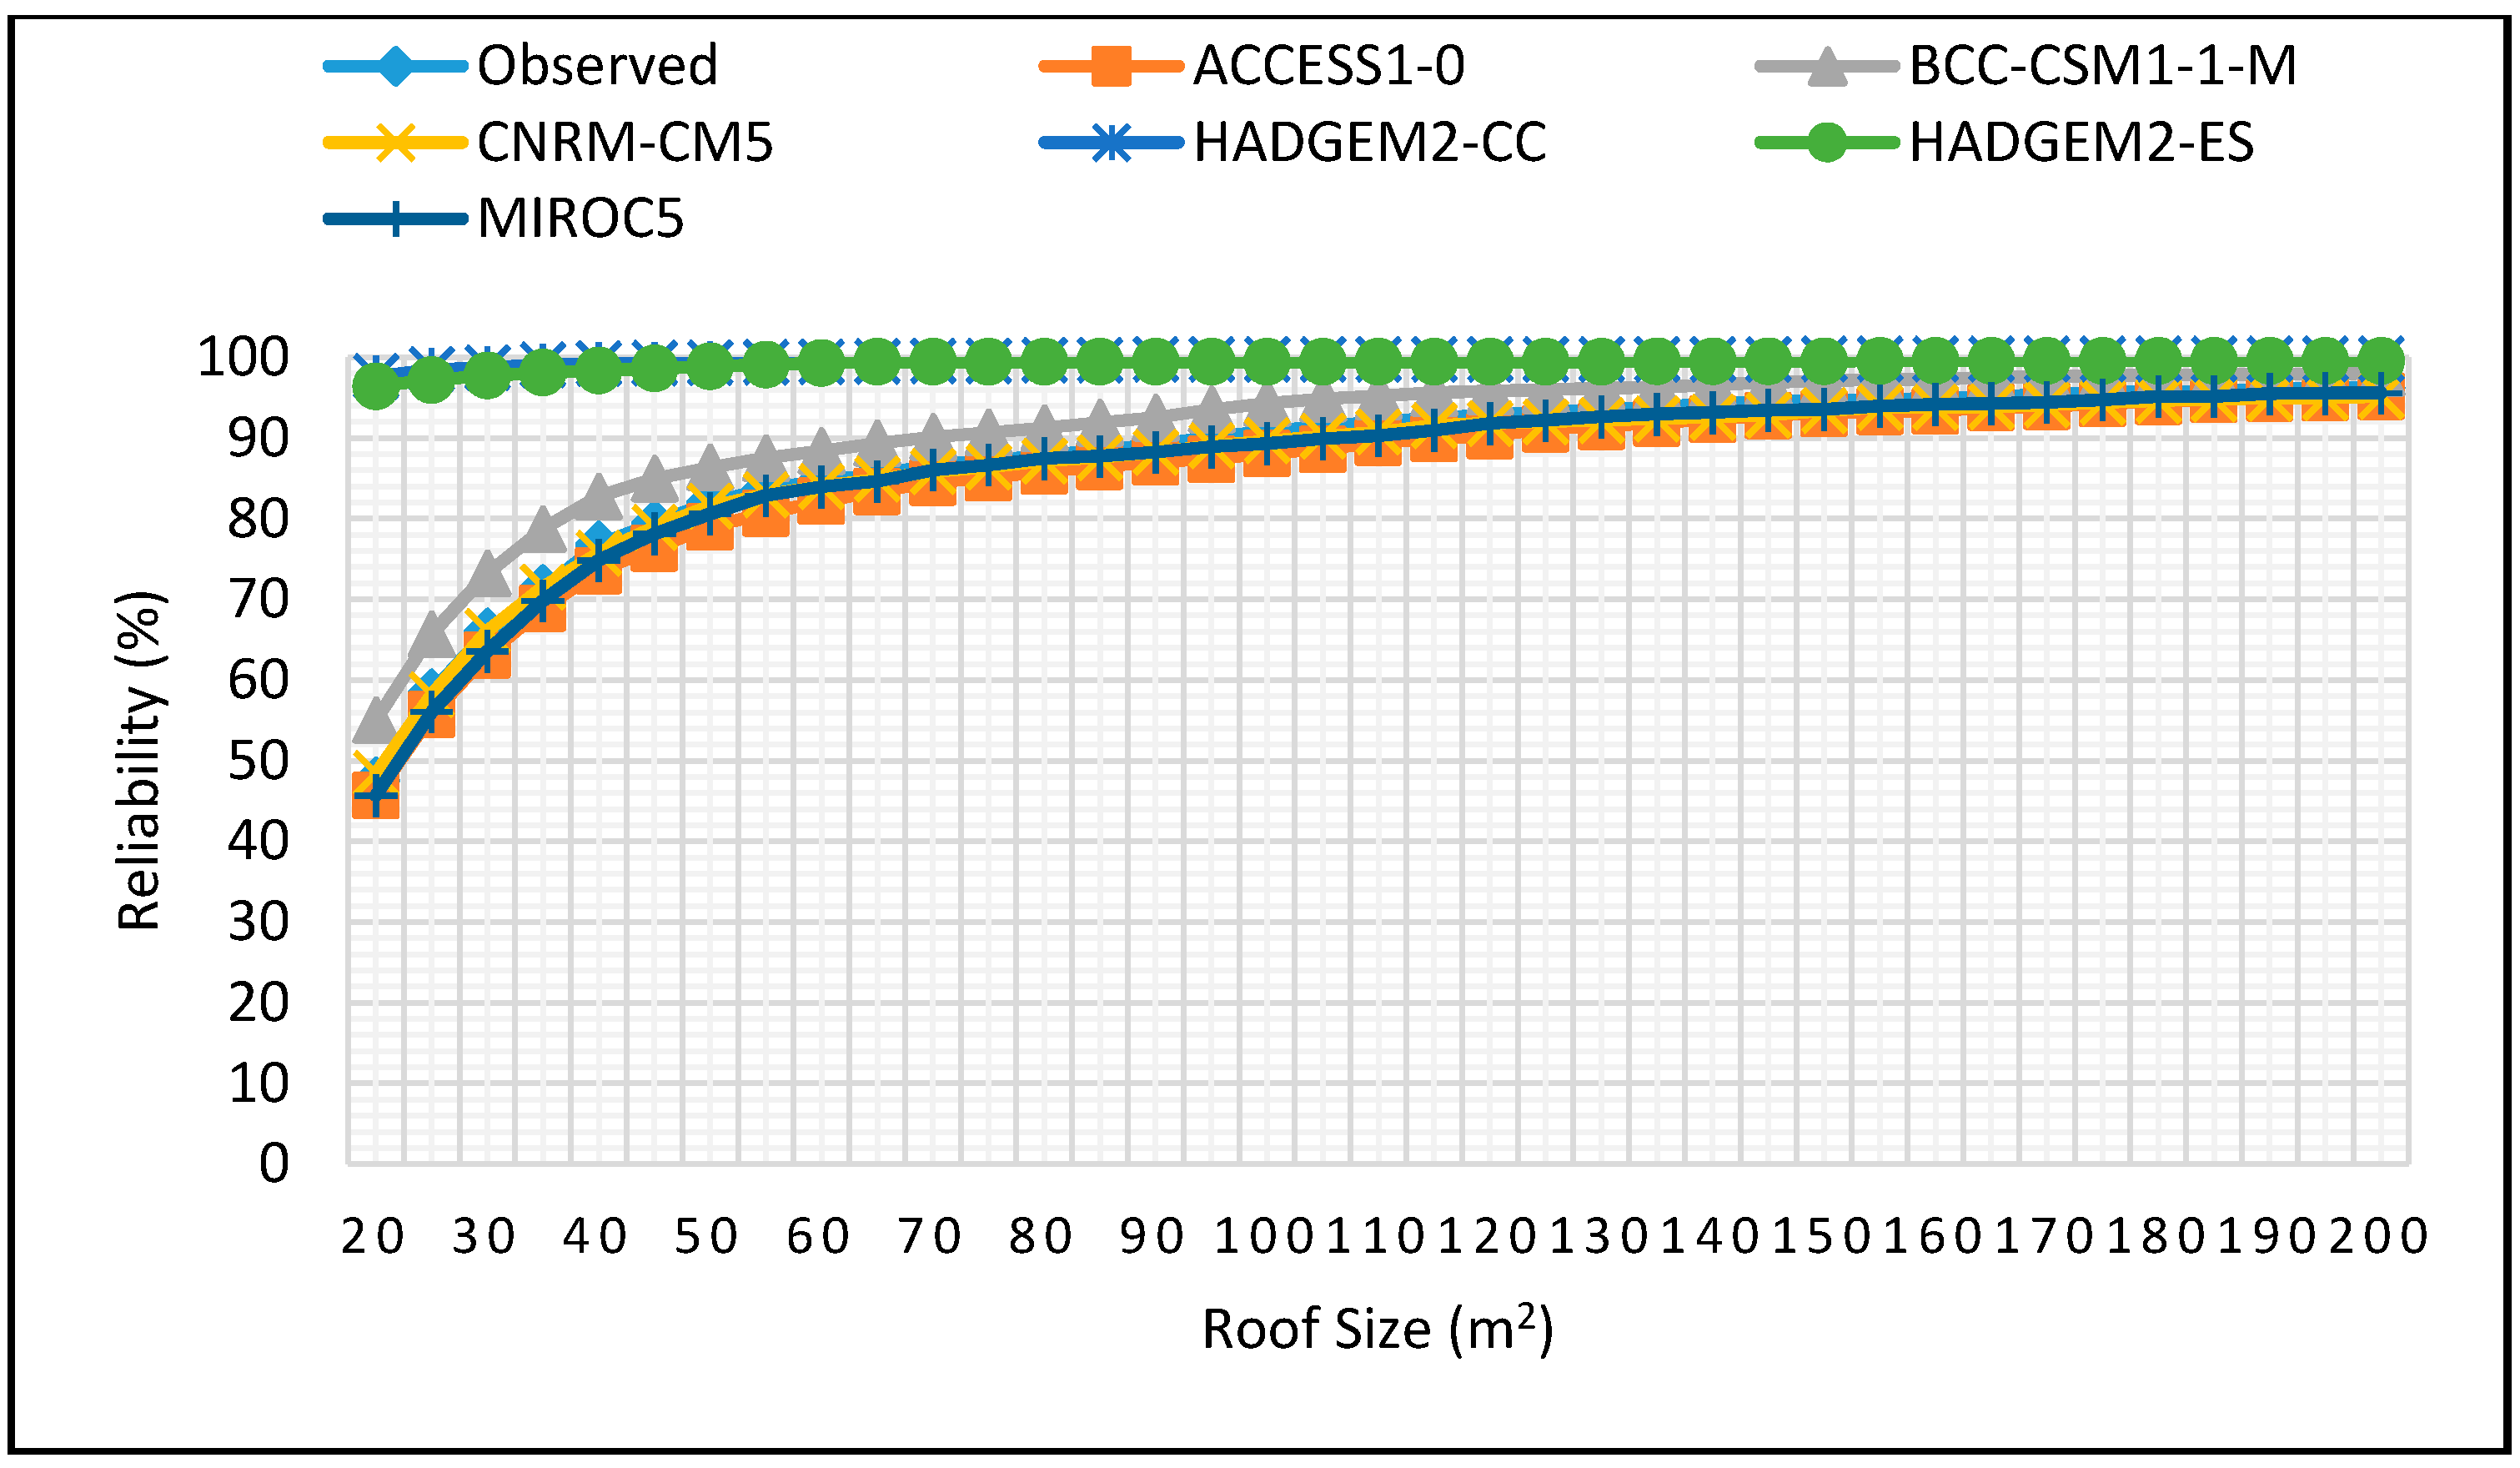
Water 10 00071 g029
Figure 30. Reliability projections for MAM season for 5 m3 tank size for 2060–2090 period.
Water 10 00071 g030
Figure 31. Reliability projections for MAM season for 20 m3 tank size.
Water 10 00071 g031
Figure 32. Change in reliability for SON season for 2025–2055 period for 2 m3 tank size.
Water 10 00071 g032
Figure 33. Change in reliability for SON season for 2025–2055 period for 5 m3 tank size.
Water 10 00071 g033
Figure 34. Change in reliability for SON season for 2060–2090 period for 2 m3 tank.
Water 10 00071 g034
Figure 35. Change in reliability for SON season for 2060–2090 period for 5 m3 tank.
Water 10 00071 g035
Figure 36. Reliability projections for SON season for 0.5 m3 tank size for 2060–2090 period.
Water 10 00071 g036
Figure 37. Reliability projections for SON season for 1 m3 tank size for 2060–2090 period.
Water 10 00071 g037
Figure 38. Reliability projections for SON season for 2 m3 tank size for 2060–2090 period.
Water 10 00071 g038
Figure 39. Reliability projections for SON season for 5 m3 tank size for the 2060–2090 period.
Water 10 00071 g039
Table 1. Characteristics of the 6 General circulation models (GCMs) considered in this study.
Model CenterCountryModelLatitudeLongitudeResolution
Atmosphere and Ocean Research Institute (The University of Tokyo), National Institute for Environmental Studies, and Japan Agency for Marine-Earth Science and TechnologyJapanMIROC51.401.40High
Beijing Climate Center, China Meteorological AdministrationChinaBCC-CSM1.12.812.79Low
Commonwealth Scientific and Industrial Research Organization/Bureau of Meteorology (CSIRO-BOM)AustraliaACCESS1.01.871.25Medium
Centre National de Recherches Meteorologiques/Centre Europeen de Recherche et Formation Avancees en Calcul Scientifique (CNRM/CERFACS)FranceCNRM-CM51.411.40High
Met Office Hadley CentreUK-ExeterHadGEM2-CC1.871.25Medium
HadGEM2-ES1.751.25Medium
Source: Akurut et al., [20].
Table 2. Shows roof sizes for 80% reliability for DJF season for 2060–2090.
Climate Change ModelsTank Size (m3)
0.5125101520
Observed--105–11055–6045–5040–4540–45
ACCESS1-0--100–1055540–4540–4535–40
BCC-CSM1-1-M--105–11055–6040–4540–4535–40
CNRM-CM5--110–11555–6045–5040–4540–45
HADGEM2-CC--115–12050–5540–4540–4535–40
HADGEM2-ES--105–11045–5040–4535–4035–40
MIROC5--115–11060–6545–5040–4540–45
Table 3. Roof size requirement during JJA for 80% reliability (2025–2055).
Climate Change ModelsTank Size (m3)
0.5125101520
Observed--170–17580–8575–8075–8075–80
ACCESS1-0-->20085–9080–8580–8580–85
BCC-CSM1-1-M--175–18080–8575–8075–8075–80
CNRM-CM5--105–11050–5545–5045–5045–50
HADGEM2-CC--135–14060–6560–6560–6560–65
HADGEM2-ES--140–14570–7565–7065–7065–70
MIROC5 125–13055–6035–4035–4035–4035–40
Table 4. Roof sizes required to achieve 80% reliability during MAM season (2025–2055).
Climate Change ModelsTank Capacity (m3)
0.5125101520
Observed100–10545–5030–3525–3020–2520–2520–25
ACCESS1-0135–14050–5535–4025–3025–3025–3020–25
BCC-CSM1-1-M85–9040–4525–3020–2520–2520–2520–25
CNRM-CM5110–11540–4530–3520–2520–2520–2520–25
HADGEM2-CC115–12045–5030–3520–2520–2520–2520–25
HADGEM2-ES95–10040–4525–3020–2520–2520–2520–25
MIROC5>20090–9560–6540–4535–4035–4035–40
Table 5. SON roof size required for 80% reliability for varying tank sizes (2025–2055).
Climate Change ModelsTank Capacity (m2)
0.5125101520
Observed90–9545–5035–4025–3025–3025–3020–25
ACCESS1-0100–10550–5535–4025–3025–3020–2520–25
BCC-CSM1-1-M90–9540–4530–3525–3020–2520–2520–25
CNRM-CM590–9545–5035–4020–3525–3020–2520–25
HADGEM2-CC85–9045–5035–4030–3525–3025–3025–30
HADGEM2-ES85–9045–5035–4030–3525–3025–3025–30
MIROC590–9540–4530–3525–3025–3025–3020–25
Table 6. Observed and projected water security (%) for MAM rain season.
ScenarioTank Size (m3), 30 m2 Roof Size
Period0.5125101520
Observeda35261910555
b35261910555
ACCESS1.0a39292213888
b37271910666
BCC-CSM1.1a3323156555
b3627198555
CNRM-CM5a3525178555
b3324177555
HADGEM2-CCa3425178555
b62595755514946
HADGEM2-ESa3323168555
b62585654514848
MIROC5a52464240373431
b62595755524949
Notes: a 2025–2055; b 2060–2090.
Table 7. Observed and projected water security for SON rain season.
ScenarioTank Size (m3) 30 m2 Roof Size
Period0.5125101520
Observeda362822141199
b362822141199
ACCESS1.0a37282214977
b393024151088
BCC-CSM1.1a35261911777
b3121157444
CNRM-CM5a36272113877
b37282214888
HADGEM2-CCa37292417131313
b42<1<1<1<1<1
HADGEM2-ESa37292417141313
b52<1<1<1<1<1
MIROC5a362721141099
b38292416131111
Notes: a 2025–2055; b 2060–2090.
Table 8. Observed and projected water security for JJA dry season.
ScenarioTank Size (m3) 30 m2 Roof Size
Period0.5125101520
Observeda67615957545252
b67615957545252
ACCESS1.0a70646159565555
b68625755524948
BCC-CSM1.1a67615957545252
b61545046444139
CNRM-CM5a59524846434039
b58514643413835
HADGEM2-CCa63565250484542
b64565045424037
HADGEM2-ESa64575452494644
b63564944413835
MIROC5a53433326232323
b362282222
Notes: a 2025–2055; b 2060–2090.
Table 9. Observed and projected water security for DJF dry season.
ScenarioTank Size (m3) 30 m2 Roof Size
Period0.5125101520
Observeda64595346434343
b64595346434343
ACCESS1.0a63575041393636
b63575041393636
BCC-CSM1.1a65595345424141
b64595345424141
CNRM-CM5a65695448454545
b65605348454545
HADGEM2-CCa71666156555555
b64666156555555
HADGEM2-ESa72666161565656
b62666161565656
MIROC5a64585245424141
b66585245414141
Notes: a 2025–2055; b 2060–2090.

