Effect of Flaring Gate Piers on Discharge Coefficient for Finite Crest-Length Weirs


State Key Laboratory of Hydraulics and Mountain River Engineering, Sichuan University, Chengdu 610065, China
*
Author to whom correspondence should be addressed.
Water 2018, 10(10), 1349; https://doi.org/10.3390/w10101349
Submission received: 13 August 2018
/
Revised: 25 September 2018
/
Accepted: 26 September 2018
/
Published: 28 September 2018
(This article belongs to the Special Issue Advances in Hydraulics and Hydroinformatics)
Abstract
:The use of flaring gate piers (FGPs) along with finite crest-length weirs changes the shape of plunging jets and increases the efficiency of energy dissipation in some projects; however, the FGPs may affect the discharge capacity. In this study, the flow pattern and discharge coefficient were experimentally investigated under different conditions by varying the weir lengths Lw, contraction ratio β, contraction angle θ, and water heads H. A comparative analysis of the weirs with and without FGPs was performed. For the finite crest-length weirs with FGPs, the water-surface profiles in the flow channel were backwater curves. Moreover, the plunging jets leaving the weir became narrower and then subsequently diffused largely in the transverse and longitudinal directions in air. The discharge coefficients of the weirs with FGPs were approximately equal for various weir lengths. Moreover, following the earlier studies on traditional finite crest-length weirs, a discharge-coefficient equation was developed for the weir with an FGP in this study. The results showed that in the weirs with FGPs, the discharge coefficients clearly increased with the increase in the contraction ratio and water head, but the changes in their values along with the contraction angle were neglected.
1. Introduction
Generally, based on the relative length of the weirs, H/Lw, where H is the head on the weir crest and Lw is the weir length in the direction of flow [1,2,3,4,5], weirs are divided into two groups: the sharp-crested weirs (H/Lw > 2) and finite crest-length weirs (H/Lw < 2). The finite crest-length weirs can be further classified into three categories: the short-crested (0.4 ≤ H/Lw < 2), broad-crested (0.1 ≤ H/Lw < 0.4), and long-crested weirs (0 < H/Lw < 0.1). The discharge characteristics of the flows over the finite crest-length weirs with different cross sections, such as rectangular, trapezoidal, and triangular, have been studied. According to a systematic experimental study on the finite crest-length weirs having a rectangular shape with 0 < H/Lw ≤ 2 and 0 < H/P < 1 (where P is height of the weir), three discharge equations have been developed for the short-crested, broad-crested, and long-crested weirs [6]. Ramamurty et al. [7] studied the influence of upstream rounding on the discharge coefficient. Sarker and Rhodes [8] used computational fluid dynamics (CFD) modeling to model the free-surface profiles of the broad-crested weirs; the experimental results were in good agreement with those of the numerical models. In order to model the free surface flow of real reservoirs, Andersson et al. [9] performed a physical scale model test and three-dimensional simulation of the spilling from a reservoir, which gives a better understand of the flow pattern for the short-crested weir. Chen et al. [10] studied the discharge coefficient of a rectangular short-crested weir with varying slope coefficients and developed an equation for calculation of the discharge coefficient. Recently, Azimi et al. [11] conducted a series of laboratory experiments to study the correlations for nine different types of weirs, which extended the earlier studies on the finite crest-length weirs having a trapezoidal shape, considering sloping crests and either upstream ramps, downstream ramps, or both. In addition, the study was extended to triangular weirs (in which the crest length is zero) with either upstream ramps, downstream ramps, or both. Jan et al. [12] proposed a linear combination of traditional discharge equations of simple triangular and rectangular weirs to develop the discharge equations for the complex broad-crested weirs.
A new concept of energy dissipation by combining the flaring gate pier (FGP) with the weir was proposed in China [13]. The FGP is usually employed on a weir to achieve 3D flow by making the flow emerge from the FGP with lateral contraction and longitudinal dispersion; hence, a shorter length of the stilling basin and a larger energy dissipation ratio could be obtained [14]. FGPs have been extensively applied in roller-compacted concrete dams. During the construction, some sections of the dam serve as gaps for releasing floodwater, and the FGP is integrated in the system to reduce the erosion of downstream channels. Hence, the finite crest-length weirs are integrated with the FGP, and the overflows are largely subcritical when they are constructed to a certain height. The appraisal of the diversion schemes for flooding is related to the construction period, quality, cost, and safety of the whole project; hence, the diversion schemes need to be designed carefully in advance. It is important to study the discharge characteristics of the finite crest-length weirs with the FGP. In previous studies, the FGP was almost integrated on the ogee-overflow weirs (curved short-crested weirs) and the flow over the weir was largely supercritical [15,16]. Li et al. [17] experimentally studied the effects of the FGP on the discharge capacity and flow pattern of the ogee-overflow weirs. The results showed that the effect of the FGP on the discharge capacity is closely related to the flow pattern; four types of flow patterns occurred, depending on the weir head and the contraction ratio. Recently, Li et al. [18] showed that the effect of the variations in the design parameters of the FGP on the discharge capacity of the surface spillway is insignificant when the flow in the channel is supercritical.
Previous studies focused on the hydraulic characteristics of FGP on short-crested weirs. The purpose of this paper is to discuss the flow coefficient after setting an FGP on finite crest-length weirs (including short-crested weirs and broad-crested weirs). A comparative analysis of the weir with different parameters of the FGP was performed.
2. Experimental Setup and Methodology
The experiments were conducted in the State Key Laboratory of Hydraulics and Mountain River Engineering, Sichuan University. The experimental setup comprised a flow measurement section, a large feeding tank (6 m in length and 2 m in width, to ensure steady-state flow condition), a test section, and a flow return system. A right-angled triangle weir is installed upstream of the reservoir, and an electromagnetic flowmeter is installed in the return pipe downstream for flow calibration. Because of the defined relationship between the discharge Q and the head H, the right-angled triangle weir is used as a flow measuring device, for which the discharge calculation formula is
The head of the right-angled triangle weir is measured by a water level stylus, which is installed 1.0 m upstream of the weir, and the accuracy is 0.1 mm. The water level of the reservoir is also measured by a water level stylus with accuracy of 0.1 mm. The water level gauge point was set at the side of the feeding tank (or reservoir) and is 2 m away from the inlet of the finite-crest length weir. Figure 1 shows the experimental setup.
The head of the right-angled triangle weir and water level of the reservoir were measured every 5 min for each discharge. Comparing discharge between the right-angled triangle weir and the electromagnetic flowmeter shows that the error is less than 1.4%.
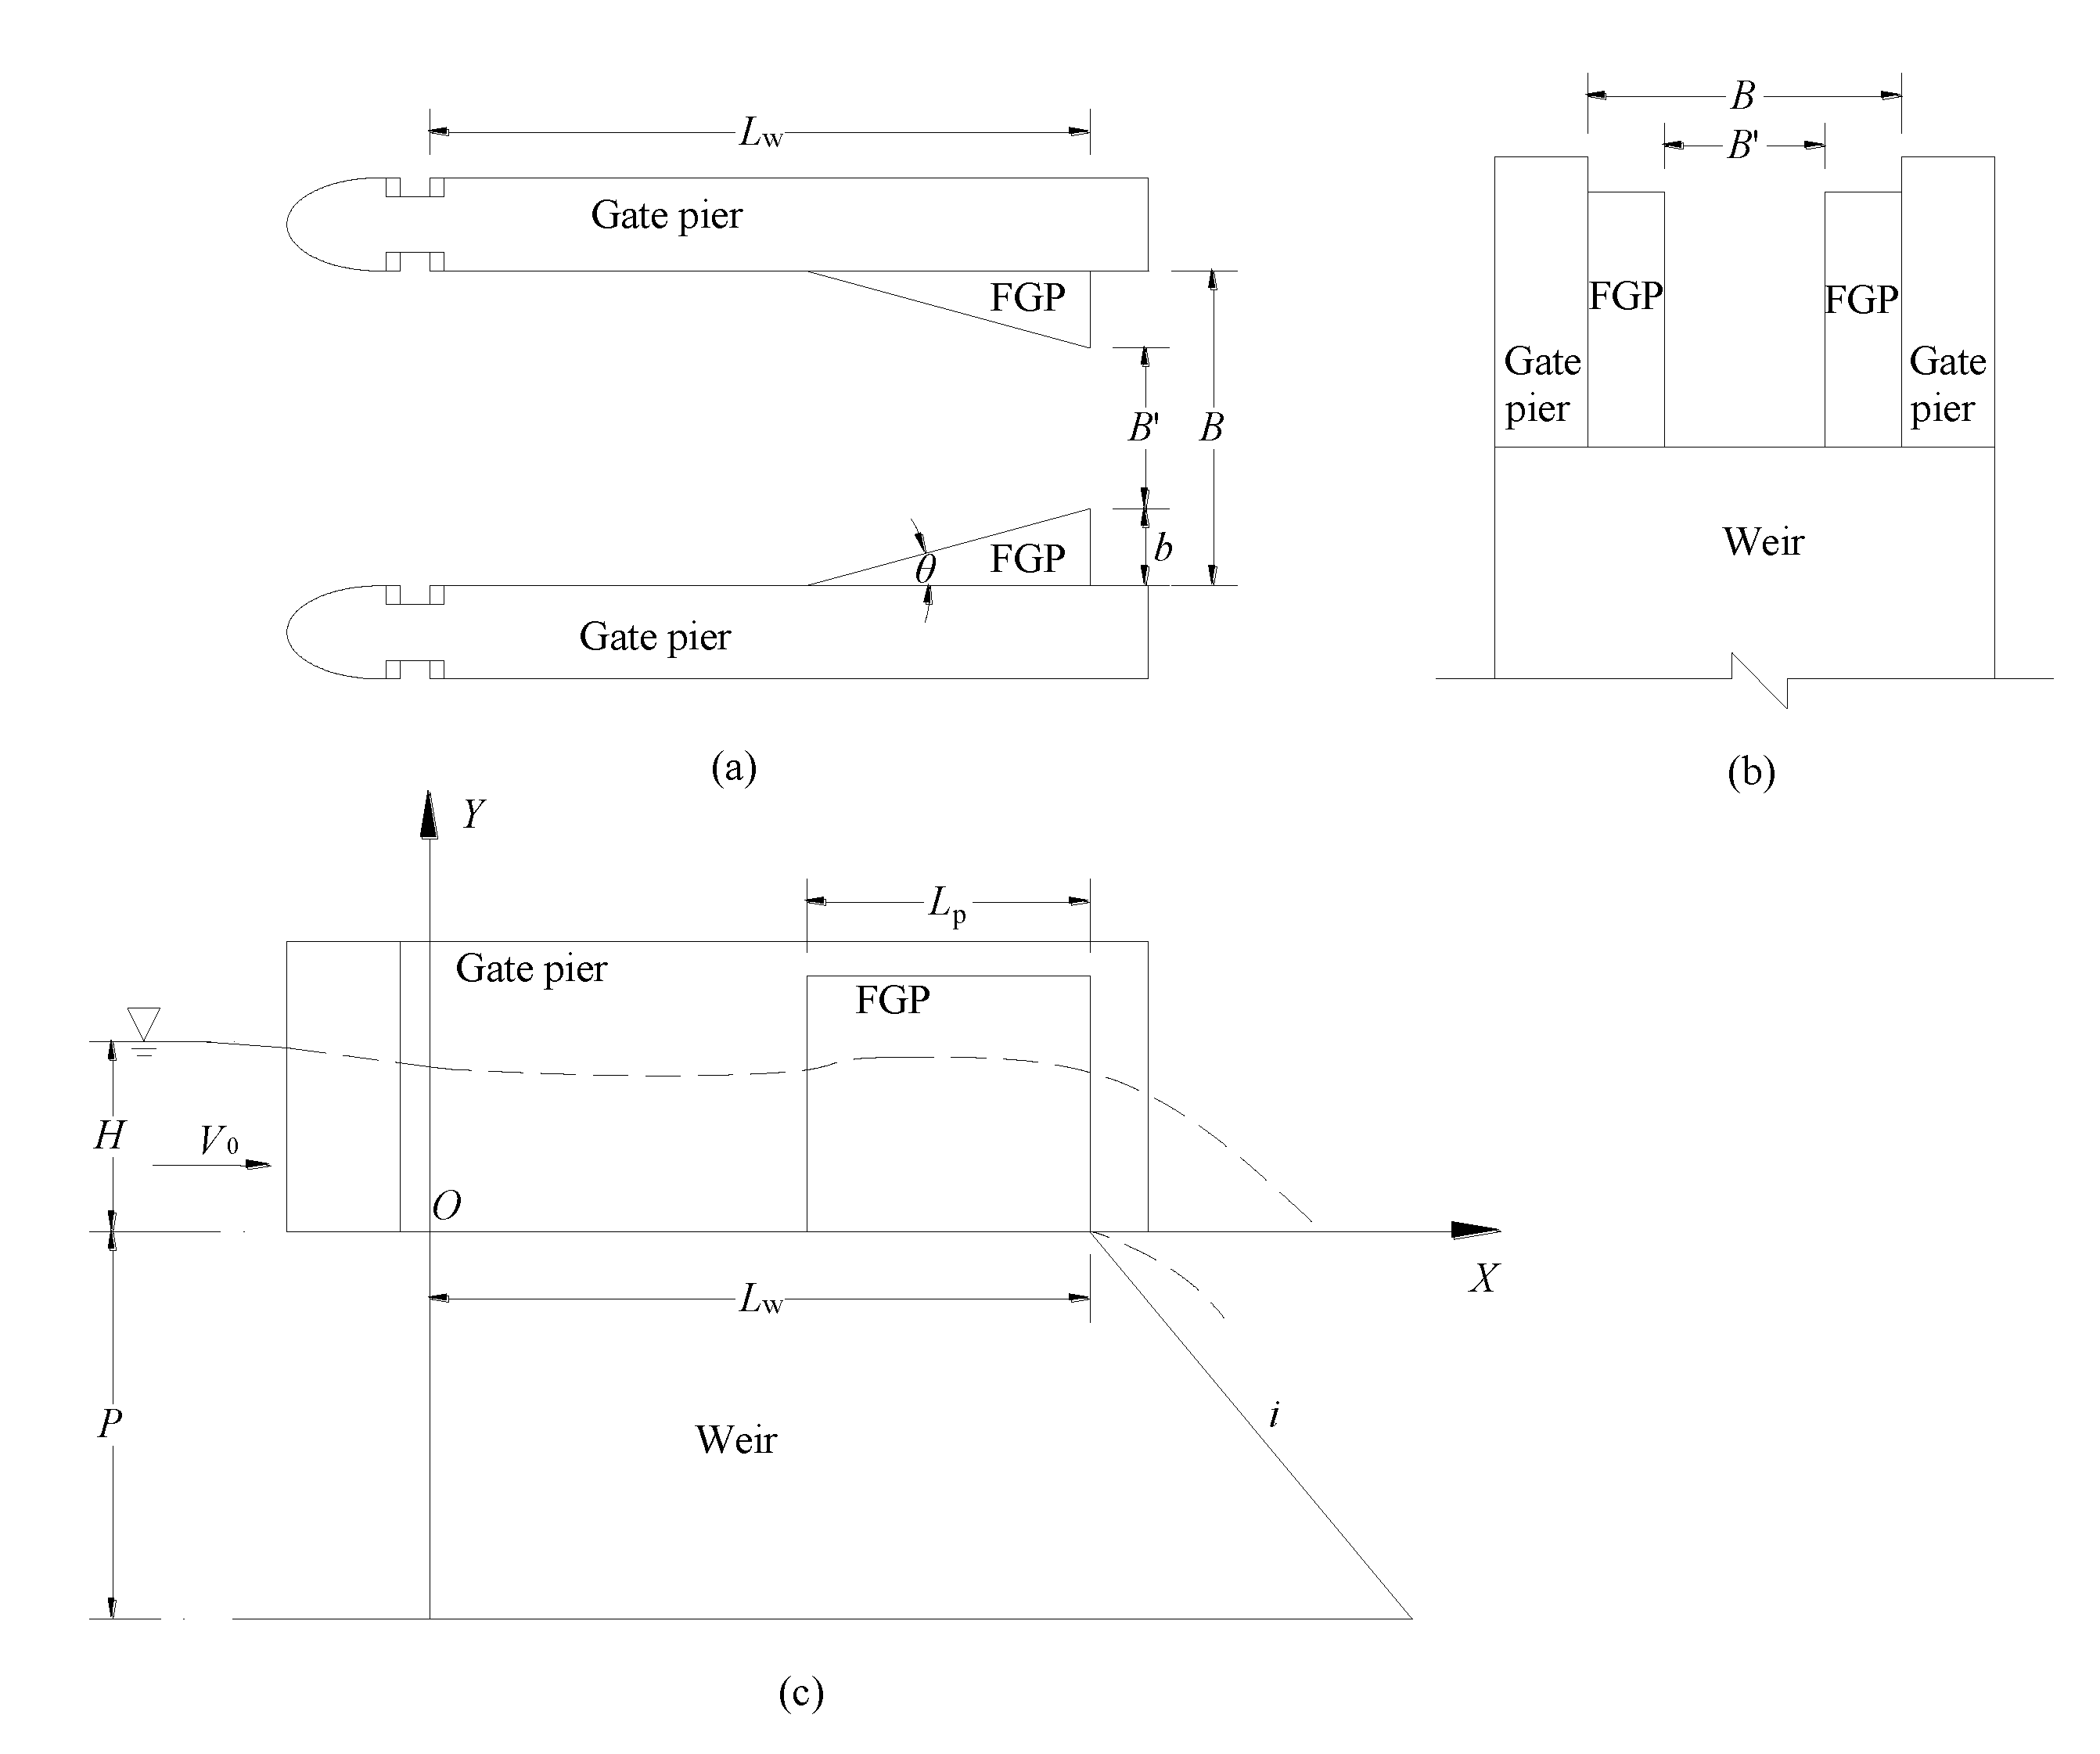
The test model, made using Plexiglas, was a finite crest-length weir. The length (Lw), width (B), and height (P) of the type 3 weir were 0.601 m, 0.30 m, and 1.28 m, respectively, wherein the upstream face was upright and the downstream face had a slope of 1.2:1 (i). The channel width B = 0.30 m was reduced to B’ = 0.115 m at the edge of the outlet for length Lp = 0.271 m when the FGP was integrated on the weir. The contraction angle was 15°, as shown in Figure 2. In this experiment, three types of finite crest-length weirs were employed, with weir lengths Lw of 0.601 m, 0.519 m, and 0.422 m and weir heights of 1.28 m, 1.378 m, and 1.507 m, respectively. In addition, nine types of FGPs were employed with contraction ratios β = 0.38, 0.51, 0.64, 0.82, and 1.00, and contraction angles θ = 7.0°, 9.6°, 12.7°, 15.0°, and 21.5°, respectively. The length of FGP (Lp in Figure 2) is variable, and the bulkhead slots stay at the same location. The ranges of H and H/Lw were approximately 0.112–0.547 m and 0.249–1.212 m, respectively.
The water-surface profiles were measured along the centerline of the weir. The coordinate system (X–Y) was established to describe the water-surface profiles efficiently, as shown in Figure 2c. The origin was at the center of the weir inlet. The location and average water depth of the measuring section were described by the X and Y values, respectively. X/Lw is the relative location of the measuring section.
To investigate the influence of the FGP on the discharge coefficient of the finite crest-length weir, 13 groups of experiments were performed, as listed in Table 1. The cases were divided into three sets: cases N1–N6 represent the effect of Lw, cases N5–N9 represent the effect of β, and cases N5 and N10–N13 represent the effect of θ. The hydraulic experiments were conducted under different conditions with 5–6 different weir heads (0.112–0.547 m) for each group, including discharge capacity, flow pattern, and water-surface profile in the flow channel.
3. Results and Discussions
3.1. Flow Pattern Comparison with and without FGP
As shown in Figure 3a, when there was no FGP on the weir, the water depth gradually decreased along the channel and the plunging jet dropped into the stilling basin in a rigorous manner without the longitudinal spreading for a large discharge. In contrast, when the FGP was applied in the weir, the water on the upper side flowed slower than that on the bottom and the plunging jet became narrow just outside the weir; subsequently, the flow spread in the transverse and longitudinal directions in air for the contraction, as shown in Figure 3b,c.
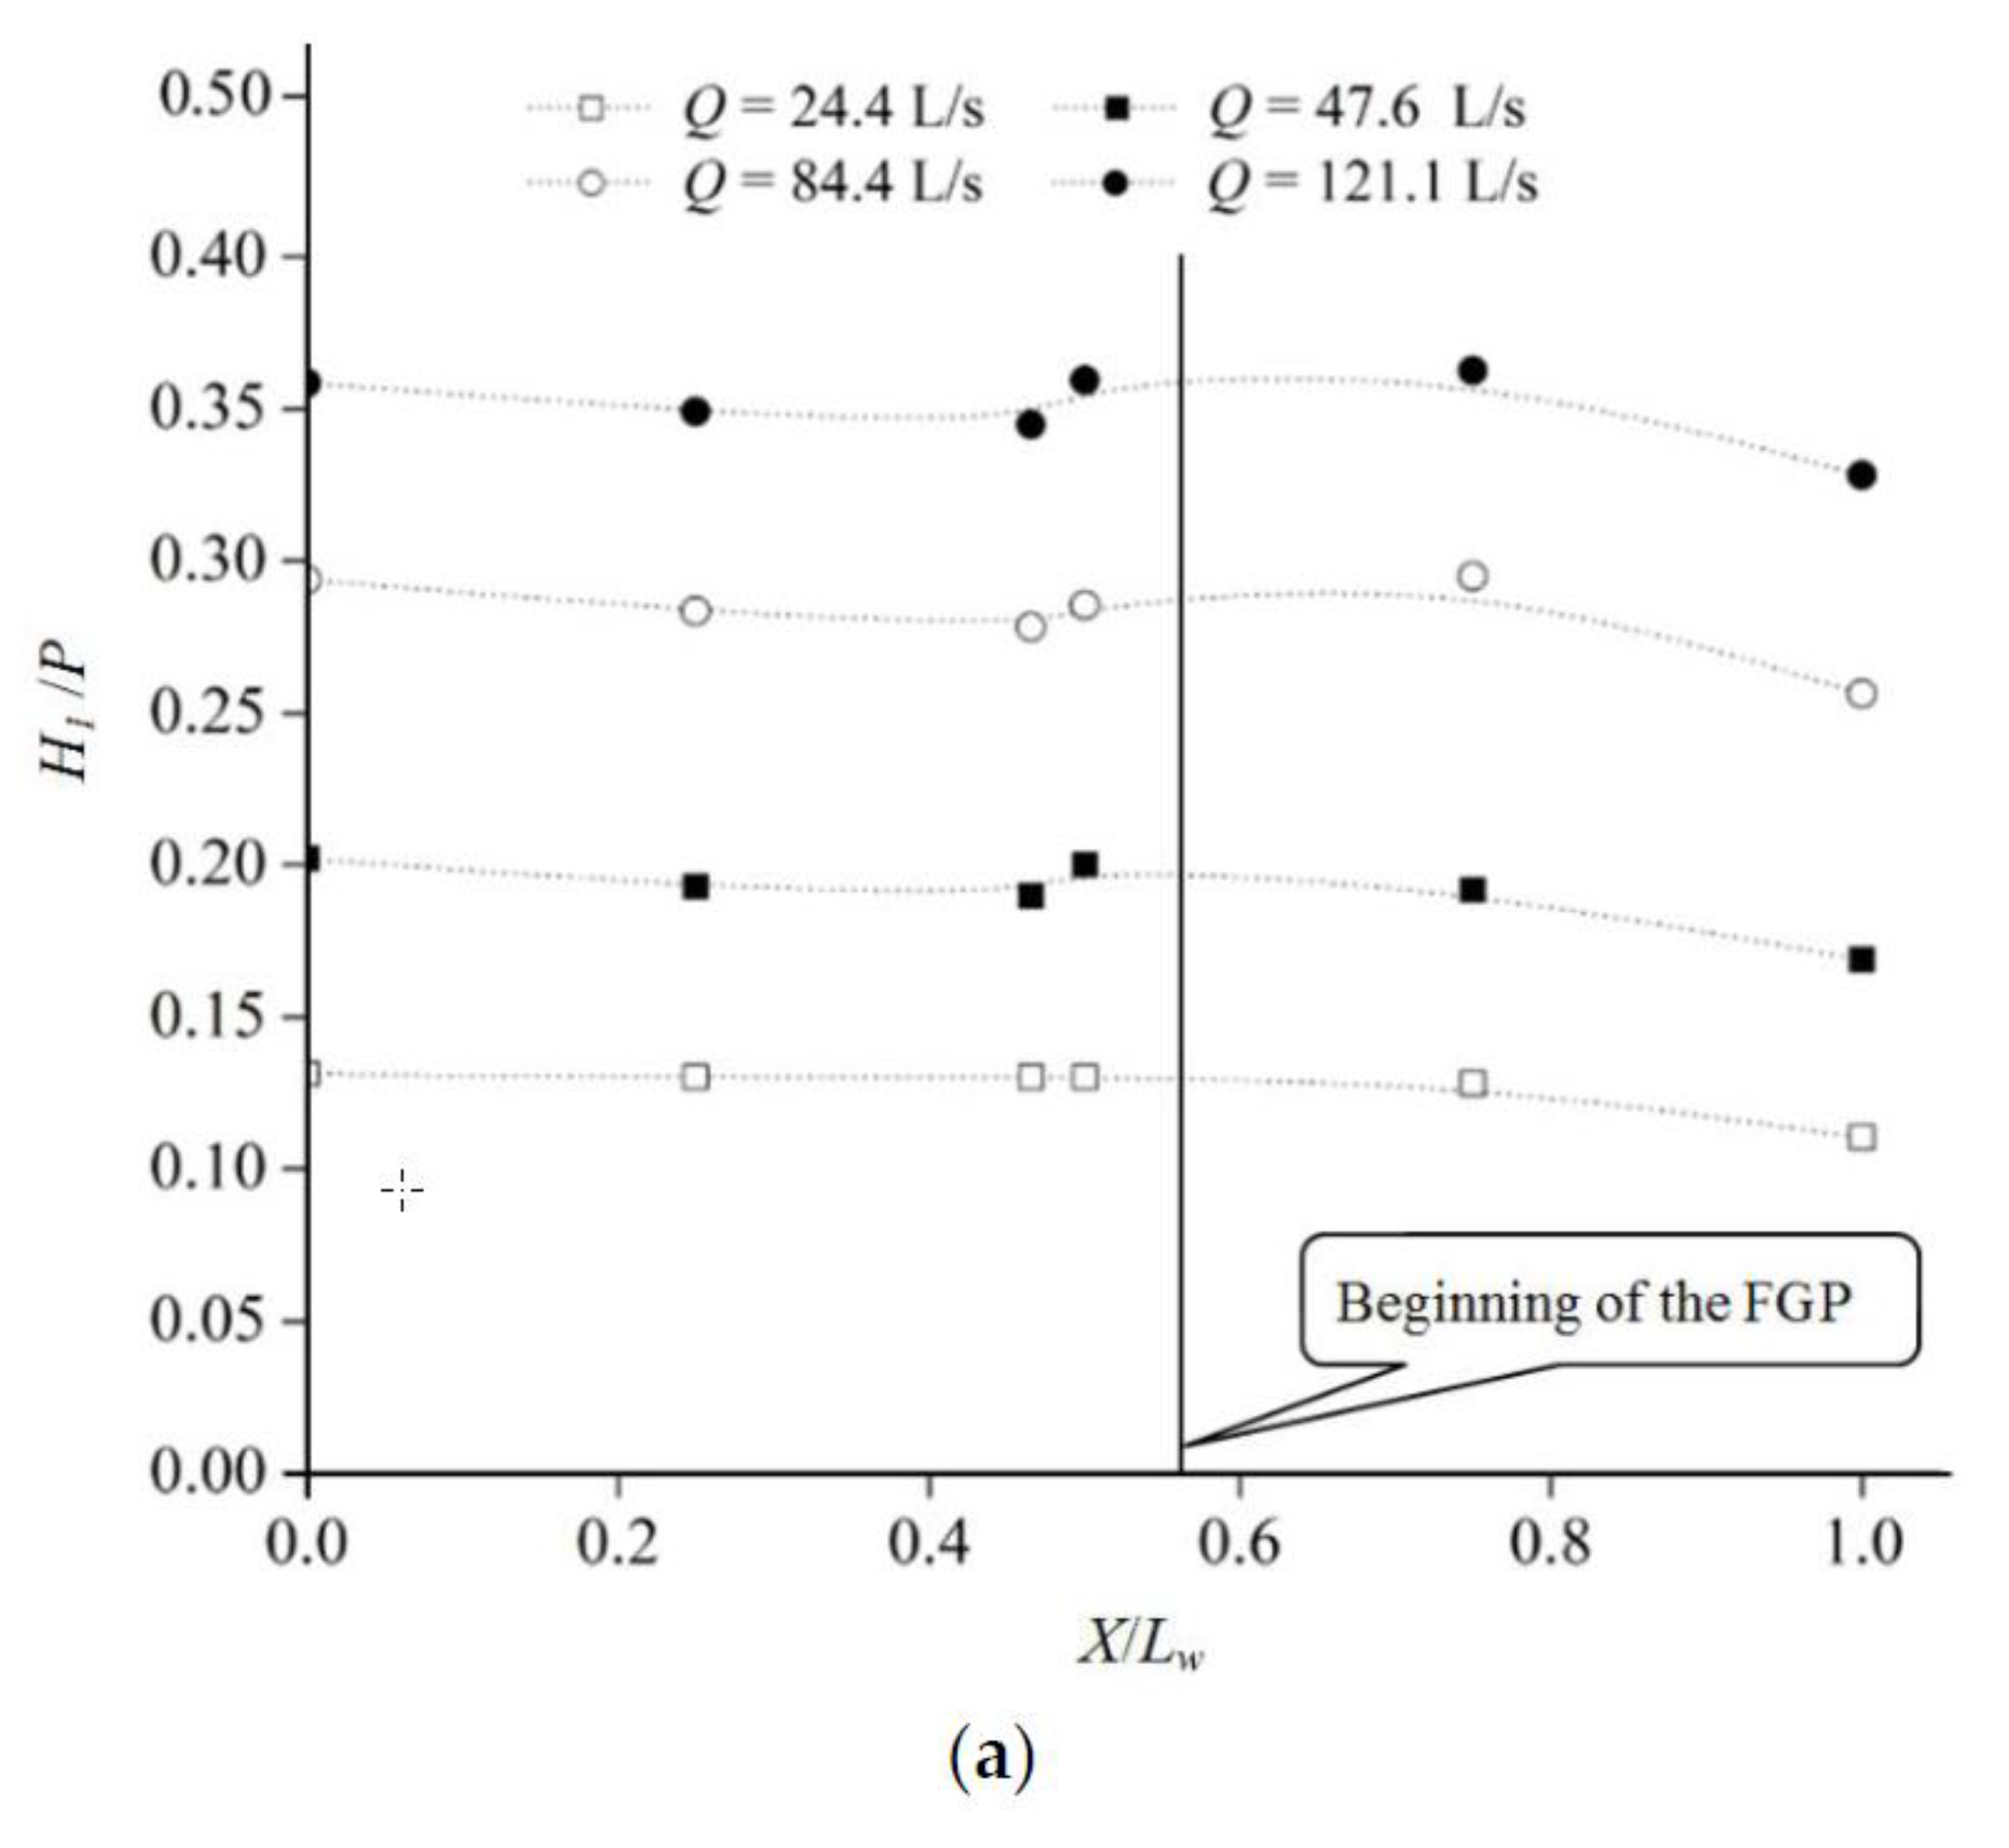
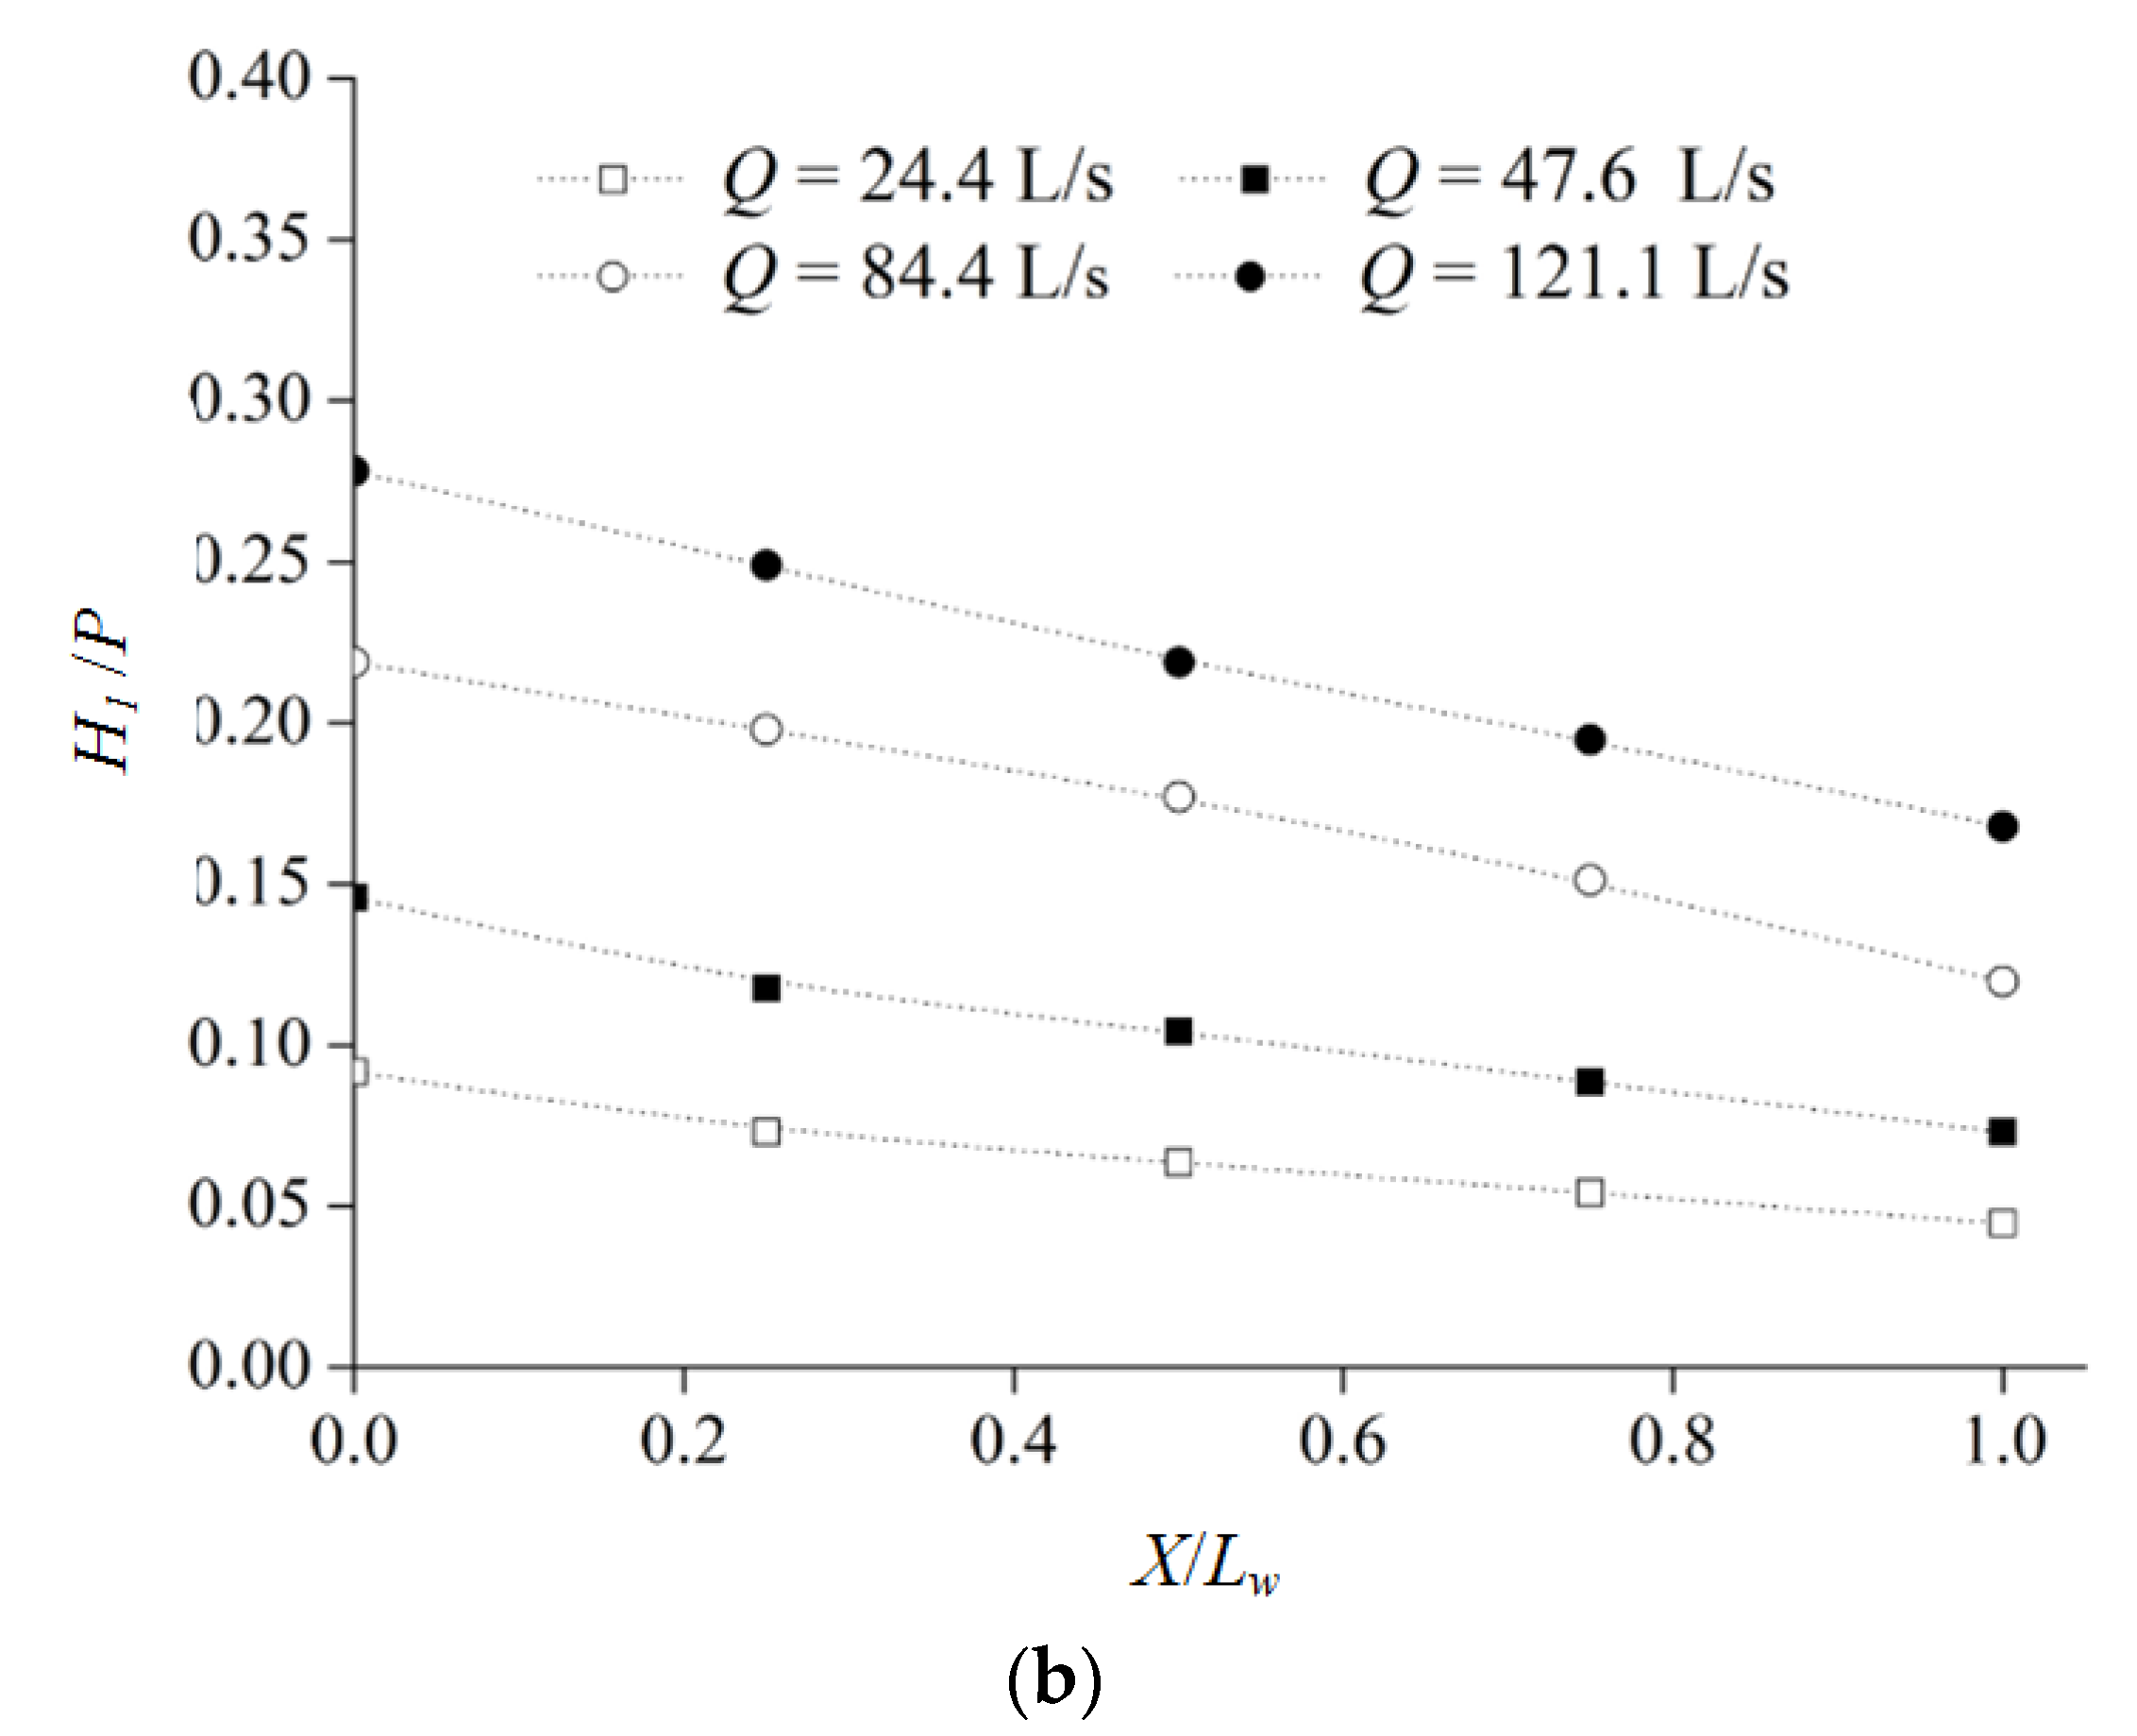
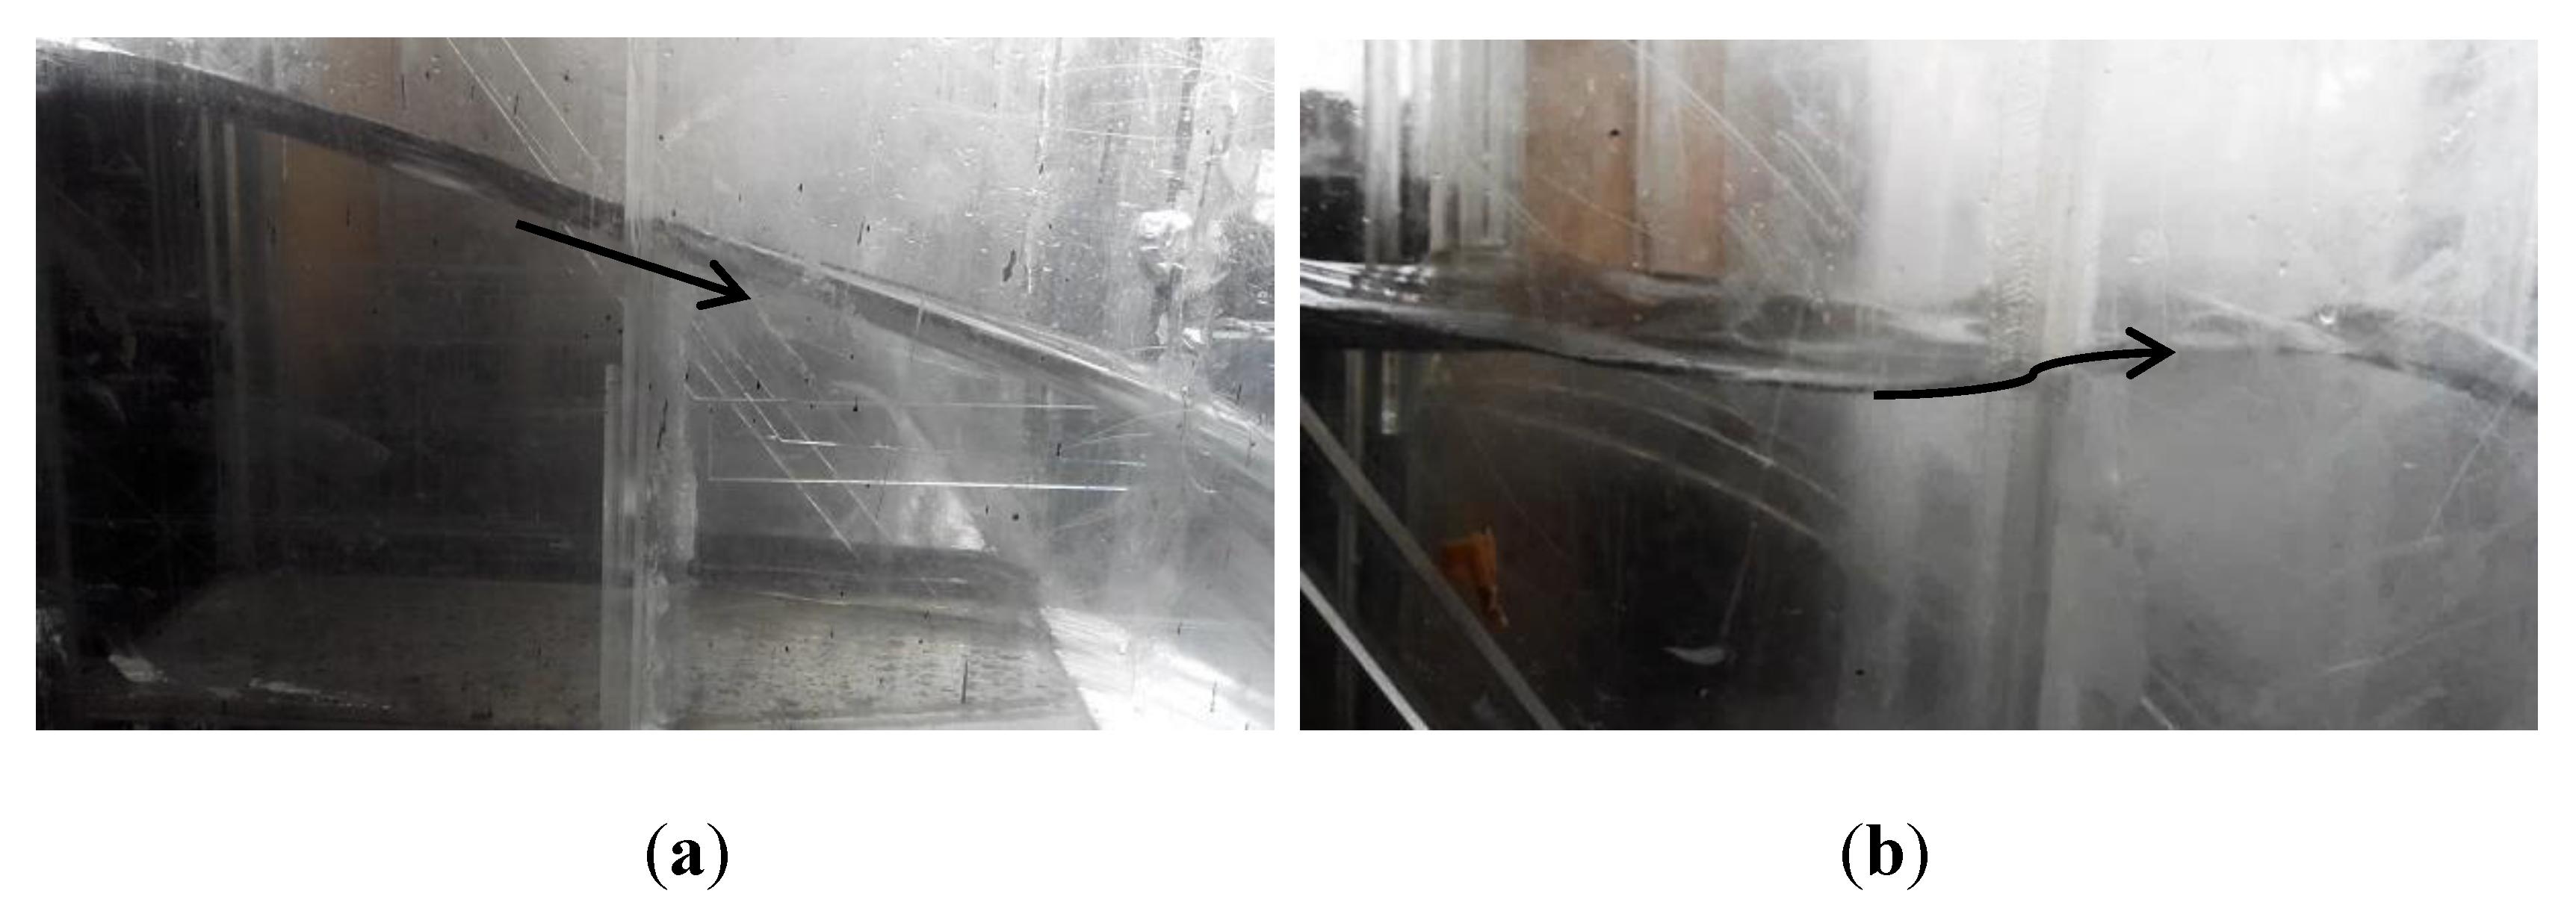
Taking type 3 of the finite crest-length weir as an example, the Froude number (Fr) along the crest with FGP ranges from 0.3~0.5, thus it is a subcritical flow. Fr along the crest without FGP ranges from 0.5~1.2, and flow pattern changing occurs at the ending of the crest (X/Lw > 0.8). The water-surface profiles that described the change in depth along the channel are plotted in Figure 4. It was clear that the depth of water in the channel increased significantly after setting the FGP for the same discharge. When the depth of the water in the channel was low, the two water-surface profiles shifted toward the horizontal form. When the depth of the water in the channel was relatively high, the two profiles differed depending on whether the FGP was employed; i.e., the water-surface profile gradually decreased for the channel where the FGP was not installed, as shown in Figure 5a. The water surface upstream of the starting point of FGP is smooth; however, the backwater curve occurred at the beginning of the FGP when setting the FGP in the weir, as shown in Figure 5b, which could be regarded as a surface wave [2].
3.2. Discharge Capacity Comparison with and without FGP
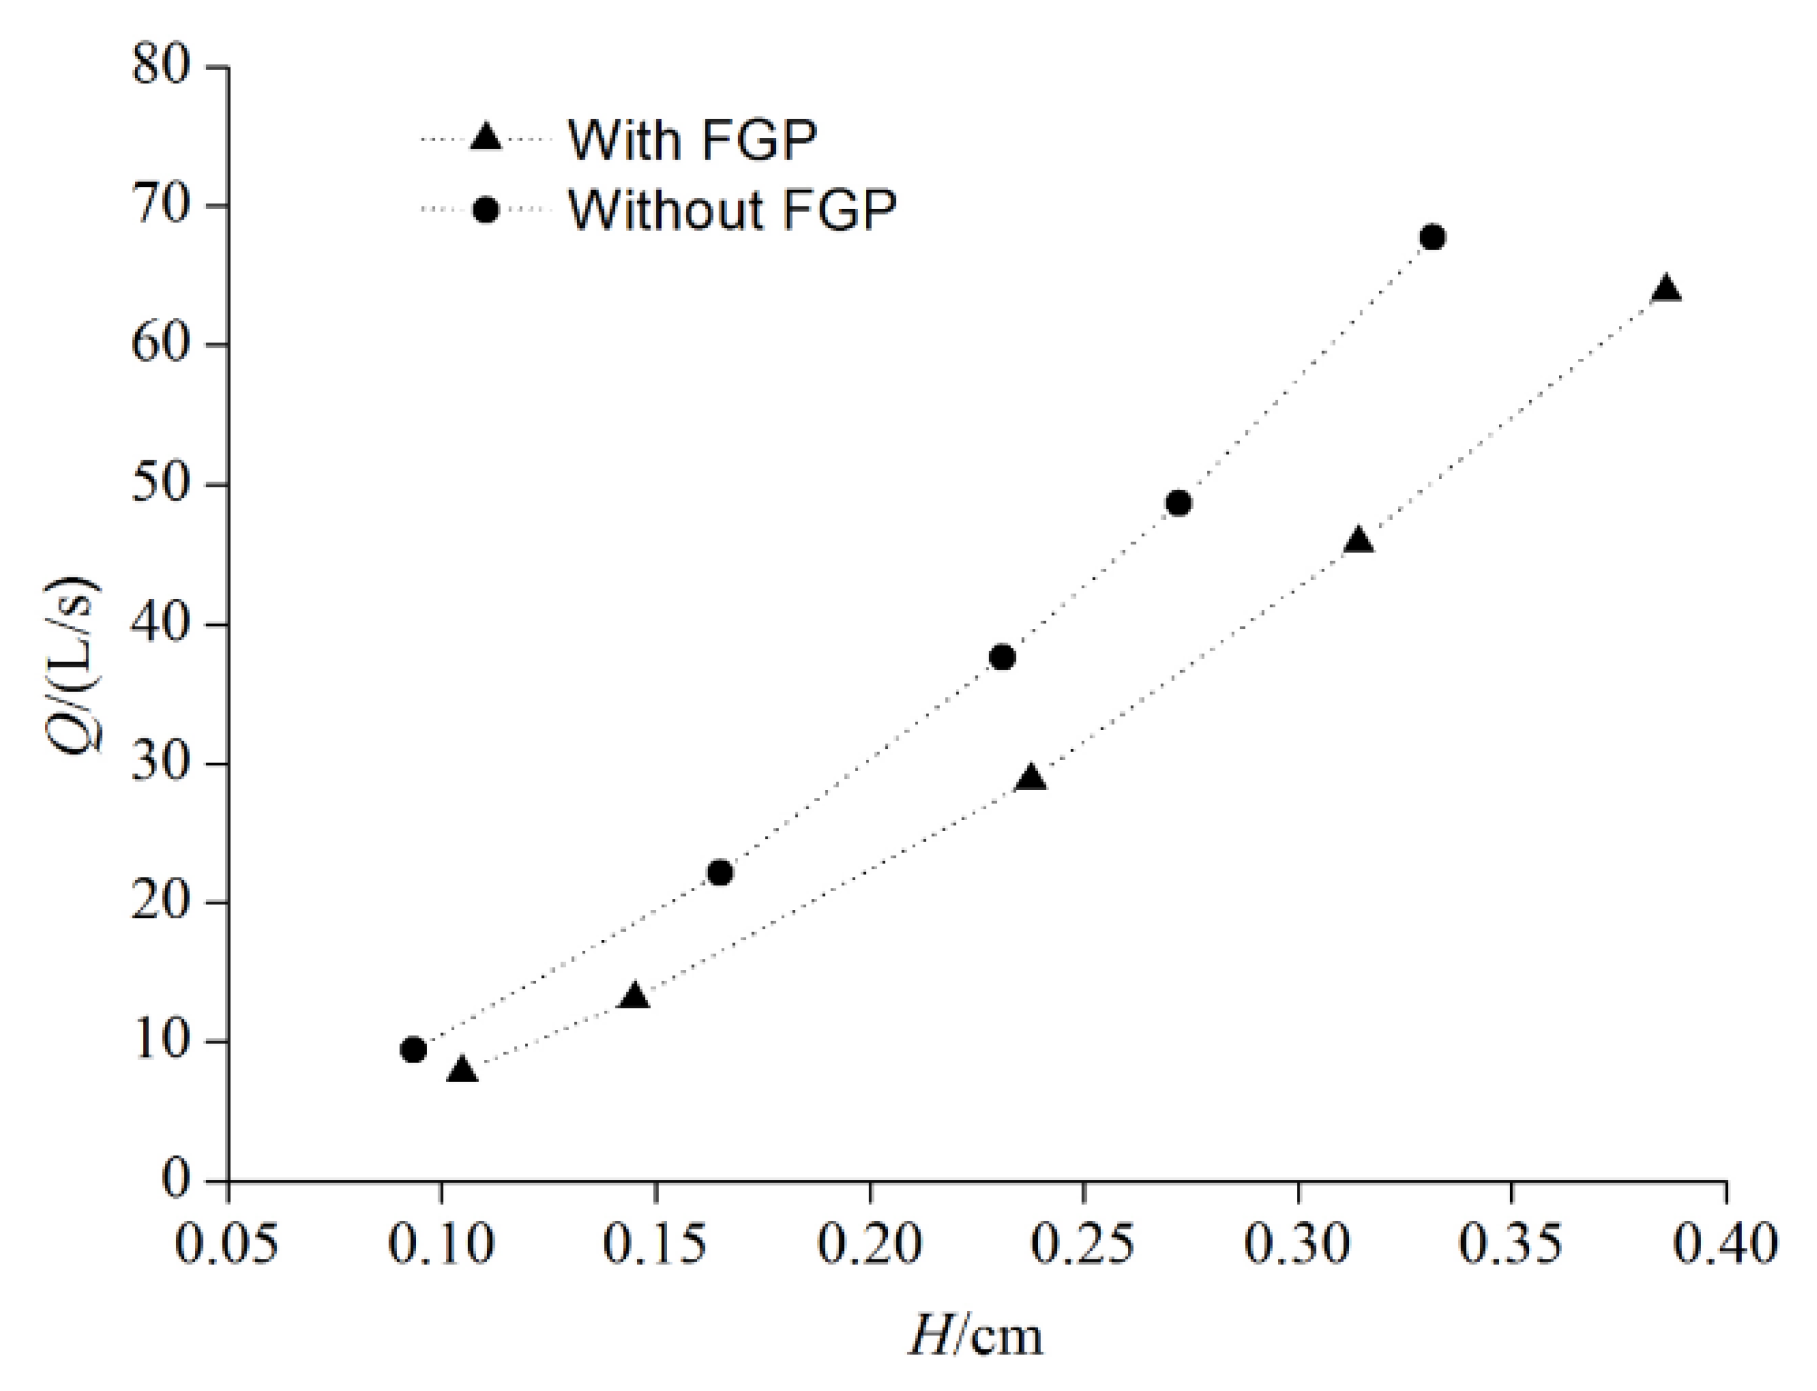
Considering type 3 of the finite crest-length weir as an example, Figure 6 shows the head–discharge relationship of the weir for the cases with and without the FGP. The two discharge-stage curves, with slightly similar change rules, were both concave in shape. However, the curves for the weir with the FGP were always below that of the case without the FGP, which indicated that the discharge was reduced when the FGP was installed on the weir. The discharge coefficient Cd was the indicator of the discharge capacity of the weir, which was defined as follows [2]:
where Q is the discharge of the finite crest-length weir, which was measured using the right-angled-triangle weir in the model test; B is the width of the channel; g is gravitational acceleration; and H is the head on the weir. Because the height of the finite crest-length weir was considerable (P/H > 1.33), the influence of the approaching velocity on the test results could be neglected [19].
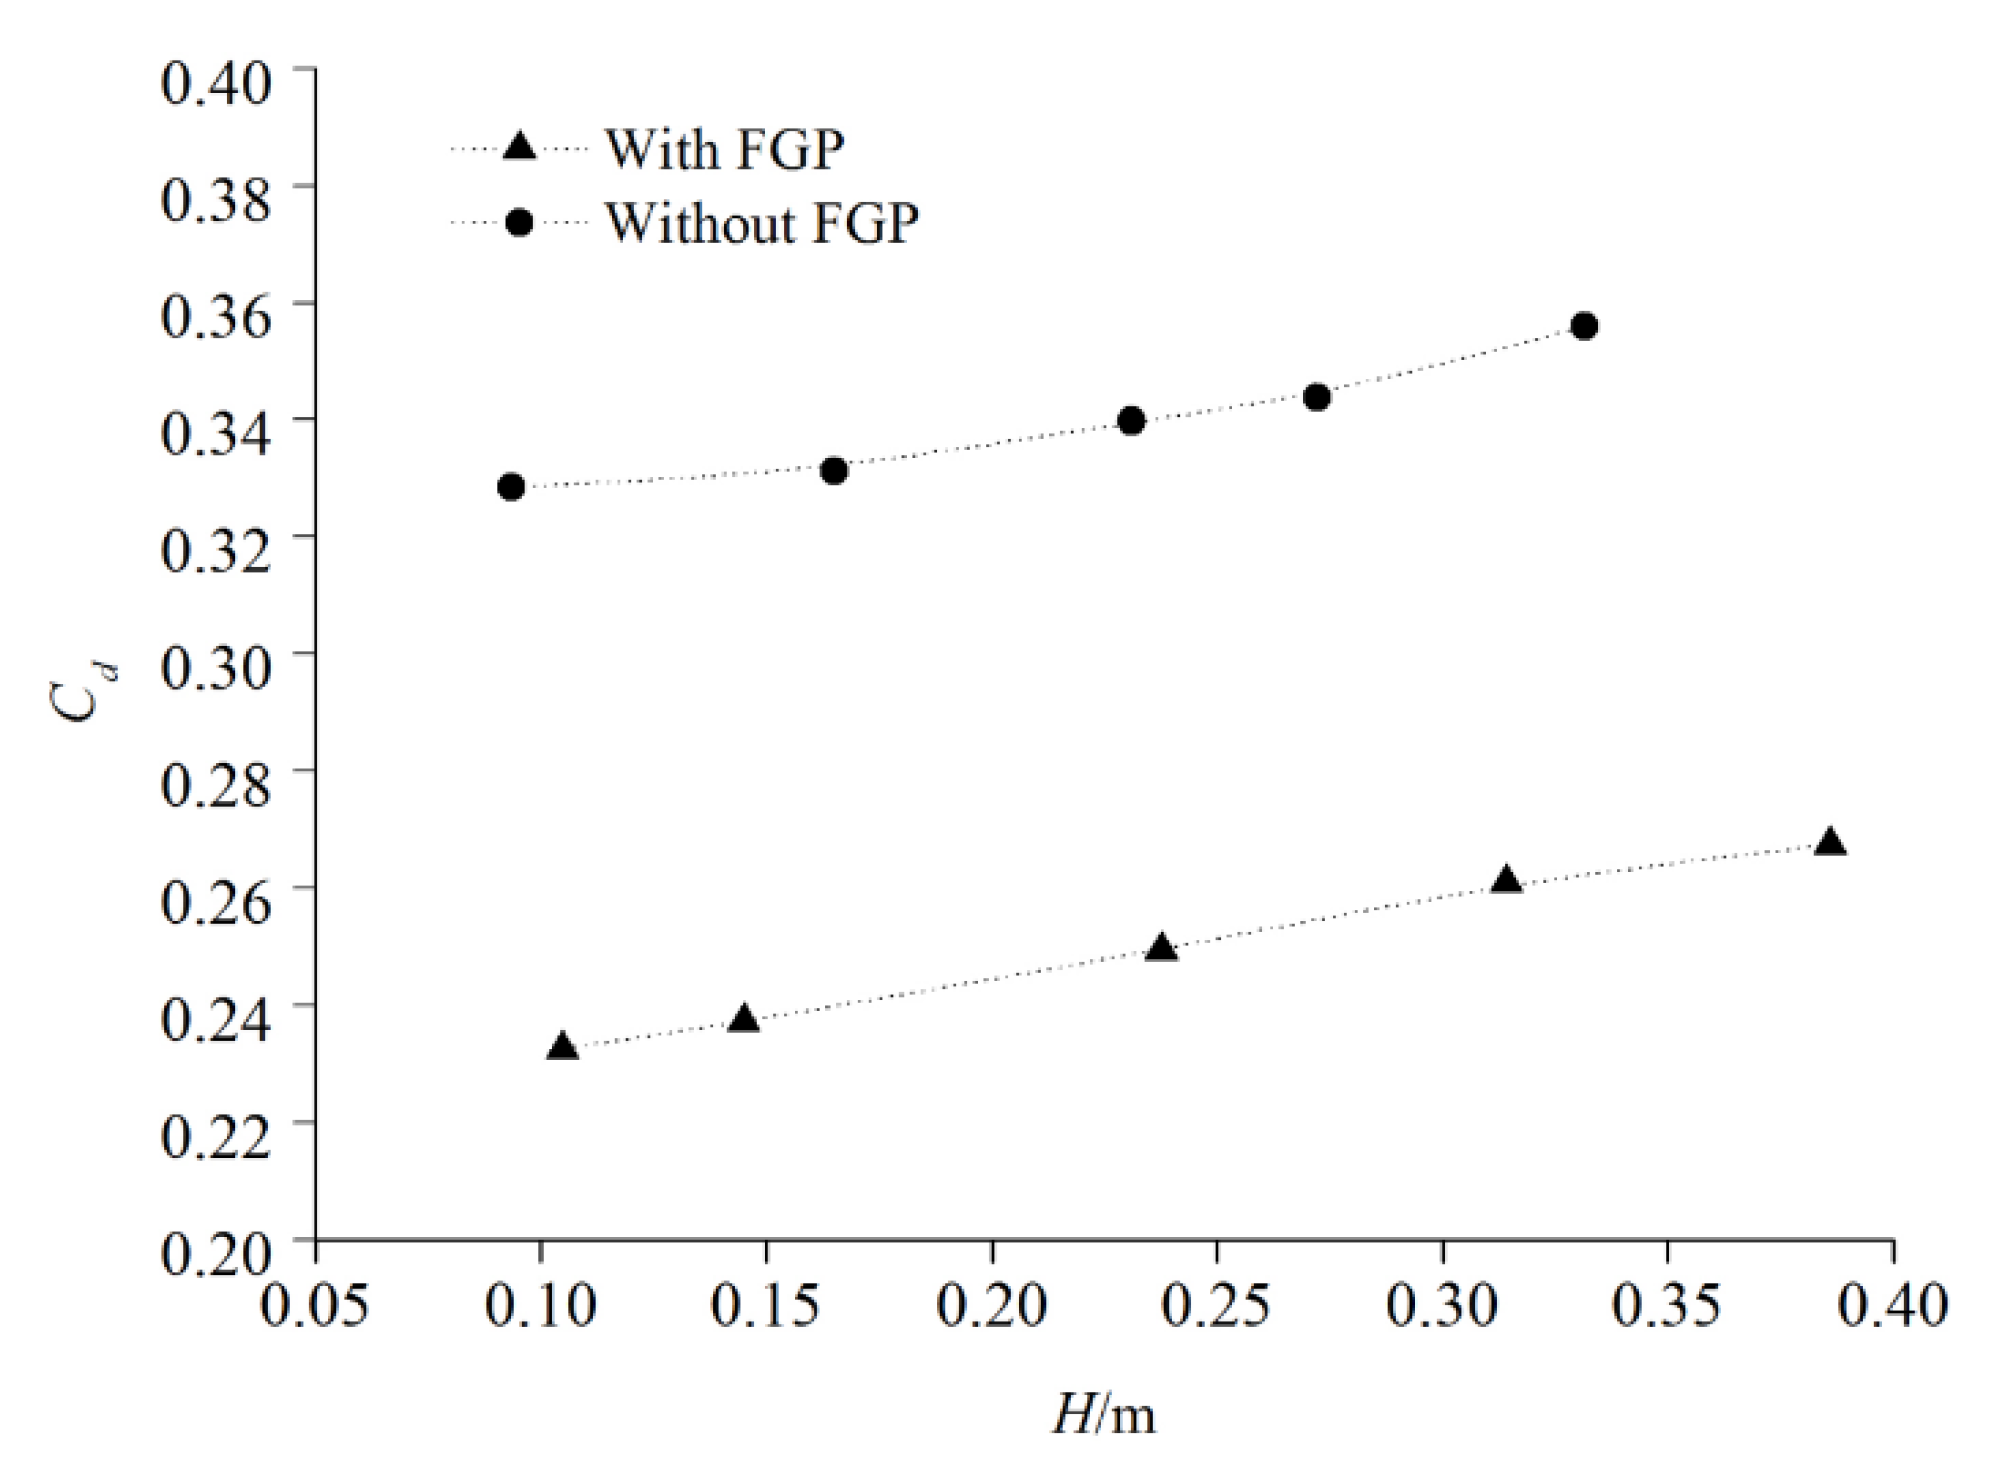
Figure 7 shows the relationship between the discharge coefficient (Cd) and the weir head (H). The results showed that the discharge coefficient gradually increased as the head increased, and the spacing of the two curves represented the reduction in the discharge coefficient after setting the FGP on the finite crest-length weir. This might be related to the flow pattern in the channel, because Li et al. [17] showed that the discharge capacity reduces only if the flow was subcritical when the FGP was applied on the ogee-overflow structure.
3.3. Influence of Weir Length on Discharge Capacity with and without FGP
Figure 8 shows the relationship between the dimensionless head on the weir (H/P) and discharge coefficient (Cd) for different weir lengths Lw, for the cases with and without the FGP. The results showed the effect of the weir length on the discharge coefficient. Moreover, a comparative analysis was performed for the cases with and without the FGP.
As shown in Figure 8a, for the case where the FGP is installed, the three Cd–H curves almost overlap. This implies that the effect of the variations in the weir length on the discharge coefficient of the weir is insignificant when the FGP is installed. In other words, the discharge coefficient of the weir with the FGP was largely unrelated to the weir length in a particular range. The inlet boundary condition could be considered to remain the same, and the boundary condition did not clearly change with the variation in the weir length. However, Rao and Muralidhar [6] and Hager and Schwalt [2] pointed out a particular feature of finite crest-length weirs, referred to as the undular flow on the crest when H/Lw < 0.1. Moreover, they showed that the value of Cd was constant, which was similar to the characteristics of the finite crest-length weir with the surface wave; a lower and relatively stable Cd was obtained for various weir lengths when setting the FGP.
It also could be seen that the distribution rule of the three Cd–H curves without the FGP was different from the aforementioned regularity. Two Cd–H curves for Lw = 0.389 m and Lw = 0.317 m almost overlap just above the one for Lw = 0.451 m, as shown in Figure 8b. It indicated that the discharge coefficient of the weir without the FGP increased as the weir length decreased in a particular range, but gradually tended to stabilize when the weir length continued to decrease.
3.4. Discharge Coefficient of the Weir with FGP
Many studies have analyzed the relationship of the discharge coefficient for the finite crest-length weirs of different types, i.e., long-crested weirs, broad-crested weirs, short-crested weirs, and sharp-crested weirs [2,6,9,10,11]. They all indicated that the nondimensional parameter H/Lw was the dominant factor.
In the present experiment, the range of H/Lw was approximately 0.187–0.909. Keeping the other parameters constant and varying one parameter, the effects of β and θ were shown in Figure 9. Figure 9a shows the variations in Cd with β for each H/Lw at the same contraction angle θ. As indicated in the figure, the discharge coefficient significantly increased as the contraction ratio increases (0.38 ≤ β ≤ 1). Figure 9b illustrates the variations in Cd with θ for each H/Lw at the same contraction ratio β, which indicated that the discharge coefficient changes only slightly as the contraction angle increases 7° ≤ θ ≤ 21.5°.
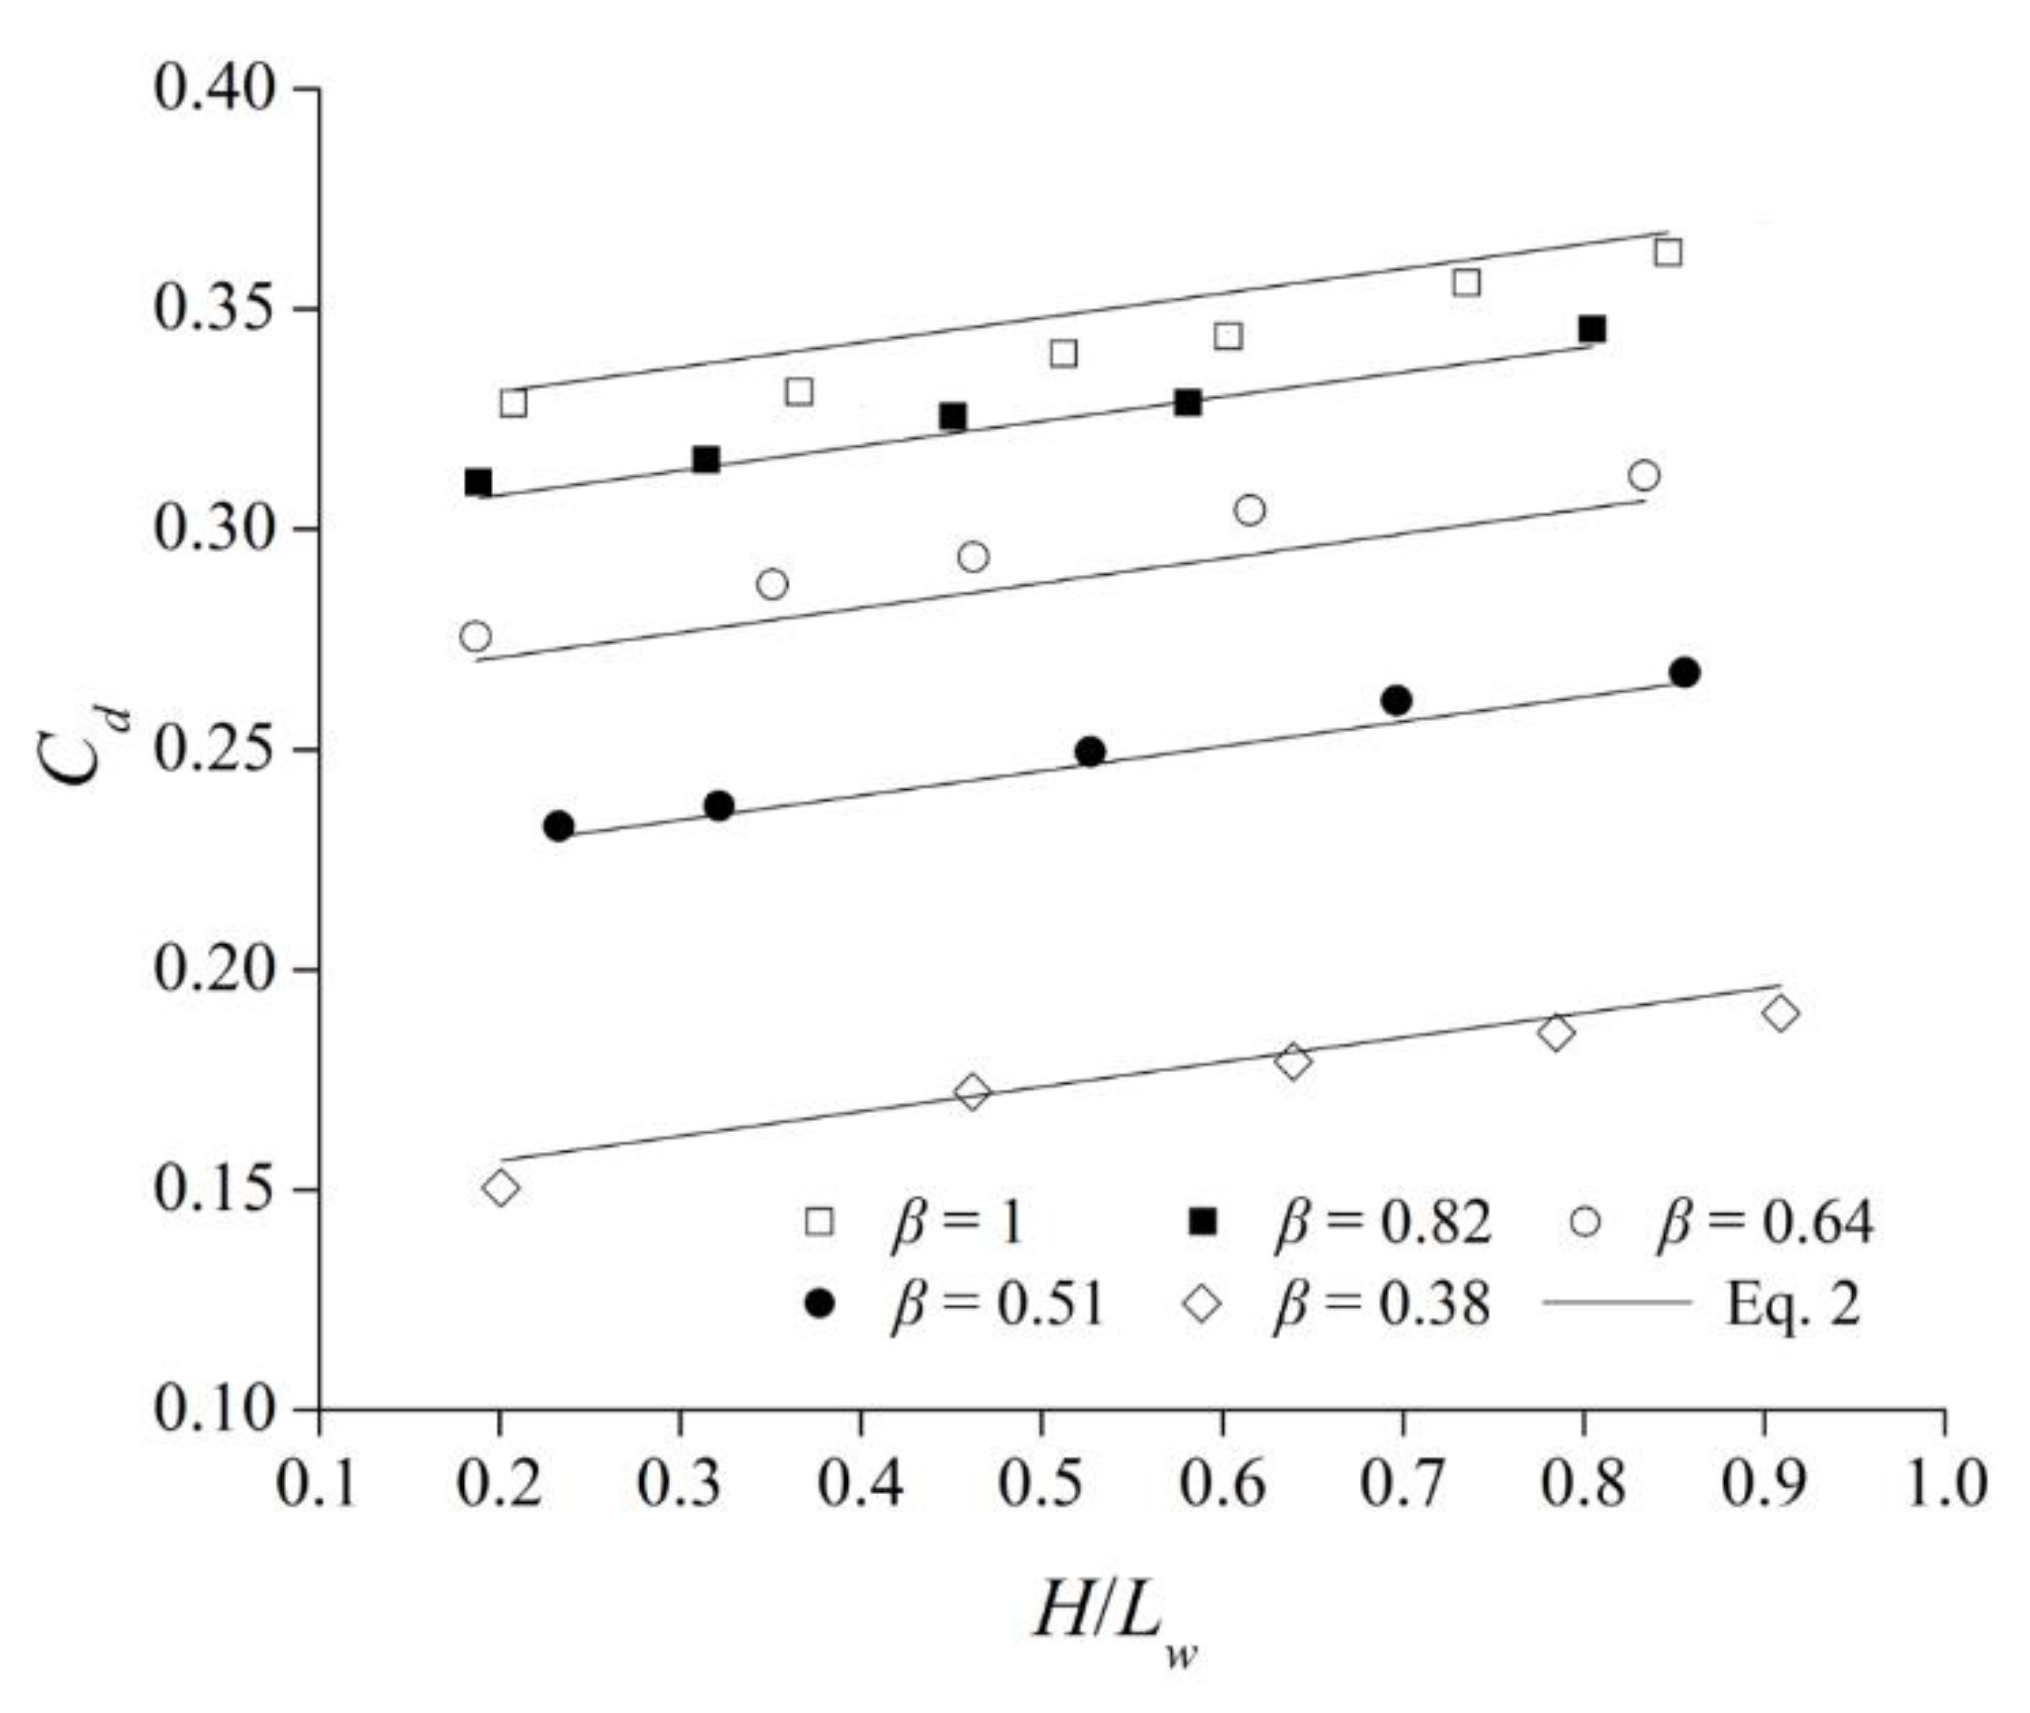
Consequently, H/Lw and β were the dominant parameters of the discharge coefficient of the weir with FGP Cd. By the linear regression method, Equation (3) is obtained. The correlation coefficient R2 is equal to 0.967, which shows that the accuracy of Equation (3) is higher. The relationship between discharge coefficient Cd and the two parameters described using Equation (3) is shown in Figure 10.
with R2 = 0.967.
4. Conclusions
In this study, 65 groups of experiments, including five different flow rates and 13 different geometries of the finite-crest length weir, were conducted to study the variation in the discharge coefficient and flow pattern of a finite crest-length weir with and without an FGP. Unlike the case of the weir without the FGP, for the weir with the FGP, the plunging jet was diffusive in the longitudinal directions in air and the water-surface profile in the flow channel was a backwater curve when the head was relatively high. The discharge capacity was significantly reduced after setting the FGP, which should be considered in engineering design. According to the compared experiments, it was found that the effect of the weir length on the discharge coefficient was different for cases of the weir with and without the FGP. In addition, based on the literature and experimental studies, this study proposed a discharge-coefficient equation for the weir with the FGP.
Author Contributions
Z.T. carried out the experimental investigation and writing; W.W. wrote the methodology and review; R.B. carried out the data curation; N.L. carried out data validation. All four authors reviewed and contributed to the final manuscript.
Funding
This work was supported by the National Key R&D Program of China (Grant No. 2016YFC0401603), the National Natural Science Foundation of China (Grant No. 51879178), and the Fundamental Research Funds for the Central Universities (Grant No. 20826041A4305).
Conflicts of Interest
The authors declare no conflicts of interest.
References
- Horton, R.E. Weir Experiments, Coefficients, and Formulas; Proc. U.S. Geological Survey Water Supply; Government Printing Office: Washington, DC, USA, 1907.
- Hager, W.H.; Schwalt, M. Broad-crested weir. J. Irrig. Drain. Eng. 1994, 120, 13–26. [Google Scholar] [CrossRef]
- Fritz, H.M.; Hager, W.H. Hydraulics of embankment weirs. J. Hydraul. Eng. 1998, 124, 963–971. [Google Scholar] [CrossRef]
- Bai, R.; Zhang, F.; Liu, S.; Wang, W. Air concentration and bubble characteristics sownstream of a chute aerator. Int. J. Multiphase Flow 2016, 87, 156–166. [Google Scholar] [CrossRef]
- Bai, R.; Liu, S.; Tian, Z.; Wang, W.; Zhang, F. Experimental investigations on air–water flow properties of offset–aerator. J. Hydraul. Eng. 2018, 144, 04017059. [Google Scholar] [CrossRef]
- Govinda Rao, N.S.; Muralidhar, D. Discharge characteristics of weirs of finite crest width. Houille Blanche 1963, 18, 537–545. [Google Scholar] [CrossRef]
- Ramamurty, A.S.; Udoyara, S.T.; Rao, M.V.J. Characteristic of square-edged and round-nosed broad-crested weirs. J. Irrig. Drain. Eng. 1988, 114, 61–73. [Google Scholar] [CrossRef]
- Sarker, M.A.; Rhodes, D.G. Calculation of free-surface profile over a rectangular broad-crested weir. Flow Meas. Instrum. 2004, 15, 215–219. [Google Scholar] [CrossRef]
- Andersson, A.G.; Andreasson, P.; Staffan Lundström, T. CFD-modelling and validation of free surface flow during spilling of reservoir in down-scale model. Eng. Appl. Comput. Fluid Mech. 2013, 7, 159–167. [Google Scholar] [CrossRef]
- Chen, Y.; Fu, Z.; Chen, Q.; Cui, Z. Discharge Coefficient of Rectangular Short-CrestedWeir with Varying Slope Coefficients. Water 2018, 10, 204. [Google Scholar] [CrossRef]
- Azimi, A.H.; Rajaratnam, N.; Zhu, D.Z. Submerged Flows over Rectangular Weirs of Finite Crest Length. J. Irrig. Drain. Eng. 2014, 140, 06014001. [Google Scholar] [CrossRef]
- Jan, C.D.; Chang, C.J.; Kuo, F.H. Experiments on discharge equations of compound broad-crested weirs. J. Irrig. Drain. Eng. 2009, 135, 511–515. [Google Scholar] [CrossRef]
- Xie, S.Z.; Li, S.Q.; Li, G.F. Development of flaring gate piers in China. Hongshui River 1995, 14, 3–11. (In Chinese) [Google Scholar]
- Guo, J.; Liu, Z.P. Field observations on the RCC stepped spillways with the flaring pier gate on the Dachaoshan Project. In Proceedings of the IAHR XXX International Congress, Theme D, Thessaloniki, Greece, August 2003; pp. 473–478. [Google Scholar]
- Zhang, T.; Wu, C.; Liao, H.S. 3D numerical simulation on water and air two-phase flows of the steps and flaring gate pier. J. Hydrodyn. 2005, 17, 338–343. [Google Scholar]
- Wang, B.; Wu, C.; Mo, Z.Y. Relationship of first step height, step slope and cavity in X-shaped flaring gate piers. J. Hydrodyn. 2007, 19, 349–355. [Google Scholar] [CrossRef]
- Futian, L.; Peiqing, L.; Weilin, X.; Zhong, T. Experimental study on effect of flaring piers on weir discharge capacity in high arch dam. J. Hydraul. Eng. 2003, 11, 43–47. (In Chinese) [Google Scholar]
- Li, N.W.; Liu, C.; Deng, J.; Zhang, X.Z. Theoretical and experimental studies of the flaring piers on the surface spillway in a high-arch dam. J. Hydrodyn. 2012, 24, 496–505. [Google Scholar] [CrossRef]
- Ramamurthy, A.S.; Vo, N.D. Characteristics of circular-crested weir. J. Hydraul. Eng. 1963, 119, 1055–1062. [Google Scholar] [CrossRef]
Figure 1.
Experimental setup: (a) plane view; (b) side view.
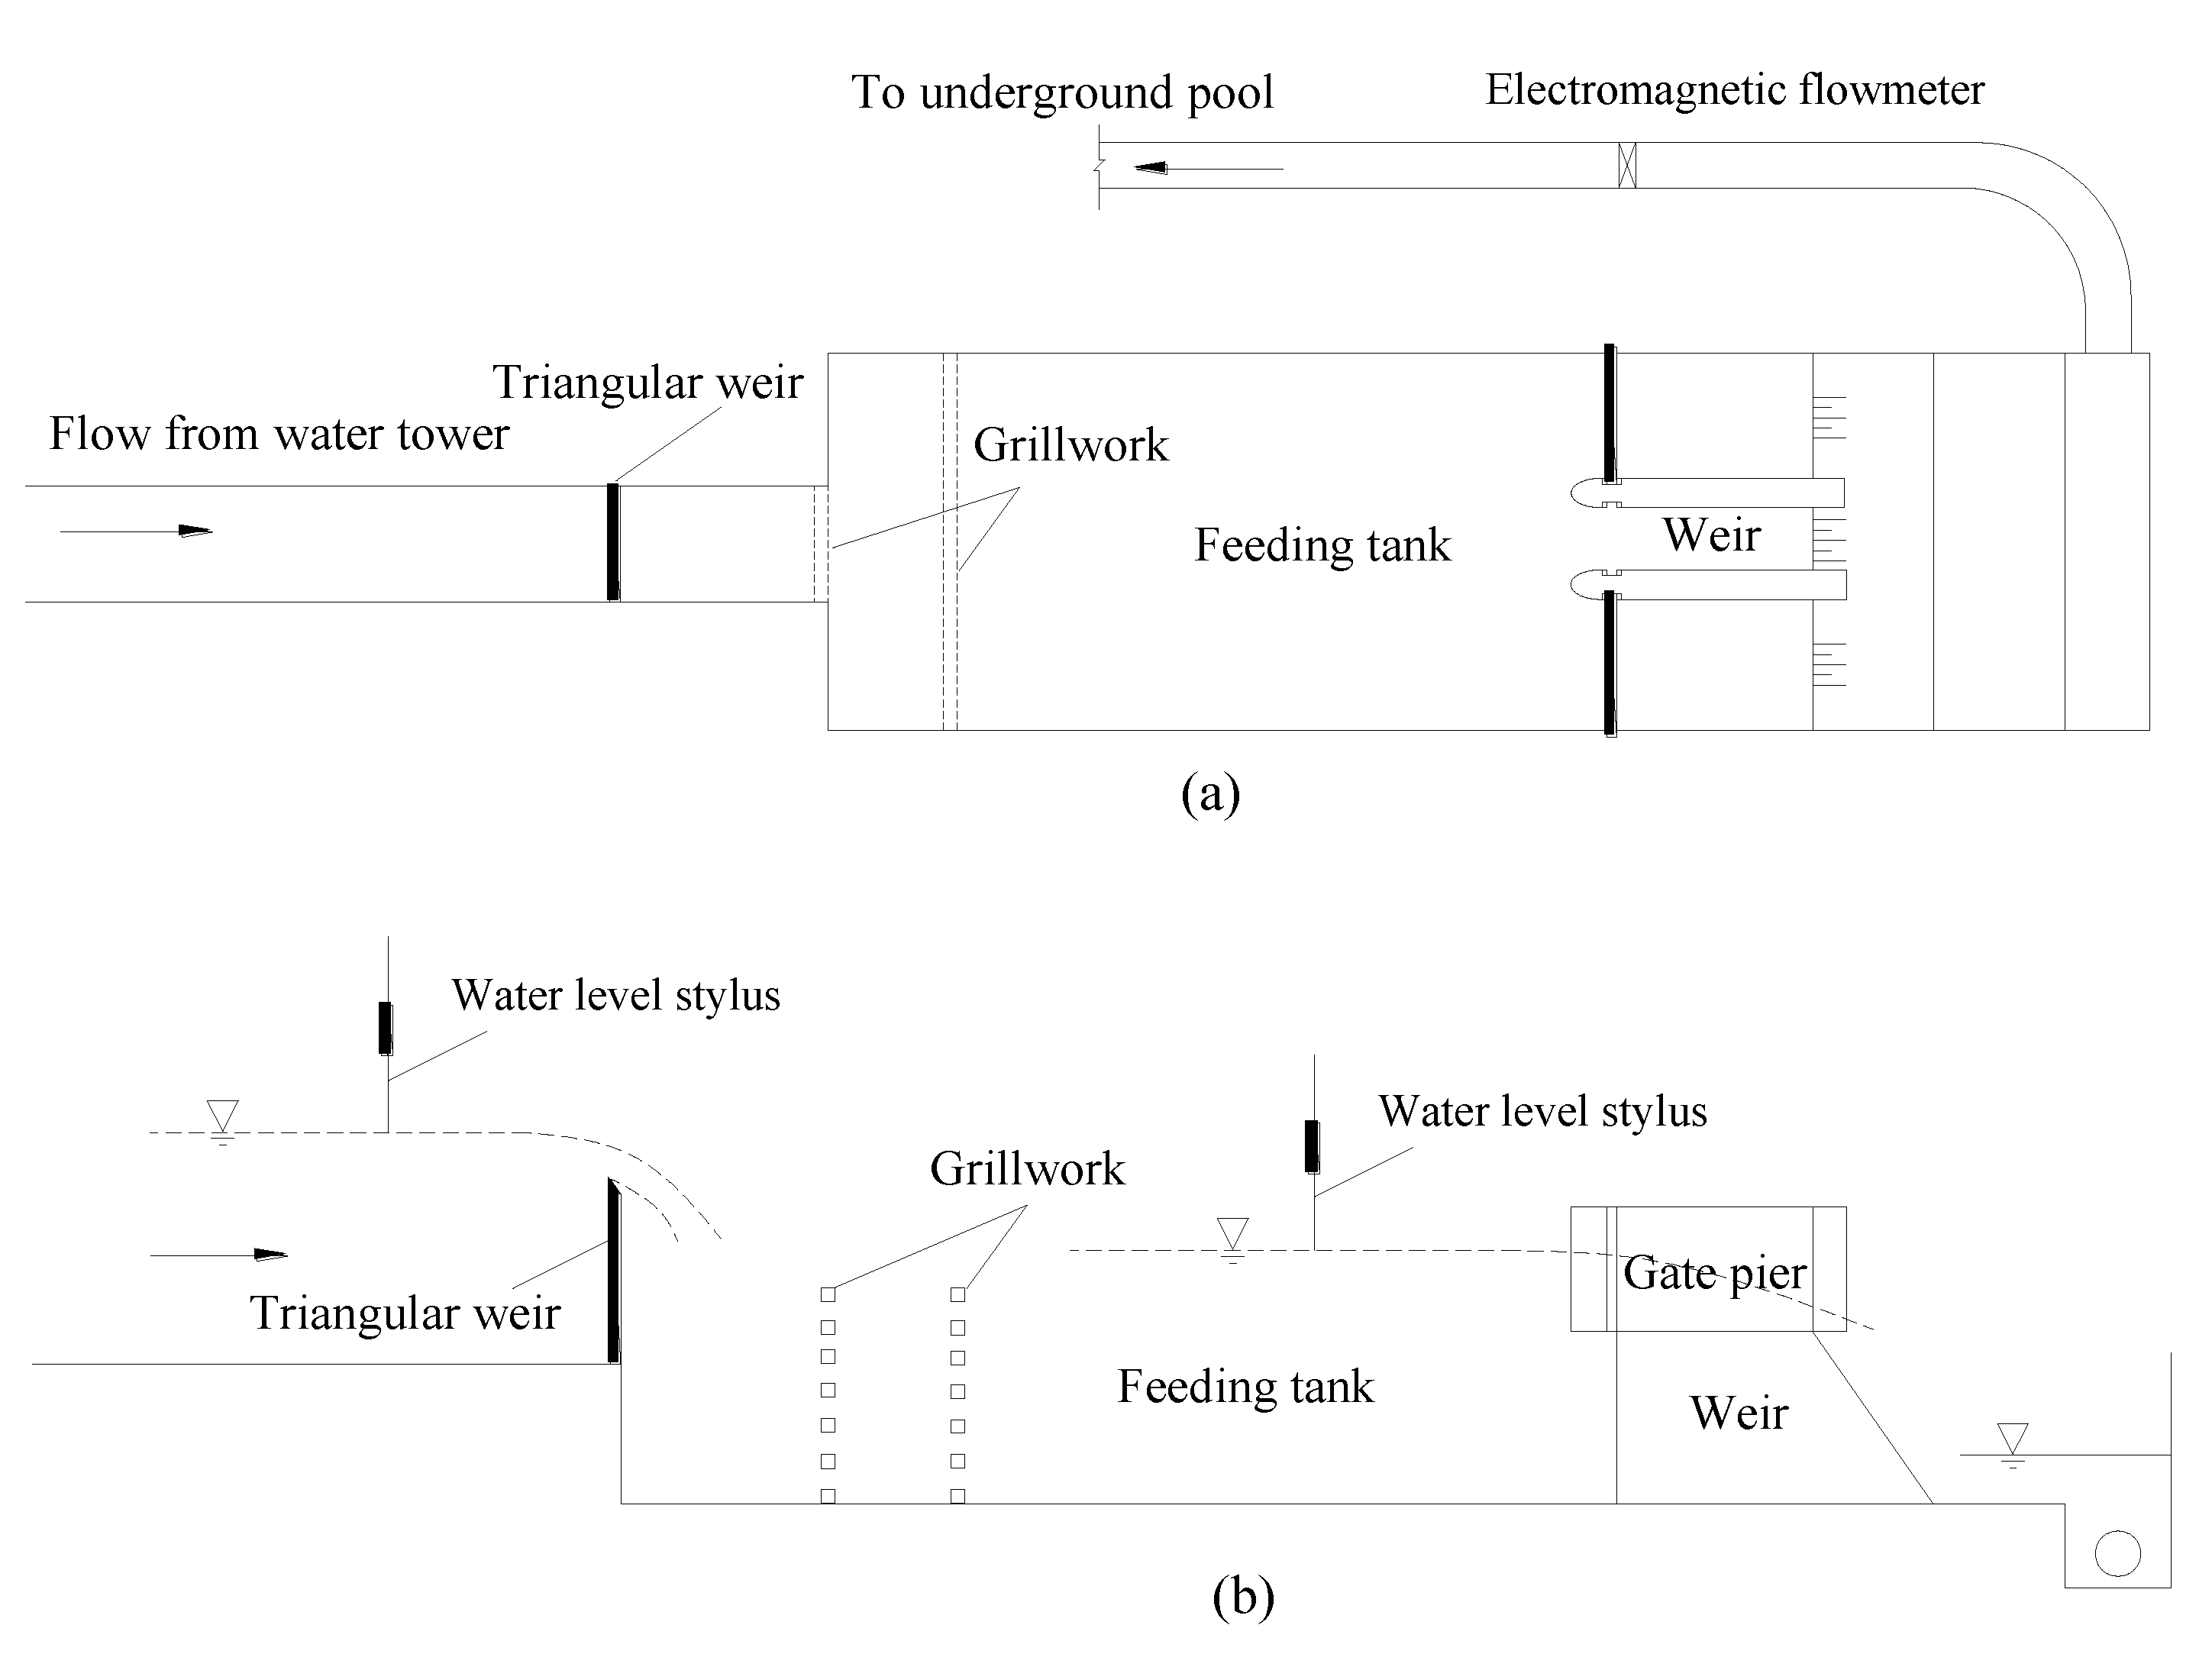
Figure 2.
Definition sketch of the finite-crest length weir with FGP (Flaring Gate Pier): (a) plane view; (b) front view; (c) side view (Lw—the length of the weir, Lp—the length of the FGP, B—the width of the weir crest, b—the width of the weir outlet, P—the height of the weir, H—the head of the weir, V0—approching velocity).

Figure 3.
Photograph of the plunging jets in the present study (H = 0.3 m): (a) without FGP (β = 1); (b) with FGP (β = 0.51, θ = 15°); (c) with FGP (β = 0.51, θ = 15°).
Figure 3.
Photograph of the plunging jets in the present study (H = 0.3 m): (a) without FGP (β = 1); (b) with FGP (β = 0.51, θ = 15°); (c) with FGP (β = 0.51, θ = 15°).

Figure 4.
Comparison of water-surface profiles: (a) with FGP (β = 0.51, θ = 15°); (b) without FGP (β = 1) (Q—the discharge of the weir, H1—water depth of the weir crest).
Figure 4.
Comparison of water-surface profiles: (a) with FGP (β = 0.51, θ = 15°); (b) without FGP (β = 1) (Q—the discharge of the weir, H1—water depth of the weir crest).


Figure 5.
Photograph of water surface: (a) without FGP; (b) with FGP (β = 0.51, θ = 15°) (Black arrow stands for the flow direction).
Figure 5.
Photograph of water surface: (a) without FGP; (b) with FGP (β = 0.51, θ = 15°) (Black arrow stands for the flow direction).

Figure 6.
Head–discharge relationship of the weir for the cases with FGP (β = 0.51, θ = 15°) and without FGP.
Figure 6.
Head–discharge relationship of the weir for the cases with FGP (β = 0.51, θ = 15°) and without FGP.

Figure 7.
Relationship between the discharge coefficient (Cd) and the weir head (H) for the cases with FGP (β = 0.51, θ = 15°) and without FGP.
Figure 7.
Relationship between the discharge coefficient (Cd) and the weir head (H) for the cases with FGP (β = 0.51, θ = 15°) and without FGP.

Figure 8.
Discharge coefficient (Cd) versus weir head (H) together with different weir lengths (Lw): (a) with FGP (β = 0.51, θ = 15°); (b) without FGP.
Figure 8.
Discharge coefficient (Cd) versus weir head (H) together with different weir lengths (Lw): (a) with FGP (β = 0.51, θ = 15°); (b) without FGP.

Figure 9.
Discharge coefficient Cd versus β (a) and θ (b).
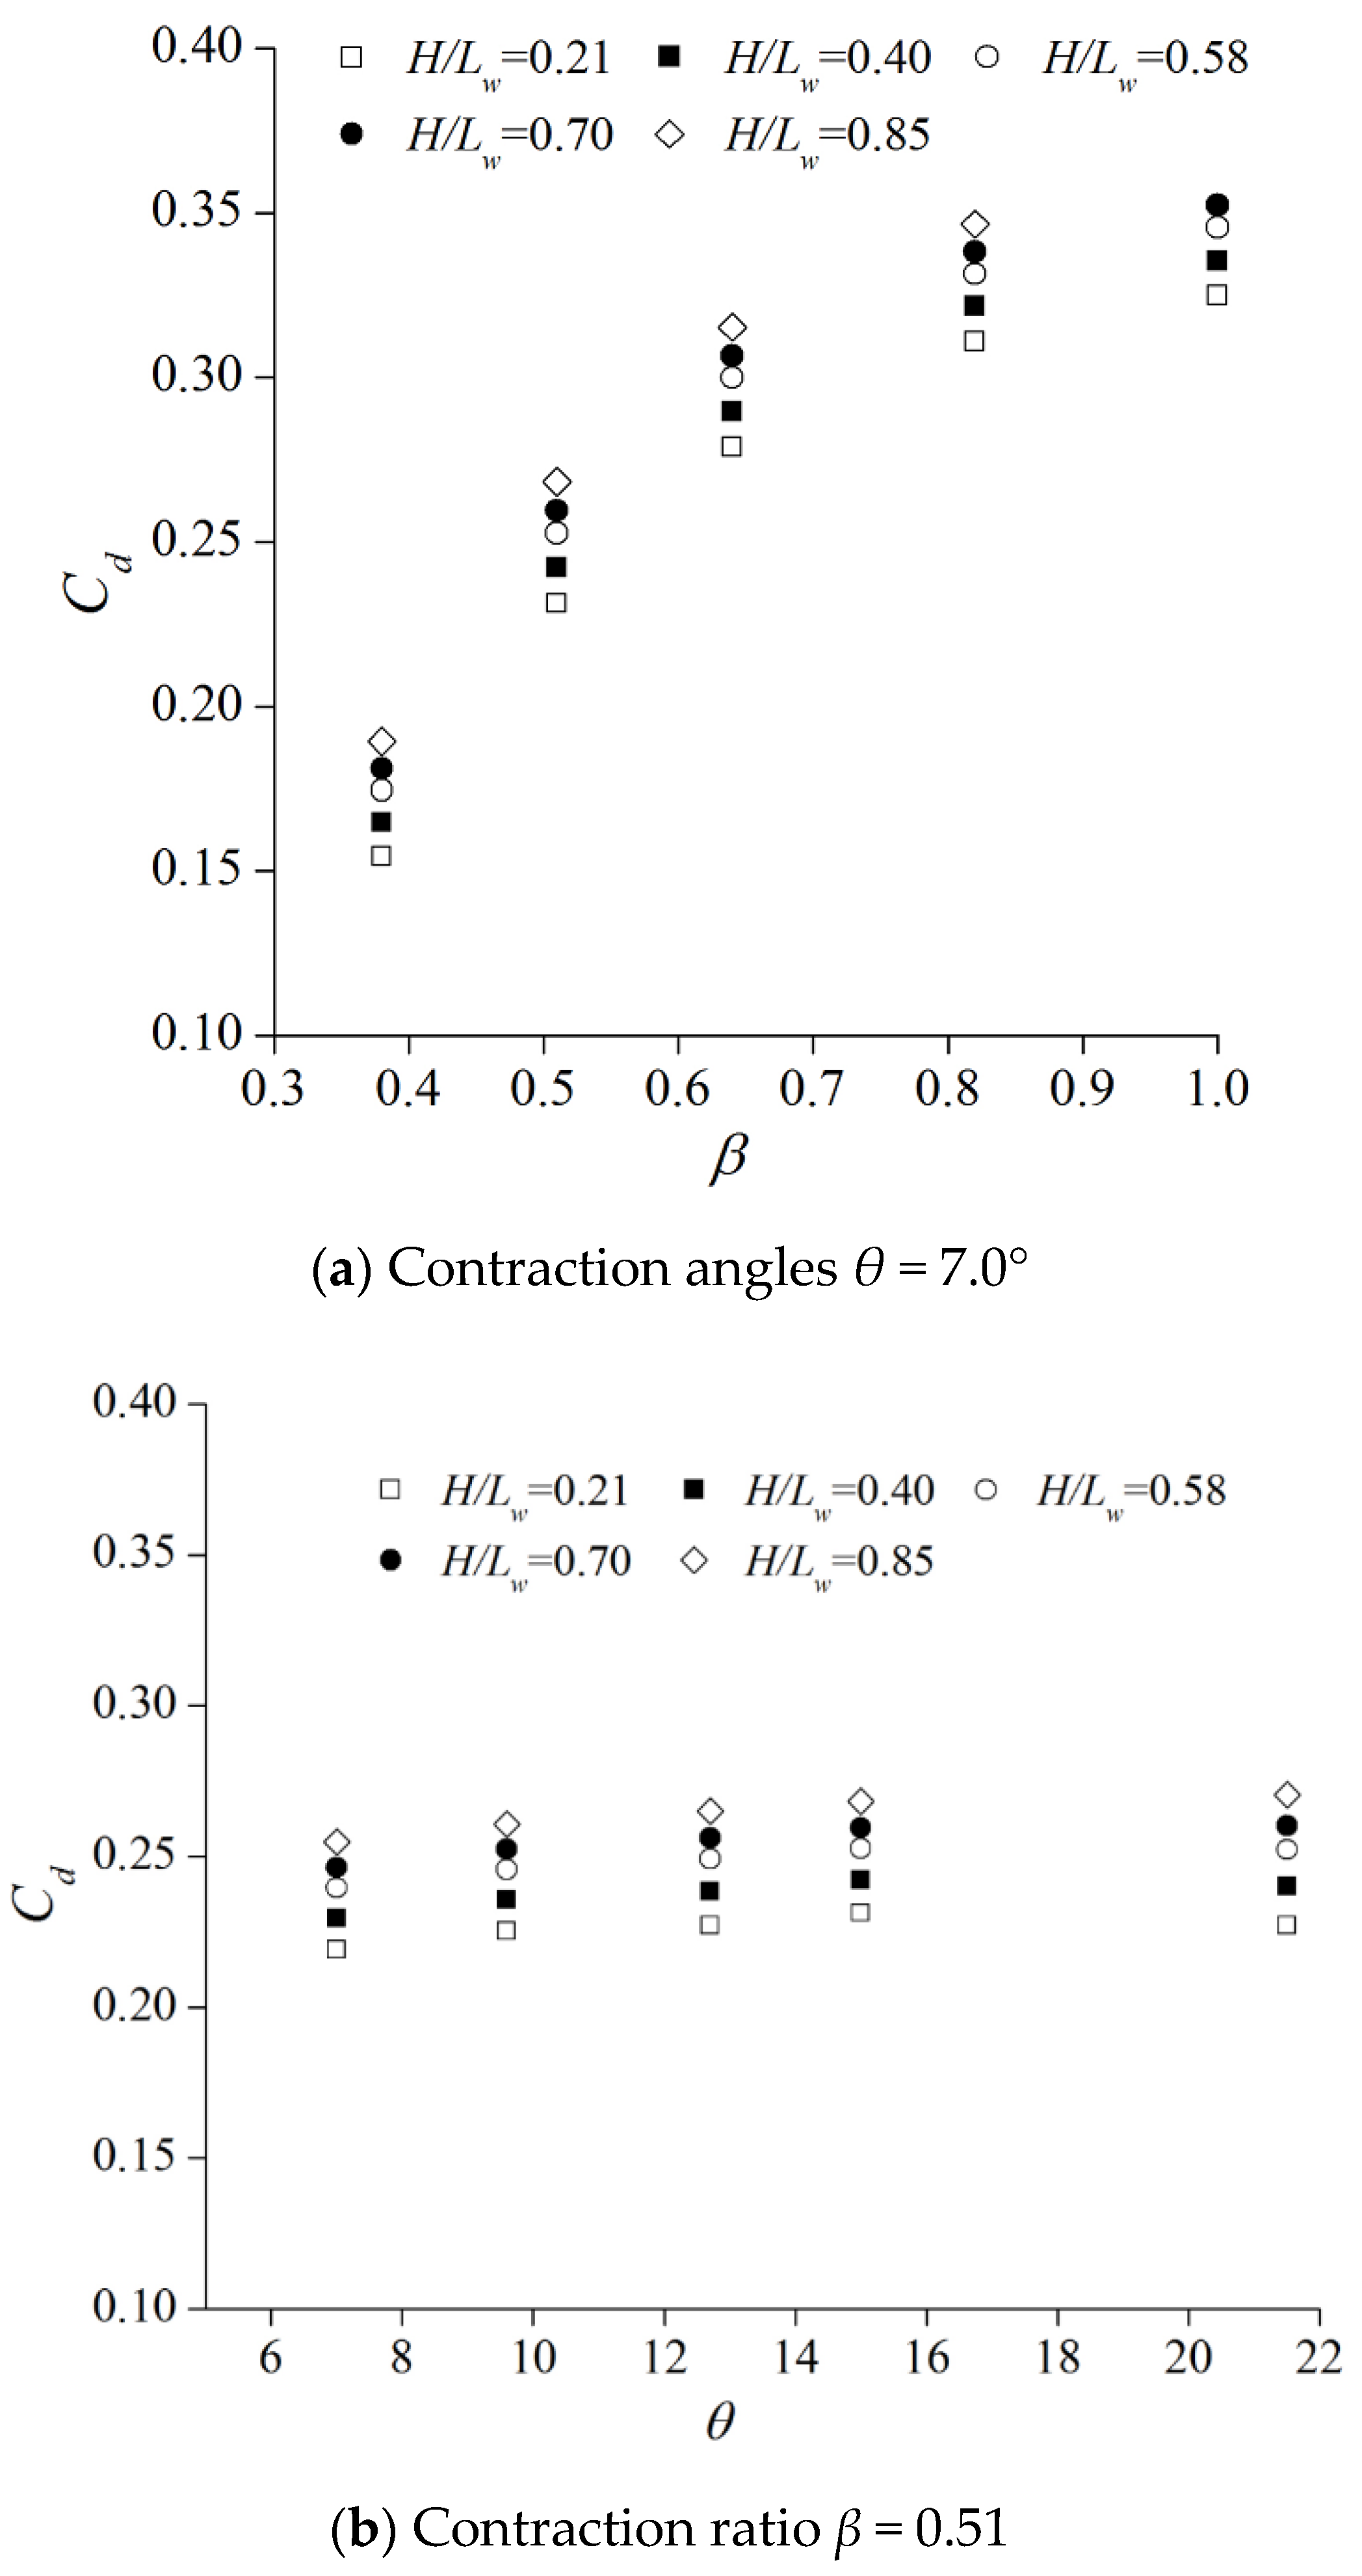
Figure 10.
Compared of measured and Equation (3)-computed values.

Table 1.
Parameters of the finite-crest length weir and FGP.
| Weir Type | Weir Height | Weir Length | Channel Width | Contraction Ratio | Contraction Angle | Case Name |
|---|---|---|---|---|---|---|
| P (m) | Lw (m) | B (m) | β = B’/B | θ | ||
| Type 1 | 1.493 | 0.422 | 0.30 | 0.51 | 15 | N1 |
| 1 | 0 | N2 | ||||
| Type 2 | 1.379 | 0.519 | 0.30 | 0.51 | 15 | N3 |
| 1 | 0 | N4 | ||||
| Type 3 | 1.28 | 0.601 | 0.30 | 0.51 | 15 | N5 |
| 1 | 0 | N6 | ||||
| 0.38 | 15 | N7 | ||||
| 0.64 | 15 | N8 | ||||
| 0.82 | 15 | N9 | ||||
| 0.51 | 7 | N10 | ||||
| 0.51 | 9.6 | N11 | ||||
| 0.51 | 12.7 | N12 | ||||
| 0.51 | 21.5 | N13 |
© 2018 by the authors. Licensee MDPI, Basel, Switzerland. This article is an open access article distributed under the terms and conditions of the Creative Commons Attribution (CC BY) license (http://creativecommons.org/licenses/by/4.0/).
Share and Cite
MDPI and ACS Style
Tian, Z.; Wang, W.; Bai, R.; Li, N. Effect of Flaring Gate Piers on Discharge Coefficient for Finite Crest-Length Weirs. Water 2018, 10, 1349. https://doi.org/10.3390/w10101349
AMA Style
Tian Z, Wang W, Bai R, Li N. Effect of Flaring Gate Piers on Discharge Coefficient for Finite Crest-Length Weirs. Water. 2018; 10(10):1349. https://doi.org/10.3390/w10101349
Chicago/Turabian StyleTian, Zhong, Wei Wang, Ruidi Bai, and Nan Li. 2018. "Effect of Flaring Gate Piers on Discharge Coefficient for Finite Crest-Length Weirs" Water 10, no. 10: 1349. https://doi.org/10.3390/w10101349
Note that from the first issue of 2016, this journal uses article numbers instead of page numbers. See further details here.