Article

Land Use Change over the Amazon Forest and Its Impact on the Local Climate †

1
São Paulo State University (UNESP), Av. Eng. Luiz Edmundo Carrijo Coube, 14-01, Bairro: Vargem Limpa, Bauru, SP 17033-360, Brazil
2
Bauru Meteorological Centre (IPMet/UNESP), Bauru, SP 17033-360, Brazil
3
Federal University of Itajuba (UNIFEI), Av. BPS, 1303, Bairro: Pinheirinho, Itajubá, MG 37500-903, Brazil
4
Earth System Physics, Abdus Salam International Centre for Theoretical Physics, Trieste 34100, Italy
5
University of São Paulo (USP), Rua do Matão, 1226, Bairro: Butantã, São Paulo, SP 05508-090, Brazil
6
National Centre for Monitoring and Early Warning of Natural Disasters—CEMADEN, São José dos Campos, SP 12247-016, Brazil
*
Author to whom correspondence should be addressed.
Water 2018, 10(2), 149; https://doi.org/10.3390/w10020149
Submission received: 7 November 2017 / Revised: 19 January 2018 / Accepted: 22 January 2018 / Published: 3 February 2018

Abstract

:
One of the most important anthropogenic influences on climate is land use change (LUC). In particular, the Amazon (AMZ) basin is a highly vulnerable area to climate change due to substantial modifications of the hydroclimatology of the region expected as a result of LUC. However, both the magnitude of these changes and the physical process underlying this scenario are still uncertain. This work aims to analyze the simulated Amazon deforestation and its impacts on local mean climate. We used the Common Land Model (CLM) version 4.5 coupled with the Regional Climate Model (RegCM4) over the Coordinated Regional Climate Downscaling Experiment (CORDEX) South America domain. We performed one simulation with the RegCM4 default land cover map (CTRL) and one simulation under a scenario of deforestation (LUC), i.e., replacing broadleaf evergreen trees with C3 grass over the Amazon basin. Both simulations were driven by ERA Interim reanalysis from 1979 to 2009. The climate change signal due to AMZ deforestation was evaluated by comparing the climatology of CTRL with LUC. Concerning the temperature, the deforested areas are about 2 °C warmer compared to the CTRL experiment, which contributes to decrease the surface pressure. Higher air temperature is associated with a decrease of the latent heat flux and an increase of the sensible heat flux over the deforested areas. AMZ deforestation induces a dipole pattern response in the precipitation over the region: a reduction over the west (about 7.9%) and an increase over the east (about 8.3%). Analyzing the water balance in the atmospheric column over the AMZ basin, the results show that under the deforestation scenario the land surface processes play an important role and drive the precipitation in the western AMZ; on the other hand, on the east side, the large scale circulation drives the precipitation change signal. Dipole patterns over scenarios of deforestation in the Amazon was also found by other authors, but the precipitation decrease on the west side was never fully explained. Using budget equations, this work highlights the physical processes that control the climate in the Amazon basin under a deforestation scenario.

1. Introduction

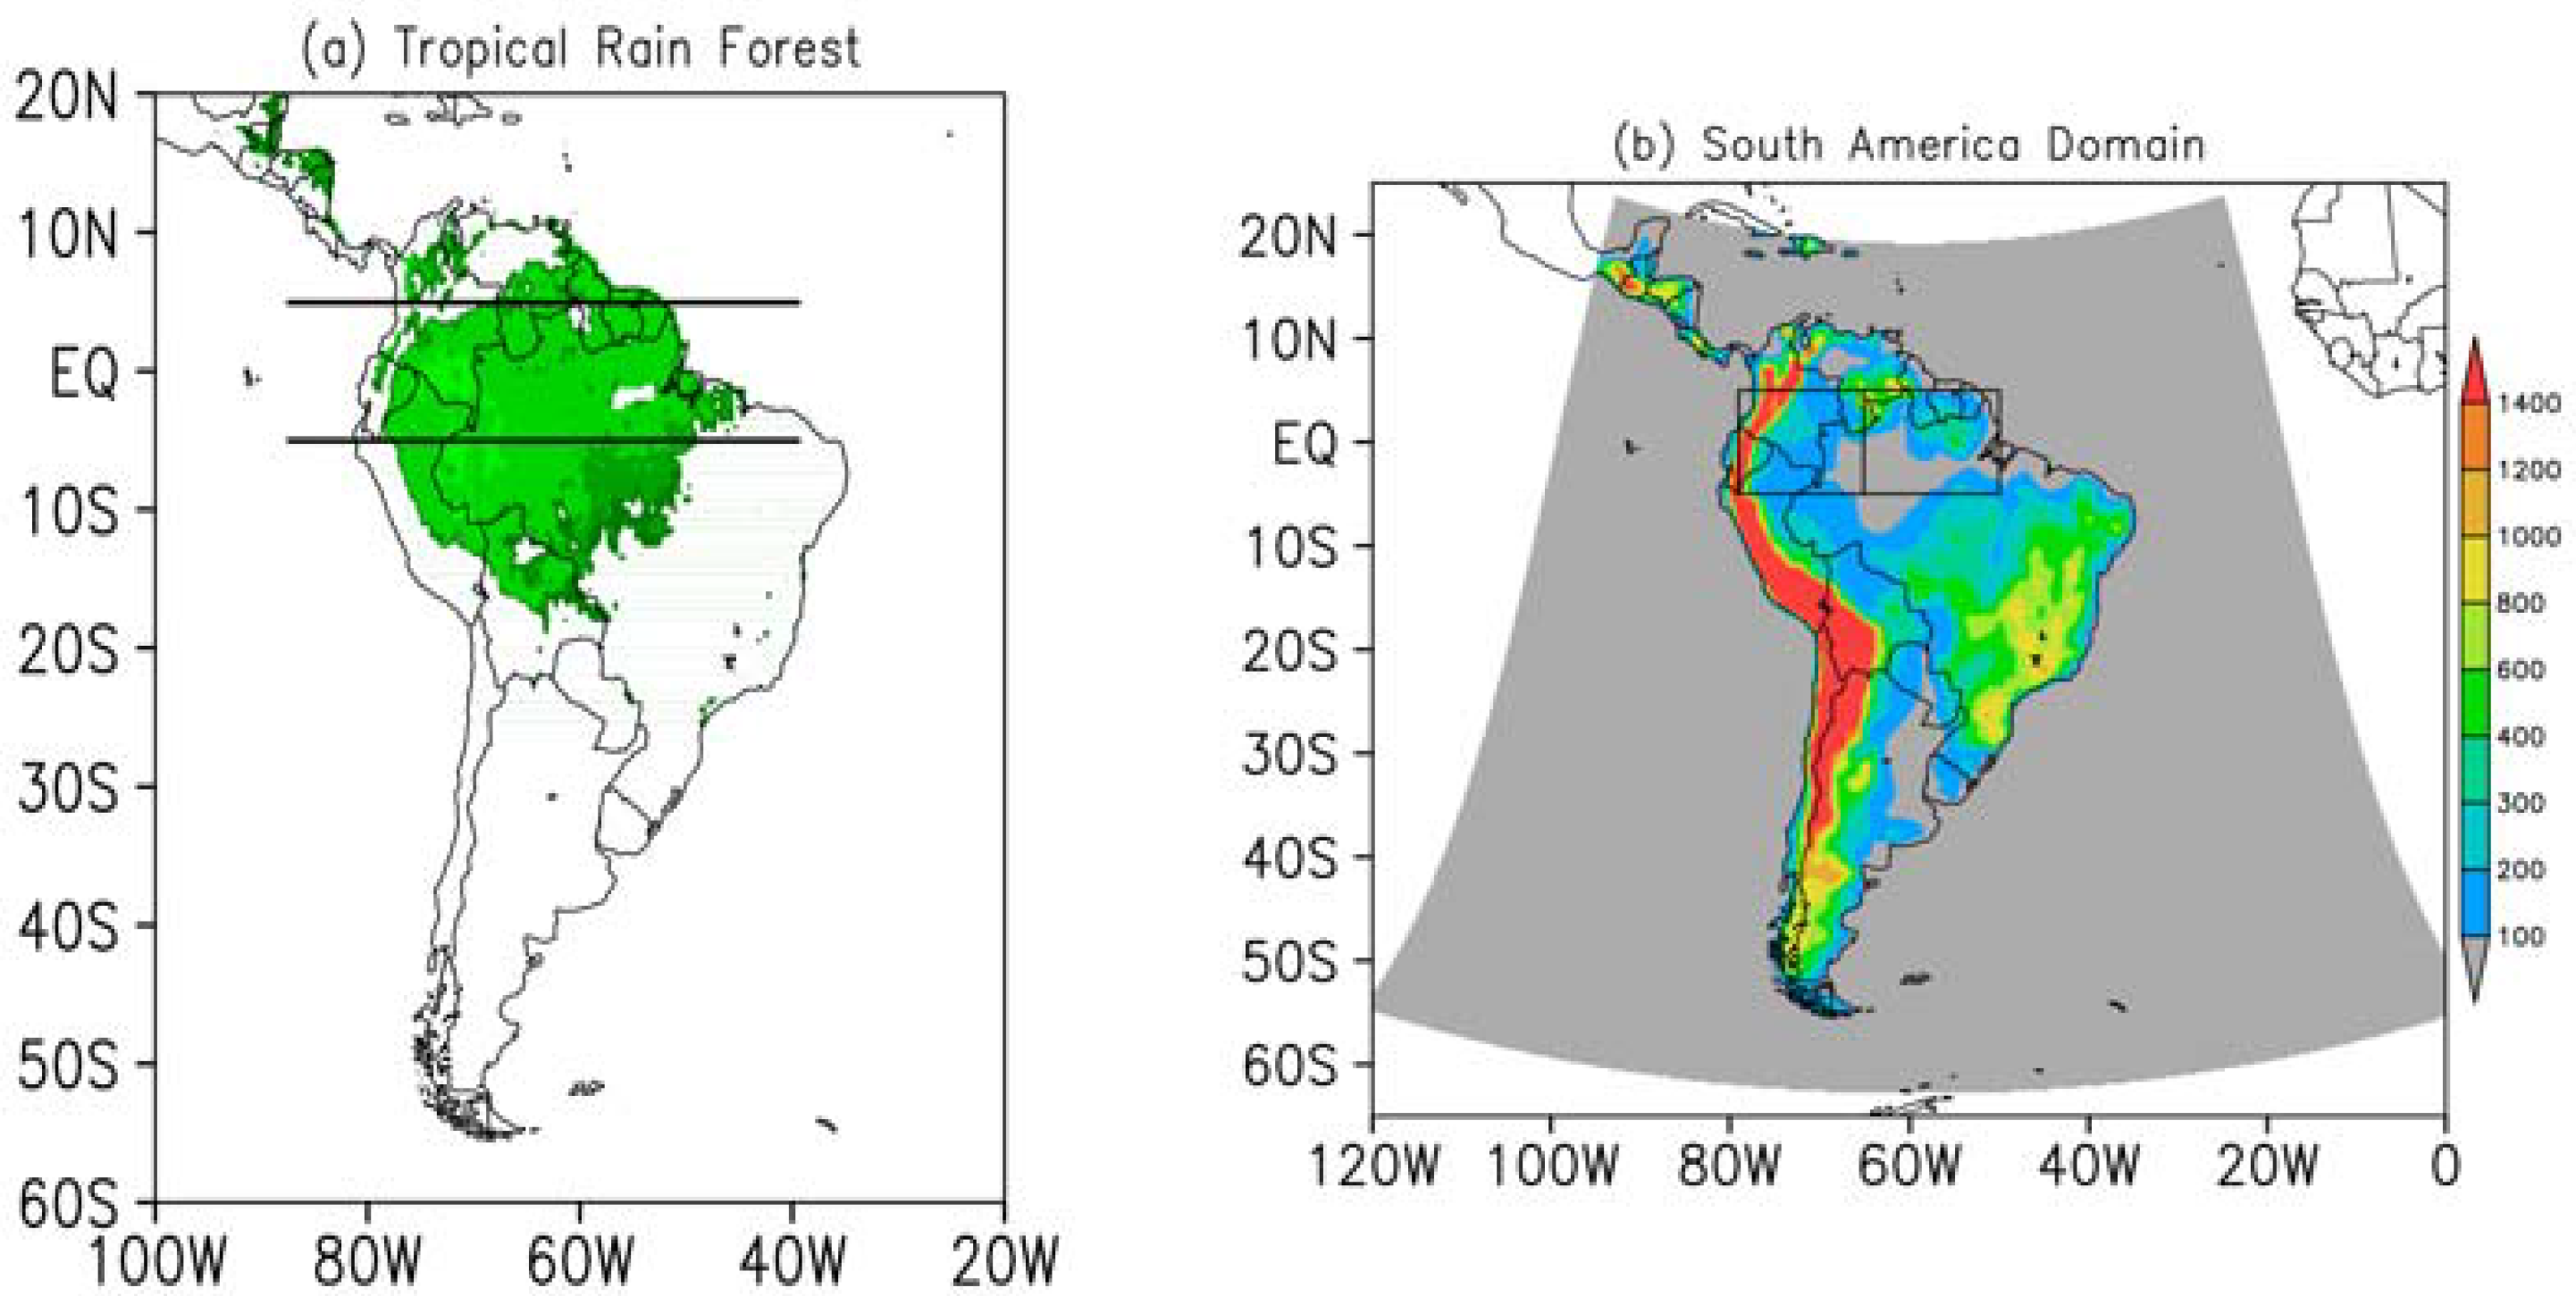
One of the most important anthropogenic influences on the climate is related to land use change (LUC). In particular, the Amazon (AMZ) basin is a highly vulnerable area to climate change due to substantial modifications of the hydroclimatology of the region expected as a result of LUC forcing. The AMZ forest is the largest tropical rainforest on Earth [1]. It covers approximately 5.5 million km2, where Brazil comprises 60% of the area [2]. Deforestation (such as biomass burning and forest fragmentation) and land use change and their impacts on the climate are some of the issues presented in this region. The Instituto de Pesquisas Espaciais (INPE) from Brazil [3] indicated that the rate of deforestation in the Brazilian Amazon between 2000 and 2009 was one of the fastest in the world, averaging 17,486 km2 per year. More recently it was inferred for the southern AMZ that an area of 191,319 km2 underwent changes in land cover during the period of 1970 to 2012 [4]. Deforested areas present higher surface albedo when compared with areas without changes [5,6]. Moreover, under deforestation the moisture storage capacity decreases, affecting the local energy budget, i.e., sensible heating increases whereas latent heating decreases [7]. Deforestation/land use change also contributes to increased greenhouse gas emissions into the atmosphere [8,9,10].
The AMZ climate is affected by both local and external (located outside the region) moisture sources. Concerning the water balance in the atmospheric column, the total water precipitating on large continental regions is supplied by the advection from the external surrounding areas and by land surface evaporation and transpiration within the region [11]. The hydroclimatic regime variability of the AMZ is affected by local climate feedbacks. Evapotranspiration (ET, [12]) plays an important role in precipitation, and it is affected, as well, by large scale climate patterns, such as sea surface temperature (SST) anomalies [12,13,14,15]. Eltahir, E.A.B. et al. [16] estimated that about 25% of the precipitation in the AMZ basin is provided by evaporation within the basin. According to [14], the tropical Atlantic is a remote source of humidity for the AMZ basin with its northern sector contributing mainly during the austral summer.
One of the first studies investigating the conversion of Amazon tropical forest into grass and crops was [17]. The authors used a coupled numerical model of the global atmosphere and biosphere and found an increase in mean surface temperature and a decrease in evapotranspiration, precipitation and runoff when the forest is converted to grass. The National Center for Atmospheric Research GENESIS atmospheric general circulation model, coupled to the integrated biosphere simulator, was applied to study the combined effects of large-scale deforestation and increased CO2 concentrations on the AMZ climate [9]. Considering only deforestation, the basin-average precipitation decreases by 0.73 mm day−1 due to the general weakening in the vertical motion above the deforested area. Werth, D. et al. [18] quantified the effects of LUC in the Amazon on the local and global climate. For this reason, experiments with the global Goddard Institute for Space Studies Model II were carried out, replacing rainforest by a mixture of shrubs and grassland. In these simulations, the precipitation, evapotranspiration and cloudiness were reduced, corroborating previous results [9,17]. It was also verified that Amazonian deforestation is significantly correlated with remote climate changes in several global areas [18]. Brankovic, C. et al. [19] investigated how local and regional circulations are affected by changes in the surface energy and moisture balance over tropical South America. The authors carried out one-year-long ensembles with a relatively high-resolution European Centre for Medium-Range Weather Forecasts (ECMWF) model and showed that the impacts on precipitation were more concentrated in the tropical region than in the extratropics. Differently from previous authors, Salazar, L.F. et al. [20] studied the impact of climate change on vegetation over South America considering A2 and B1 emission scenarios from the Intergovernmental Panel on Climate Change (IPCC) and Coupled Model Intercomparison Project Phase 3 (CMIP3) projections. Their results indicated that increased air temperature may induce higher evapotranspiration in tropical regions and reduce the amount of soil water. It can trigger the replacement of tropical forests by savannas, mainly in the southeastern Amazon.
Most previous studies were conducted with global climate models. LUC studies with regional climate models (RCM) for the AMZ forest date from the year 2000. The impact of converting forest to pasture on the climate of the eastern portion of the AMZ basin was evaluated by Gandu, A.W. et al. [21] using two one-year-long simulations with a regional atmospheric modelling system (RAMS). These simulations showed that the deforestation increased the cloud cover and precipitation over upland areas, especially on slopes facing river valleys. With the reduction of the roughness length (forest to pasture), the wind speed increased near the Atlantic coast and it contributed to diminishing the local moisture flux convergence with a consequent decrease of rainfall totals in nearby regions. Four scenarios of LUC over the AMZ were analyzed by Correia, F.W.S. et al. [22]: (a) no deforestation, (b) current conditions, (c) deforestation projected for 2033 and (d) large scale deforestation. For this investigation, 13-month integrations were performed using the Eta model (name derived from the Greek letter) coupled to the simplified simple biosphere model (SSiB). The authors highlighted that partial deforestation can lead to an increase in precipitation locally, whilst increasing deforestation can lead to drier conditions. In terms of future projections, Salazar, L.F. et al. [23] performed simulations using a regional climate model from the Centro de Previsão de Tempo e Estudos Climáticos nested with the Potential Vegetation Model (CPTEC-PVM2.0) and different prescribed annual anomalies precipitation and temperature added to the observed climatology, and different levels of CO2 fertilization effects under emission scenario A2. These simulations indicate that: (a) tropical forests might be replaced by seasonal forests or savanna over eastern Amazonia with temperature increases of 2–3 °C, when the CO2 fertilization effect is not considered; (b) a decrease in precipitation greater than 30% may shift tropical forest to drier biomes in southeastern Amazonia. The Consortium for small scale modeling - Climate Limited-area Modelling Community (COSMO-CLM2) projected a dipole pattern in the precipitation field under an Amazon deforested scenario that was dry and wet, respectively, in the western and eastern sectors of the basin [24]. Wetter conditions over western sector were associated with the increase of low levels of moisture transport, due stronger winds over deforested area, from the tropical Atlantic Ocean to the AMZ region. Moreover, a decrease in the upward vertical motion was noted in the eastern dry sector, indicating subsidence over this region. A decrease in precipitation mainly over the eastern Amazon in a deforestation scenario using the Regional Climate Model (RegCM3) was also found by Silva, M.E.S. et al. [25]. According to [6], over deforested areas, the albedo-induced decrease in surface net radiation reduces the overall amount of energy transferred to the atmosphere. Therefore, less energy is available for convection.
In order to complement previous studies, we analyze how LUC (changing forest to grass) over the Amazon basin modifies the surface energy and water budgets in the atmosphere. These budgets are explored in order to explain the simulated changes in precipitation and air temperature over the Amazon due to LUC modifications.

2. Material and Methods

2.1. RegCM4 Configuration and Experiment Design

The latest version of the Abdus Salam International Centre for Theoretical Physics (ICTP) regional climate model, RegCM4 [26] version 4.45, was used in this work. RegCM4 is an evolution of its previous versions [27] with many upgrades in several aspects of the model physics. A list of the available physical options in RegCM4 is given in [26]. For example, different schemes are available to represent cumulus convection, such as the schemes of Grell [28] and Emanuel [29]. The RegCM system has been being used by a wide research community for the last two decades [26,27] in several applications, including process studies, paleo and future climate simulations, land–atmosphere interactions and aerosol effects (e.g., [26,27]). The current version of RegCM4 has the Community Land Model version 4.5 (CLM4.5, [30]), as an alternative to the Biosphere-Atmosphere Transfer Scheme (BATS, [31]) to describe land surface processes. CLM4.5 presents substantial improvements compared to BATS to describe soil temperature and moisture transfers, vegetation and surface hydrology processes. Spatial land surface heterogeneity in CLM4.5 is represented as a nested subgrid hierarchy in which grid cells are composed of multiple land units, snow/soil columns, and plant functional types. Details of CLM4.5 are found in the technical description of version 4.5 [31].
We performed two simulations covering the period 1979–2009, starting at 00:00 UTC on 1 January. The first simulated year (1979) was used as spin-up and, for this reason, it was discarded from the analysis. The control (CTRL) experiment assumes that over the Amazon the plant functional type for CLM4.5 is broadleaf evergreen tree (hereafter tropical rain forest), which considers the canopy top at 35 m tall. In the other simulation, hereafter referred as the LUC experiment, tropical rain forest was replaced with C3 grass and a canopy top of 0.5 m. Both simulations used the Leaf Area Index (LAI) from monthly datasets with a spatial resolution of 0.5°, as described in [31]. Topography and land use data were taken from the United States Geological Survey (USGS) and Global Land Cover Characterization (GLCC), respectively, and they have 10’ of horizontal resolution [32]. Tropical rain forest was replaced by grass in the GLCC data to carry out the LUC experiment, in order to assess the underlying physical processes of this change over the AMZ.
The green area in Figure 1a represents the tropical rain forest (CTRL experiment) that was replaced with C3 grass in the LUC experiment, whereas horizontal black lines indicate the cross section (5° S–5° N) selected for a detailed analysis of the signal of LUC over the tropical areas.
RegCM4 is integrated with a horizontal grid spacing of about 50 km, 18 sigma-pressure vertical levels for South America (SA) CORDEX [33] domain (Figure 1b), which covers SA and adjacent oceans, and we used 100 s as a model time step. Atmospheric variables and SST were provided by the 1.5° × 1.5° ERA-Interim reanalysis dataset [34] as the initial and boundary conditions for RegCM4.45. The simulations used the Emanuel scheme for cumulus convection according to [35,36], which showed the combination of the Emanuel and CLM results in smaller errors in the RegCM4 simulations over SA than in other convection schemes.

2.2. Analysis

The first part of the results presents the validation of the CTRL experiment (air temperature and precipitation) by comparing it with the monthly observed data from the Climate Research Unit (CRU, [37]). The air temperature and precipitation from the CRU were obtained using only observed data from surface stations over land, at 0.5° × 0.5° horizontal resolution. The precipitation and temperature change signals due to AMZ deforestation were evaluated by comparing the climatology (1980–2009) of the LUC and CTRL.
To better understand the LUC signals, the climatology of other simulated variables were also analyzed (surface pressure, geopotential height, albedo, soil moisture, evapotranspiration, sensible (H), latent (LE) and soil heat fluxes (G)). Physical interpretation of the results was conducted analyzing the surface energy budget, which determines the amount of energy available to evaporate the surface water and to raise or lower temperature [38], and it can be defined as in Equation (1):
R n = H + L E + G
The results section shows that precipitation presents a dipole pattern over the western and eastern AMZ basin (see in Figure 1b the location of these areas) in the LUC experiment. To better understand this pattern, the water balance in the atmospheric column was also calculated, i.e., the change of atmospheric water vapor storage over the western and eastern AMZ, using the formulation presented by [39], as follows in Equation (2):
dw dt = P + C + ET
where dw/dt represents the water stock change (mm day−1), P is the precipitation (mm day−1), ET is the evapotranspiration (mm day−1), and C is the vertically integrated moisture flux convergence (mm day−1) between 925 and 100 hPa. C is calculated as follow (Equation (3)):
C = . ( V q )
where q and V are, respectively: air specific humidity and horizontal wind vector. In Equation (2), dw dt can be ignored for longer periods, i.e., greater than a month [39], then Equation (3) to estimate water balance can be reduced as follows in Equation (4):
P = E T + C
Using the surface energy and water budgets can discriminate whether the precipitation change signal is affected by land–atmosphere feedback (i.e., evapotranspiration) or by large scale circulation patterns, such as the moisture transport from the Atlantic Ocean to the Amazon basin, or even if the precipitation signal is affected by both.

3. Results

3.1. Validation of the Simulated Climatology in CTRL

Figure 2 shows the annual mean precipitation and air temperature at 2 m for both the CRU and CTRL simulation. The climatology of precipitation simulated by the CTRL experiment presents dry bias over the AMZ basin, while wet bias occurs over the west coast and southeast of SA and northeast Brazil (Figure 2a,b). Concerning air temperature, the CTRL experiment is colder than observations over the center-north SA (Figure 2c,d). In summary, over the AMZ basin RegCM4 simulates the climatology of precipitation with dry bias and underestimates the temperature in relation to CRU analysis.

3.2. Effects of Deforestation

In this section, a comparison is presented between the experiments replacing the tropical rain forest with C3 grass over the Amazon region. The LUC experiment presents higher annual mean air temperature over north-west SA (Figure 3a). Warming at low levels of the atmosphere contributes to decreasing the surface pressure and, as a consequence, it develops a thermal low (Figure 3b). This signal was also found by other deforestation studies over the AMZ, such as [24,25].
Air temperature and albedo (Figure 4a,b) increased, respectively, until 2.5 °C and 0.1 (~10%) over the deforested area as shown by the cross section in Figure 1a. The albedo increased because the tropical forest was replaced by C3 grass, and it is more accentuated between 60° and 50° W. In previous works, Culf, A.D. et al. [5] and Eltahir, E.A.B. [6] also showed that deforested areas have higher albedo than forests. Moreover, Eltahir, E.A.B. [6] mentioned that the surface net radiation (Rn) over cleared areas is smaller than over areas with no deforestation. Figure 4c presents lower Rn (red line) in LUC than in CTRL in the western sector of the AMZ basin, which may indicate an increase in low cloud cover that reduces the incoming solar radiation at the surface.
The physical mechanism associated with higher air temperature in the LUC experiment is a reduction of the latent heat flux (blue line, Figure 4c) and therefore there is an increase in the sensible heat flux (green line, Figure 4c). Changes in the vegetation modify photosynthesis and impact the transpiration. C3 grass transpires less than tropical forest, and it changes the energy budget at the surface, i.e., less energy is used to evaporate (decrease in the latent heat flux) and more energy is used to warm the atmosphere above the surface (increase in the sensible heat flux). Another impact of replacing forest with grass is the increase of ground heat flux (Figure 4c, purple line), once the radiation intercepted by the canopy is reduced in the LUC experiment.
The higher temperatures in the LUC experiment also reflect in the geopotential height (Figure 4d), where the negative values at low levels characterize the thermal low already seen in the pressure field (Figure 3b). Over the western side of the AMZ basin (Figure 1b), where the precipitation is reduced in the LUC (Figure 5), there are positive values in geopotential height from the 900 hPa to the 100 hPa layer, with a maximum near 700 hPa, which might be associated with adiabatic heating by subsidence due to deforestation [24].
Precipitation (Figure 5a) shows a dipole response with a decrease over the western AMZ and an increase over the eastern AMZ. A dipole pattern in precipitation was also found by other simulations using RCM to understand deforestation over the Amazon basin. For example, Silva, M.E.S. et al. [25] obtained a dipole oriented from the northwest (decrease of rainfall) to the southeast (increase of rainfall) direction. Figure 5b accounts only convective precipitation. Over the AMZ, the total precipitation comes mainly from convective process, but also depends on the convection parameterization used in this study. The precipitation of the east–west dipole pattern is also evident in the cross section in Figure 4g, for both the total (red line) and convective precipitation (blue line).
Total evapotranspiration (purple line, Figure 4e) decreases in the LUC experiment. Changing tropical rain forest to C3 grass reduces the transpiration and evapotranspiration (green and red lines, Figure 4e) and increases the ground evaporation (blue line, Figure 4e). It is in agreement with the soil moisture behavior (Figure 4f) that decreases at the surface layer of 10 cm thickness (a very narrow brown layer in Figure 4f) and can be associated with the ground evaporation (blue line, Figure 4e). The deeper soil is up to 2 mm drier (brown color) at 70° W and between 44–40° W in the LUC experiment, which is not significant compared with the areas (green color) showing where the LUC experiment is wetter than the CTRL (Figure 4f). This behavior may be associated with the soil response to precipitation.
Changes in land use (from forest to grass) reduce surface roughness and increase the thermal gradient between the tropical Atlantic Ocean and the continent, with a consequent intensification of winds at low levels (850 hPa), mainly on the eastern AMZ (Figure 6a). Southward of 20o, the eastern Andes low level jet is weakened, which may reduce the moisture flux transport from the north to southeastern SA. Above the low levels at the thermal low (Figure 3b), there is an anticyclonic anomaly in 250 hPa (Figure 6b).

3.3. Water Balance: CTRL vs. LUC Experiments

To better understand the precipitation change signal over the AMZ, the climatology of the water balance in the atmospheric column was calculated, using Equation (4), for both boxes over the AMZ region, shown in Figure 5. Table 1 presents the mean annual (from 1980–2009) values of the total precipitation, evapotranspiration and the vertically integrated moisture flux convergence over the western and eastern AMZ.
Over the western AMZ, precipitation and evapotranspiration were higher in the CTRL than in the LUC experiment, and the differences were 0.58 and 0.50 mm day−1, respectively. Although LUC presented a slightly higher convergence of moisture flux (−2.40 mm day−1) than CTRL (−2.20 mm day−1), it was not enough to oppose the reduced evapotranspiration. In this sense, the CTRL has 0.30 mm day−1 more moisture in the atmosphere than LUC, explaining why on this side of the basin simulated precipitation decreased under the deforestation scenario. Therefore, in this region the land–atmosphere coupling plays an important role in the control of the convective precipitation.
On the other hand, over the eastern AMZ there was an increase in moisture flux convergence in the LUC (1.10 mm day−1) compared to the CTRL, which was higher than the reduction in evapotranspiration (0.60 mm day−1). This excess of 0.5 mm day−1 of moisture in LUC may justify the larger rate of precipitation in the eastern AMZ. The latter result is driven by the convergence of moisture flux related to the intensification of winds at low levels (Figure 6a) transporting moisture from the tropical Atlantic Ocean to the continent.
In summary, over the western AMZ and under a deforestation scenario, there is a strong feedback between land and atmosphere which impacts the precipitation (decreases of rainfall), while large scale climate patterns (moisture flux convergence) drive the precipitation over the eastern side of the AMZ. The values shown in Table 1 can be smaller/higher once the CTRL simulation presents some biases, as discussed in Section 3.1.

4. Conclusions

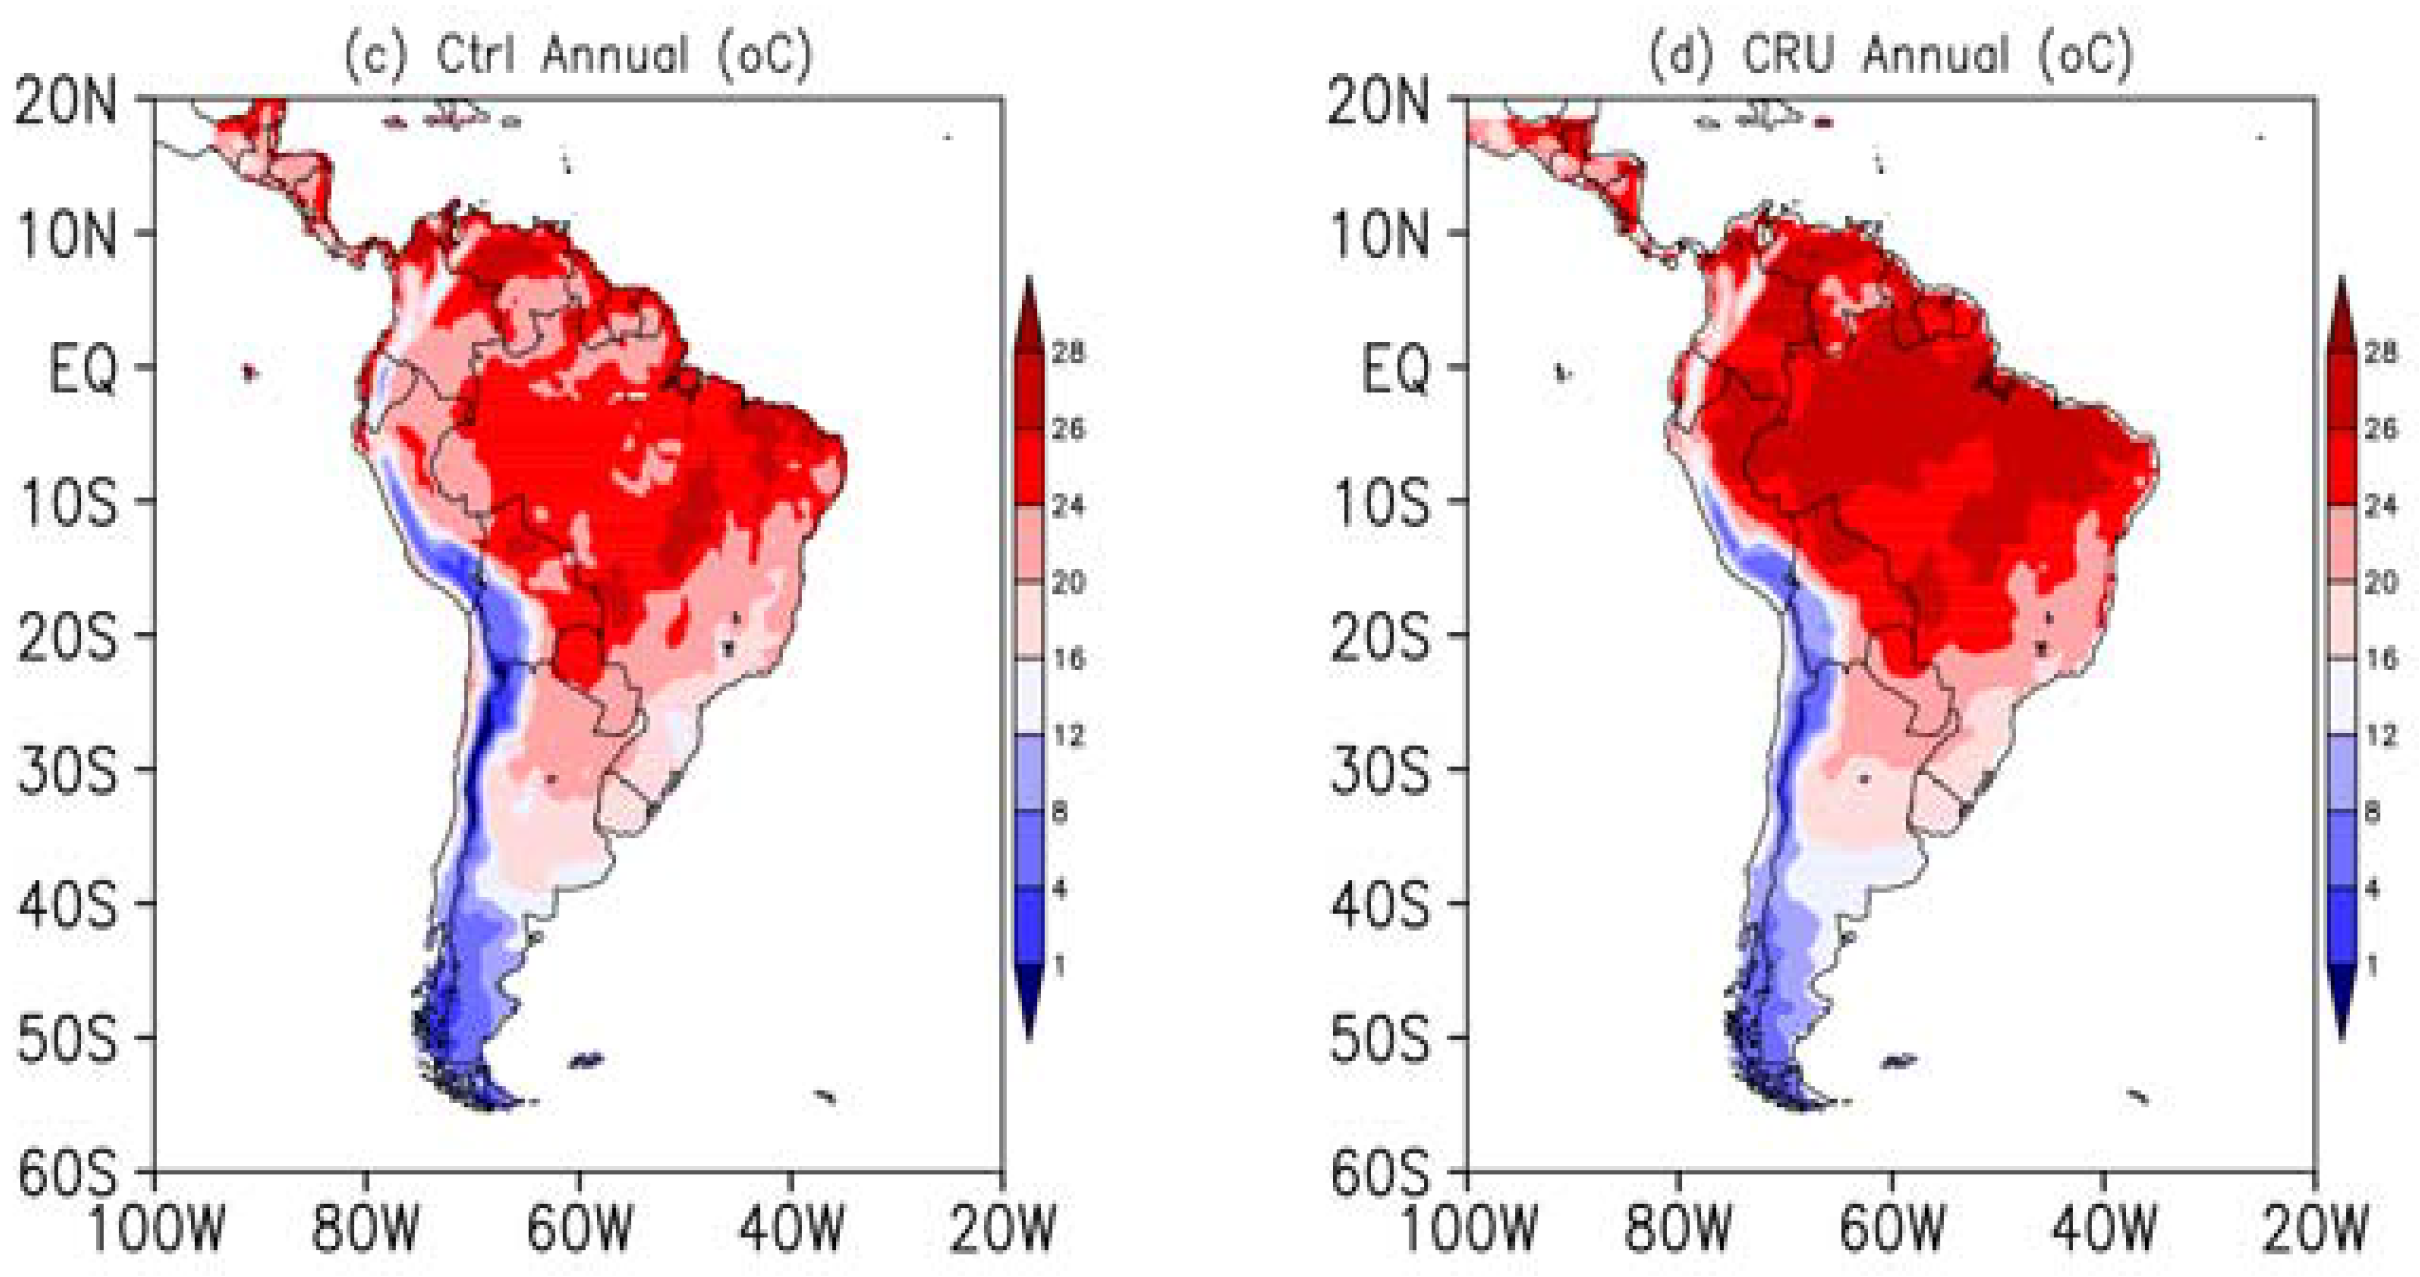
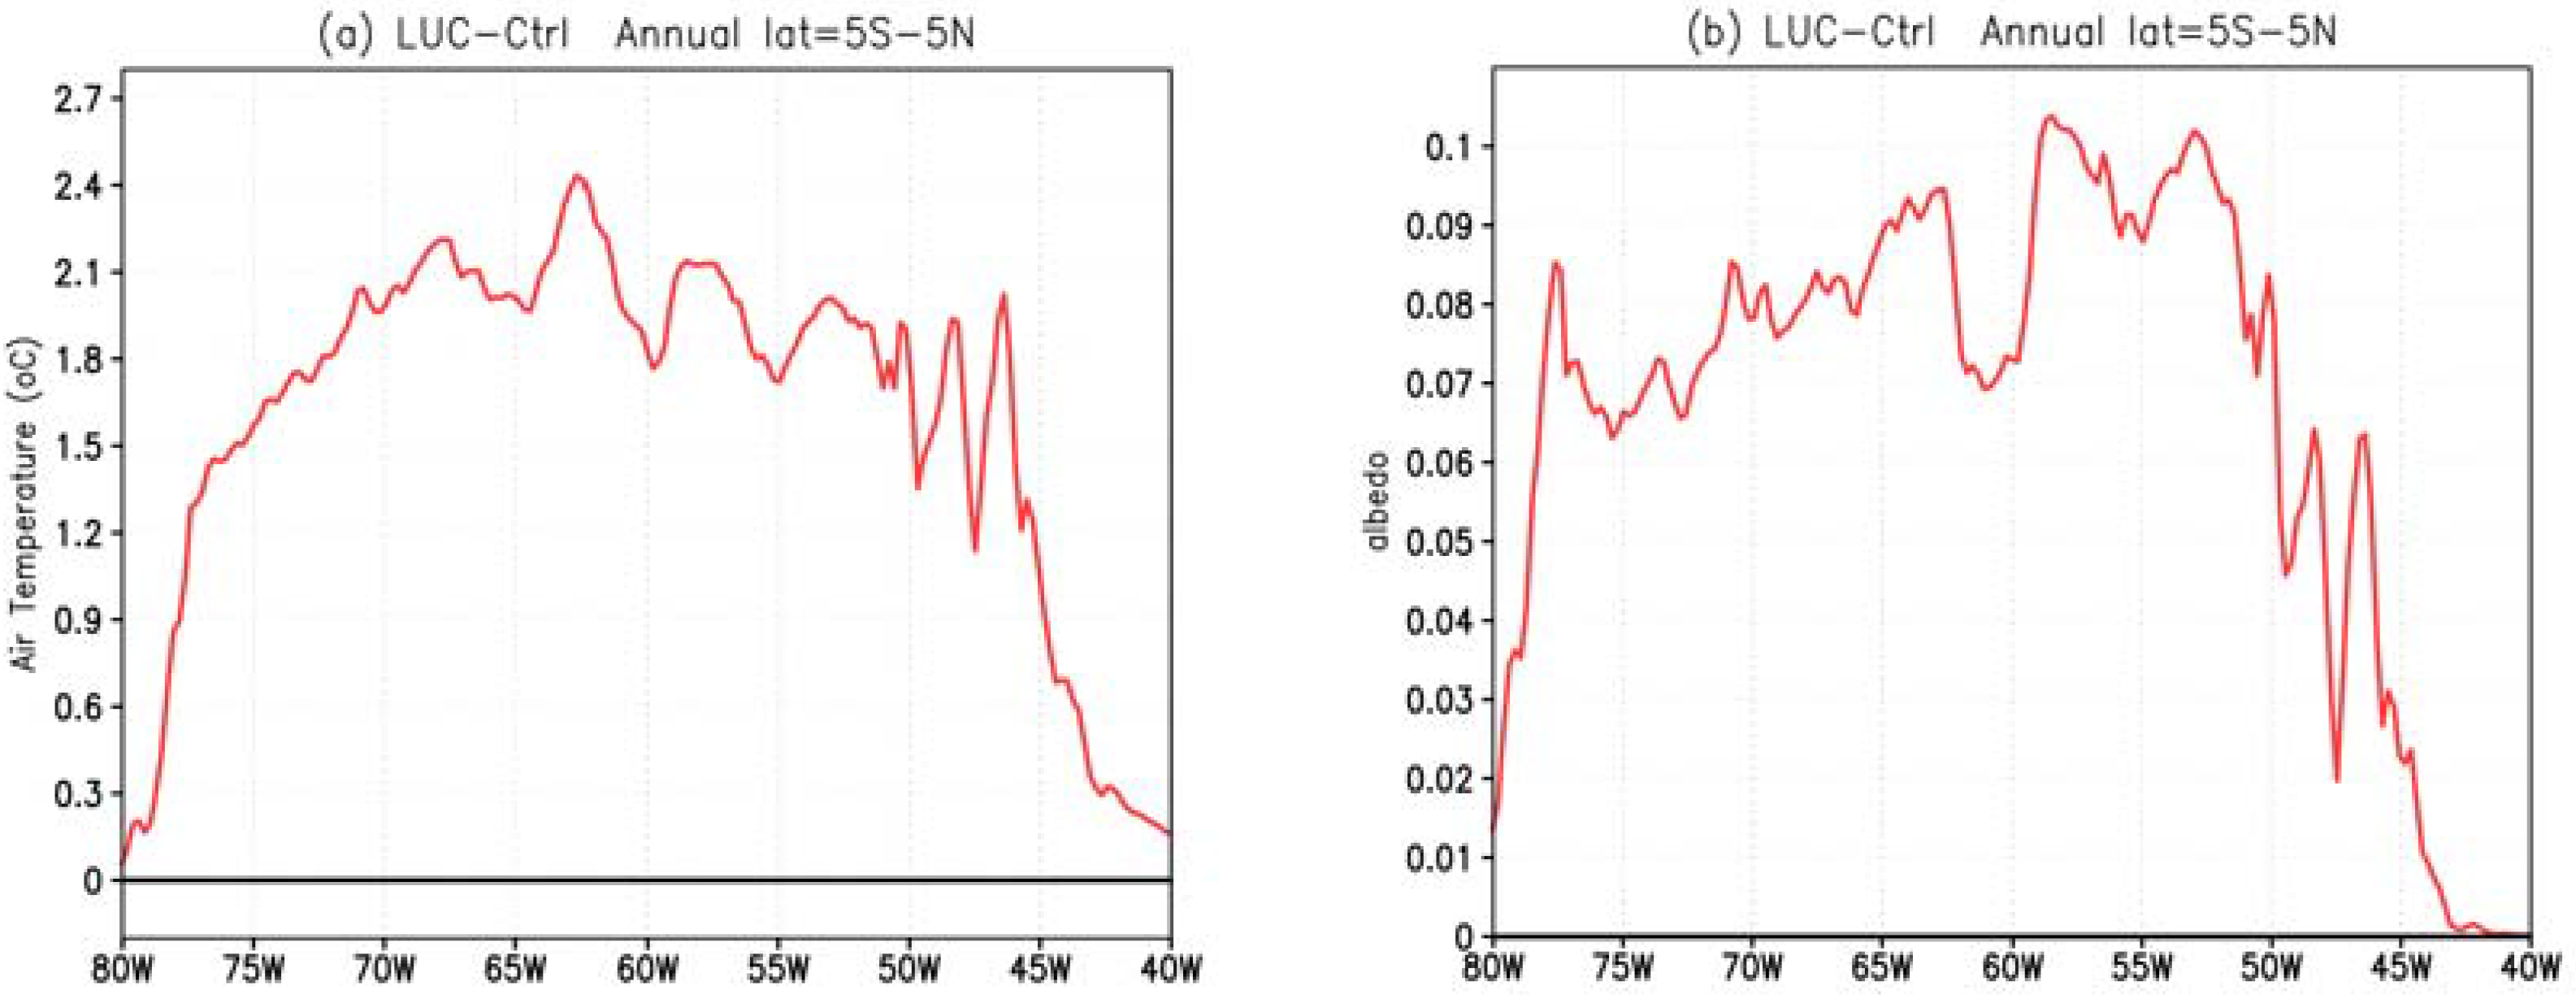
The Amazon basin is a highly vulnerable area to climate change due to modifications of the hydroclimatology of the region expected as a result of LUC. In order to understand how the change of broadleaf evergreen trees (tropical rain forest) to C3 grass over the AMZ impacts the water and energy budgets, two simulations with RegCM4, for the period 1979 to 2009, were analyzed. The climate change signal due to AMZ deforestation was evaluated by comparing the climatology of CTRL with LUC (land use change) experiments.
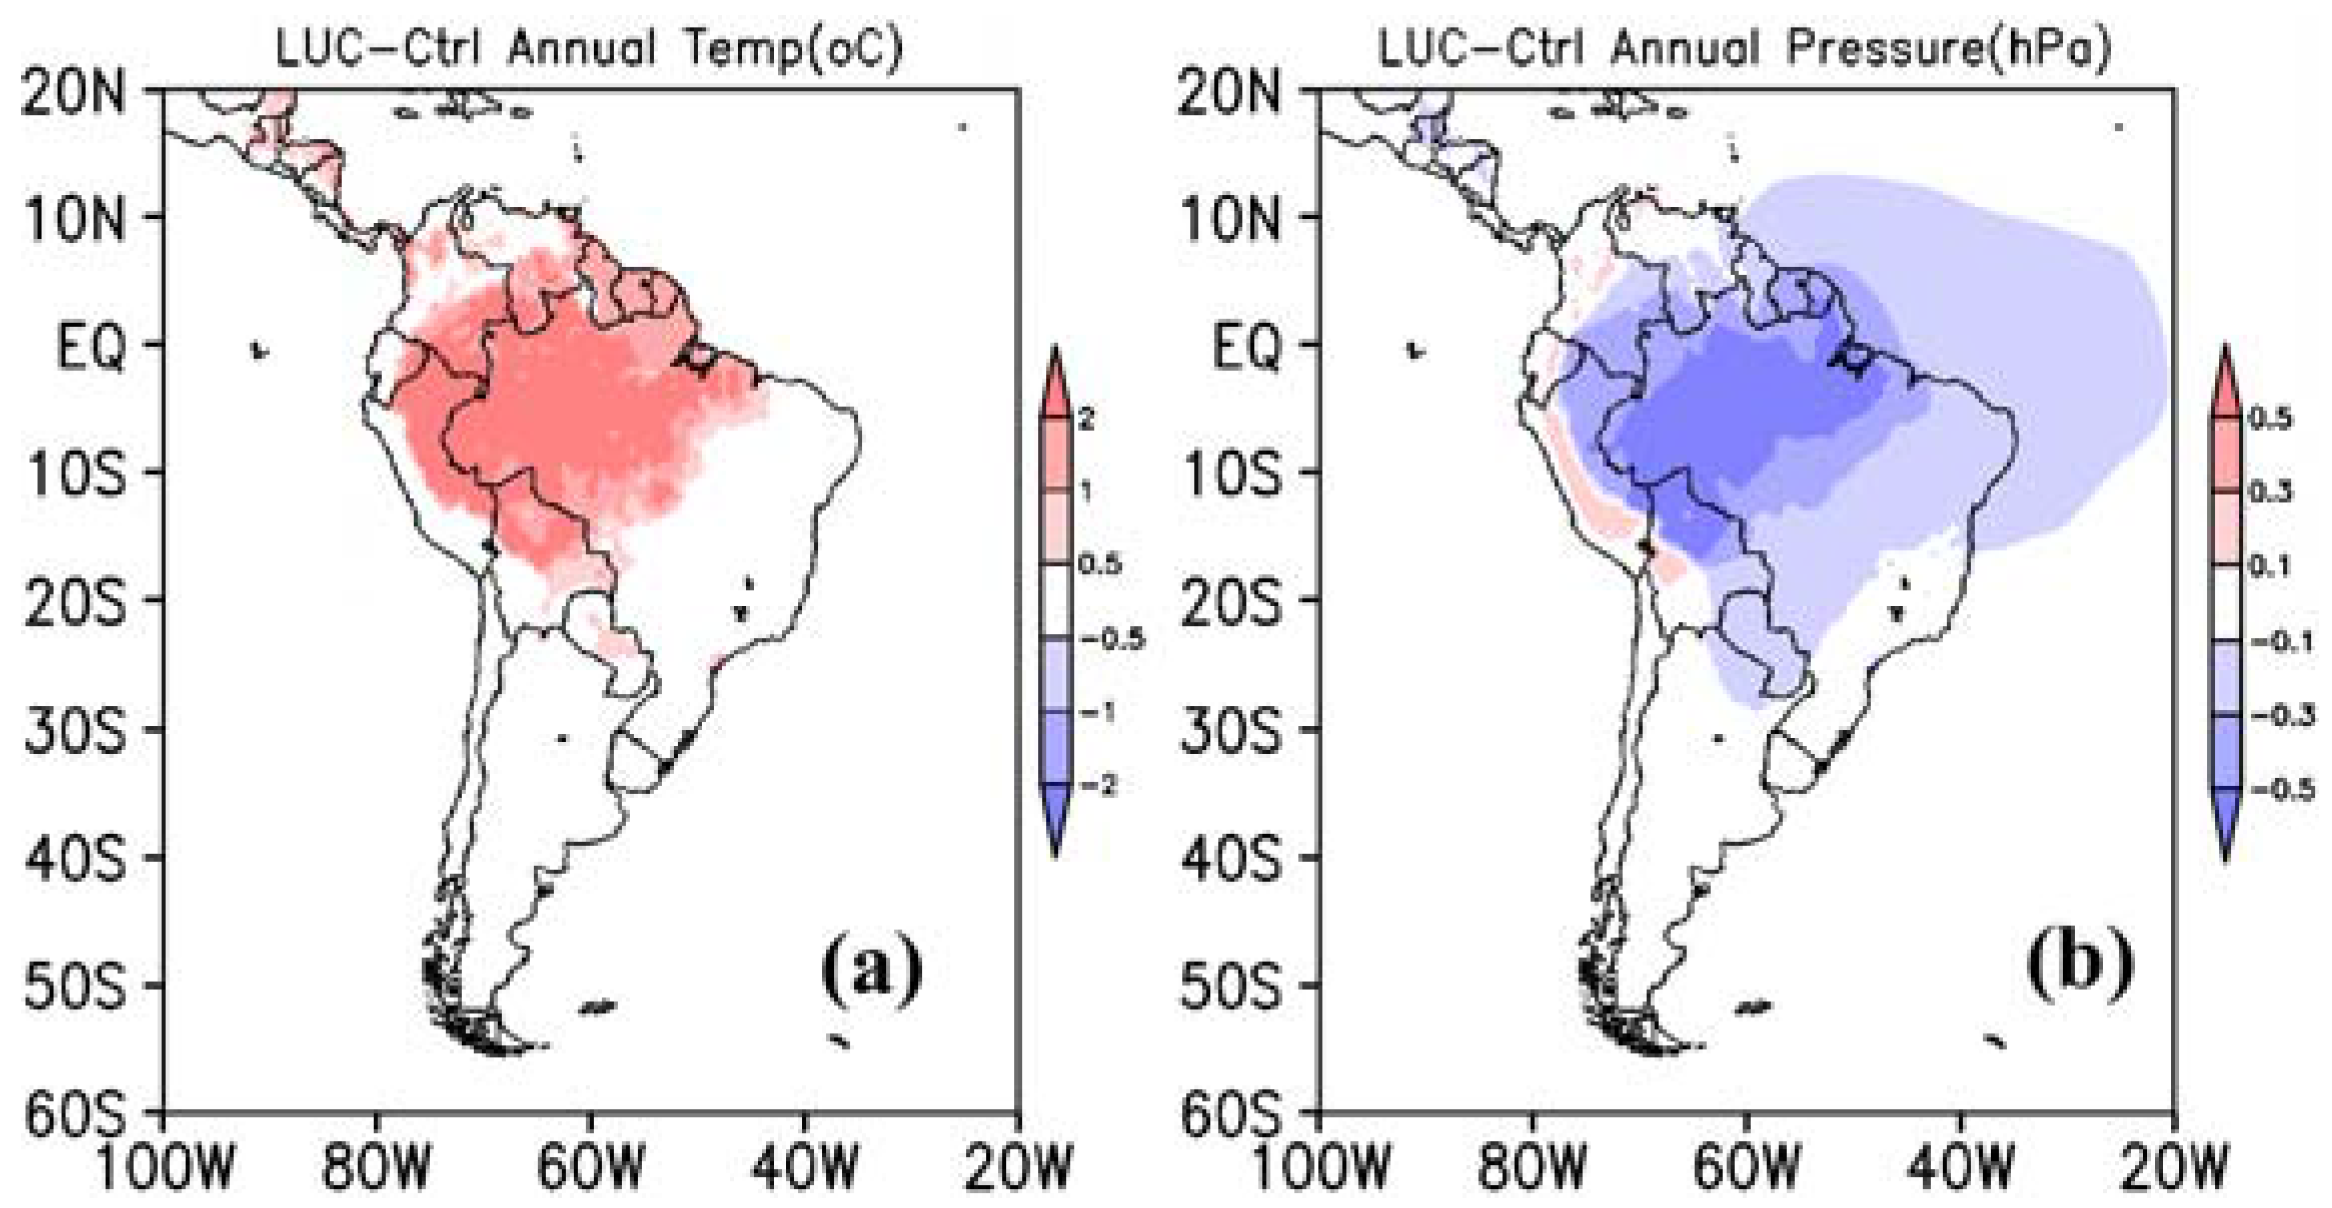
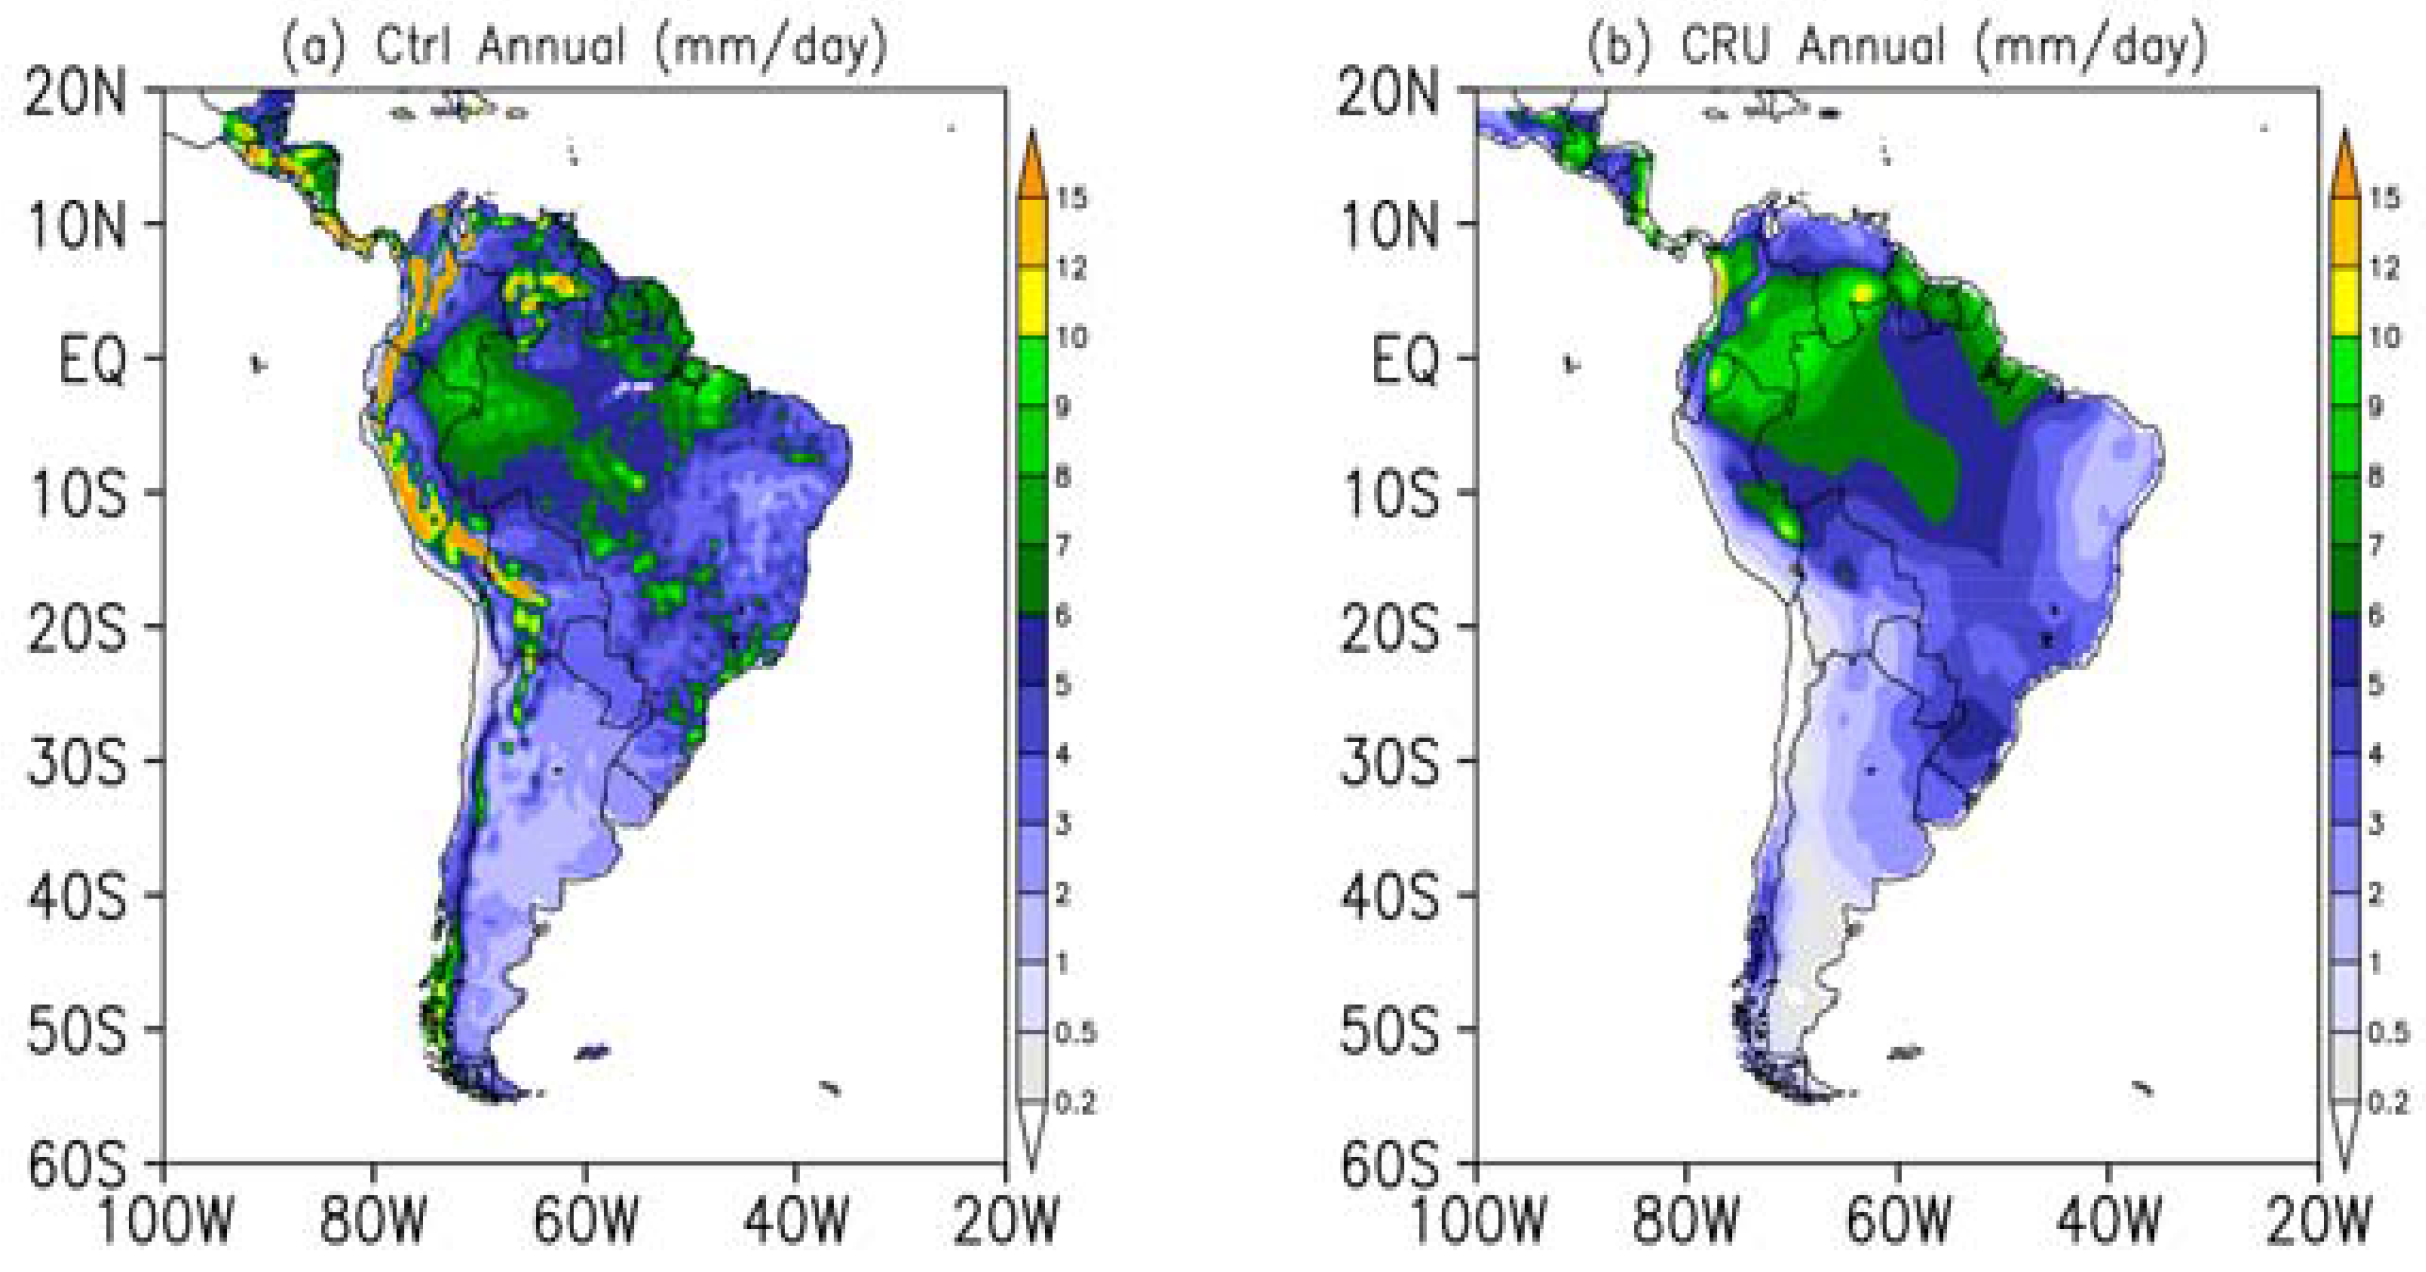
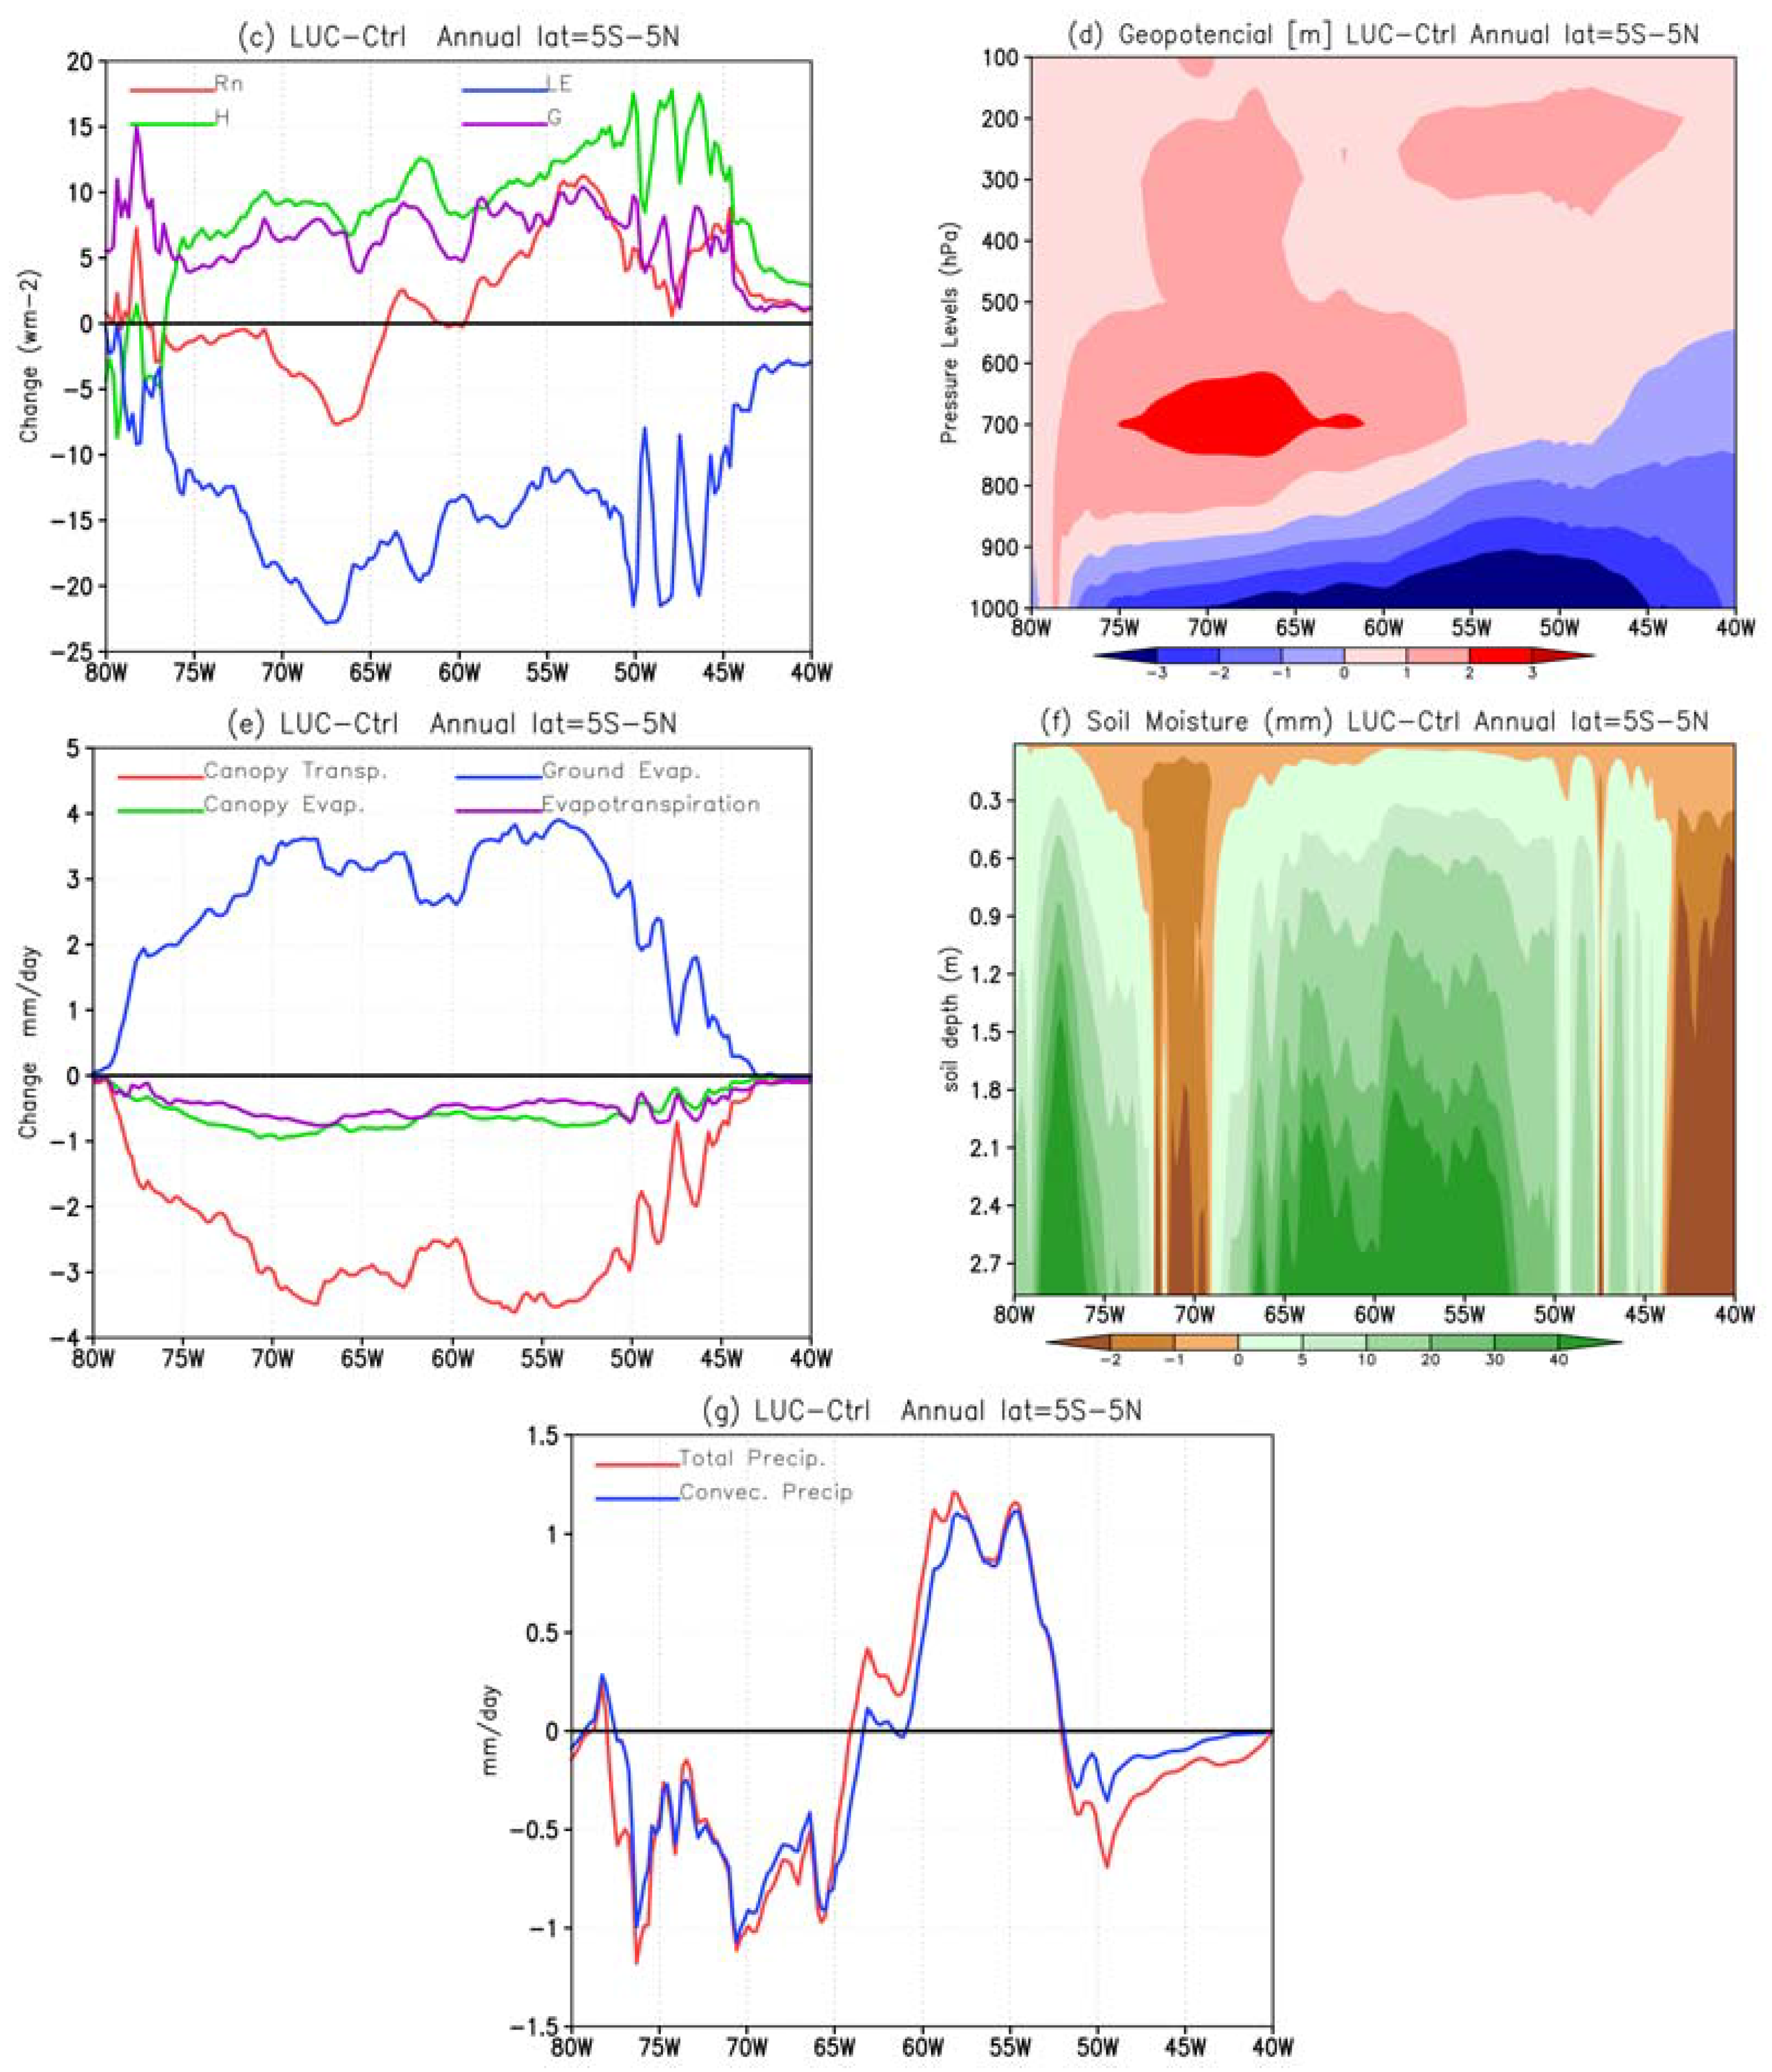
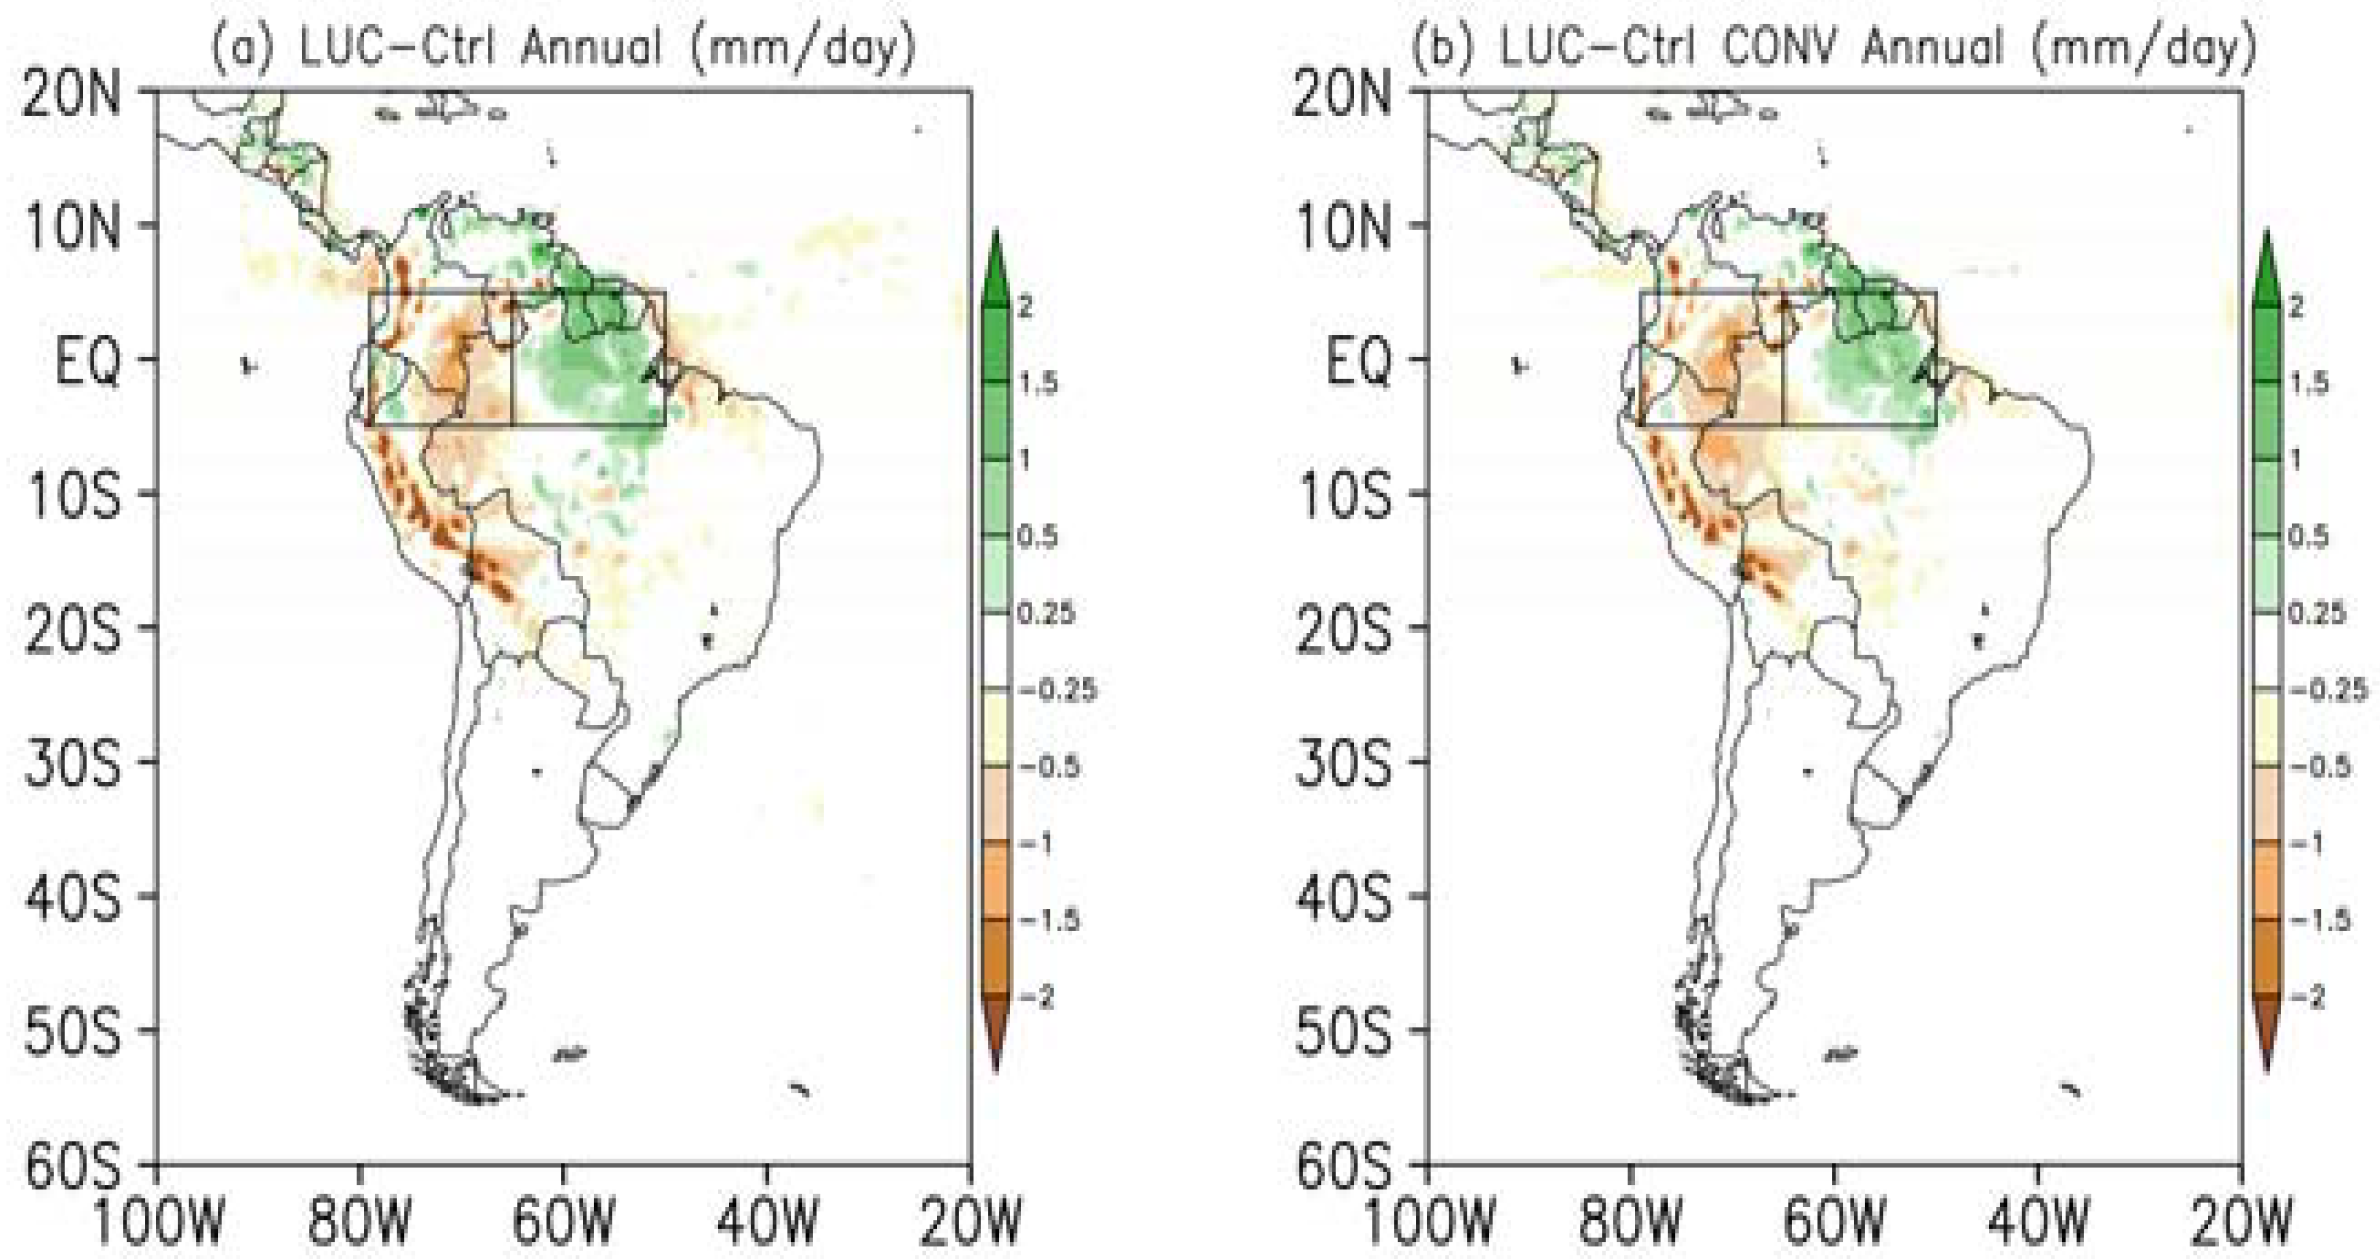
Numerical experiments indicate that AMZ deforestation is associated with an increase of about 2°C in air temperature and sensible heat fluxes, a decrease in latent heat flux, and a precipitation dipole pattern over tropical SA.
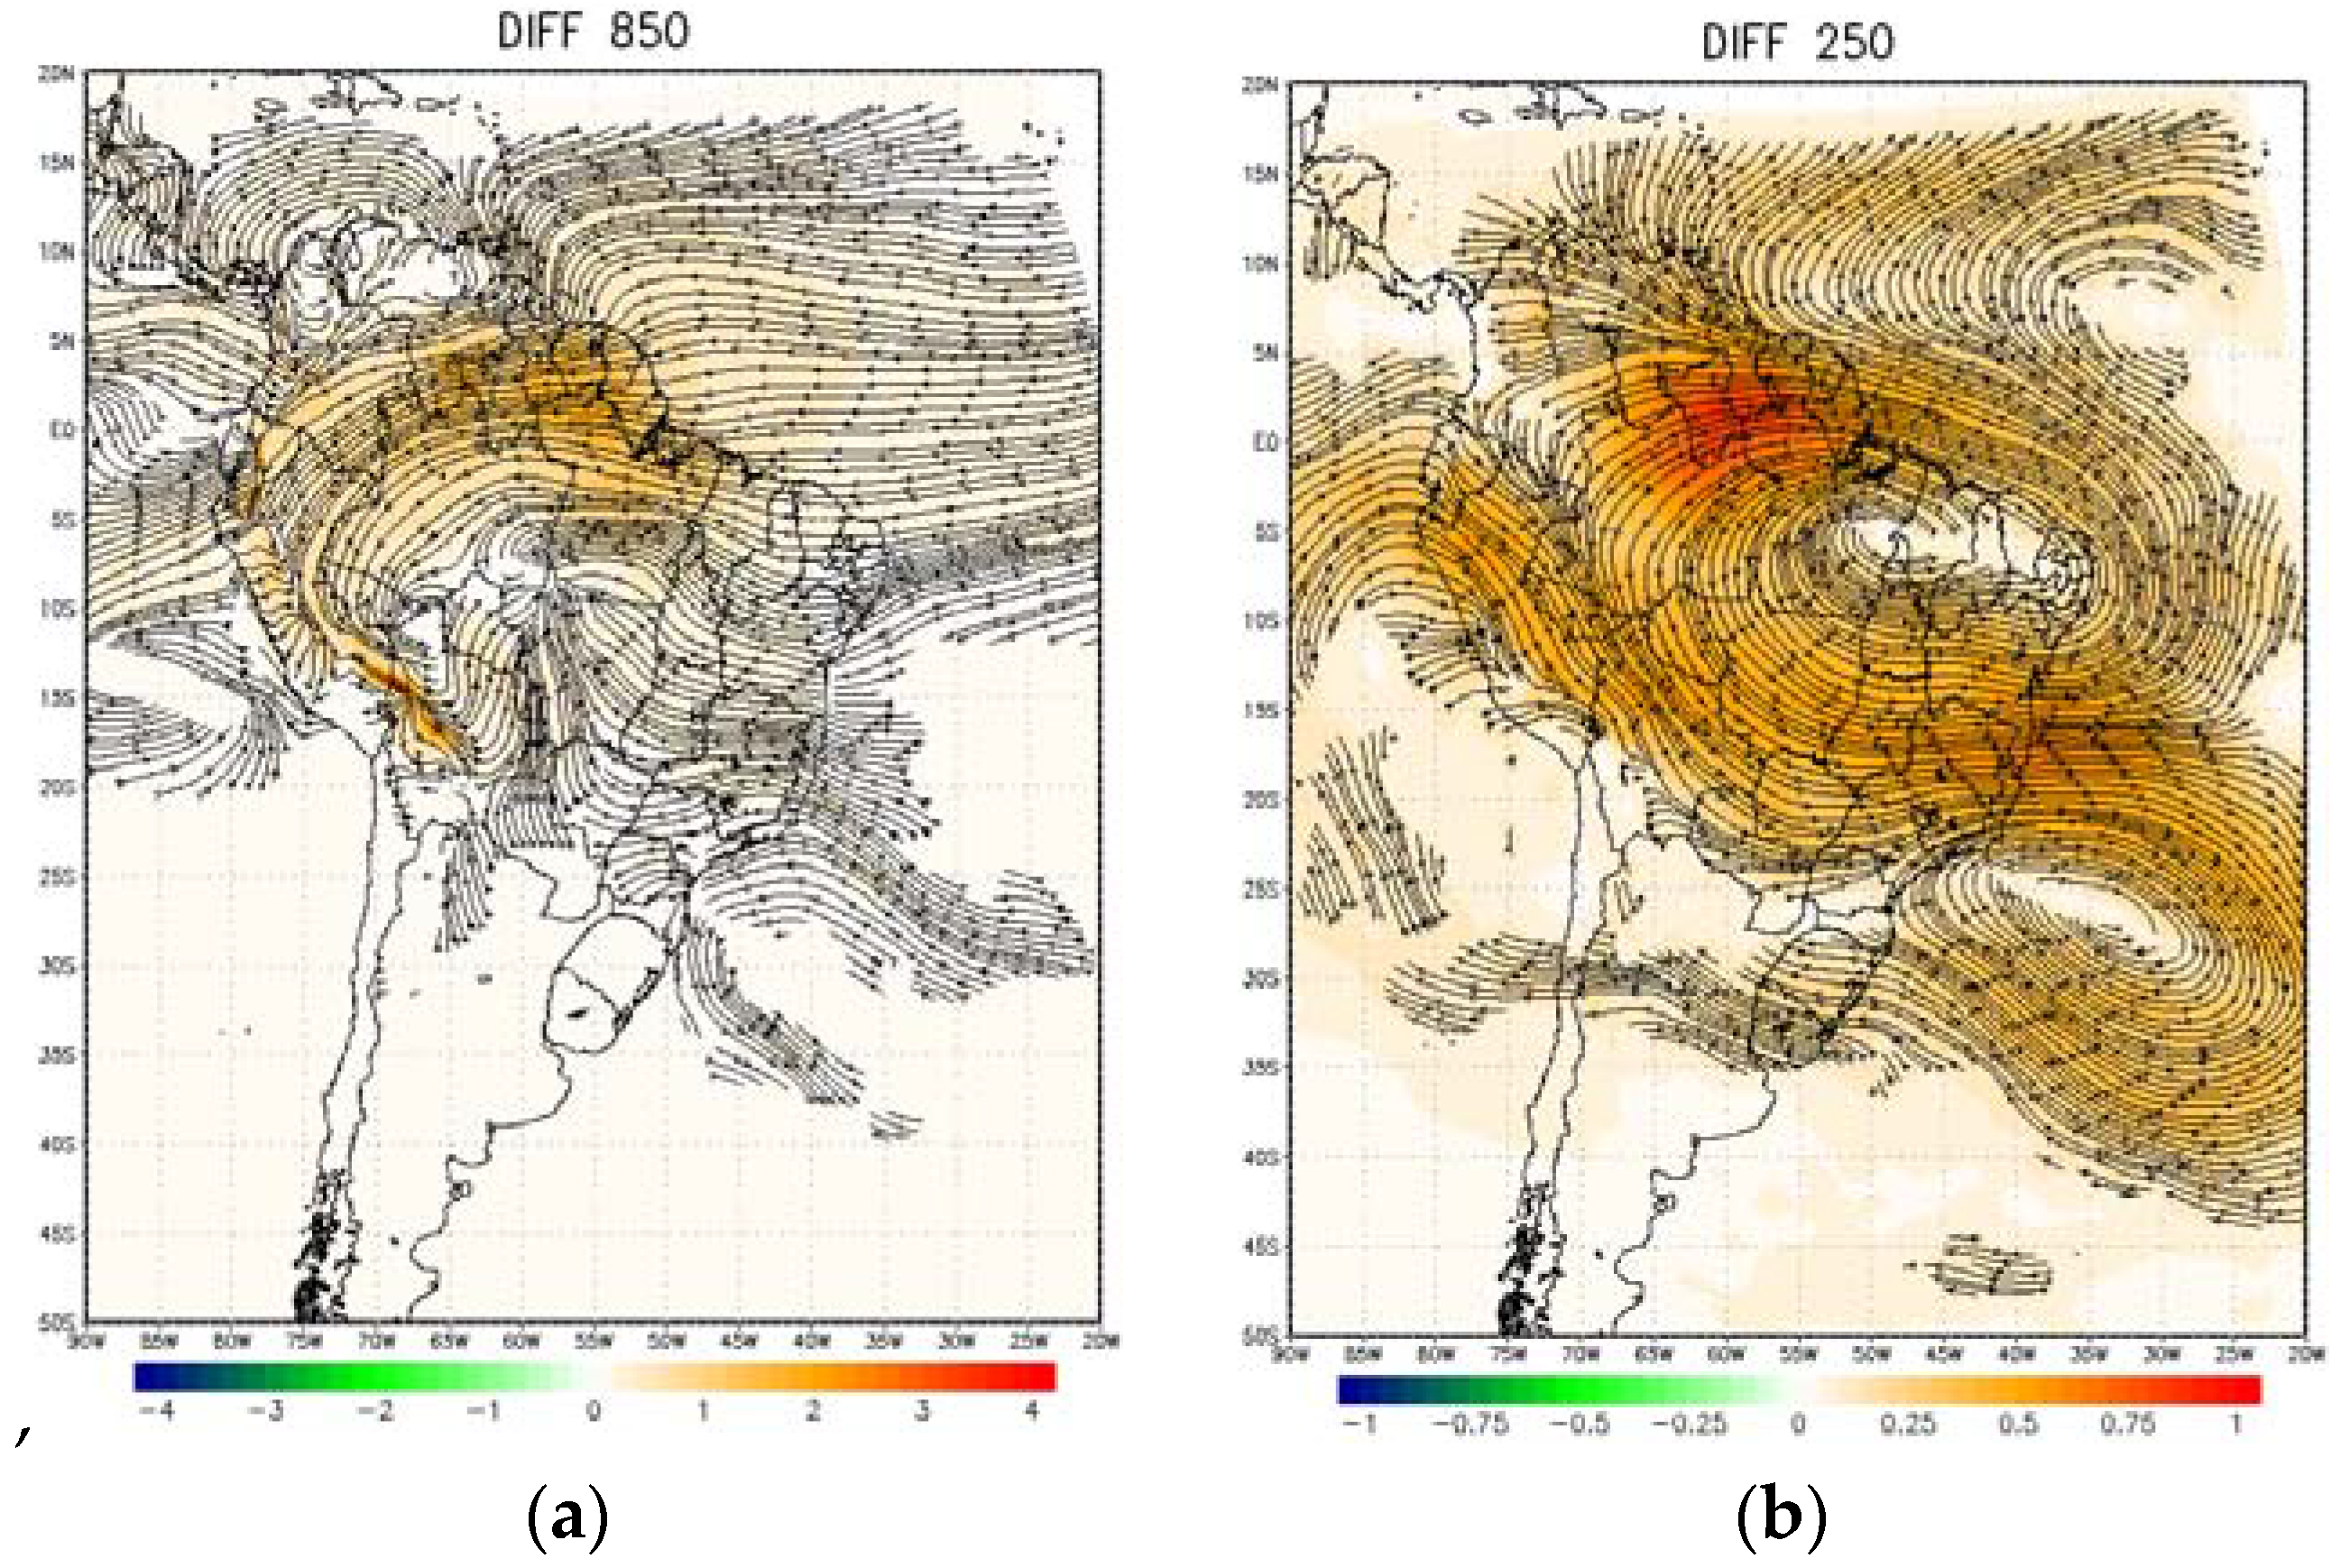
As a result of the change of the AMZ forest to grass, transpiration is reduced and hence less rainfall all over the region would be expected. However, the LUC experiment showed a dipole pattern of dry and wet conditions in the western and eastern Amazon basin, respectively. The water balance in the atmospheric column in the western AMZ presented higher values of evapotranspiration in the CTRL than the LUC experiment, explaining why precipitation is higher in the CTRL. This shows that land–atmosphere coupling is important to control the rainfall in the western side of the basin. In the eastern side, the higher values of moisture flux convergence, due the intensification of northeastern winds, is the main feature explaining the higher rainfall amount in the LUC experiment.
Under the deforestation scenario in the AMZ, the simulated dipole pattern in rainfall was driven by land–atmosphere feedback (evapotranspiration) in the west and large scale feedback (convergence of moisture flux) in the east side of the basin. These results are in agreement with an observational study [11] showing that the total amount of water that precipitates on large continental regions is supplied by local (evapotranspiration) and remote areas (advection from the surrounding areas). This work contributes to better understanding the effect on the climate over the Amazon basin under a scenario of deforestation. In a future work, it will be important to use a large number of members or different RCMs to better address the uncertainty in the simulated climate related to Amazon deforestation.

Acknowledgments

The authors thank the CRU and ERA-Interim for the data used in this study, the ICTP for providing the RegCM4, CNPq (249244/2013-6, 400065/2014-2 and 455990/2014-0), CAPES and FAPEMIG for the financial support. We also thank the reviewers for their constructive and helpful comments and suggestions.

Author Contributions

Marta Llopart carried out the simulations; Diego Oliveira de Souza performed the water balance analysis; Marta Llopart, Michelle Simões Reboita, Erika Coppola, Filippo Giorgi and Rosmeri Porfírio da Rocha analyzed the results and Marta Llopart, Michelle Simões Reboita, Rosmeri Porfírio da Rocha, Erika Coppola and Filippo Giorgi wrote the paper.

Conflicts of Interest

The authors declare no conflict of interest.

Abbreviations

The following abbreviations are used in this manuscript:
AMZAmazon
CONVconvective precipitation
CTRLsimulation with Amazon forest
ETevapotranspiration
Gsoil heat fluxes
Hsensible heat
LElatent heat
LUCsimulation change to the Amazon forest by grass
Pprecipitation
Rnnet surface radiation
qspecific humidity in air
Cmoisture convergence

References

  1. Programa das Nações Unidas para o Meio Ambiente (PNUMA); Organização do Tratado de Cooperação Amazônica (OTCA); Centro de Pesquisa da Universidad del Pacifico (CUIP). Perspectivas do Meio Ambiente na Amazônia—GeoAmazônia, Panamá-Brasil-Peru; United Nations Environment Program (UNEP): Panama City, Panama, 2008. (In Portuguese) [Google Scholar]
  2. Andersen, L.E.; Granger, C.W.J.; Reis, E.J.; Weinhold, D.; Wunder, S. The Dynamics of Deforestation and Economic Growth in the Brazilian Amazon; Cambridge University Press: Cambridge, UK, 2002. [Google Scholar]
  3. INPE. PRODES—Amazon Deforestation Database; INPE: São Jose dos Campos, Brazil, 2010; Available online: www.obt.inpe.br/prodes (accessed on 20 September 2017).
  4. Dias, L.C.P.; Pimenta, F.M.; Santos, A.B.; Costa, M.H.; Ladle, R.J. Patterns of land use, extensification and intensification of Brazilian agriculture. Glob. Chang. Biol. 2016, 22, 2887–2903. [Google Scholar] [CrossRef] [PubMed]
  5. Culf, A.D.; Esteves, J.L.; Marques Filho, A.d.O.; da Rocha, H.R. Radiation, temperature and humidity over forest and pasture in Amazonia. In Amazonian Deforestation and Climate; Gash, J.H.C., Ed.; John Wiley: New York, NY, USA, 1996; pp. 175–191. [Google Scholar]
  6. Eltahir, E.A.B. Role of vegetation in sustaining large-scale atmospheric circulations in the tropics. J. Geophys. Res. 1996, 101, 4255–4268. [Google Scholar] [CrossRef]
  7. Gash, J.H.C.; Nobre, C.A. Climatic effects of Amazonian deforestation: Some results from ABRACOS. Bull. Am. Meteorol. Soc. 1997, 78, 823–830. [Google Scholar] [CrossRef]
  8. Pearson, T.R.H.; Brown, S.; Murray, L.; Sidman, G. Greenhouse gas emissions from tropicalforest degradation: an underestimated source. Carbon Balance Manag. 2017, 12, 3–11. [Google Scholar] [CrossRef] [PubMed]
  9. Costa, M.H.; Foley, J.A. Combined effects of deforestation and doubled atmospheric CO2 concentrations on the climate of Amazonia. J. Clim. 2000, 13, 18–34. [Google Scholar] [CrossRef]
  10. Pielke, R.; Pitman, A.; Niyogi, D.; Mahmood, R.; Mcalpine, C.; Hossain, F.; Goldewijk, K.K.; Nair, U.; Betts, R.; Fall, S.; et al. Land use/land cover changes and climate: Modeling analysis and observational evidence. WIREs Clim. Chang. 2011, 2, 828–850. [Google Scholar] [CrossRef]
  11. Brubaker, K.L.; Entekhabi, D.; Eagleson, P.S. Estimation of continental precipitation recycling. J. Clim. 1993, 6, 1077–1089. [Google Scholar] [CrossRef]
  12. Llopart, M.; Coppola, E.; Giorgi, F.; Da Rocha, R.P.; Cuadra, S.V. Climate change impact on precipitation for the Amazon and La Plata basins. Clim. Chang. 2014, 125, 111–125. [Google Scholar] [CrossRef]
  13. Gimeno, L.; Drumond, A.; Nieto, R.; Trigo, R.M.; Stohl, A. On the origin of continental precipitation. Geophys. Res. Lett. 2010, 37. [Google Scholar] [CrossRef]
  14. Durán-Quesada, A.M.; Reboita, M.S.; Gimeno, L. Precipitation in tropical America and the associated sources of moisture: A short review. Hydrol. Sci. J. 2012, 57, 1–13. [Google Scholar] [CrossRef]
  15. Drumond, A.; Marengo, J.; Ambrizzi, T.; Nieto, R.; Moreira, L.; Gimeno, L. The role of Amazon basin moisture on the atmospheric branch of the hydrological cycle: A Lagrangian analysis. Hydrol. Earth Syst. Sci. 2014, 18, 2577–2598. [Google Scholar] [CrossRef] [Green Version]
  16. Eltahir, E.A.B.; Bras, R.L. Precipitation recycling in the Amazon basin. Q. J. R. Meteorol. Soc. 1994, 120, 861–880. [Google Scholar] [CrossRef]
  17. Nobre, C.A.; Sellers, P.J.; Shukla, J. Amazonian deforestation and regional climate change. J. Clim. 1991, 4, 957–988. [Google Scholar] [CrossRef]
  18. Werth, D.; Avissar, R. The local and global effects of Amazon deforestation. J. Geophys. Res. 2002, 107, 8087. [Google Scholar] [CrossRef]
  19. Brankovic, C.; Molteni, F.; Viterbo, P. GCM sensitivity experiments with locally modified land surface propertiesover tropical South America. Clim. Dyn. 2006, 26, 729–749. [Google Scholar] [CrossRef]
  20. Salazar, L.F.; Nobre, C.A.; Oyama, M.D. Climate change consequences on the biome distribution in tropical South America. Geophys. Res. Lett. 2007, 34, L09708. [Google Scholar] [CrossRef]
  21. Gandu, A.W.; Cohen, J.C.P.; de Souza, J.R.S. Simulation of deforestation in eastern Amazonia using a high-resolution model. Theor. Appl. Climatol. 2004, 78, 123–135. [Google Scholar] [CrossRef]
  22. Correia, F.W.S.; Alvalá, R.C.S.; Manzi, A.O. Modeling the impacts of land cover change in Amazonia: A regional climate model (RCM) simulation study. Theor. Appl. Climatol. 2008, 93, 225–244. [Google Scholar] [CrossRef]
  23. Salazar, L.F.; Nobre, C.A. Climate change and thresholds of biome shifts in Amazonia. Geophys. Res. Lett. 2010, 37, L17706. [Google Scholar] [CrossRef]
  24. Lejeune, Q.; Davin, E.L.; Guillod, B.P.; Seneviratne, S.I. Influence of Amazonian deforestation on the future evolution of regional surface fluxes, circulation, surface temperature and precipitation. Clim. Dyn. 2015, 44, 2769–2786. [Google Scholar] [CrossRef]
  25. Silva, M.E.S.; Pereira, G.; da Rocha, R.P. Local and remote climatic impacts due to land use degradation in the Amazon “Arco f Deforestation”. Theor. Appl. Climatol. 2016, 125, 609–623. [Google Scholar] [CrossRef]
  26. Giorgi, F.; Coppola, E.; Solmon, F.; Mariotti, L.; Sylla, M.B.; Bi, X.; Elguindi, N.; Diro, G.T.; Nair, V.; Giuliani, G.; et al. RegCM4: Model description and preliminary tests over multiple CORDEX domains. Clim. Res. 2012, 52, 7–29. [Google Scholar] [CrossRef]
  27. Pal, J.S.; Giorgi, F.; Bi, X.; Elguindi, N.; Solmon, F.; Rauscher, S.A.; Gao, X.; Francisco, R.; Zakey, A.; Winter, J.; et al. Regional climate modeling for the developing world: The ICTP RegCM3 and RegCNET. Bull. Am. Meteorol. Soc. 2007, 88, 1395–1409. [Google Scholar] [CrossRef]
  28. Grell, G.A. Prognostic evaluation of assumptions used by cumulus parameterizations. Mon. Weather Rev. 1993, 121, 764–787. [Google Scholar] [CrossRef]
  29. Emanuel, K.A.; Zivkovic-Rothman, M. Development and evaluation of a convection scheme for use in climate models. J. Atmos. Sci. 1999, 56, 1766–1782. [Google Scholar] [CrossRef]
  30. Oleson, K.W.; Lawrence, D.M.; Bonan, G.B.; Drewniak, B.; Huang, M.; Koven, C.D.; Levis, S.; Li, F.; Riley, W.J.; Subin, Z.M.; et al. Technical Description of Version 4.5 of the Community Land Model (CLM); NCAR Technical Note NCAR/TN-503+STR; National Center for Atmospheric Research: Boulder, CO, USA, 2013; 434 p. [Google Scholar]
  31. Dickinson, R.E.; Henderson-Sellers, A.; Kennedy, P.J. Biosphere–Atmosphere Transfer Scheme (BATS) Version 1e as Coupled to the NCAR Community Model; NCAR Technical Note NCAR/TN-3871STR; National Center for Atmospheric Research: Boulder, CO, USA, 1993; 72 p. [Google Scholar]
  32. Loveland, T.R.; Reed, B.C.; Brown, J.F.; Ohlen, D.O.; Zhu, Z.; Yang, L.; Merchant, J.W. Development of a global land cover characteristics database and IGBP DISCover from 1 km AVHRR data. Int. J. Remote Sens. 2000, 21, 1303–1365. [Google Scholar] [CrossRef]
  33. Giorgi, F.; Jones, C.; Asrar, G.R. Addressing climate information needs at the regional level: The CORDEX framework. WMO Bull. 2009, 58, 175–183. [Google Scholar]
  34. Dee, D.P.; Uppala, S.; Simmons, A.; Berrisford, P.; Poli, P.; Kobayashi, S.; Andrae, U.M.; Balmaseda, A.; Balsamo, G.; Bauer, P.; et al. The ERA-Interim reanalysis: Configuration and performance of the data assimilation system. Q. J. R. Meteorol. Soc. 2011, 137, 553–597. [Google Scholar] [CrossRef]
  35. Reboita, M.S.; Fernandez, J.P.R.; Llopart, M.; da Rocha, R.P.; Pampuch, L.; Cruz, F.T. Assessment of RegCM4.3 over the CORDEX South America Domain: Sensitivity Analysis to Physical Parameterization Scheme. Clim. Res. 2014, 60, 215–234. [Google Scholar] [CrossRef]
  36. Llopart, M.; da Rocha, R.P.; Reboita, M.S.; Cuadra, S.V. Sensitivity of simulated South America climate to the land surface schemes in RegCM4. Clim. Dyn. 2017, 49, 3975. [Google Scholar] [CrossRef]
  37. Brohan, P.; Kennedy, J.J.; Harris, I.; Tett, S.F.B.; Jones, P.D. Uncertainty estimates in regional and global observed temperature changes: A new dataset from 1850. J. Geophys. Res. 2006, 111, D12106. [Google Scholar] [CrossRef]
  38. Hartmann, D.L. Global Physical Climatology; Academic Press: New York, NY, USA, 1994. [Google Scholar]
  39. Nascimento, M.G.; herdies, D.L.; Souza, D.O. The South American Water Balance: The Influence of Low-Level Jets. J. Clim. 2016, 39, 1429–1449. [Google Scholar] [CrossRef]
Figure 1. (a) Green areas represent the plant functional type of tropical rain forest that was replaced by C3 grass in the LUC simulation and the two horizontal black lines represent the cross section (5° S–5° N) selected for deeper analysis; (b) South America simulation domain and topography (m). Rectangles in (b) indicate the western (left) and eastern (right) sides of the AMZ.
Water 10 00149 g001
Figure 2. Annual mean (1980–2009) of precipitation (mm day−1) from: (a) CTRL experiment and (b) CRU. Annual mean (1980–2009) of temperature (°C) from: (c) CTRL experiment and (d) CRU.
Water 10 00149 g002aWater 10 00149 g002b
Figure 3. (a) Air temperature change, in °C; and (b) surface pressure change, in hPa, for LUC minus CRTL simulation.
Water 10 00149 g003
Figure 4. Cross section (5° S–5° N): (a) change in air temperature (°C); (b) change in albedo; (c) change in the energy budget components (w m−2): net radiation (red line), sensible heat flux (green line), latent heat flux (blue line) and soil heat flux (purple line); (d) change in geopotential height (m); (e) change in the evapotranspiration components (mm day−1): ground evaporation in blue, canopy transpiration in red, canopy evaporation in green and total evapotranspiration in purple; (f) change in soil moisture (mm) and (g) change in precipitation (mm day−1): total precipitation in red and convective precipitation in blue.
Water 10 00149 g004aWater 10 00149 g004b
Figure 5. Precipitation change (LUC minus CTRL simulation) in mm day−1 for (a) total precipitation and (b) convective precipitation. Rectangles indicate the western (left) and eastern (right) sides of Amazon.
Water 10 00149 g005
Figure 6. Difference (LUC minus CTRL) of annual mean (1980–2009) wind (streamlines and intensity in shaded according bottom bars) in m s−1, (a) at 850 hPa (b) at 250 hPa.
Water 10 00149 g006
Table 1. Annual mean (1980–2009) of water balance components: precipitation (P, mm day−1), evapotranspiration (ET, mm day−1) and convergence of moisture flux (C, mm day−1), calculated for western and eastern AMZ boxes showed in Figure 5.
Water Balance ComponentsWestern AMZ (Decrease of Precipitation)Eastern AMZ (Increase of Precipitation)
CTRLLUCLUC-CTRLCTRLLUCLUC-CTRL
P7.316.73−0.586.056.520.47
ET4.203.70−0.504.604.00−0.60
C−2.20−2.40−0.20−2.10−3.20−1.10

