Abstract
The Atoyac River crosses the metropolitan area of Puebla-Tlaxcala in Mexico and presents a state of pollution that has been scarcely studied. In 2016, the water quality of the river was evaluated based on physicochemical and bacteriological parameters, under the guidelines established for the Maximum Permissible Limit (MPL) for Aquatic Life Protection (ALP) and Agricultural Irrigation (AI). The sampling sites were the Covadonga Dam, the Echeverría Dam, and an irrigation canal. Water from wells and a spring in the Emilio Portes Gil (EPG) population that uses Atoyac water for agricultural irrigation was also analyzed. The data obtained from the river were compared with the 2011 data published in the declaration of classification of Atoyac and Xochiac or Hueyapan and its tributaries. There was a notable increase in hemical oxygen demand (COD) (49%) and in heavy metals with varying percentages. The anoxic condition of the river (mean 1.47 mg of O2/L) with large populations of coliform bacteria was demonstrated, 11 pathogenic members of the Enterobacteriaceae were found, and high organic pollution concentrations were shown, particularly during droughts. Irrigation and well water was contaminated with fecal bacteria (104–549 NMP/100 mL), which included pathogens.
1. Introduction
The pollution of surface water bodies is an important environmental problem throughout the world [1]. Mexico is not an exception [2,3,4]. Many of the central and western rivers of the country are severely affected, such as the Balsas River [5,6], one of the most important rivers in Mexico due to the extent of its watershed (6% of the national territory). The Balsas hydrological region is composed of 15 watersheds, and between these is the Alto Atoyac watershed where the Atoyac River is located. The Alto Atoyac watershed extends from where the draining of the Atoyac River is born until the “Manuel Ávila Camacho” Dam (Valsequillo). It has a contribution area of 4135.52 km2 and includes part of the states of Puebla (22 municipalities) and Tlaxcala (47 municipalities) [7,8]. At present, this hydrological region presents negative availability (water deficit to meet the use authorized by the federal government) and significant deterioration in the quality of the surface water [5,8].
The Atoyac River degradation is historical and complex. Several researchers have studied the Atoyac River water as a reference for the economic, political, and social development of the Puebla city in different periods of its history [9,10,11,12,13,14]. In the 1970s, with the installation of factories related to petrochemicals, metals, and automotive joining the existing textile industry, the Atoyac River degradation increased in the 1990s by demographic expansion and economic development in the region [8,15,16].
The human pressure that is generated over the Atoyac River is very strong, as the river crosses the fourth most populated metropolitan area (ZMPT) of Mexico (~3 million inhabitants), and multiple heterogeneous activities (agricultural, industrial, and residential) within the river [8,17,18] that contribute to the complexity and quantity of pollution that goes into the river are carried out.
In the upper area of the Atoyac Basin (before entering the city of Puebla), the river receives noxious substances (volatile organic compounds, heavy metals, and so on) from the industries of industrial corridors, petrochemical complex, and service works [19]. Furthermore, it receives large amounts of bacterial fecal coliforms through the poorly treated municipal discharges [8,20], and chemical pollutants of pesticides and fertilizers [8,18,21,22]. The pollution coming from the Zahuapan River (a tributary of the Atoyac River)—with approximately 59% of the inhabitants of Tlaxcala living in its area of influence—also adds to the regular and diffuse pollution of the Atoyac River [3].
The pollution increases when the river enters the city of Puebla [8,21,22], where the most populated towns of the Federal Entity (including the capital) are located, and 14 industrial zones that include factories of different spheres (automotive, textile, metalworking, metallurgical, pharmachemical, and food industries among others) [21,22] discharge their wastewater into the different tributaries (Atenco, San Francisco, Zapatero, Rabanillo, and Alseseca) or directly into the Atoyac River. Three treatment plants from Puebla city also discharge their wastewater into this area (Figure 1). As a result, the Atoyac River is among the most polluted currents in the country, with more than 50 pollutants detected in the water, including toxic compounds and carcinogenic elements for humans [8,16,17,18,21,22,23].
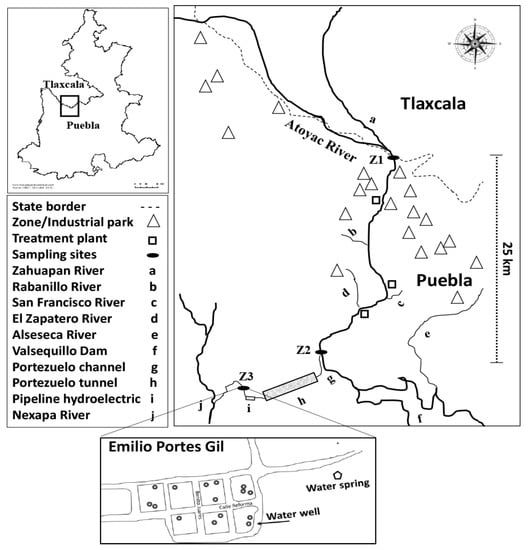
Figure 1.
The study area map. Z1: Covadonga Dam, Z2: Echeverría Dam, and Z3: irrigation channel in EPG.
In order to achieve the required water quality, the legal technical instrument “Declaratoria de clasificación del Atoyac y Xochiac o Hueyepan, y sus afluentes (Declaration of classification of Atoyac and Xochiac or Hueyepan, and its affluents)” was issued in 2011 [22]. This declaration contains the parameters that pollutant discharges must comply with, the deadlines and water quality goals of the river. Studies after this declaration was issued show persistence in the pollution and high water toxicity, as was pointed out by Arellano-Aguilar (2015) [24] has been changed, please confirm, Martínez-Tavera et al. (2017) [25] has been changed, please confirm, and the Red Nacional de Monitoreo (RNM) (National Monitoring Network) 2012–2015 [6].
Many agricultural populations near the Puebla urban area, such as the EPG (Municipality of Ocoyucan), depend on contaminated water from the Atoyac River for agricultural irrigation [26] because they do not have an alternative source of water. The potable water service is limited [27] and for this reason, the population illegally built wells in their houses, close to irrigation canals.
For the above, in this study, we evaluated the spatial-temporal dynamics of several parameters (Coliformes totals, Fecal Coliforms, Aerobic Mesophilic Bacteria, pH, T (°C), O2, COD BDO5, Turbidity, Color, Al, Fe, Ni, Zn, Pb, Co, Cd, Cu, Cr) in the Atoyac River, Puebla city during 2016. We compared these data to 2011 data (Declaratoria de clasificación del Atoyac y Xochiac o Hueyapan, y sus afluentes) [22] in order to determine the change in the pollution status of these parameters over time. Additionally, we analyzed the water quality for the purposes of agricultural and domestic uses in the EPG.
2. Study Area
The Atoyac River belongs to the Alto Atoyac watershed and the Balsas River sub-watershed [7]. It originates from the Iztaccíhuatl volcano thaw in the state of Puebla, at an altitude of 3250 m above sea level. It has a length of 84.97 km, a cross section between 15 and 60 m, and a depth of 1–3 m [25]. In its descent, the current passes through the state of Puebla (~30 km of travel), Tlaxcala (~22 km), and again through Puebla (~32 km) where it is accumulated in the Valsequillo dam [22,25]. The climate of the region is temperate sub-humid with rain in summer [20]. The average annual temperature and rainfall are 17.2 °C and 969.1 mm, respectively, and the rainfall increases between June and October [20].
The area studied has an approximate length of 25 km. It starts in the northwest region of the Puebla municipality, in the Covadonga Dam (Z1) (19°08′15.3″ N and 098°13′27.6″ W), continues through the Echeverría Dam (Z2) (19°01′07.6″ N and 098°13′58.0″ W), and ends in the irrigation channel located in the town of EPG (Z3). The neighboring municipalities are Puebla to the east, and Cuatlancingo, San Andrés Cholula, and Ocoyucan to the west. The Atoyac River, in this area, receives discharges from three macro-plants in the Puebla municipality (El Conde, San Francisco, and Atoyac Sur), the tributaries of the Atenco and Rabanillo streams that transport discharges from textile and spinning industries, and the San Francisco and Zapatero Rivers (Figure 1). In its margins, there are 14 industrial zones that discharge their waters directly and indirectly into the channel [21].
The EPG town belongs to the Ocoyucan municipality. It is an ejidal colony (parceled lands that cannot be sold) of 522 inhabitants. Its main economic activity is agriculture [26]. The Atoyac River water flows through a channel (6.39 km) and a tunnel (4.72 km) to the Portezuelo hydroelectric plant, where it generates electricity and then joins the EPG main irrigation channel (18°55′32.4″ N 098°20′40.4″ W) and finally discharges into the Nexapa River [28]. Most homes (>90%) have piped water [26] from a spring, and as the supply is irregular, they have wells (Figure 1).
3. Materials and Methods
During the year 2016, samplings were carried out in the rainy season (June, August, and October) and drought (May and November) in three zones: The Covadonga Dam (Z1), the Echeverría Dam (Z2), and the irrigation canal in E Portes Gil (Z3) (Figure 1). The total samples collected per parameter in the Atoyac River were 39 (three samples were collected per zone, per parameter, per month. The total number of samples was not 45 because on two occasions they were not collected due to landslides in the road).
The methodology used for the water analyses was based on APHA-AWWA standard methods [29]. In the field, the surface water temperature, pH (Orion model 1230), and dissolved oxygen (kit Hanna Instruments HI 3810) were measured in triplicate. Water samples were collected in triplicate for the analysis of parameters: COD, BOD5, bacteria, turbidity (TURB), color, and heavy metals (Al, Fe, Cu, Pb, Cd, Zn, Co, Ni, and Cr). Borosilicate glass bottles with an outward edge and a 300 mL ground glass stop were used for BOD5, COD, turbidity, and color, 500 mL wide neck polyethylene bottles were used for the heavy metals (preserving the sample with 10% nitric acid), and sterile plastic bottles of 100 mL were used for the samples of bacteria, which were kept at a temperature of 4 °C and in darkness until their transfer to the laboratory. All samples, except the heavy metals, which were analyzed in the sampling month, were processed on the same day.
The analyses were carried out in the Laboratory of Soil Microbiology, Environmental Chemistry, and Agricultural Sciences of the Benemérita Autonomous University of Puebla (BUAP). The COD was determined with a Spectroquant kit (range of 25–1500 mg/L) and a Nova 60 Spectroquant Merck photometer, which also measured turbidity and color. For the BOD5 determination was used an OxiTop Control OC 100 to measure oxygen consumption on the fifth day. The heavy metal analysis was carried out using an atomic absorption spectrophotometer of a double ray flame “Varian 55B”, a hydride generator (VGA 77), and a coupled digester stove (Mars press) as indicated by NMX-AA-051-SCFI-2001 [30]. The detection and coliform bacteria count was carried out using the most likely number (MLN, or NMP by its initials in Spanish) in multiple tubes according to the NMX-AA-042-SCFI-2015 method [31]. In the presumptive and confirmatory Total Coliforms (TC) test, the lactose culture medium and Brilliant Green Bile were used; for the confirmatory Fecal Coliforms (FC) test, the EC-MUG was used as selective medium. In the aerobic mesophilic bacteria counting, the Trypticase Soy Agar (TSA) cultivation medium was used. Bacteria taxonomic identification was carried out via biochemical tests for the API 20E BiomerieuxR system.
In the EPG locality, the physical-chemical and bacteriological parameters previously mentioned, except for the BOD5 and COD, were determined in the collected water samples in water wells (15) and a spring (1). The well selection was random (three wells per month).
In the study, 1230 physical-chemical analyses (samples of the river, wells, and spring) and 555 analyses corresponding to the bacteria study (TC, FC, mesophilic bacteria, API, and complementary tests) were carried out. One inquiry per house (110 total) was applied to gather information on water supply and sanitary measures.
The Kruskal–Wallis test and Tamhane’s multiple comparison test were applied to the data obtained. In addition, principal component analysis (PCA) and a correlation matrix (Kendall coefficient) were carried out using the Statgraphics Centuriun software and IBM SPSS statistics. The values obtained were compared with the Declaration of Atoyac and Xochiac or Hueyapan classification, and its tributaries [25] based on the Mexican Standards (NOMs) CE-CCA-001/89 [32], NOM-127-SSA1-94-Modification (2000) [33], and NOM 001-SEMARNAT-1996 [34]. Monthly rainfall data were obtained from the National Meteorological Service website [35], the National Meteorological Service (NMS), 2016), and data from BOD5, COD, and FC from the RNM-CONAGUA (2016) [36]. To compare between the official Declaration records of the Rio Atoyac (2011) and the present study (2016), the declaration data were expressed in mg/L.
4. Results
4.1. River Pollution during the Dry-Rainy Season
The pollution indicators measured in the Atoyac River showed marked variations between the drought and rain seasons (Figure 2 and Table 1). The organic contamination measured through the COD doubled in the dry season (260.60 mg/L) and achieved values that classify the water body as “highly contaminated” (COD > 200 mg/L), according to the Classification Scale of Water Quality (ECCA, by its initials in Spanish) from CONAGUA (National Water Commission) [37]. The other two pollution indicators—BOD5 and Total Coliforms (TC)—also registered an increase in drought by around 50%. Principal component analysis (PCA) (Figure 3) showed a positive relationship between these three indicators (COD, BOD5, and TC) as well as an inverse relationship between these, with respect to the precipitation variable.
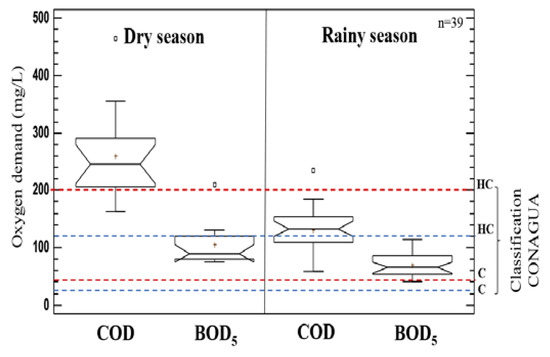
Figure 2.
The average values of COD and BOD5 in the Atoyac River, during the dry and rainy seasons. * HC = Highly Contaminated; C = Contaminated. Limits for COD are in red lines, and those for BOD5 are in blue lines.

Table 1.
The pollution indicators measured in the Atoyac River, showed market variations between drought and rain.
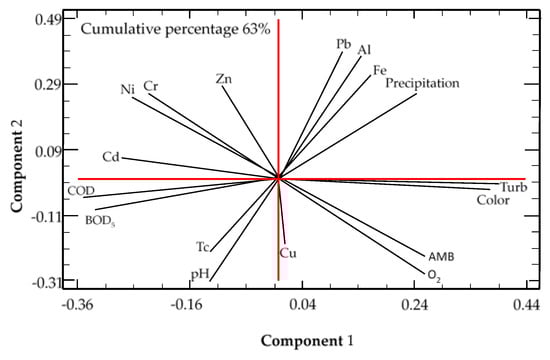
Figure 3.
Principal component analysis (PCA) considering the physical, chemical, and bacteriologic variables of the Atoyac River and level of the precipitation in 2016.
A marked seasonality was also observed with other physical-chemical parameters. More murky, colored, and relatively more oxygenated waters were recorded in the rainy season (Table 2), at which time the river was more abundant and turbulent. Three variables (color, turbidity, and O2) were positively associated, but only turbidity and color registered a significant correlation. Although O2 concentrations in surface waters showed relatively higher values during the rainy season (up to 3 mg of O2/L), the average was lower than 2 mg/L and is below the maximum permissible limit (MPL) for the Aquatic Life Protection (ALP) (5 mg/L) according to EC-CCA-001/89 [32]. Aerobic mesophilic bacteria (AMB) correlated positively with turbidity, color, and O2, coinciding with the peak rainfall (Table 2). The Atoyac River water was characterized by its alkalinity (pH~8) and temperatures that fluctuate more in the dry season (around 20 °C). A positive correlation was recorded between the pH and TC values.
Table 2.
Correlation matrix of physicochemical and bacteriologic parameters in Atoyac River.
In heavy metal terms, the levels of Fe and Al were recorded with values higher than the MPL for the Aquatic Life Protection (ALP) (MPL: Al = 0.05 mg/L and Fe = 1 mg/L) in the dry and rainy periods, according to CE-CCA-001/89, and for Agricultural Irrigation (AI) (MPL Fe = 5 mg/L). In the Fe case, in the rainy season, the readings were ~5.92 mg/L. The Cd and Ni show significantly higher values in drought, but these, like Cr, Cu, Pb, and Zn, did not exceed the MPL according to the Mexican Standards. Based on the PCA, the Cd and Ni were positively related to Cr and Zn, showing an increasing trend in the drought season. The same was observed with Al, Fe, and Pb in the rain season.
4.2. Pollution in the Sampling Zones
Table 3 shows the increase pattern in the BOD5 and COD organic and bacteriological contamination from the Covadonga Dam (Z1) to EPG (Z3). However, spatial differences or differences between sampling zones were not significant, which indicates that the flow is contaminated in all its extension, including the tributary that is diverted to EPG. In this study, the average TC populations were recorded between 1.86 × 10⁵–3.02 × 10⁵ NMP/100 mL, achieving up to 2.6 × 10⁵ NMP/100 mL of fecal coliforms (FC), a figure that substantially exceeds the MPL for agricultural irrigation (<1000 NMP/100 mL) according to CE-CCA-001/89. We identified 11 species of Gram-negative opportunistic pathogenic bacteria, belonging to the following families: (1) Enterobacteriaceae (Morganella morganii, Enterobacter cloacae, Escherichia coli, Klebsiella oxytoca, Klebsiella pneumoniae, Hafnia alvei, Kluyvera sp., Pantoea sp.), (2) Pseudomonadaceae (Pseudomonas aeruginosa, Pseudomonas sp.), and (3) Xanthomonadaceae (Stenotrophomona maltophilia).
Table 3.
Increase pattern in BOD5 and COD organic contamination and bacteriological from Covadonga Dam (Z1) to EPG (Z3).
It is observed that turbidity, color, pH, O2, and AMB show an increase from Z1 to Z3 and that the increase in Z3, for pH, O2, and AMB, is statistically significant. The pH, oscillating around 8 units, indicates that the water is basic. The surface water temperature registered lower values in the Covadonga Dam Z1 (19.17 °C), with respect to zones, Z2 and Z3. Of the eight metals that were detected in the water, six had higher concentrations in the Z2 (Echeverría Dam). Al, Zn, Ni, and Pb increased by 468%, 100%, 355%, and 409%, respectively. The Al exceeded the MPL for the ALP (Aquatic Life Protection) and RA according to CE-CCA-001/89 (Table 3).
4.3. Water Quality in the EPG Population
EPG households have a domestic water supply that comes from the spring at 1940 m above sea level. Inhabitants also obtain water from wells (70% of houses). These wells have a depth of 10–20 m, the water temperature varies between 20 and 25 °C, the pH is between 7 and 7.8, and the O2 between 2 and 4.5 mg/L. Roughly 88% of houses do not apply treatment for the purification of water from wells, which are used in food preparation and personal hygiene. Half of the houses boil the water. TC densities in wells, ranging around 1000 NMP/100 mL (Table 4) and bacterial species were identified from the Enterobacteriaceae family (Serratia fonticola, Citrobacter freundii, Citrobacter braakii, Enterobacter sp., Enterobacter cloacae, Enterobacter amnigenus, Enterobacter aerogenes, Escherichia coli, Klebsiella oxytoca and Klebsiella pneumoniae), and of the family Aeromonadaceae (Aeromonas hydrophila, and Aeromonas sp.).
Table 4.
TC densities in Wells, ranged around 1000 NMP/100 mL.
In the springwater, FCs were detected only in August and the presence of two bacterial species (Citrobacter freundii and Serratia ficaria) reported as opportunistic pathogens were also detected. Mesophilic bacteria were detected (314–374 CFU/100 mL). No significant differences were observed in relation to bacterial densities between the wells of the dwellings, according to their spatial location, or between the drought season and the rainy season.
The presence of seven heavy metals was detected in wells and springs from the nine evaluated. In wells in the dry season, concentrations higher than 200% were registered with respect to the rainy season as being statistically significant. In the drought season, the average concentrations of Fe and Ni doubled the MPL for human consumption (0.02 mg/L) according to CE-CCA-001/89, while Al (0.108 mg/L) exceeded more than four times that of the MPL (0.02 mg/L). The Pb registered average values, slightly higher (0.012 mg/L) than the MPL for human use and consumption according to NOM-127-Modified 2000 (MPL = 0.01 mg/L). In some samples, the concentrations were measured up to 0.052 mg/L, that is, five times higher than the MPL. In the rest of the metals studied (Zn, Cu, and Cr), the concentrations were below the MPL. With regard to the spatial comparison, no significant differences were registered between wells in relation to metals concentration or any of the other parameters.
The same pattern of increase in the drought season was observed for all detected metals in spring water, which was significant for Cu, Fe, and Zn. According to NOMs, the concentrations of Fe were registered at values higher than the MPL and comparable to Pb levels in spring water.
5. Discussion
This study demonstrates the marked seasonality in the physicochemical and bacteriological characteristics of the water of the Atoyac River: an increase in Ni, pH, Cd, BOD5, and COD levels in the drought season and an increase in the turbidity, color, Fe, and O2 during rainfall. In the article by Martínez-Tavera et al. (2017) [25], the same trend is reported with respect to the parameters COD, BOD5, and O2, for the 2013–2014 period in the Atoyac River. That is, the presence of higher values of COD and BOD5 in the drought season and O2 in the rain season. These results indicate that organic pollutants measured through the COD and BOD5 are more concentrated in the low precipitation season, possibly due to the decrease in the river’s flow, which comports with the typical behavior for this type of ecosystem, where changes in precipitation and flow affect values of many physical-chemical parameters of water by the dilution and turbulence effect [25,38,39,40]. Silva-Gómez et al. (2002) [38] found that Atlixco rivers had higher concentrations of BOD5 and COD in the drought season, and higher values of turbidity, pH, and Fe in the rainy season. This behavior coincides with this investigation [41].
Based on the detected organic and bacteriological contamination as well as the anoxic conditions of the surface water, the Atoyac River in the Puebla metropolitan zone presents a high degree of deterioration. With current O2 levels (~1.47 mg/L), the development or survival of aquatic fauna, except for anaerobic or facultative bacteria, is not possible. Since values lower than 5 mg/L generate an adverse effect on fish and other aquatic organisms, the same applies to them [42,43]. According to Huang et al. [44], the dissolved oxygen decrease in urban rivers is rising in developing countries, which causes strong stresses in aquatic ecosystems. This decrease is due to the bacterial decomposition process in the presence of a large number of organic compounds [39,42,45]. In the case of the Atoyac River, these come mainly from the discharges of the three municipal treatment macro-plants (El Conde, San Francisco, and Atoyac Sur), and effluents of hundreds of different industries (automotive, pharmaco-chemistry, metalworking, food, paint, and so on) that do not have efficient purification systems [20,21]. The organic matter also comes from municipal waters that have not been subjected to treatment due to a lack of hydraulic infrastructure, which is then discharged directly into the river or ravines [8,16,19,21,23]. Waste from other Tlaxcala and Puebla municipalities, located in the upper watershed area near the Quetzalcoatl industrial park, adds to the organic load. This park has been criticized and linked to health problems by various NGOs, along with the industrial corridors of Ixtacuixtla, Huejotzingo, the independent Petrochemical Complex, and municipal sewage networks waters, which also receive domestic effluents and sewage from denim laundries [23,46].
When comparing the Atoyac River with other urban rivers in other countries that flow by metropolitan zones [47,48,49,50,51,52,53,54], it is observed that the Atoyac River contamination in Puebla City is severe in terms of COD, BOD5, TC, and FC and contains a highly pathogenic bacterial presence. This represents a public health threat due to the fact that these water resources are used to irrigate crops. This suggests that the typical self-cleaning process of these ecosystems (dilution and assimilation) does not occur, possibly due to the amount of residual effluents that are discharged along the river exceeding the natural buffering capacity of the aquatic ecosystem [45,55], such that the oxygen concentration in the water remains low, independently of the area of the river or season.
Fecal bacteria has also been found in water for irrigation and has been detected in various studies [38,56,57]. High TC amounts and the presence of Enterobacteriaceae members in the river and irrigation canal are manifestations of the deficiency in the treatment of municipal water since many identified bacteria are part of the human intestinal flora [58,59] and enter the aquatic system mainly through municipal discharges. Rodríguez and Morales [8] point this out: since 2010, the municipality have had an insufficient capacity due to the population growth and the amount of wastewater that is generated. The condition of the treatment of municipal waters is critical to the whole of Mexico, which explains why high loads of coliform bacteria are a constant in Mexican rivers that transit through some rural-urban zones [3,41,60]. According to the Statistics and Geography National Institute of Mexico [23], of the 217 municipalities that make up the state of Puebla, only 34 have a treatment process applied to the municipal wastewater, the rest (183) pour their waters into the river, lake, dam, or canyon, without any treatment.
Regarding heavy metals, spatial differences were observed in their concentration. There was a significant increase of more than 100% in the Echeverría zone (Z2) in Al, Zn, Ni, and Pb, which is explained by the great variety of effluents that are discharged in the Covadonga-Echeverría section, especially considering that 50% of the total flow that is discharged directly to the Atoyac River comes from the San Francisco treatment plant, which discharges its waters 7 km from the Echeverría Dam [21]. In this region, they also unload two other municipal plants (Barranca del Conde and Atoyac Sur) directly and 14 industrial zones (both directly and indirectly) [21,22,61,62], which are sources of heavy metals and other chemical compounds [21].
In light of this situation, since 2011, it has been indicated in the river classification declaration [22] that the water body did not admit additional contaminants load. Five years later, the condition is even more serious. It is shown that the concentration of COD, BOD5, TC, Fe, Al, Pb, Cd, Zn, and Cr is higher in 2016 (in all or some of sampling stations) compared to the value calculated in 2011. Additionally, it is confirmed that five of these parameters (COD, BOD5, TC, Fe, and Al) show values well above the river quality goals that had been set for 2015 for the corresponding section, surpassing the assimilation capacity and dilution of the river. When comparing the values of BOD5 and COD from 2011 with those obtained in 2016, by both the National Monitoring Network (NMN) of the government [6] and this study, it is highlighted that the organic pollution measured through the BOD5 remained practically constant over time (<3%), while the increase in COD was relatively higher—between 22% (study) and 71% (NMN). These results suggest that, to date, larger amounts of wastewater are discharged without adequate treatment, particularly those of the industrial nature (given the minimum increase in BOD5), loaded with organic matter that is not very biodegradable. An increase in Al concentration over 685% and a Fe concentration of 1000% have been recorded, exceeding the MPL for the aquatic life protection (CE-CCA-001/89), like the MPL for the Al and Fe cases in rains. Although these chemical elements are found in nature, high levels are a consequence of mineral processing, metal part production, alloys, and so on [21]. Al is also used as a constituent of antacids, astringent, aspirin with an enteric coating, food additives, deodorants, and so forth [63]. The other metals did not exceed the MPL. Nevertheless, there is an increase of 5% in Pb and 815% in Cd in the 2011–2016 period, which indicates the additional contribution of the same elements over time.
The increase in COD and heavy metals might be related to the industrial growth in the region, since the number of manufacturing factories increased by 35.7% from 2009–2016 [61,62]. Bonilla et al. [64] point out that industrial development and the lack of sanitation in the region have caused pollution problems in recent years. Currently, there are 45,143 manufacturing industries [61] and only 67 (in 2015) private treatment plants that do not include tertiary treatment processes [20]—processes where specific pollutants, usually toxic or non-biodegradable compounds, are removed, including the removal of contaminants not extracted in the secondary treatment [65]. At the national level, 49% of municipal wastewater is treated, and only 14% of the pollutants load from industrial discharges is removed [5], which explains the presence of chemical contaminants in bodies of water, such as heavy metals and bacteriological contaminants from municipal wastewater.
According to Casiano et al. [23], discharges and water quality standards established by rivers classification are still far from being achieved, which is evidenced in the present study. In the case of the fecal coliforms, the MPL in the declaration is 200 NMP/100 mL and the aim for 2012–2015 was <1000 NMP/100 mL. However, the current FC populations are very large, with 265,631 NMP/100 mL FC values in the study and NRN densities >24,000 NMP/mL for 2016. In terms of O2 dissolved in the water, it should be noted that the declaration does not include this parameter, however, the O2 data recorded in 2007 by Sandoval et al. [16] indicated that, during that year, the O2 concentration had higher values (5.9–6.1 mg/L) in located stations in the same section. In the evaluation conducted by Martínez-Tavera et al. [25] in 2014 and the present, average values <2 mg/L are recorded.
Among the associated problems with Atoyac River contamination is the water quality deterioration in wells and supply sources due to the infiltration of pollutants into groundwater bodies [8]. It is likely that this infiltration process is occurring in EPG. Evidence of this is the fecal bacterial contamination in well water, the presence of Fe, Al, and Pb at high levels with respect to the NOM, and the increases in the concentration of heavy metals in groundwater in the drought season, during which the water required for irrigation, coming from the Atoyac River, is higher. In addition to these indicators, the well depth of EPG (10–20 m) shows that aquifers, also known as the water table (underground water), are more exposed to contamination [66].
The aquifer affectation is a growing problem in Mexico. The Mezquital Valley aquifer is the most emblematic case because the metropolitan area of Mexico City discharges ~60 m3/s of non-processed wastewater in the valley and the aquifer recharge is made with part of the wastewater that leads to irrigation channels, which explains the presence of FC and chemical contaminants in the water of the wells of the region [56,67,68,69]. This situation can be presented in EPG, since all wells evaluated showed a high presence of mesophilic aerobic bacteria (1 × 10⁵ CFU/100 mL ± 1.14 × 10⁵) and fecal contamination, to a lesser or greater degree, with the presence of important species [58,59,70] such as E. coli, Citrobacter freundii, Enterobacter aerogenes, Enterobacter cloacae, Klebsiella oxytoca and Klebsiella pneumoniae, which represents a threat to the population, considering that the water used for human consumption and personal hygiene must be free of pathogenic microorganisms [59]. These bacteria, isolated in wells, produce infections in the central nervous system, the digestive system (Escherichia), the lower respiratory tract, the bloodstream, and the urinary tract (Klebsiella, Enterobacter and Escherichia), and wells are not chlorinated in 88% of houses.
According to Silva-Gómez et al. [38], the bacteriological pollution of all wells and springs evaluated in the Atlixco region (neighboring municipality with EPG)—with FC densities in the order of 60 NMP/mL in wells, while in springs, densities are comparable to the irrigation channels—demonstrates that the pollution is due to the contaminated water filtration. We also recorded Al values higher than the MPL for human consumption in a well near the Nexapa River, at a concentration of 0.23 mg/L. The high Al and Fe values and, in general, other metals in the water sources of this region can be explained by the presence of these materials in the soil since, according to Méndez-García et al. [71,72], the accumulation of heavy metals in soil has increased due to irrigation with progressively polluted waters from the Atoyac River for more than 30 years.
The low microbiological quality of rural water is an extensive problem in developing countries. In Mexico, its magnitude is uncertain [58]. An increasing number of studies show pollution evidence by chemical components of well water in the country [73,74,75], as well as fecal bacteria [58,76,77,78,79,80]. The EPG situation is not favorable; water pollution affects the well-being of the population which is exposed to pollutants through at least two routes—water intake and contaminated food—thereby increasing the probability of acquiring diseases.
6. Conclusions
The Atoyac River in the Puebla metropolitan area is severely affected, and the water does not comply with the Aquatic Life Protection standards or with standards for agricultural irrigation according to CE-CCA-001/89 and NOM 001-SEMARNAT-1996. The deterioration of the water quality is caused by the dumping of substantial amounts of poorly treated wastewater in the river. The information generated here is useful in improving the standards of the water quality of the river given that many of the parameters studied show a marked seasonal variation, which is not considered in the Official Mexican Standards. The results indicate an increase in Atoyac River pollution over the last five years, pollution that is transferred to the irrigation channel in EPG and possibly toward the wells through infiltration. This drastic increase in pollution is a very serious and complex problem that deserves attention, as threats to public health increase in correspondences with industrial and municipal pollution.
Acknowledgments
Gabriela Pérez Castresana thanks to Consejo Nacional de Ciencia y Tecnología (CONACYT) for the scholarship (601562). The costs to publish in open access were covered by Programa para el Desarrollo Profesional Docente (PRODEP) of the Secretaria de Educación Pública de México (SEP).
Author Contributions
A.H.S. conceived the project and designed the experiments; G.P.C. performed the experiments; J.L.M.P., F.H.A. and W.A.G.S. analyzed the data; V.T.F. and R.C.V. performed the heavy metal analysis in the water; L.L.R. performed the microbiologic analysis; all authors contributed with reagents, materials, and equipment; G.P.C., A.D.F. and A.H.S. wrote the paper.
Conflicts of Interest
The authors have no conflicts of interest to declare.
References
- Munyao, J.; Kimiti, J.; Njuru, P. Water pollution in a riparian community: The case of river Athi in Makueni County, Kenya. J. Appl. Life Sci. Int. 2017, 10, 1–17. Available online: http://www.journalrepository.org/media/journals/JALSI_40/2017/Feb/Munyao1032017JALSI31436_1.pdf (accessed on 4 June 2017). [CrossRef]
- Secretaria de Medio Ambiente y Recursos Naturales. Informe de la Situación del Medio Ambiente en México. Compendio de Estadísticas Ambientales. Indicadores Clave, de Desempeño. Ambiental y de Crecimiento Verde, 2015 ed.; SNIARN: Ciudad de México, México, 2016; pp. 363–429. Available online: http://apps1.semarnat.gob.mx/dgeia/informe15/tema/pdf/Informe15_completo.pdf (accessed on 13 August 2017).
- Muñoz, H.; Suárez, J.; Vera, A.; Orozco, S.; Batlle, J.; Ortiz, A.J.; Mendiola, J. Demanda bioquímica de oxígeno y población en la subcuenca del Río Zahuapan, Tlaxcala, México. Rev. In. Contam. Ambient. 2012, 28, 27–38. Available online: http://www.scielo.org.mx/pdf/rica/v28n1/v28n1a3.pdf (accessed on 21 August 2017).
- Mendoza, M.; Quevedo, A.; Bravo, A.; Flores, H.; De la Isla de Bauer, M.; Reyes, F.; Zamora, B.P. Estado ecológico de ríos y vegetación rivereña en el contexto de la nueva Ley General 463 de Aguas de México. Rev. In. Contam. Ambient. 2014, 30, 429–436. Available online: http://www.scielo.org.mx/pdf/rica/v30n4/v30n4a10.pdf (accessed on 7 September 2017).
- Comisión Nacional de Agua. Atlas del agua en México 2016, 2016 ed.; CONAGUA: México D.F., México, 2016; pp. 20–100. Available online: http://201.116.60.25/publicaciones/AAM_2016.pdf (accessed on 11 February 2017).
- Comisión Nacional de Agua (CONAGUA). Red Nacional de Monitoreo 2012–2015 (RNM), México. Available online: https://www.gob.mx/conagua/documentos/monitoreo-de-la-calidad-del-agua-en-mexico (accessed on 4 January 2017).
- Diario Oficial de la Federación (DOF). ACUERDO Por el Que se Dan a Conocer Los Estudios Técnicos de Aguas Nacionales Superficiales de la Región Hidrológica Número 18 Balsas, México. 2010. Available online: http://dof.gob.mx/nota_detalle_popup.php?codigo=5175730 (accessed on 3 October 2017).
- Rodríguez, L.; Morales, J.A. Contaminación del Atoyac, Daños Ambientales y Tecnologías de Mitigación, 1st ed.; MAPorrúa: México D.F., México, 2014; pp. 7–87. ISBN 978-607-28-0329-9. [Google Scholar]
- Carabarín, A. Agua y confort en la Vida de la Antigua Puebla, México; Dirección de Fomento Editorial; Benemérita Universidad Autónoma de Puebla (BUAP): Puebla, México, 2000. [Google Scholar]
- De Alcalá y Mendiola, M. Descripción en Bosquejo de la Imperial, Cesárea, Muy Noble y Muy Leal Ciudad de Puebla de Los Ángeles, Puebla; Junta de Mejoramiento Moral, Cívica y Material del Municipio de Puebla: Puebla, México, 1992. [Google Scholar]
- Bermúdez de Castro, D. Teatro Angelopolitano o Historia de la Ciudad de Puebla, 1746, 2nd ed.; Junta de Mejoramiento Moral, Cívica y Material del Municipio de Puebla: Puebla, México, 1985. [Google Scholar]
- Leicht, H. Las Calles de Puebla. México; Junta de Mejoramiento Moral, Cívico y Material del municipio de Puebla, Tercera edición facsimilar: Puebla, México, 1986. [Google Scholar]
- Loreto, R. De aguas dulces y aguas amargas o de cómo se distribuía el agua en la ciudad de Puebla durante los siglos XVIII y XIX. In Limpiar y Obedecer, la Basura, el Agua y la Muerte en la Puebla de Los Ángeles 1650–1925; Centro de Estudios Mexicanos y Centroamericanos: Ciudad de México, México, 1994. [Google Scholar]
- Gamboa, L. Los Empresarios de Ayer: El Grupo Dominante en la Industria Textil de Puebla, 1906–1929, 1st ed.; Dirección General de Fomento Editorial, Universidad Autónoma de Puebla (UAP): Puebla, México, 1985. [Google Scholar]
- Ventura, M.T. La industrialización en Puebla, México, 1835–1976. In Proceedings of the XII Encuentro de latinoamericanistas españoles, Santandaer, España, 21–23 de septiembre de 2006; Consejo Español de Estudios Iberoamericanos; HAL-SHS, 2006; pp. 650–652. Available online: https://halshs.archives-ouvertes.fr/halshs-00103437/document (accessed on 3 July 2017).
- Sandoval, A.M.; Pulido, G.; Monks, S.; Gordillo, A.J.; Villegas, E.C. Evaluación fisicoquímica, microbiológica y toxicológica de la degradación ambiental del Río Atoyac, México. Interciencia 2009, 34, 880–887. Available online: https://www.uaeh.edu.mx/investigacion/icbi/LI_Helmintos/Griselda_Pulido/sandoval2009a.pdf (accessed on 2 January 2017).
- Rodríguez, L.; Morales, J.; Zavala, P. Evaluación socioeconómica de daños ambientales por contaminación del Río Atoyac en México. TyCA-RETAC 2012, 3, 143–151. Available online: http://www.redalyc.org/articulo.oa?id=353531980010 (accessed on 10 Febrary 2017).
- Montero, R.; Serrano, L.; Araujo, A.; Dávila, V.; Ponce, J.; Camacho, R.; Morales, E.; Méndez, A. Increased cytogenetic damage in a zone in transition from agricultural to industrial use: Comprehensive analysis of the micronucleus test in peripheral blood lymphocytes. Mutagenesis 2006, 21, 335–342. Available online: https://academic.oup.com/mutage/article/21/5/335/1137853 (accessed on 2 October 2016). [CrossRef] [PubMed]
- Navarro, I.; Flores, E.; Valladares, R. Evaluación ambiental y epidemiológica para identificar factores de riesgo a la salud por contaminación del Río Atoyac, México. BVSDE 2003. Available online: http://www.bvsde.paho.org/bvsAIDIS/PuertoRico29/navarro.pdf (accessed on 14 July 2017).
- Instituto Nacional de Estadística y Geografía. Anuario Estadístico y Geográfico de Puebla 2016; INEGI: Aguascalientes, México, 2016; ISBN 978-607-739-987-2. [Google Scholar]
- Instituto Mexicano de Tecnología del Agua (IMTA). Estudio de Clasificación del Río Atoyac, Puebla-Tlaxcala; CONAGUA: México City, México, 2005. [Google Scholar]
- Diario Oficial de la Federación (DOF). Declaratoria de Clasificación de Los Río Atoyac, Xochiac o Hueyapan, y Sus Afluentes. México. 2011. Available online: http://dof.gob.mx/nota_detalle.php?codigo=5199672&fecha=06/07/2011 (accessed on 22 March 2017).
- Flores, C.A.C.; Vikolainen, V.; Bressers, H. Water Governance decentralisation and river basin management Reforms in hierarchical systems: Do they work for water treatment policy in Mexico’s Tlaxcala Atoyac Sub-Basin? Water 2016, 8, 210. Available online: http://www.mdpi.com/2073-4441/8/5/210 (accessed on 18 September 2017). [CrossRef]
- Arellano, O.; Solís, S.; Serrano, L.; Morales, E.; Méndez, A.; Montero, R. Use of the zebrafish embryo toxicity test for risk assessment purpose: Case study. J. Fish. Sci. 2015, 9, 52–62. Available online: http://www.fisheriessciences.com/fisheries-aqua/use-of-the-zebrafish-embryo-toxicity-test-for-risk-assessment-purpose-case-study.pdf (accessed on 20 October 2016).
- Martínez, E.; Rodríguez, P.F.; Shruti, V.C.; Sujitha, S.; Morales, S.; Muñoz, N. Monitoring the seasonal dynamics of physicochemical parameters from Atoyac River basin (Puebla), Central Mexico: Multivariate approach. Environ. Earth Sci. 2017, 76, 1–15. Available online: https://link.springer.com/article/10.1007/s12665-017-6406-2 (accessed on 23 February 2017). [CrossRef]
- Sistema Nacional de Información Municipal (SNIM-2010). Available online: http://www.snim.rami.gob.mx/ (accessed on 16 August 2017).
- Comité Estatal de Información Estadística y Geográfica del Estado de Puebla (CEIGEP), México. 2017. Available online: http://www.coteigep.puebla.gob.mx/ (accessed on 15 June 2017).
- Martínez, T.; Palerm, J. Antología Sobre Pequeño Riego: Organizaciones Autogestivas; Colegio de Postgraduados y Plaza y Valdés: Cuauhtémoc, México, 2000; pp. 345–407. ISBN 968-856-761-1. [Google Scholar]
- American Public Health Association (APHA). Standard Methods: For the Examination of Water and Wastewater, 21st ed.; American Public Health Association/American Water Works Association/Water Environment Federation: Washington, DC, USA, 2005. [Google Scholar]
- Diario Oficial de la Federación (DOF). Determinación de Metales Pesados Por Absorción Atómica en Aguas Naturales, Potables, Residuales y Residuales Tratadas. Método de Prueba; NMX-AA-051-SCFI-2001. México. 2001. Available online: https://www.gob.mx/cms/uploads/attachment/file/166785/NMX-AA-051-SCFI-2001.pdf (accessed on 20 June 2017).
- Diario Oficial de la Federación (DOF). Enumeración de Organismos Coliformes Totales, Fecales y E. coli–Método del Número Más Probable; NMX-AA-042-SCFI-2015. Ciudad de México, México. 2015. Available online: https://www.gob.mx/cms/uploads/attachment/file/166147/nmx-aa-042-scfi-2015.pdf (accessed on 20 June 2017).
- Diario Oficial de la Federación (DOF). Criterios Ecológicos de Calidad del Agua; CE-CCA-001/89. Ciudad de México, México. 1989. Available online: http://legismex.mty.itesm.mx/acu/acca001.pdf (accessed on 19 June 2017).
- Diario Oficial de la Federación (DOF). Agua Para Uso y Consumo Humano. Límites Permisibles de Calidad y Tratamientos a Que Debe Someterse el Agua Para su Potabilización; MODIFICACION NOM-127-SSA1-94. Ciudad de México, México. 2000. Available online: https://www.ucol.mx/content/cms/13/file/NOM/Nom-127-ssa1-1994.pdf (accessed on 19 June 2017).
- Diario Oficial de la Federación (DOF). Límites Máximos Permisibles de Contaminantes en Las Descargas de Aguas Residuales en Aguas y Bienes Nacionales; NOM-001-SEMARNAT-1996. Ciudad de México, México. 1997. Available online: http://www.profepa.gob.mx/innovaportal/file/3290/1/nom-001-semarnat-1996.pdf (accessed on 23 June 2017).
- Sistema Meteorológico Nacional (SMN). Ciudad de México, México. Available online: http://smn.cna.gob.mx/es/component/content/article?id=42 (accessed on 25 May 2017).
- Comisión Nacional de Agua (CONAGUA). Red Nacional de Monitoreo (RNM) de la Calidad de Las Aguas (Datos 2016). Available online: http://catalogo.datos.gob.mx/dataset/red-nacional-de-monitoreo-de-la-calidad-de-las-aguas-nacionales (accessed on 25 April 2017).
- Comisión Nacional de Agua (CONAGUA). Escala de Clasificación de Los Cuerpos de Agua Superficiales. México. Available online: http://files.conagua.gob.mx/transparencia/CalidaddelAgua.pdf (accessed on 26 November 2016).
- Silva, S.; Muñoz, O.; De la Isla de Bauer, M.; Infante, G. Contaminación ambiental en la región de Atlixco: 1 Agua. Terra Latinoam. 2002, 20, 243–251. Available online: https://chapingo.mx/terra/contenido/20/3/art243-252.pdf (accessed on April 2017).
- Olguín, E.; González, R.; Sánchez, G.; Zamora, J.; Owen, T. Contaminación de ríos urbanos: El caso de la subcuenca del Río Sordo en Xalapa, Veracruz, México. Rev. Latinoam. Biotecnol. Amb. Algal. 2010, 1, 178–190. Available online: http://www.solabiaa.org/ojs3/index.php/RELBAA/article/view/23 (accessed on 26 July 2017).
- López, M.; Ramos, M.G.; Carranza, J. Análisis multimétrico para evaluar contaminación en el Río Lerma y Lago de Chapala, México. Hidrobiologica 2007, 17, 17–30. Available online: http://hidrobiologica.izt.uam.mx/index.php/revHidro/article/view/973 (accessed on 16 July 2017).
- Guzmán, G.; Ramírez, E.M.; Thalasso, F.; Rodríguez, N.; Guerrero, A.; Avelar, F.J. Evaluación de contaminantes en agua y sedimentos del río San Pedro en el Estado de Aguascalientes. Univers. Cienc. 2011, 27, 17–32. Available online: http://www.scielo.org.mx/scielo.php?script=sci_arttext&pid=S0186-29792011000100002 (accessed on 11 July 2017).
- Henze, M.; Loosdrecht, M.C.; Ekama, G.; Brdjanovic, D. Biological Wastewater Treatment: Principles Modelling and Design; IWA Publishing: London, UK, 2008; ISBN 9781843391883. [Google Scholar]
- Momba, M.; Osode, A.; Sibewu, M. The impact of inadequate wastewater treatment on the receiving water bodies-case study: Buffalo City and Nkokonbe Municipalities of the Eastern Cape Province. Water SA 2006, 32, 687–692. Available online: https://www.ajol.info/index.php/wsa/article/view/47854 (accessed on 22 June 2017). [CrossRef]
- Huang, J.; Yin, H.; Chapra, S.; Zhou, Q. Modelling dissolved oxygen depression in an urban river in China. Water 2017, 9, 520. Available online: http://www.mdpi.com/2073-4441/9/7/520 (accessed on September 2017). [CrossRef]
- Edokpayi, J.; Odiyo, J.; Durowoju, O. Impact of wastewater on surface water quality in developing countries: A case study of south Africa. In Water Quality; Tutu, H., Ed.; In Tech: London, UK, 2017; pp. 401–410. ISBN 978-953-51-2882-3. Available online: https://www.intechopen.com/books/water-quality/impact-of-wastewater-on-surface-water-quality-in-developing-countries-a-case-study-of-south-africa (accessed on 21 August 2017).
- Instituto Nacional de Estadística y Geografía (INEGI). Censo Nacional de Gobiernos Municipales y Delegacionales 2015. Modulo 5 Agua Potable y Saneamiento; INEGI: Aguascalientes, México, 2016. [Google Scholar]
- Comisión Nacional de Derechos Humanos. Recomendación No. 10/2017; CNDH: México City, México, 2017. [Google Scholar]
- Wang, J.; Liu, X.D.; Lua, J. Urban river pollution control and remediation. Procedia Environ. Sci. 2012, 13, 1856–1862. Available online: https://www.sciencedirect.com/science/article/pii/S1878029612001806 (accesses on 26 September 2017). [CrossRef]
- Gyawali, S.; Techato, K.; Monprapussorn, S.; Yuangyai, C. Integrating landuse and water quality for environmental based land use planning for U-tapao River Basin, Thailand. Procedia Soc. Behav. Sci. 2013, 91, 556–563. Available online: https://www.sciencedirect.com/science/article/pii/S1877042813025858 (accessed on 28 August 2017). [CrossRef]
- Goher, M.E.; Hassan, A.L.; Abdel, I.A.; Fahmy, A.H.; El-sayed, S.M. Evaluation of surface water quality and heavy metal indices of Ismailia Canal, Nile River, Egypt. Egypt J. Aquat. Res. 2014, 40, 225–233. Available online: https://www.sciencedirect.com/science/article/pii/S1687428514000740 (accessed on 28 August 2017). [CrossRef]
- Kibena, J.; Nhapi, I.; Gumindoga, W. Assessing the relationship between water quality parameters and changes in landuse patterns in the Upper Manyame River, Zimbabwe. Phys. Chem. Earth 2014, 67–69, 153–163. Available online: https://www.sciencedirect.com/science/article/pii/S1474706513001435?via%3Dihub (accessed on 29 July 2017). [CrossRef]
- Ramavandi, B.; Farjadfard, S.; Ardjmand, M.; Dobaradaran, S. Effect of water quality and operational parameters on trihalomethanes formation potential in Dez River water, Iran. Water Res. Ind. 2015, 11, 1–12. Available online: https://www.sciencedirect.com/science/article/pii/S2212371715000244 (accessed on 13 August 2017). [CrossRef]
- Damanik, M.N.; Lock, K.; Boets, P.; Everaert, G.; Nguyen, T.H.; Forio, M.; Musonge, P.; Suhareva, N.; Bennetsen, E.; Landuyt, D.; et al. Ecological water quality analysis of the Guayas river basin (Ecuador) based on macroinvertebrates indices. Limnologica 2016, 57, 27–59. Available online: https://www.sciencedirect.com/science/article/pii/S0075951116000050 (accessed on 27 September 2017). [CrossRef]
- Jung, K.Y.; Lee, K.L.; Im, T.; Lee, I.J.; Kim, S.; Han, K.Y.; Ahn, J.M. Evaluation of water quality for the Nakdong River watershed using multivariate analysis. Environ. Technol. Innov. 2016, 5, 67–82. Available online: https://www.sciencedirect.com/science/article/pii/S2352186415300067 (accessed on 14 June 2017). [CrossRef]
- Ali, M.M.; Ali, M.L.; Islam, M.; Rahman, M. Preliminary assessment of heavy metals in water and sediment of Karnaphuli River, Bangladesh. Environ. Nanotechnol. Monit. Manag. 2016, 5, 27–35. Available online: https://www.sciencedirect.com/science/article/pii/S2215153216300022 (accessed on 17 June 2017). [CrossRef]
- Dallas, H.; Day, J.A.; Musibono, D.E.; Day, E.G. Water quality for aquatic ecosystems: Tools for evaluating regional guidelines. WRC Rep. 1998, 626, 98–240. [Google Scholar]
- Lesser, L.E.; Lesser, J.M.; Arellano, S.; González, D. Balance hídrico y calidad del agua subterránea, Valle Mezquital, México central. Rev. Mex. Cienc. Geol. 2011, 28, 323–336. Available online: http://www.scielo.org.mx/pdf/rmcg/v28n3/v28n3a1.pdf (accessed on 24 June 2017).
- Hernández, E.; Quiñones, E.; Cristóbal, D.; Rubiños, J. Calidad biológica de aguas residuales utilizadas para riego de cultivos forrajeros en Tulancingo, Hidalgo, México. Revista Chapingo Ser. Cienc. For. Ambient. 2014, 20, 89–100. Available online: http://www.scielo.org.mx/pdf/rcscfa/v20n1/v20n1a9.pdf (accessed on 12 July 2017).
- Burgos, A.L.; Alvarado, M.; Páez, R.; Hernández, R. Patrones espacio temporales de la condición microbiológica del agua de fuentes comunitarias y amenazas a la salud familiar en cuencas estacionales del Bajo Balsas (México). Rev. In. Contam. Ambient. 2017, 33, 199–213. Available online: http://www.scielo.org.mx/pdf/rica/v33n2/0188-4999-rica-33-02-00199.pdf (accessed on 22 July 2017). [CrossRef]
- Ríos, S.; Agudelo, R.M.; Gutiérrez, L.A. Patógenos e indicadores microbiológicos de calidad del agua para consumo humano. Rev. Fac. Nac. Salud Pública 2017, 35, 236–247. Available online: http://www.scielo.org.co/pdf/rfnsp/v35n2/0120-386X-rfnsp-35-02-00236.pdf (accessed on 12 August 2017). [CrossRef]
- Rivera, R.; Palacios, O.L.; Chávez, J.; Belmont, M.A.; Nikolski, I.; De la Isla de Bauer, M.L.; Guzmán, A.; Terrazas, L.; Carrillo, R. Contaminación por coliformes y helmintos en los Ríos Texcoco, Chapingo y San Bernardino tributarios de la parte oriental de la cuenca del Valle de México. Rev. In. Contam. Ambient. Rev. In. Contam. Ambient. 2007, 23, 69–77. Available online: http://www.scielo.org.mx/pdf/rica/v23n2/v23n2a3.pdf (accessed on 19 August 2017).
- Directorio Estadístico Nacional de Unidades Económicas (DENUE). Available online: http://www.beta.inegi.org.mx/app/mapa/denue/ (accessed on 10 August 2017).
- Instituto Nacional de Estadística y Geografía. Encuesta Anual de la Industria Manufacturera: EAIM 2012: SCIAN 2007; INEGI: Aguascalientes, México, 2014; pp. 1–32. ISBN 978-607-739-115-9. [Google Scholar]
- Agencia de sustancias tóxicas y registro de enfermedades de los E.E.U. Available online: https://www.atsdr.cdc.gov/es/index.html (accessed on 12 August 2017).
- Bonilla, M.; Ayala, A.; González, S.; Santamaría, J.; Silva, S. Calidad fisicoquímica del agua del distrito de riego 030 “Valsequillo” para riego agrícola. Rev. Iberoam. Prod. Acad. Gest. Educ. 2015, 2, 4. Available online: http://www.pag.org.mx/index.php/PAG/article/viewFile/371/410 (accessed on 28 August 2017).
- Guevara, S.; Arellano, O.; Fricke, J. Ríos Tóxicos: Lerma y Atoyac. La Historia de Negligencia Continúa; Greenpeace México A. C.: México D.F., México, 2004; pp. 1–23. Available online: https://www.greenpeace.org/mexico/Global/mexico/Docs/2014/toxicos/Rios%20t%C3%B3xicos%20Lerma%20y%20Atoyac-WEB.pdf (accessed on 23 June 2017).
- Díaz, C.; Esteller, M.V.; López, F. Recursos Hídricos. Conceptos Básicos y Estudios de Caso en Iberoamericana; Priguazú Ediciones: Montevideo, Uruguay, 2005; ISBN 9974-7571-6-9. Available online: http://hdl.handle.net/20.500.11799/58927 (accessed on 19 August 2017).
- Gallegos, E.; Warren, A.; Robles, E.; Campoy, E.; Calderón, A.; Sainz, M.G.; Bonilla, P.; Escolero, O. The effects of wastewater irrigation on ground water quality in Mexico. Water Sci. Technol. 1999, 40, 45–52. Available online: https://www.sciencedirect.com/science/article/pii/S0273122399004291 (accessed on 30 September 2017). [CrossRef]
- Diario Oficial de la Federación (DOF). ACUERDO Por el Que se da a Conocer el Resultado de Los Estudios Técnicos de Las Aguas Nacionales Subterráneas del Acuífero Valle del Mezquital, Clave 1310, en el Estado de Hidalgo, Región Hidrológico-Administrativa Aguas del Valle de México; México. 2016. Available online: http://www.dof.gob.mx/nota_detalle.php?codigo=5452731&fecha=15/09/2016 (accessed on 25 July 2017).
- Hernández, A.; Arango, C.; Reyes, A.; Martínez, P.; Pita de la Paz, C.; Macías, S.; Arias, A.; Breña, J.A. Water supply source evaluation in unmanaged aquifer recharge zones: The Mezquital Valley (México) Case Study. Water 2017, 9, 4. Available online: http://www.mdpi.com/2073-4441/9/1/4 (accessed on 19 August 2017). [CrossRef]
- Puerta, A.; Mateos, F. Enterobacterias. Medicine 2010, 10, 3426–3431. Available online: http://www.facmed.unam.mx/deptos/microbiologia/pdf/Enterobacterias_Medicine2010.pdf (accessed on 10 August 2017).
- Méndez, T.; Rodríguez, L.; Palacios, S. Impacto del riego con aguas contaminadas, evaluado a través de la presencia de metales pesados en suelos. Terra 2000, 18, 4. Available online: http://www.redalyc.org/articulo.oa?id=57318401 (accessed on 3 July 2017).
- Méndez, T.; Flores, R.; Palacios, S. Disponibilidad de Cd, Fe, Mn y Pb en suelos agrícolas de Tecamachalco, Edo. de Puebla. In Proceedings of the Memorias del XXVIII Congreso Nacional de la Ciencia del Suelo, Tabasco, México, 10–14 November 1997. [Google Scholar]
- Brenes, R.; Cadena, A.; Ruiz, R. Monitoreo de la concentración de nitrato en el acuífero del Valle de Puebla. Rev. In. Contam. Ambient. 2011, 27, 313–321. Available online: http://www.scielo.org.mx/scielo.php?script=sci_arttext&pid=S0188-49992011000400004 (accessed on 7 August 2017).
- Peña, Y.; Santacruz de León, G.; Charcas, H. Calidad del agua en pozos de la red de monitoreo del acuífero del Valle de San Luis Potosí, México. Aqua-LAC 2012, 4, 49–59. Available online: http://www.unesco.org.uy/ci/fileadmin/phi/aqualac/Art6-Pena-49-59.pdf (accessed on 7 August 2017).
- Pérez, F.; Prieto, F.; Rojas, A.; Galán, C.; Marmolejo, Y.; Romo, Y.; Castañeda, A.; Rodríguez, J.A.; Barrado, E. Caracterización química de aguas subterráneas en pozos y un distribuidor de agua de Zimapán, Estado de Hidalgo, México. Hidrobiológica 2003, 13, 95–102. Available online: http://hidrobiologica.izt.uam.mx/index.php/revHidro/article/view/1101/685 (accessed on 22 July 2017).
- Félix, A.; Campas, O.; Aguilar, M.; Meza, M. Calidad microbiológica del agua de consumo humano de tres comunidades rurales del sur de sonora (México). RESPYN 2007, 8, 1–13. Available online: http://www.medigraphic.com/cgi-bin/new/resumen.cgi?IDARTICULO=18586 (accessed on 2 June 2017).
- Ramírez, E.; Robles, E.; Sainz, M.; Ayala, R.; Campoy, E. Calidad microbiológica del acuífero de Zacatepec, Morelos, México. Rev. In. Contam. Ambient. 2009, 25, 247–255. Available online: http://www.scielo.org.mx/pdf/rica/v25n4/v25n4a5.pdf (accessed on 7 August 2017).
- Martínez, C.; Huante, Y.; Santiago, I.; Sandoval, G.; Estrada, C.; Madrid, J. Diagnóstico de la calidad de agua de los pozos de Puerto Ángel, San Pedro Pochutla, Oaxaca. Ciencia y Mar 2013, 18, 11–18. Available online: http://www.umar.mx/revistas/50/500102.pdf (accessed on 8 June 2017).
- Anduro, J.A.; Cantú, E.; Campas, O.; López, J.; Sánchez, D.; Félix, A. Diagnóstico de la calidad sanitaria del agua de pozo en comunidades del sur de Sonora, México. RESPYN 2017, 16, 1–8. Available online: http://www.medigraphic.com/pdfs/revsalpubnut/spn-2017/spn171a.pdf (accessed on 17 August 2017).
© 2018 by the authors. Licensee MDPI, Basel, Switzerland. This article is an open access article distributed under the terms and conditions of the Creative Commons Attribution (CC BY) license (http://creativecommons.org/licenses/by/4.0/).