Article

Analysis of Drought Intensity and Trends Using the Modified SPEI in South Korea from 1981 to 2010

1
Institute of Green Bio Science Technology, Seoul National University, Pyeongchang 25354, Korea
2
Department of Biological and Agricultural Engineering, Texas A&M University, College Satation, TX 77840, USA
3
Department of Rural and Bio-Systems Engineering, Chonnam National University, Gwangju 61186, Korea
4
Institute on the Environment, University of Minnesota, Saint Paul, MN 55108, USA
*
Author to whom correspondence should be addressed.
Water 2018, 10(3), 327; https://doi.org/10.3390/w10030327
Submission received: 23 January 2018 / Revised: 6 March 2018 / Accepted: 13 March 2018 / Published: 15 March 2018

Abstract

:
The aim of this study is to analyze the characteristics of drought, such as intensity and trends, based on SPEI (Standardized Precipitation Evapotranspiration Index) at 8 stations in South Korea from 1981 to 2010. The traditional SPEI is based on the Thornthwaite equation for estimating evapotranspiration; SPEI_th. However, a standard of agricultural water management in Korea suggests the FAO Penman-Monteith equation; SPEI_pm. Therefore, we analyzed the intensity, variability, and trends of drought using SPEI_th and SPEI_pm, respectively, and compared the results. SPEI_pm showed slightly more intensive drought rather than SPEI_th except for Chuncheon and Gwangju. In 5 stations—excluding Cheoncheon, Gwangju and Jinju—the cumulative probability that SPEI_pm was below −1.5 was significantly increased from 1981–1995 to 1996–2010. In addition, the northwest and southwest regions had higher intensity of 1-month droughts, and the central and southwest regions had a higher intensity of 3-month droughts. According to the Mann–Kendall test, there was a decreasing trend of 1-month SPEI during the fall season and 3-month SPEI during winter season.

1. Introduction

Drought is the world’s costliest disaster and affects a large number of people every year; for example, an average cost of 6 to 8 billion US$ is caused annually by global drought [1]. Droughts are recognized as an environmental disaster [2], and several studies have evaluated the considerable decrease in water availability caused by precipitation deficit [1,3,4]. In addition, climate change will aggravate water scarcity [5]. In recent years, the increased intensity and duration of droughts has dramatically altered the structure and function of grassland ecosystems, which have been forced to adapt to this change in climate [6]. In particular, extreme climatic events such as droughts are predicted to become more intense, more frequent, and longer lasting in arid and semi-arid regions [7,8].
There are several definitions of drought based on precipitation, soil moisture, or potential evapotranspiration [9,10,11,12]. Major droughts are defined as meteorological droughts, and consists of a period of months to years with below-normal precipitation. The SPI (Standardized Precipitation Index) is used as the general index for evaluating meteorological drought severity. The SPI is based on fitting and transforming a long-term precipitation record into a normal distribution, and this index can be computed for different time scales—symmetrically for both dry and wet spells—related to probability [13]. Many studies have been carried out to evaluate meteorological drought severity using SPI [14,15,16]. However, the SPI is based on precipitation only, and there is a limitation in evaluating agricultural drought using SPI because agriculture is the most sensitive field to drought conditions and crop growth. Agricultural drought is a period with dry soils that results from below-average precipitation, intense but less frequent rain events, or above-normal evaporation, all of which lead to reduced crop production and plant growth [13]. The SPEI (Standardized Precipitation Evapotranspiration Index) was developed for evaluating agricultural drought severity in consideration of meteorological drought and crop evapotranspiration [17]. Accordingly, the National Drought Mitigation Center (NDMC) developed the monitoring drought system using SPEI [18,19,20]. In Korea, several studies have been performed to evaluate drought severity with drought index. The spatial and temporal drought distribution was analyzed by SPI [21,22,23,24,25]. In addition, the impact of climate change on future drought has been evaluated in several studies in Korea [26,27,28]. However, most research has focused on meteorological drought, but the main problem of drought occurs in agricultural area. Therefore, an evaluation of drought severity should include both meteorological factor and crop vegetation.
The original formulation of the SPEI suggested the use of the Thornthwaite (Th) equation for estimation of evapotranspiration [29]. A few studies have evaluated the drought using SPEI based on the Thornthwaite equation for calculating evapotranspiration [30]. The evapotranspiration is related to several factors, including temperature, precipitation, wind, humidity, etc. However, the Thornthwaite equation only requires the mean daily temperature and latitude of the site, and it was used due to limited data availability. In addition, previous research has indicated that the Thornthwaite equation underestimated evapotranspiration in arid and semiarid regions [31], and overestimated evapotranspiration in humid equatorial and tropical regions [32]. The FAO Penman–Monteith equation is recommended for calculating evapotranspiration by FAO, because it uses all parameters that govern energy exchange and corresponding latent heat flux (evapotranspiration) from uniform expanses of vegetation.
In this study, we applied various methods for assessing the intensity and trends of drought using the SPEI. First, the SPEI was modified by applying the FAO Penman–Monteith (PM) equation. Second, the intensity and trends of drought were analyzed by applying the modified SPEI to runs theory and the Mann–Kendall test.

2. Materials and Methods

2.1. Modified SPEI

The SPEI is based on the original SPI calculation procedure. The SPI is calculated using monthly (or weekly) precipitation as the input data [17]. The SPEI uses the monthly (or weekly) difference (D) between precipitation (P) and the reference crop evapotranspiration (ETo). This difference (D) is the water surplus or deficit for the analyzed month (i), and is calculated using Equation (1):
D i = P i ETo i
ETo, is generally calculated using a simple climatic water balance, and it is expressed as Equation (2):
ETo = 16 K ( 10 T I ) m
where ETo is the reference crop evapotranspiration, T is monthly temperature, I is heat index, K is the constant, and m is a coefficient depending on I.
However, in Korea, the Penman–Monteith equation is recommended as the standard for calculating evapotranspiration when agricultural water demand for constructing an agricultural reservoir is estimated. Therefore, in this study, the SPEI is modified by applying the Penman–Monteith equation instead of a simple climatic water balance. Accordingly, the ETo is calculated using the FAO Penman–Monteith method, as recommended in FAO paper No. 56 [33], which uses all of the parameters that govern the energy exchange and the corresponding latent heat flux (evapotranspiration) of uniform expanses of vegetation. Most of these parameters are measured or can be calculated from weather conditions. It requires daily, weekly and monthly meteorological data, including air temperature, humidity, sunshine duration and wind speed. The FAO Penman–Monteith equation used for 24-h calculations of ETo using daily or monthly mean data can be simplified, and is expressed as Equation (3):
ETo =   0.408 Ι ( R n G ) +   γ ( 900 T + 273 ) u 2 ( e s e a ) Ι +   γ ( 1 + 0.34 u 2 )
where ETo is the reference crop evapotranspiration (mm/day), the slope of saturated vapor pressure/temperature curve (kPa/°C), g the psychrometric constant (kPa/°C), u 2 the wind speed at 2 m height (m/s), Rn the total net radiation at the crop surface (MJ/ m 2 day), G the soil heat flux density (MJ/ m 2 day), T the mean daily air temperature at 2 m height (°C), e s is the saturation vapor pressure (kPa) and e a is the actual vapor pressure (kPa).
The calculated D values by precipitation and ETo using FAO Penman–Monteith method are aggregated at different time scales. For example, the cumulative difference for one month in a particular year at a 12-month time scale can be calculated. The SPEI is based on the probability of the D series. In this study, we performed a goodness of fit test using the Kolmogorov-Smirnov method to determine the suitable probability distribution function of the D series. The SPEI can be obtained as the standardized values of probability distribution function of the D series, according to a log-logistic distribution. The SPEI can be compared with other SPEI values over time and space, and it can be categorized by dryness/wetness grade (Table 1).
The SPEI can apply different time scales, such as 1-, 3-, 6-, and 12-month scales, and therefore, it is capable of analyzing both short-term and long-term drought. Generally, there are various stages of crop development, and each stage lasts around 1 or 3 months. Therefore, we focused on short-term drought conditions, such as 1- and 3-month time scales of SPEI, which are related to crop development. In addition, we applied two different methods—the FAO Penman–Monteith and Thornthwaite methods to estimate evapotranspiration, which is a critical component at the calculation of SPEI.

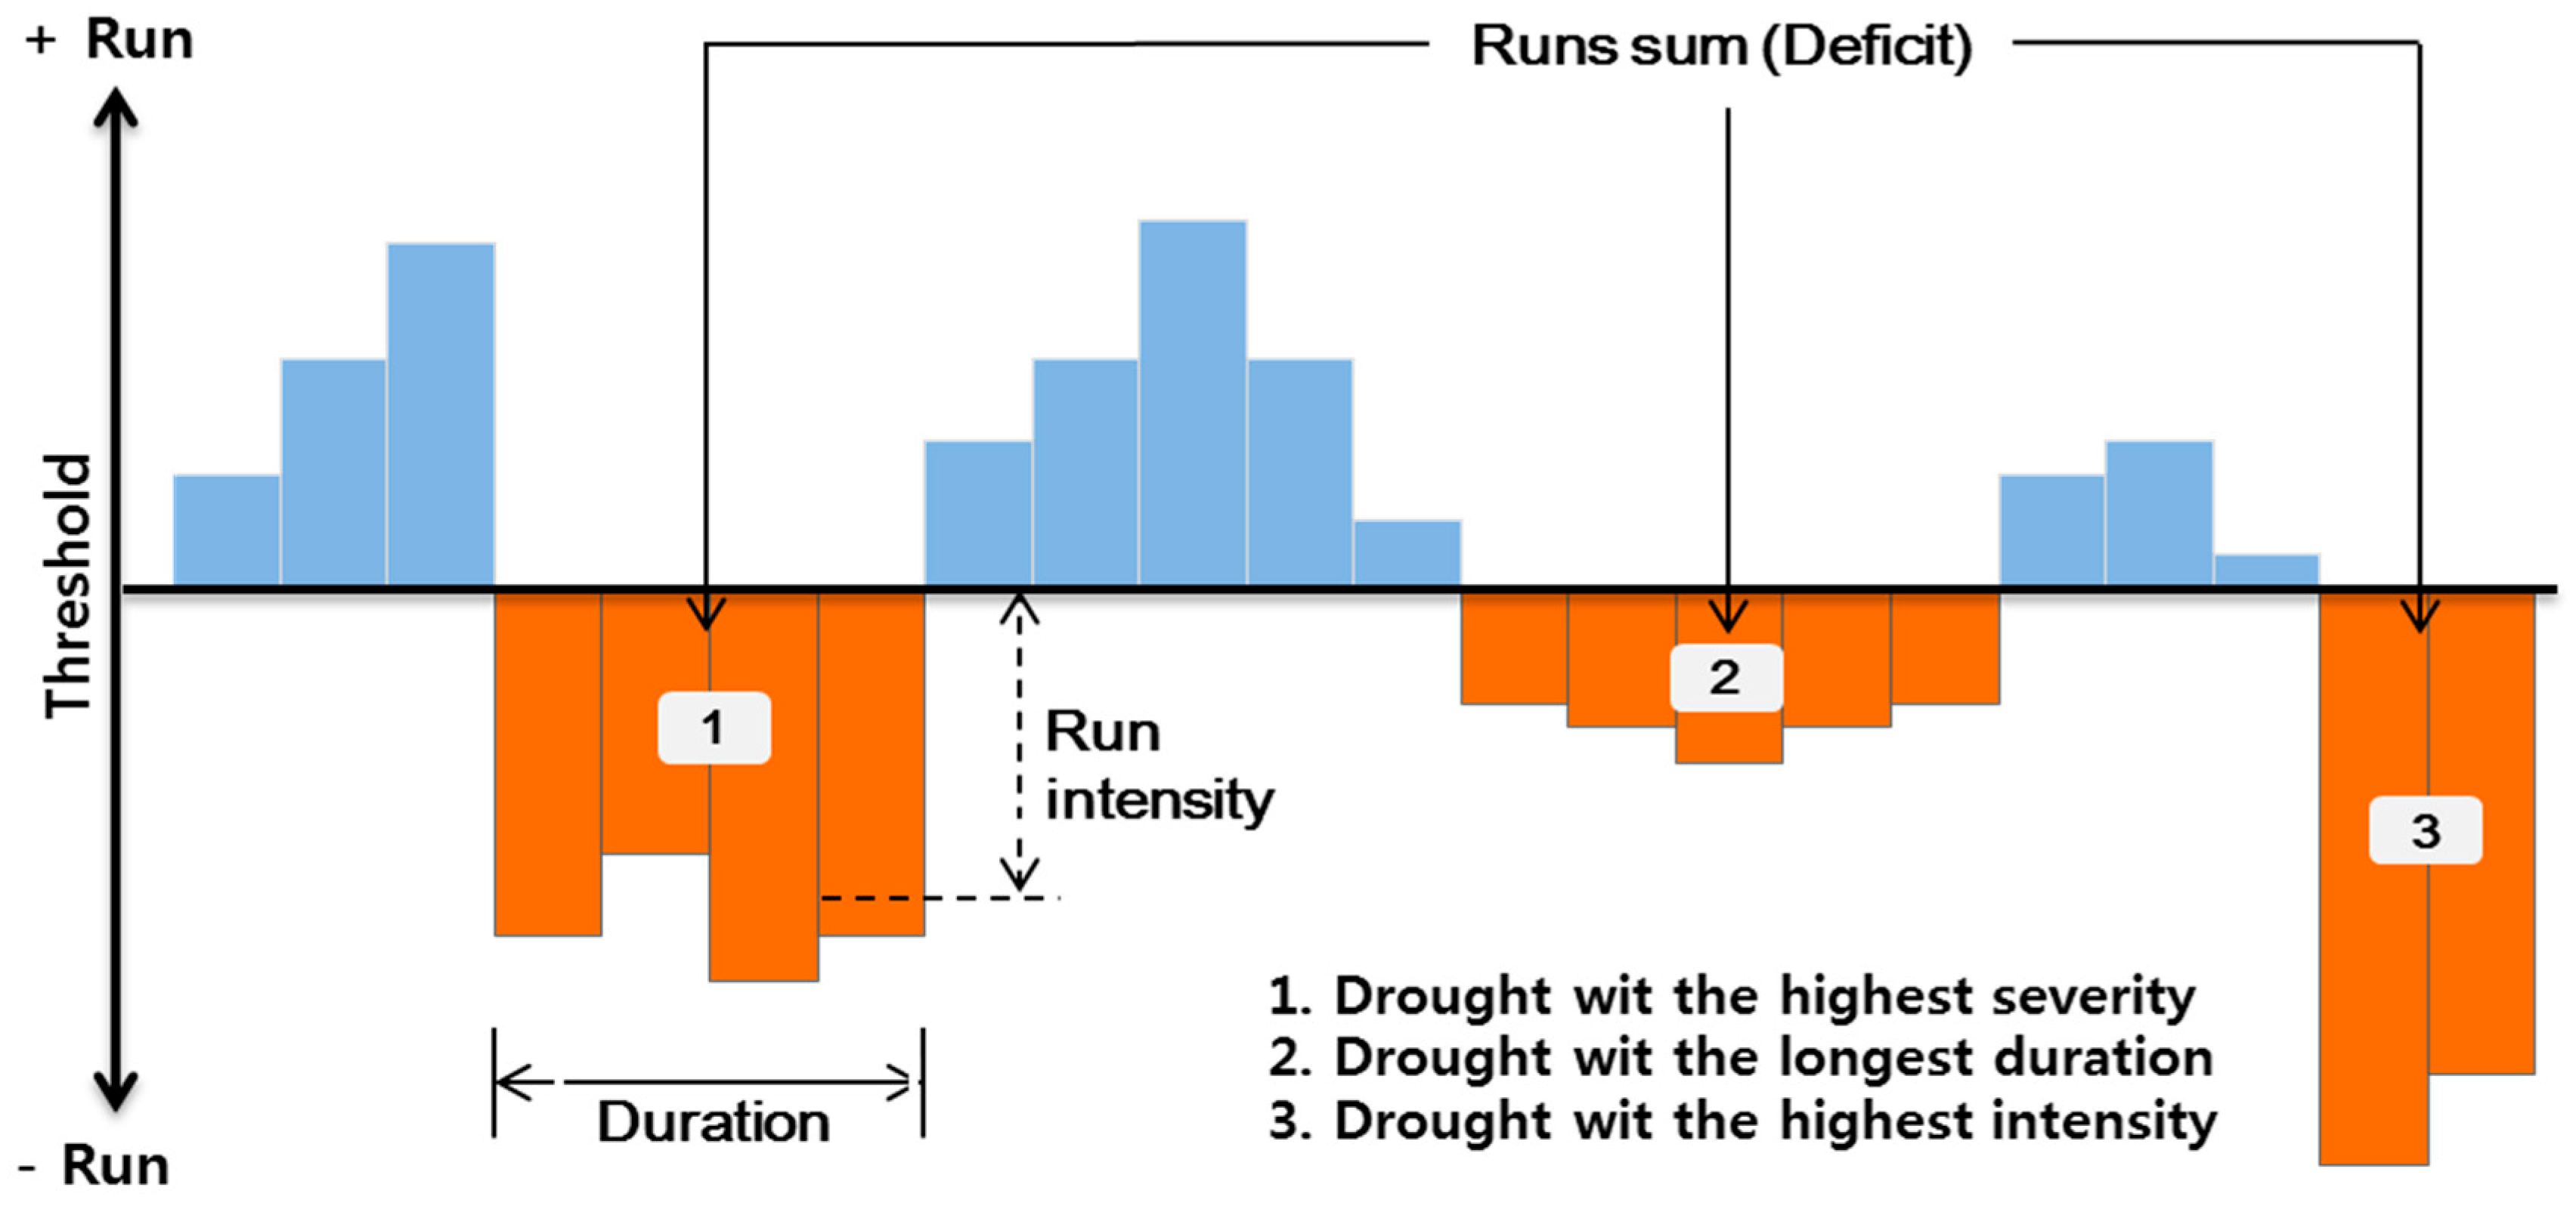
2.2. Analysis of Drought Intensity through Runs Theory

Drought characteristics includes various drought conditions, such as duration, severity, and intensity. A probabilistic methodology widely used in drought characterization is the application of runs theory [34], which allows the estimation of the return periods of extreme events [35]. We applied runs theory to analyze drought characteristics based on SPEI_th and SPEI_pm. Figure 1 shows the drought characteristics using the run theory for a given threshold level. A run is defined as a portion of the time series of a drought variable, in which all values are either below or above the selected truncation level; accordingly, it is called either a negative run or a positive run [5]. In runs theory, drought intensity is the average value of a drought parameter below the threshold level, which is measured as the drought severity divided by the duration [36]. In this study, we set SPEI of −1 as the threshold value for identifying drought conditions, with SPEIs below −1 being used to estimate drought intensity.

2.3. Analysis of Drought Trends through Mann–Kendall Test

The Mann–Kendall (MK) test [37], a rank-based nonparametric method, is applied in this study to detect the existence of trend [38]. Under the null hypothesis H0 that a series { x 1 ,   x 2 , , x N } comes from a population where the random variables are independent and identically distributed, the MK test statistic is given by Equation (4):
S = i = 1 N 1 j = i + 1 N sgn ( x j x i )
where,
sign   ( x j x i ) =   { + 1 ,     x j > x i     0 ,     x j = x i 1 ,     x j < x i
where S is the test statistic and sign is the function that converts ( x j x i ) to ± 1   or   0 .
To avoid the occurrence of equal values, we may add a small uniformly distributed random value in the interval (0, σ /100), where σ is the standard deviation of the series.
Kendall’s S, which measures the strength of the monotonic trend, is estimated by Equation (5):
τ =   2 S N ( N 1 )
The variance of S, Var(S), for a situation in which there may be ties (i.e., equal values) in the x values, is given by Equation (6) [39]:
σ s 2 = 1 18 [ N ( N 1 ) ( 2 N + 5 )   i = 1 m t i ( t i 1 ) ( 2 t i + 5 ) ]
Under the null hypothesis, the quantity z defined in the Equation (7) is approximately standard and normally distributed:
z = { ( S 1 ) / σ s        if   S > 0        0                  if   S = 0 ( S + 1 ) / σ s       if   S > 0
With a significance level of 0.05 (or 0.1), the null hypothesis of no trend is rejected if | z | > 1.96 (or 1.645). At a given significance level (0.05 or 0.1), we know the corresponding critical value of z; accordingly, we can calculate the corresponding statistic S.

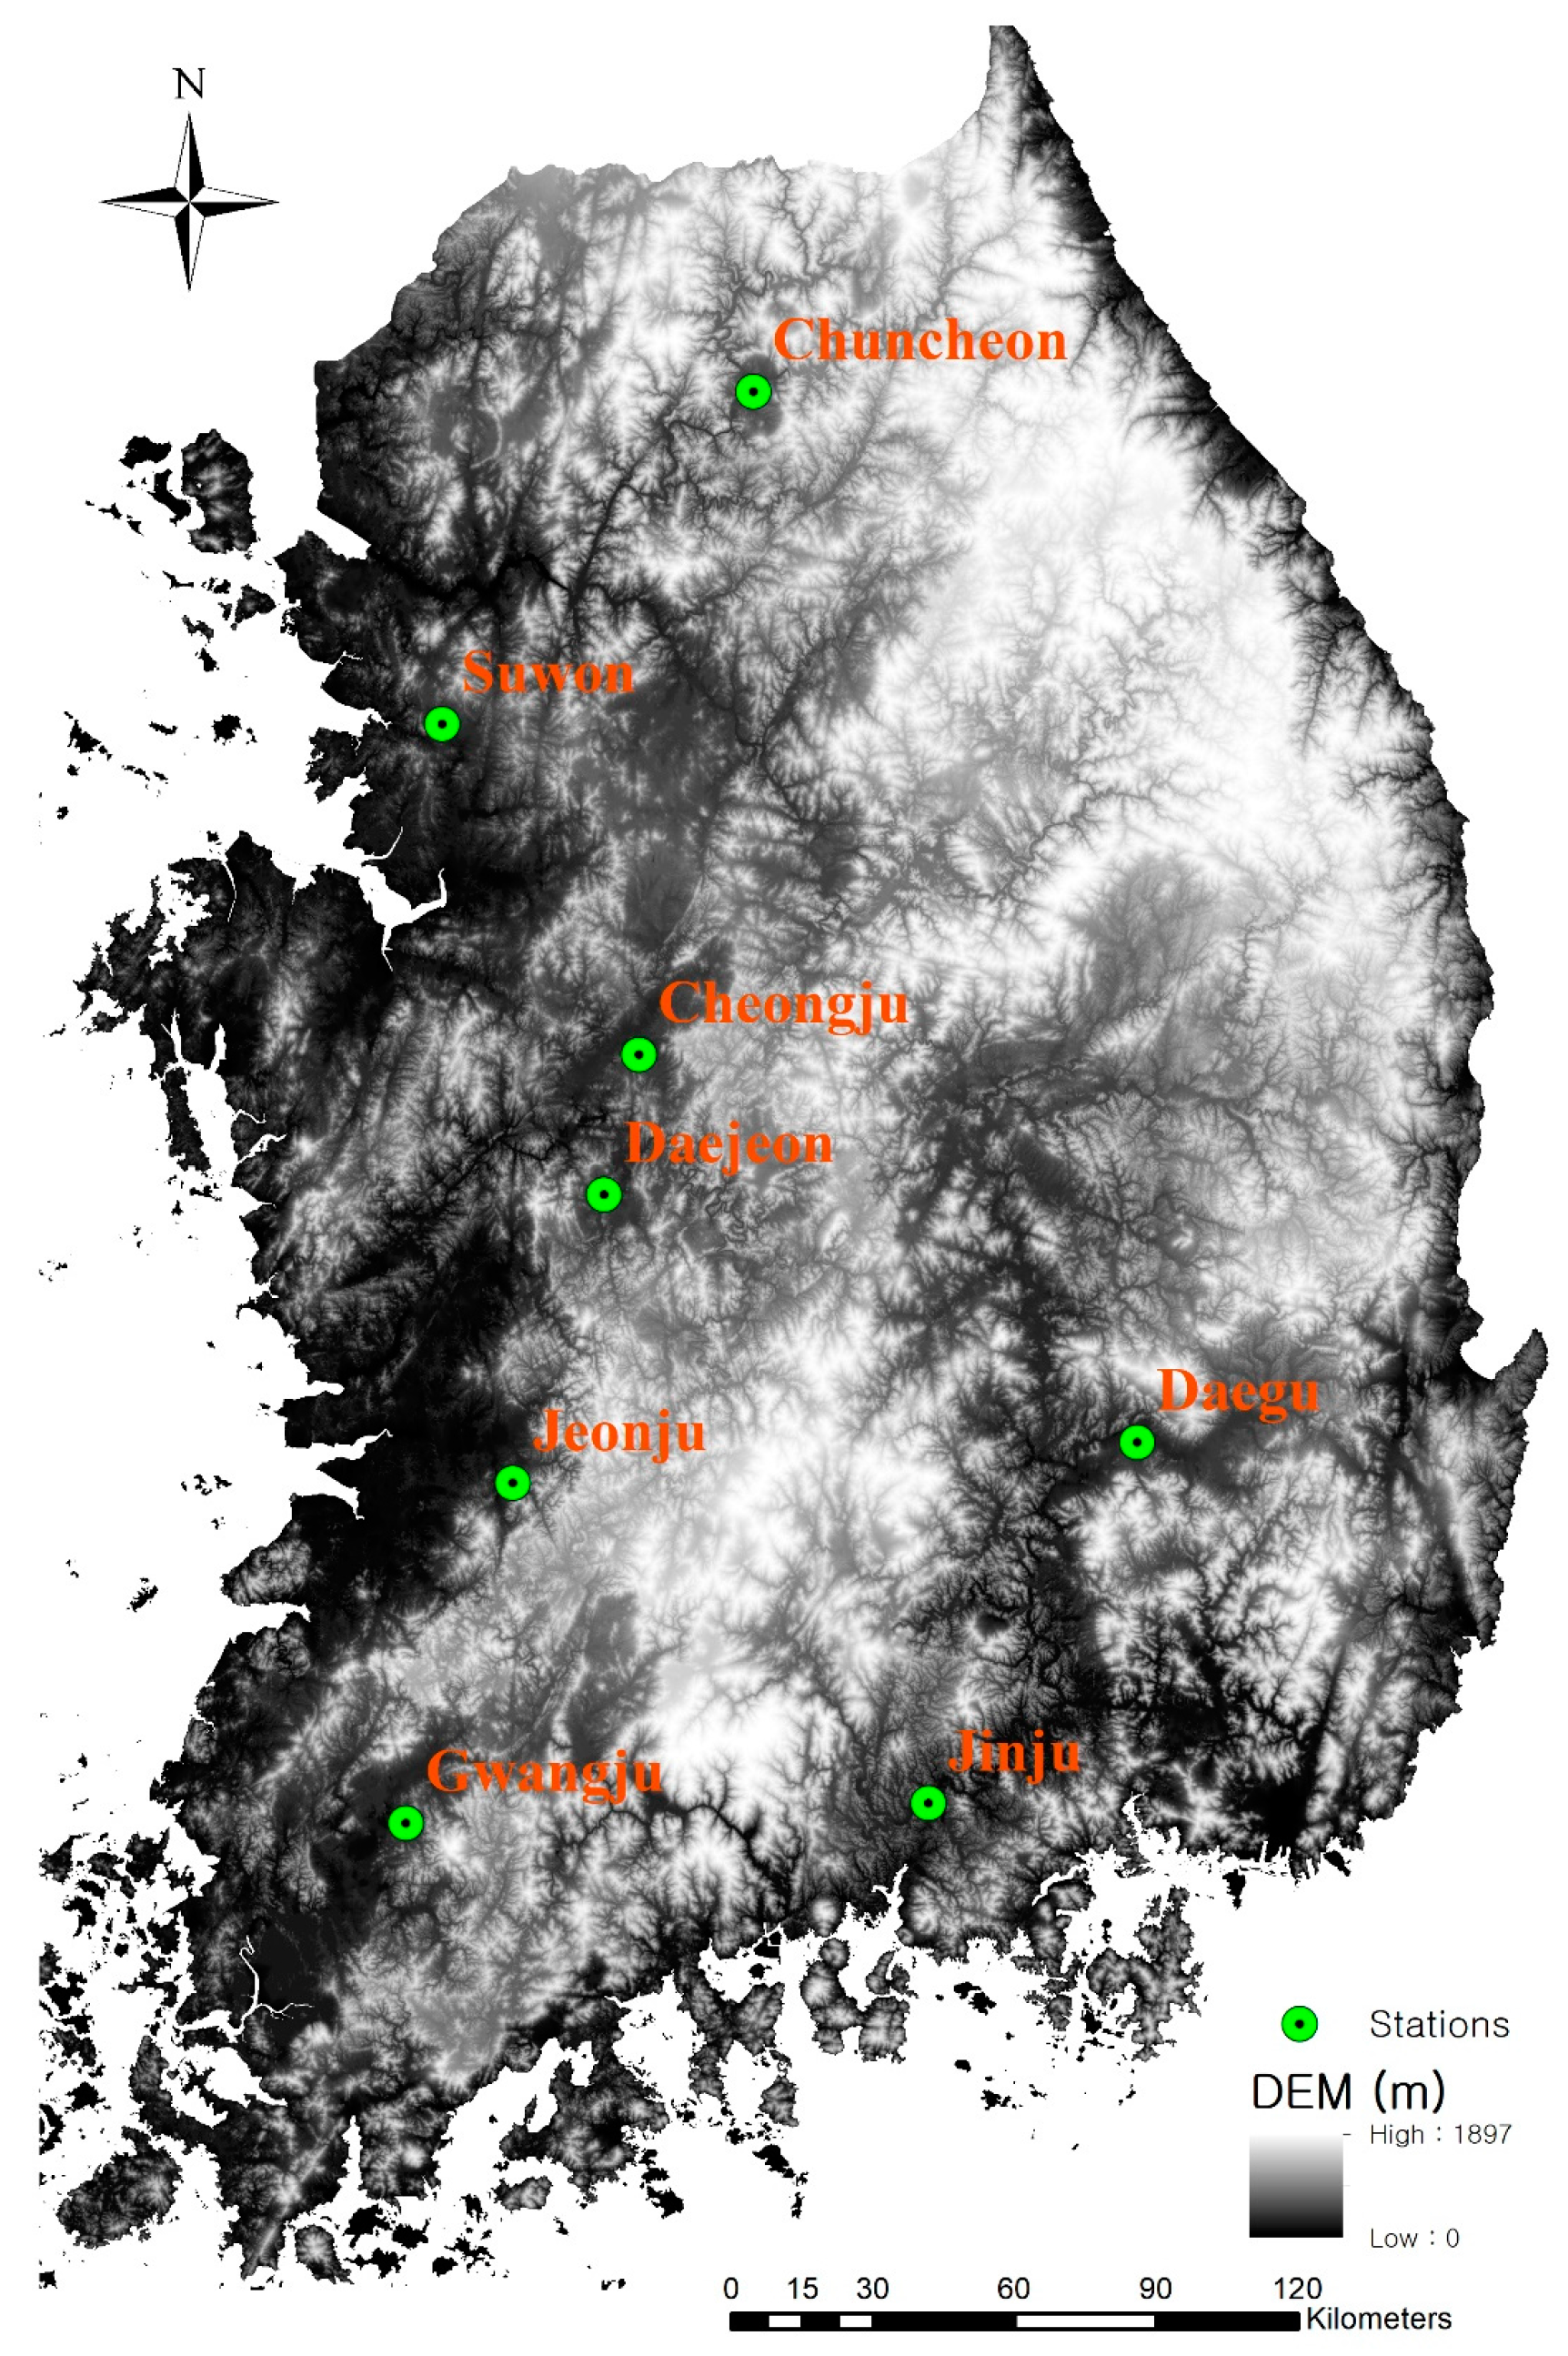
2.4. Site Description

In Korea, the precipitation intensity will increase as a result of climate change, and the number of raining days will decrease [40,41]. In contrast, the crop water demand will increase due to the increase of evapotranspiration resulting from high temperature. Accordingly, agricultural drought could become severe in Korea, and it is necessary to understand the characteristics of agricultural drought with consideration of both meteorological conditions and crop growth, at the same time.
During the past 30 years, Korea suffered from the severe drought damage at least once every 5–8 years [30,42]. In addition, moderate drought has happened annually in the regional and national area since 1990 [42]. The highest agriculture water demand in Korea generally occurs from May to August, and the severe drought during this season caused extensive damage to rice production in 1981, 1982, 2000, and 2001 [30]. Accordingly, Korea might be listed as vulnerable to drought, and it is important to understand the characteristics of drought trends using the drought index.
In this study, eight locations in South Korea, nationwide, were selected, as shown in Figure 2. The northeast region is representative of mountainous terrain, and the largest farmland is located in the western region, where there are wild plains. We selected 8 meteorological stations covering the main agricultural fields. Four stations—the Chuncheon (code: 101), Suwon (119), Cheongju (131) and Daejeon (133)—are located in the northern and central regions, which are located between 36 and 38° N; while the others—the Daegu (141), Jeonju (146), Gwangju (156), and Jinju (192) stations—are located in the southern region, between 34 and 36° N. The annual mean temperature and rainfall for the stations between 1981 and 2010 were examined, and the results are shown in Table 2. The highest annual mean temperature among the target locations was observed in Daegue, while the lowest temperature was in Chuncheon. The largest volume of annual rainfall was observed in Jinju, near the south coast of the Korean Peninsula.

3. Results and Discussion

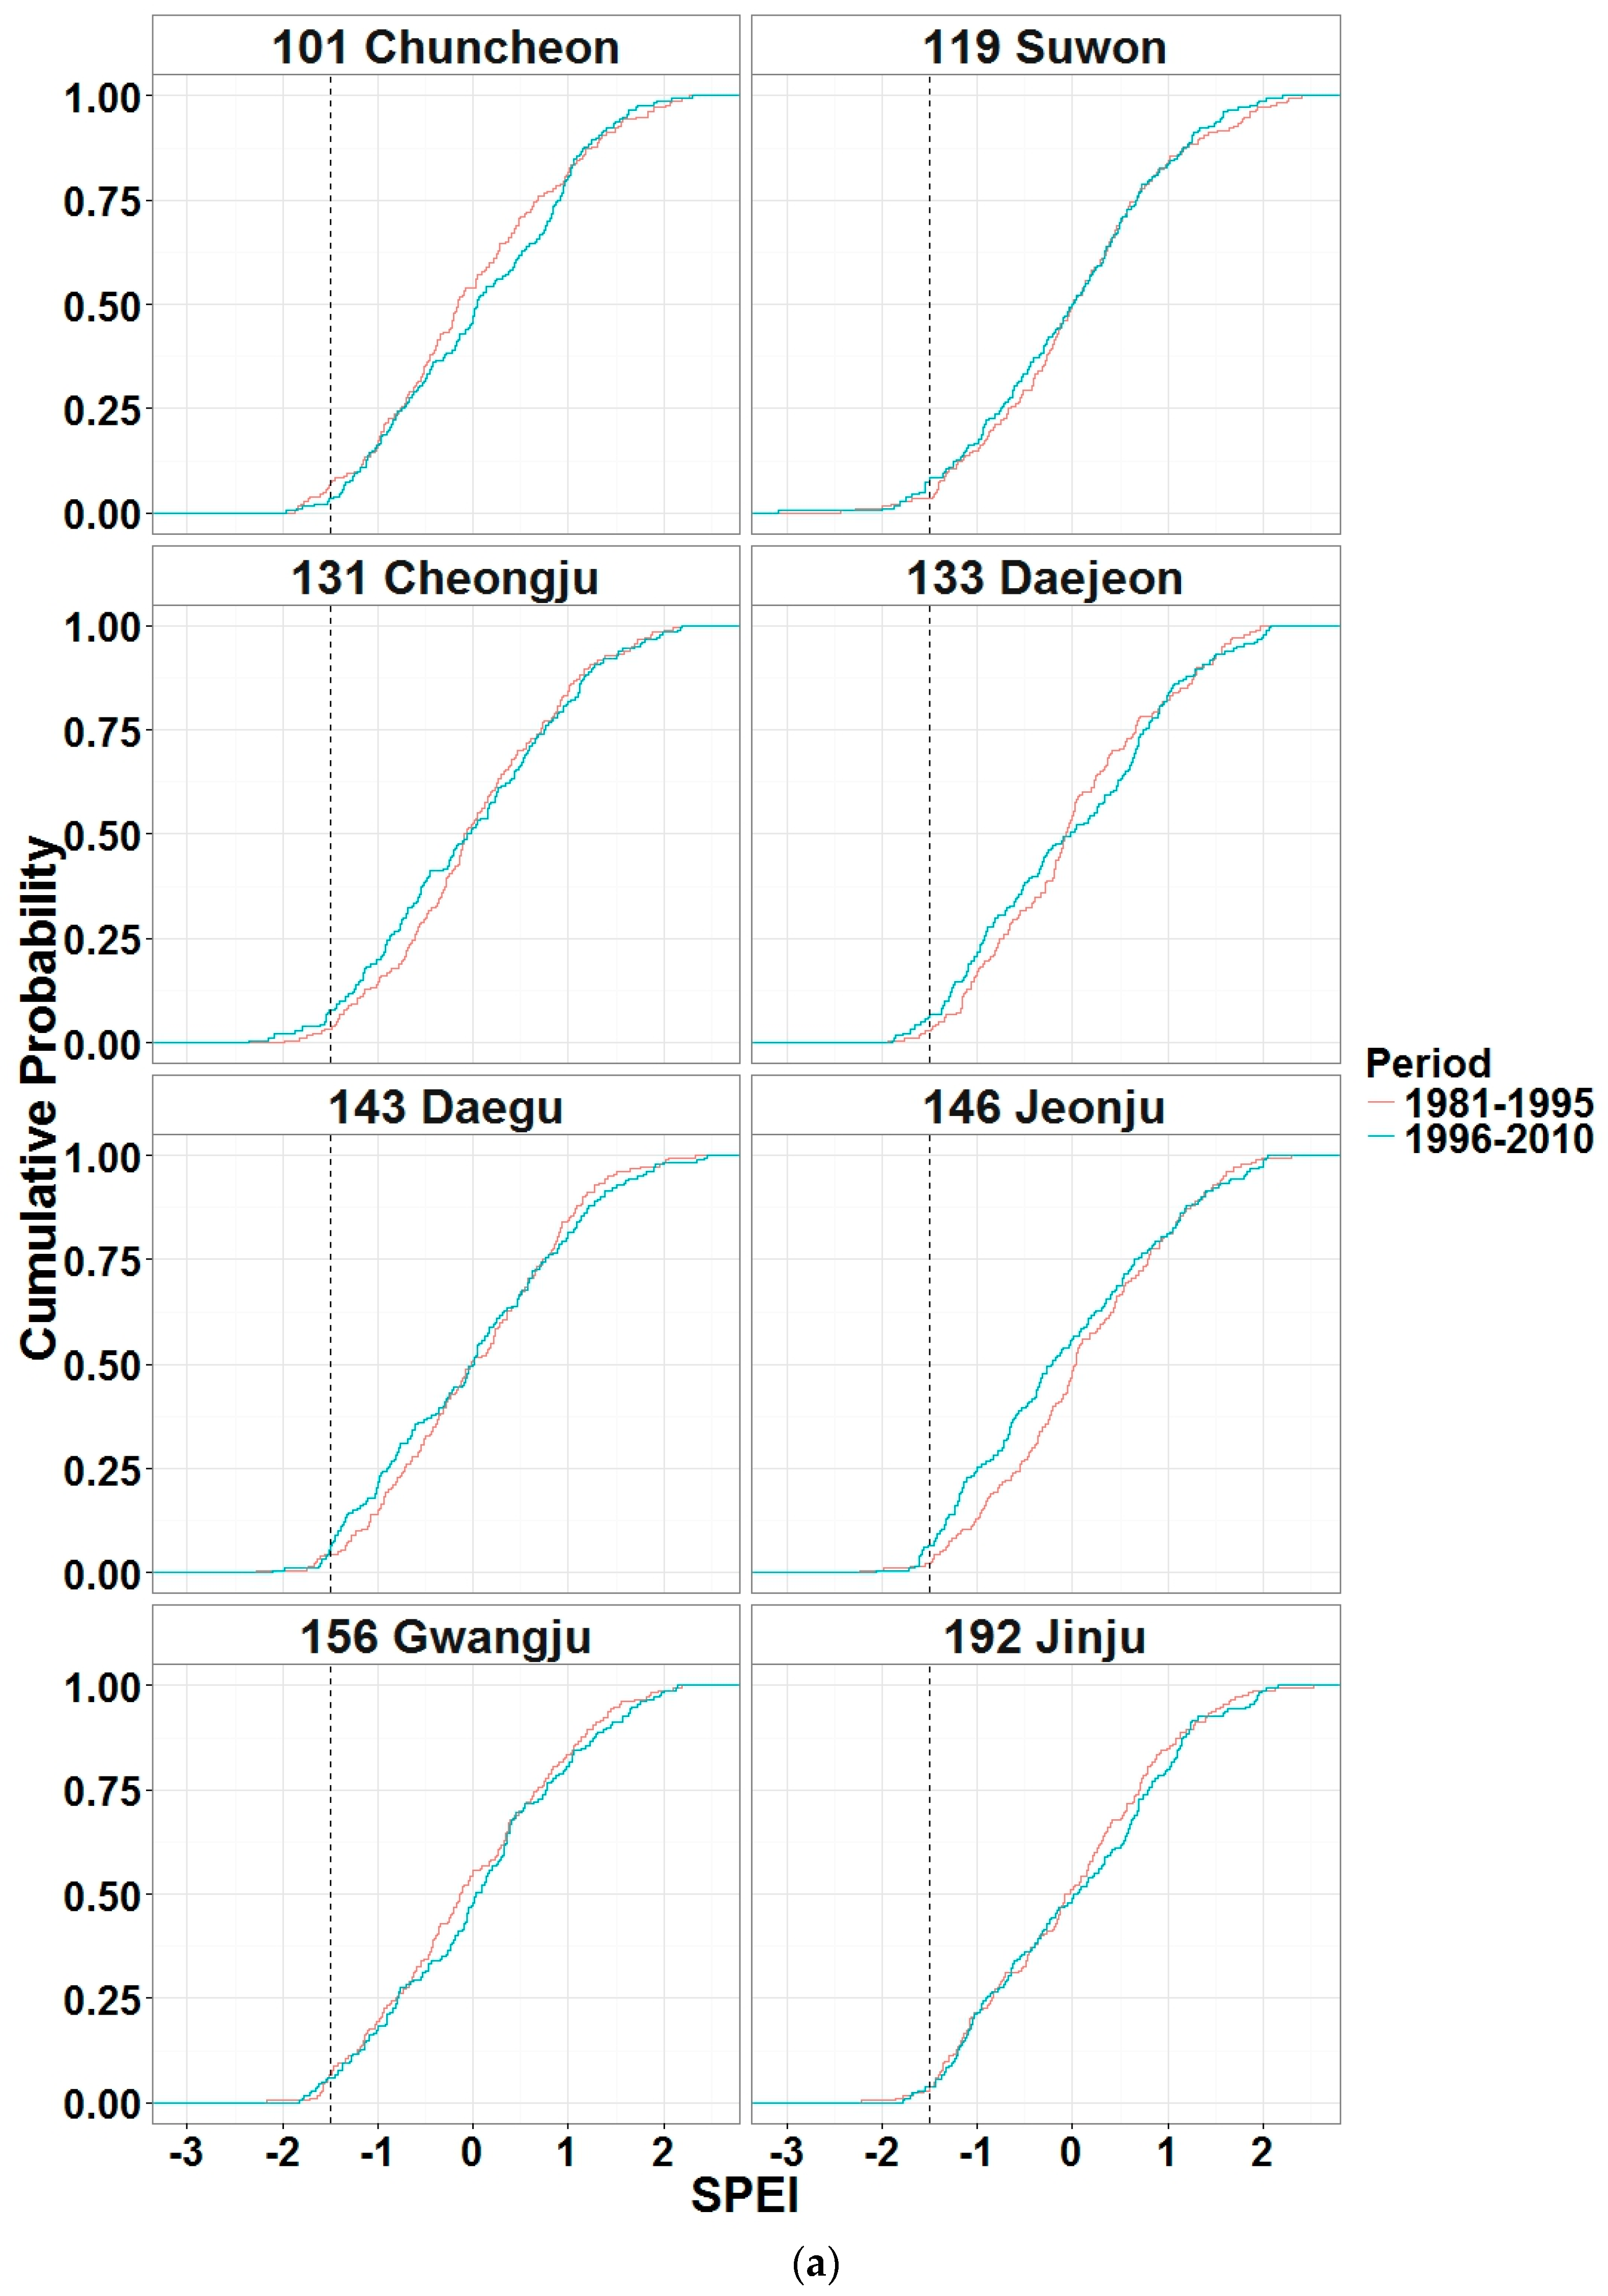
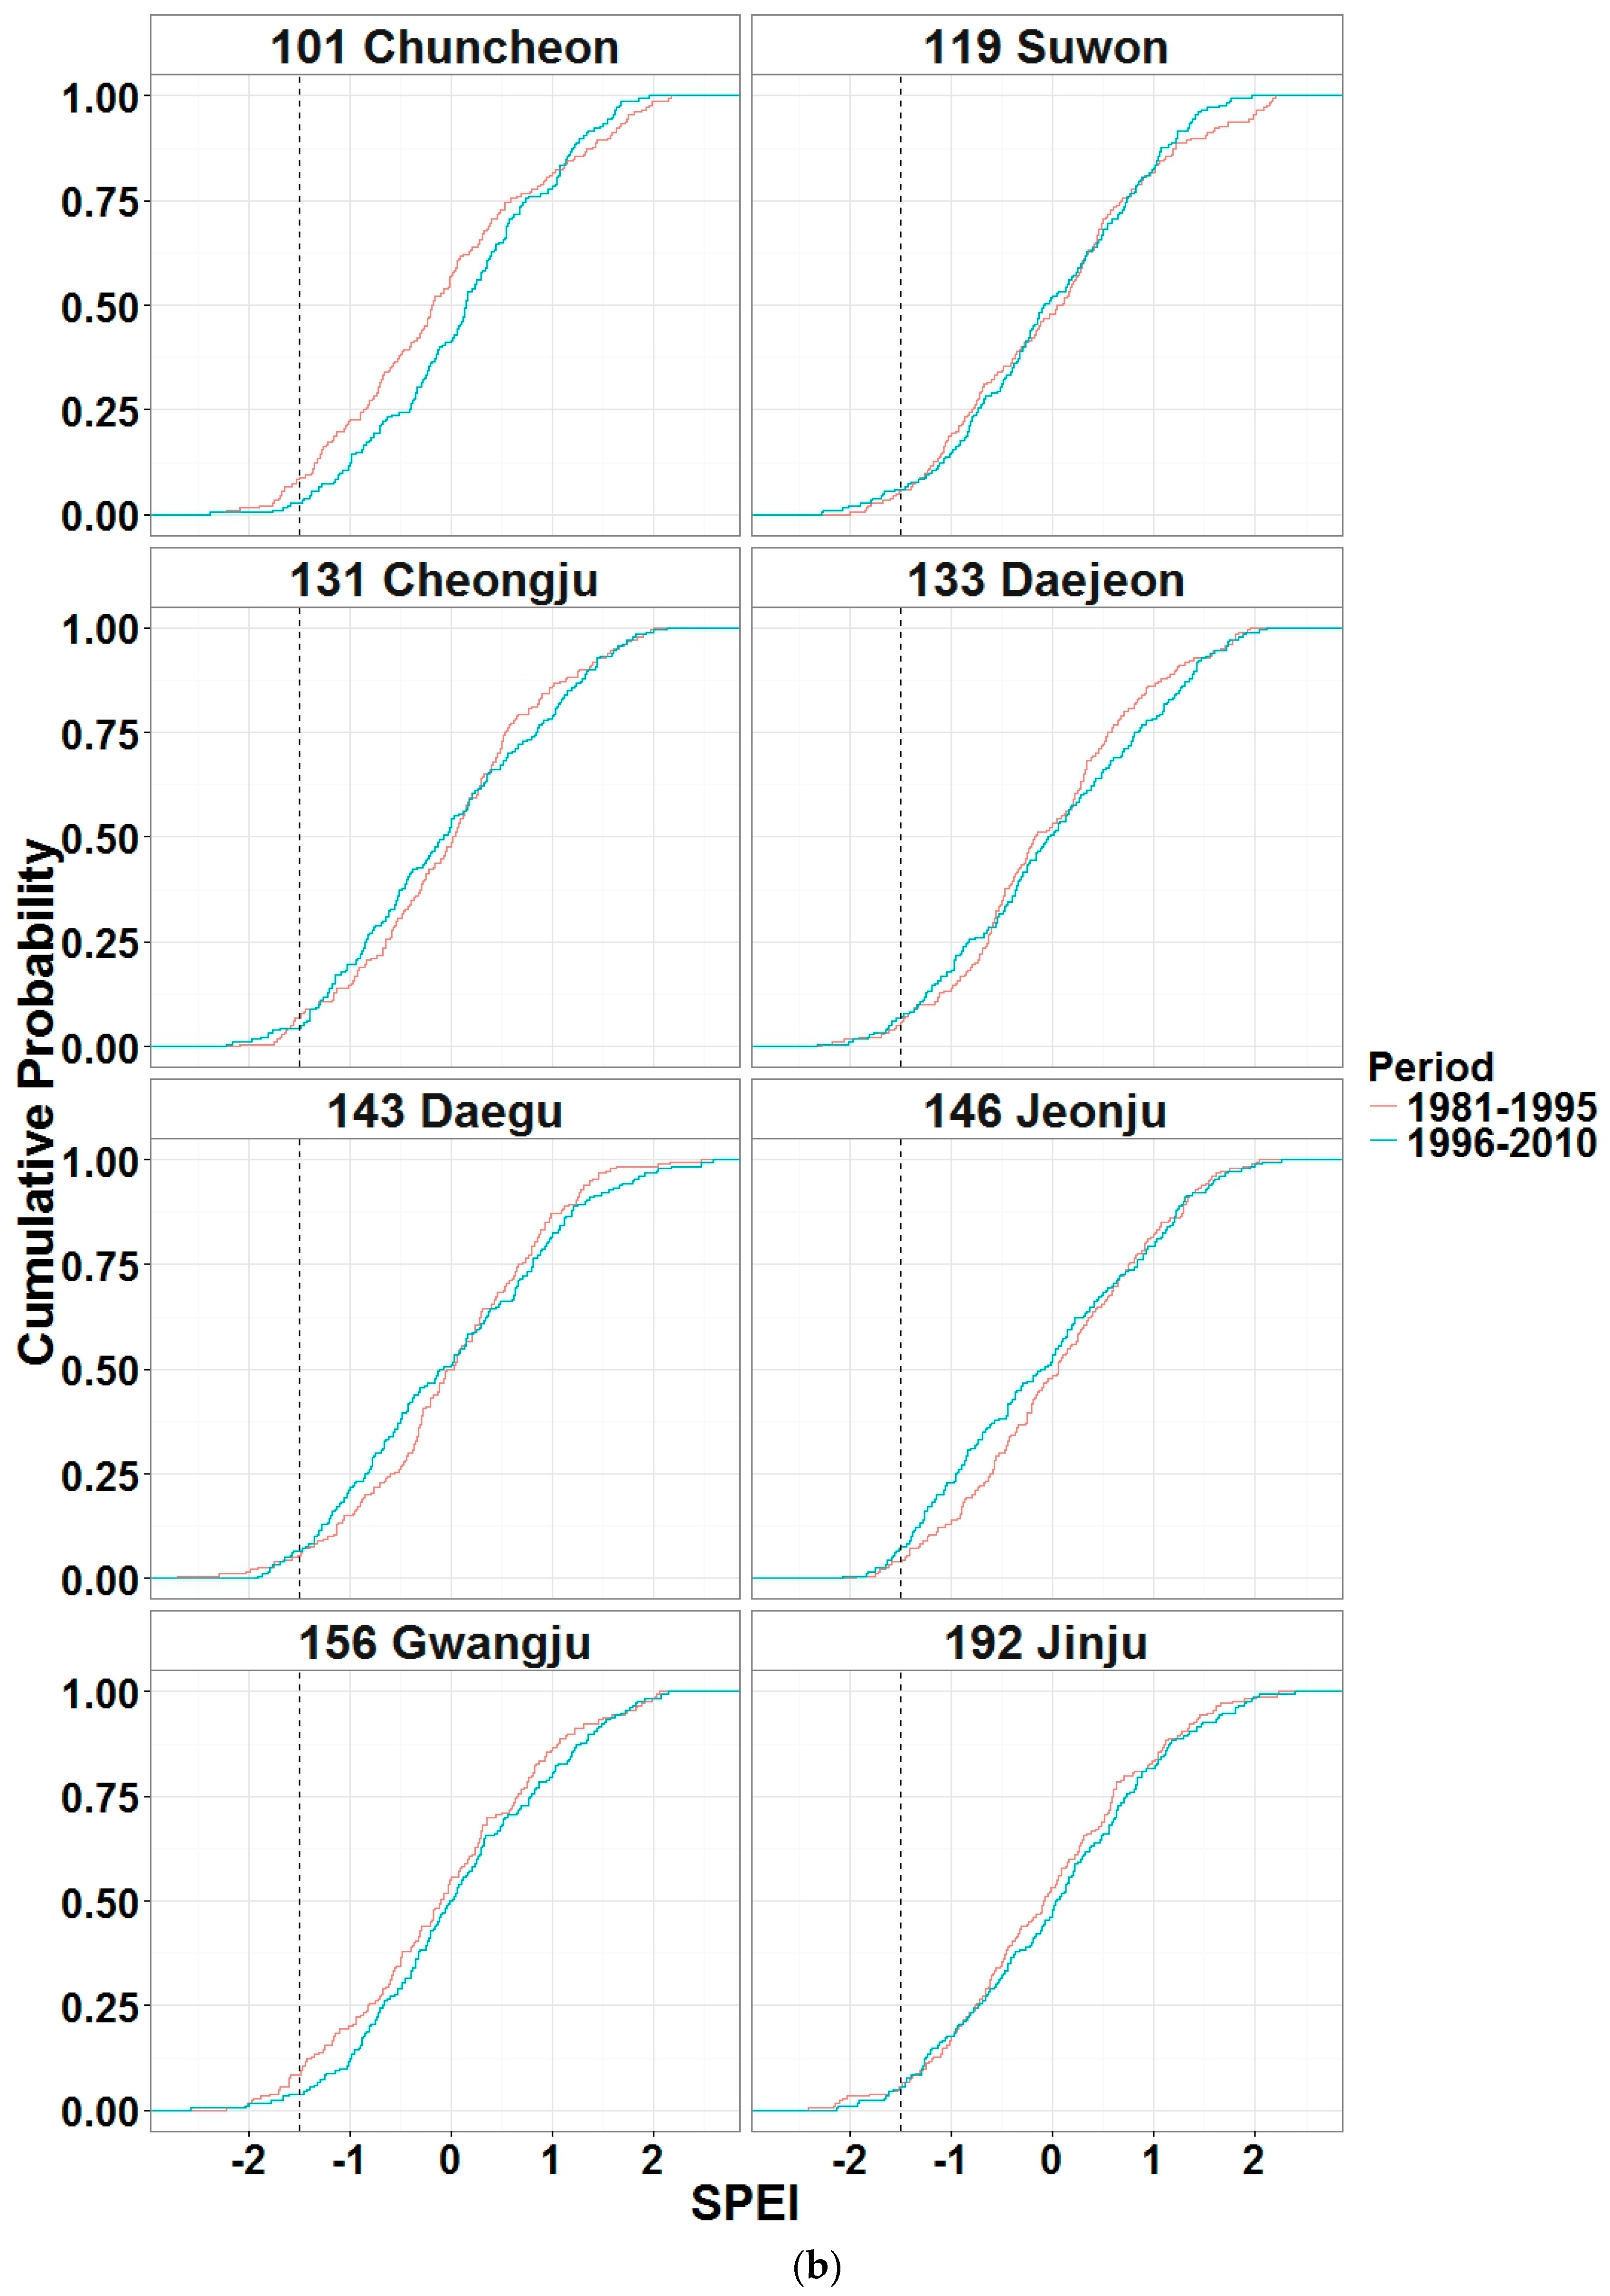
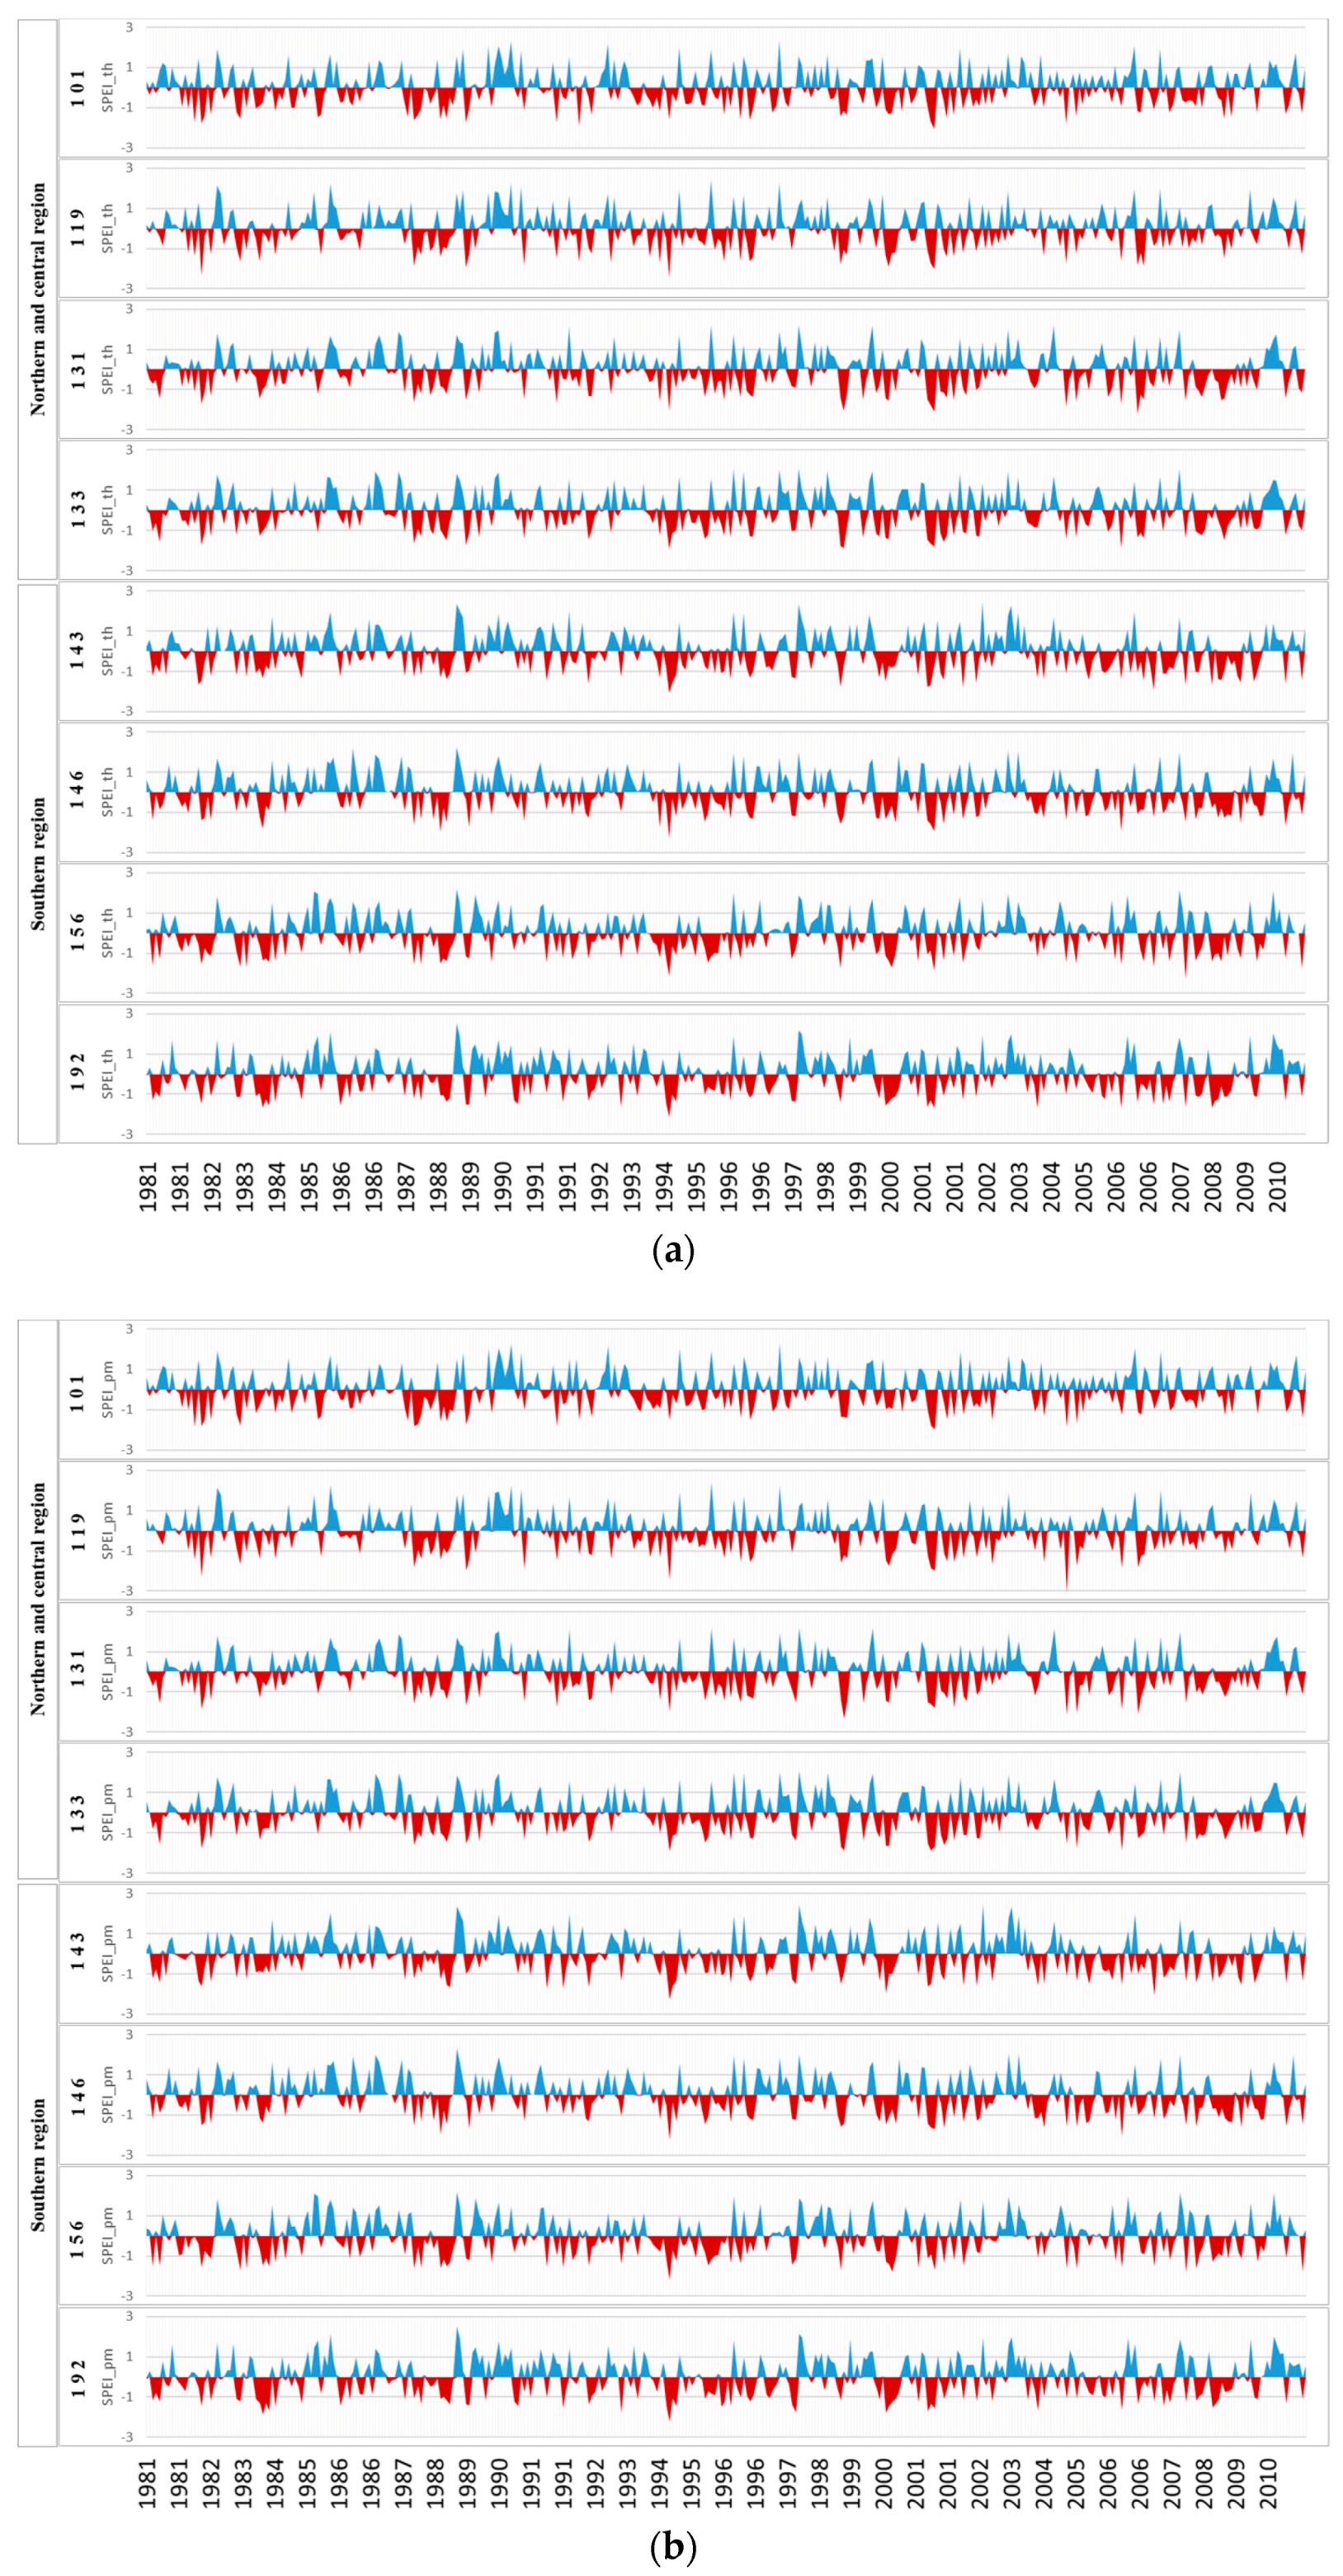
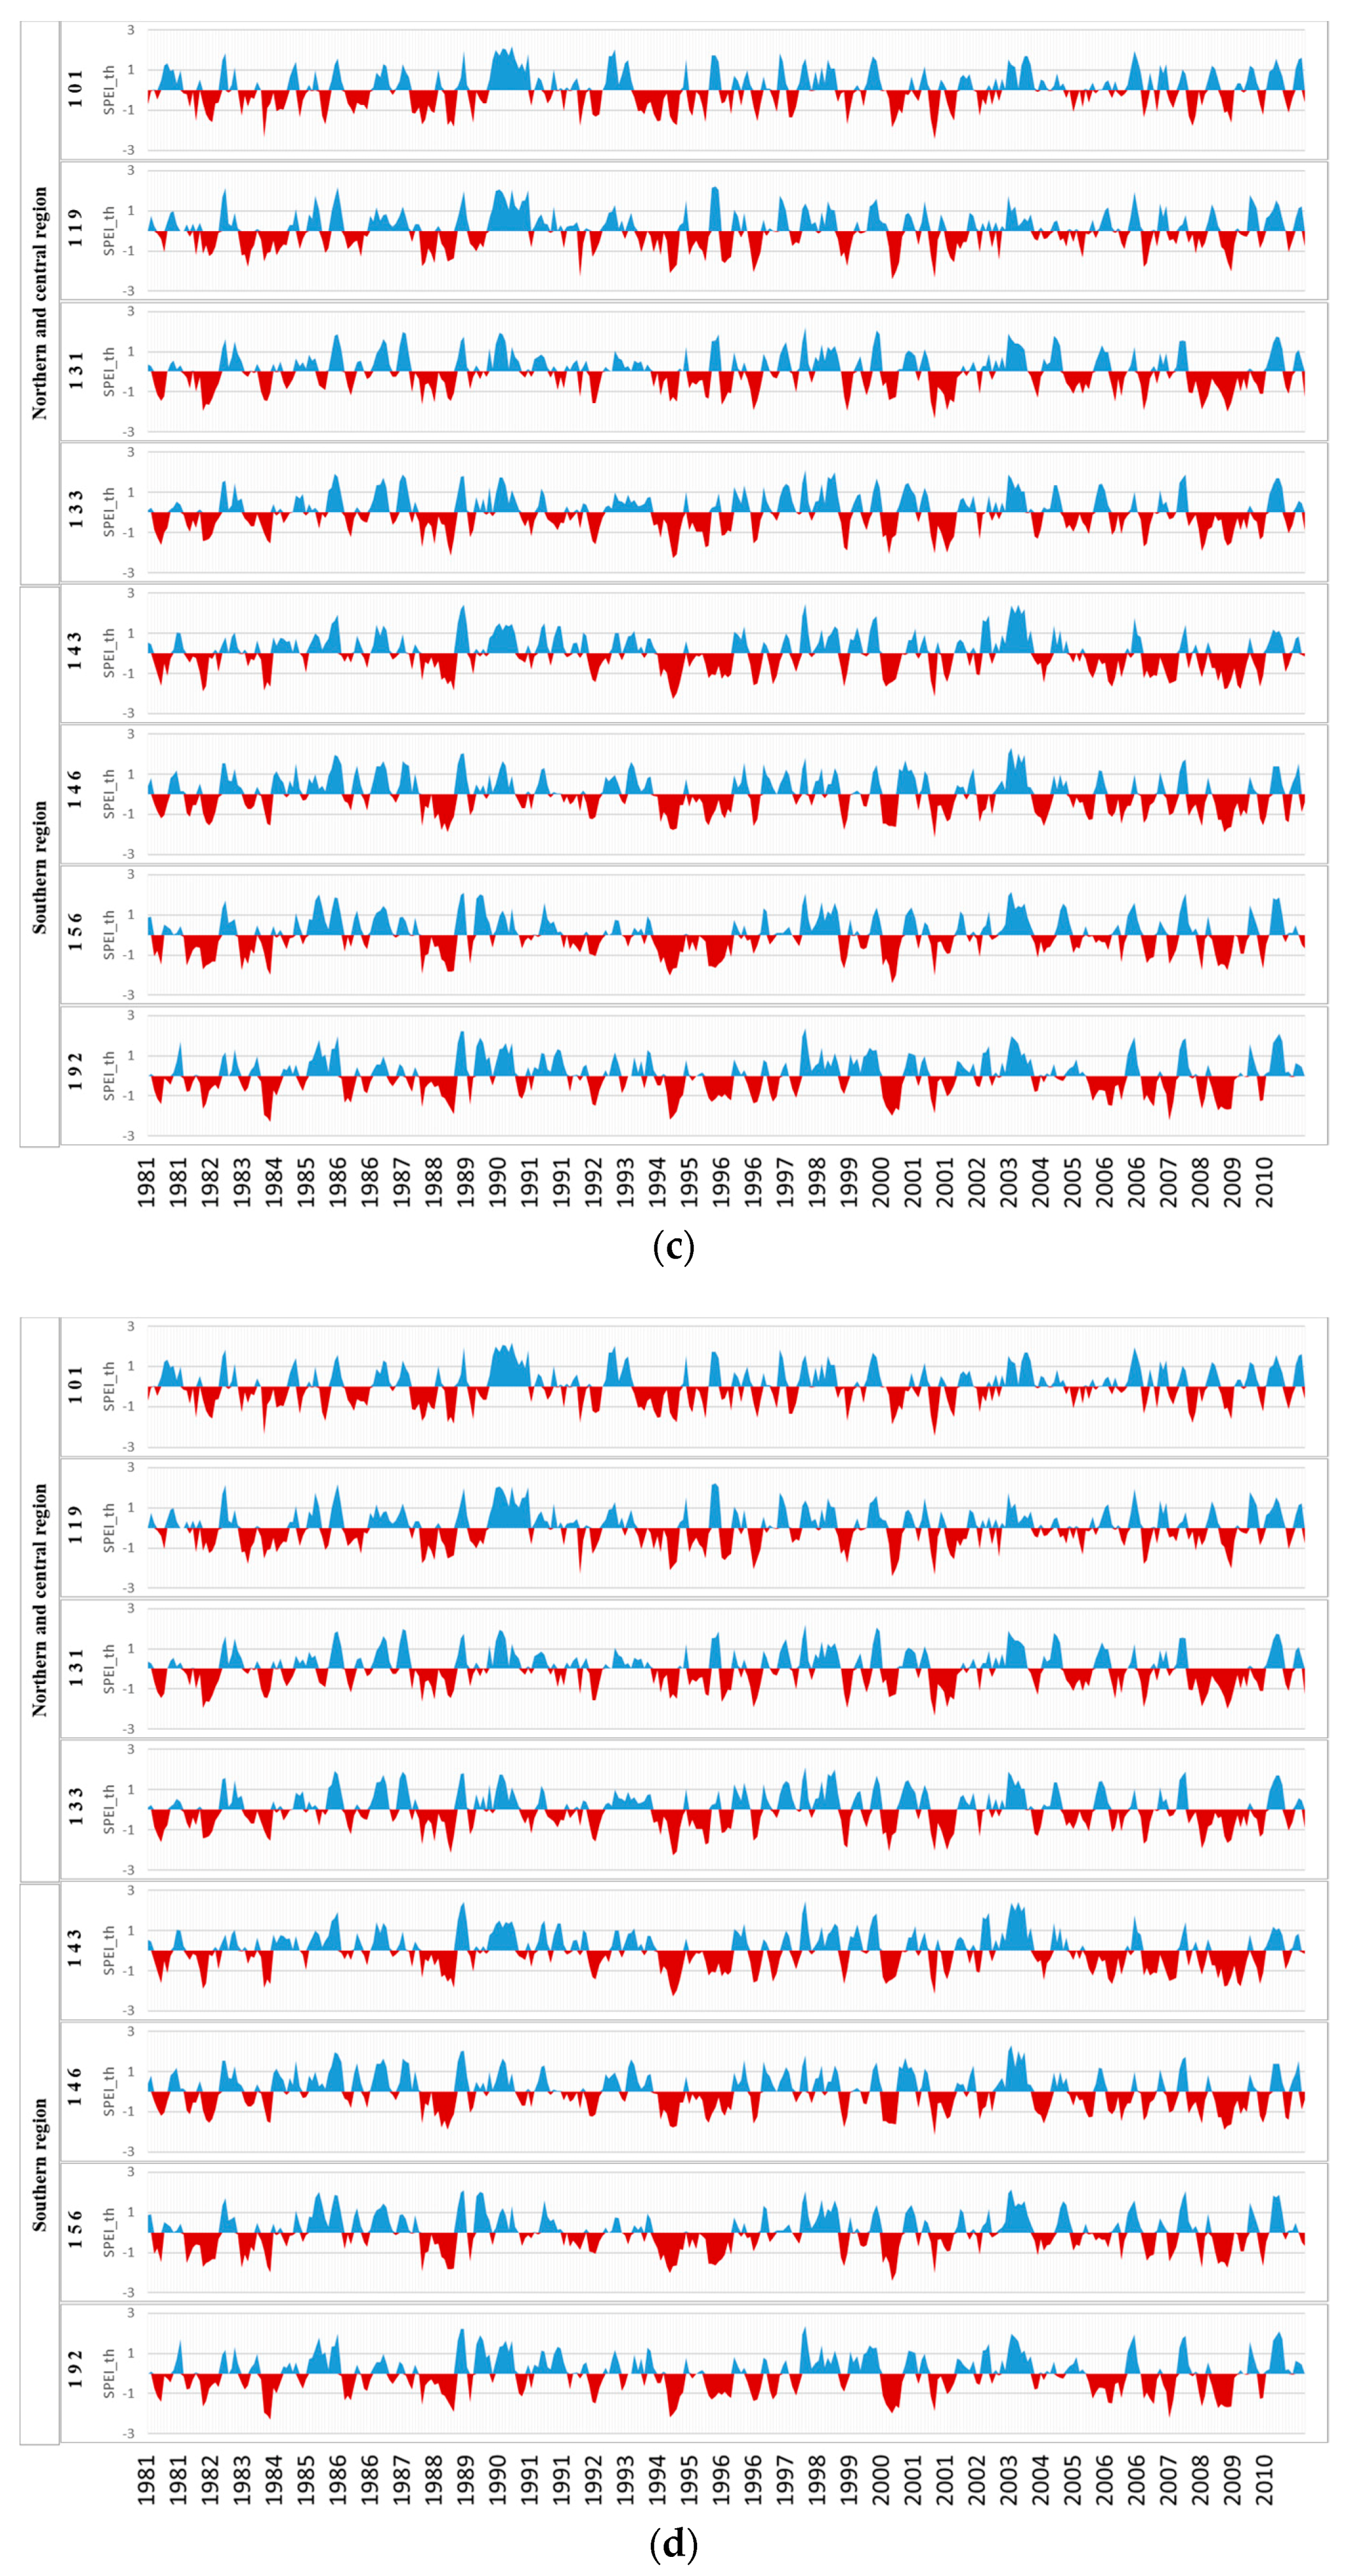
3.1. Calculation of SPEI from 1981 to 2010

To calculate SPEIs, we conducted the goodness of fit by the Kolmogorov–Smirnov method and identified that the log-logistic distribution was suitable for D series in all stations at a 0.01 significance level. In addition, the log-logistic distribution can account for negative values, and it is capable of adopting different shapes to model the frequencies of the D series at different time scales [17]. Table 3 shows the results of the goodness of fit test of the D series in Chuncheon (101) as an example result.
Based on log-logistic distribution, 1- and 3-month SPEIs were calculated as the drought index from 1981 to 2010, and the results are shown in Figure 3. According to the Drought Impact Survey Report in Korea, major drought events occurred in Korea during the periods 1981–1982, 1994–1995, and 2001–2007 [43,44]. The results of the SPEIs in this study are able to reflect these major drought events. In the northern and central regions, the lowest 1-month SPEIs in August were found for Cheongju and both the 1-month SPEI_th and SPEI_pm were calculated at −1.6 (severely dry) in 1988, followed by Chuncheon (−1.6), and Suwon (−1.4). The frequency of drought was higher in the southern region than the northern and central regions. In 1994, the 1-month SPEI_th and SPEI_pm in July were −2.6 and −2.3 (extremely dry), respectively in Daegu. In addition, SPEIs below −2.0 were estimated for Jeonju, Gwangju, and Jinju in July, 1994. With regard to 3-month SPEIs, drought conditions were shown clearly in 1994. In particular, short-term drought conditions continued during 1994–1997 and 2006–2009. These results indicated that more severe short-term drought had occurred in recent years, especially in the southern region, rather than the northern and central regions, as shown in Figure 3c,d.

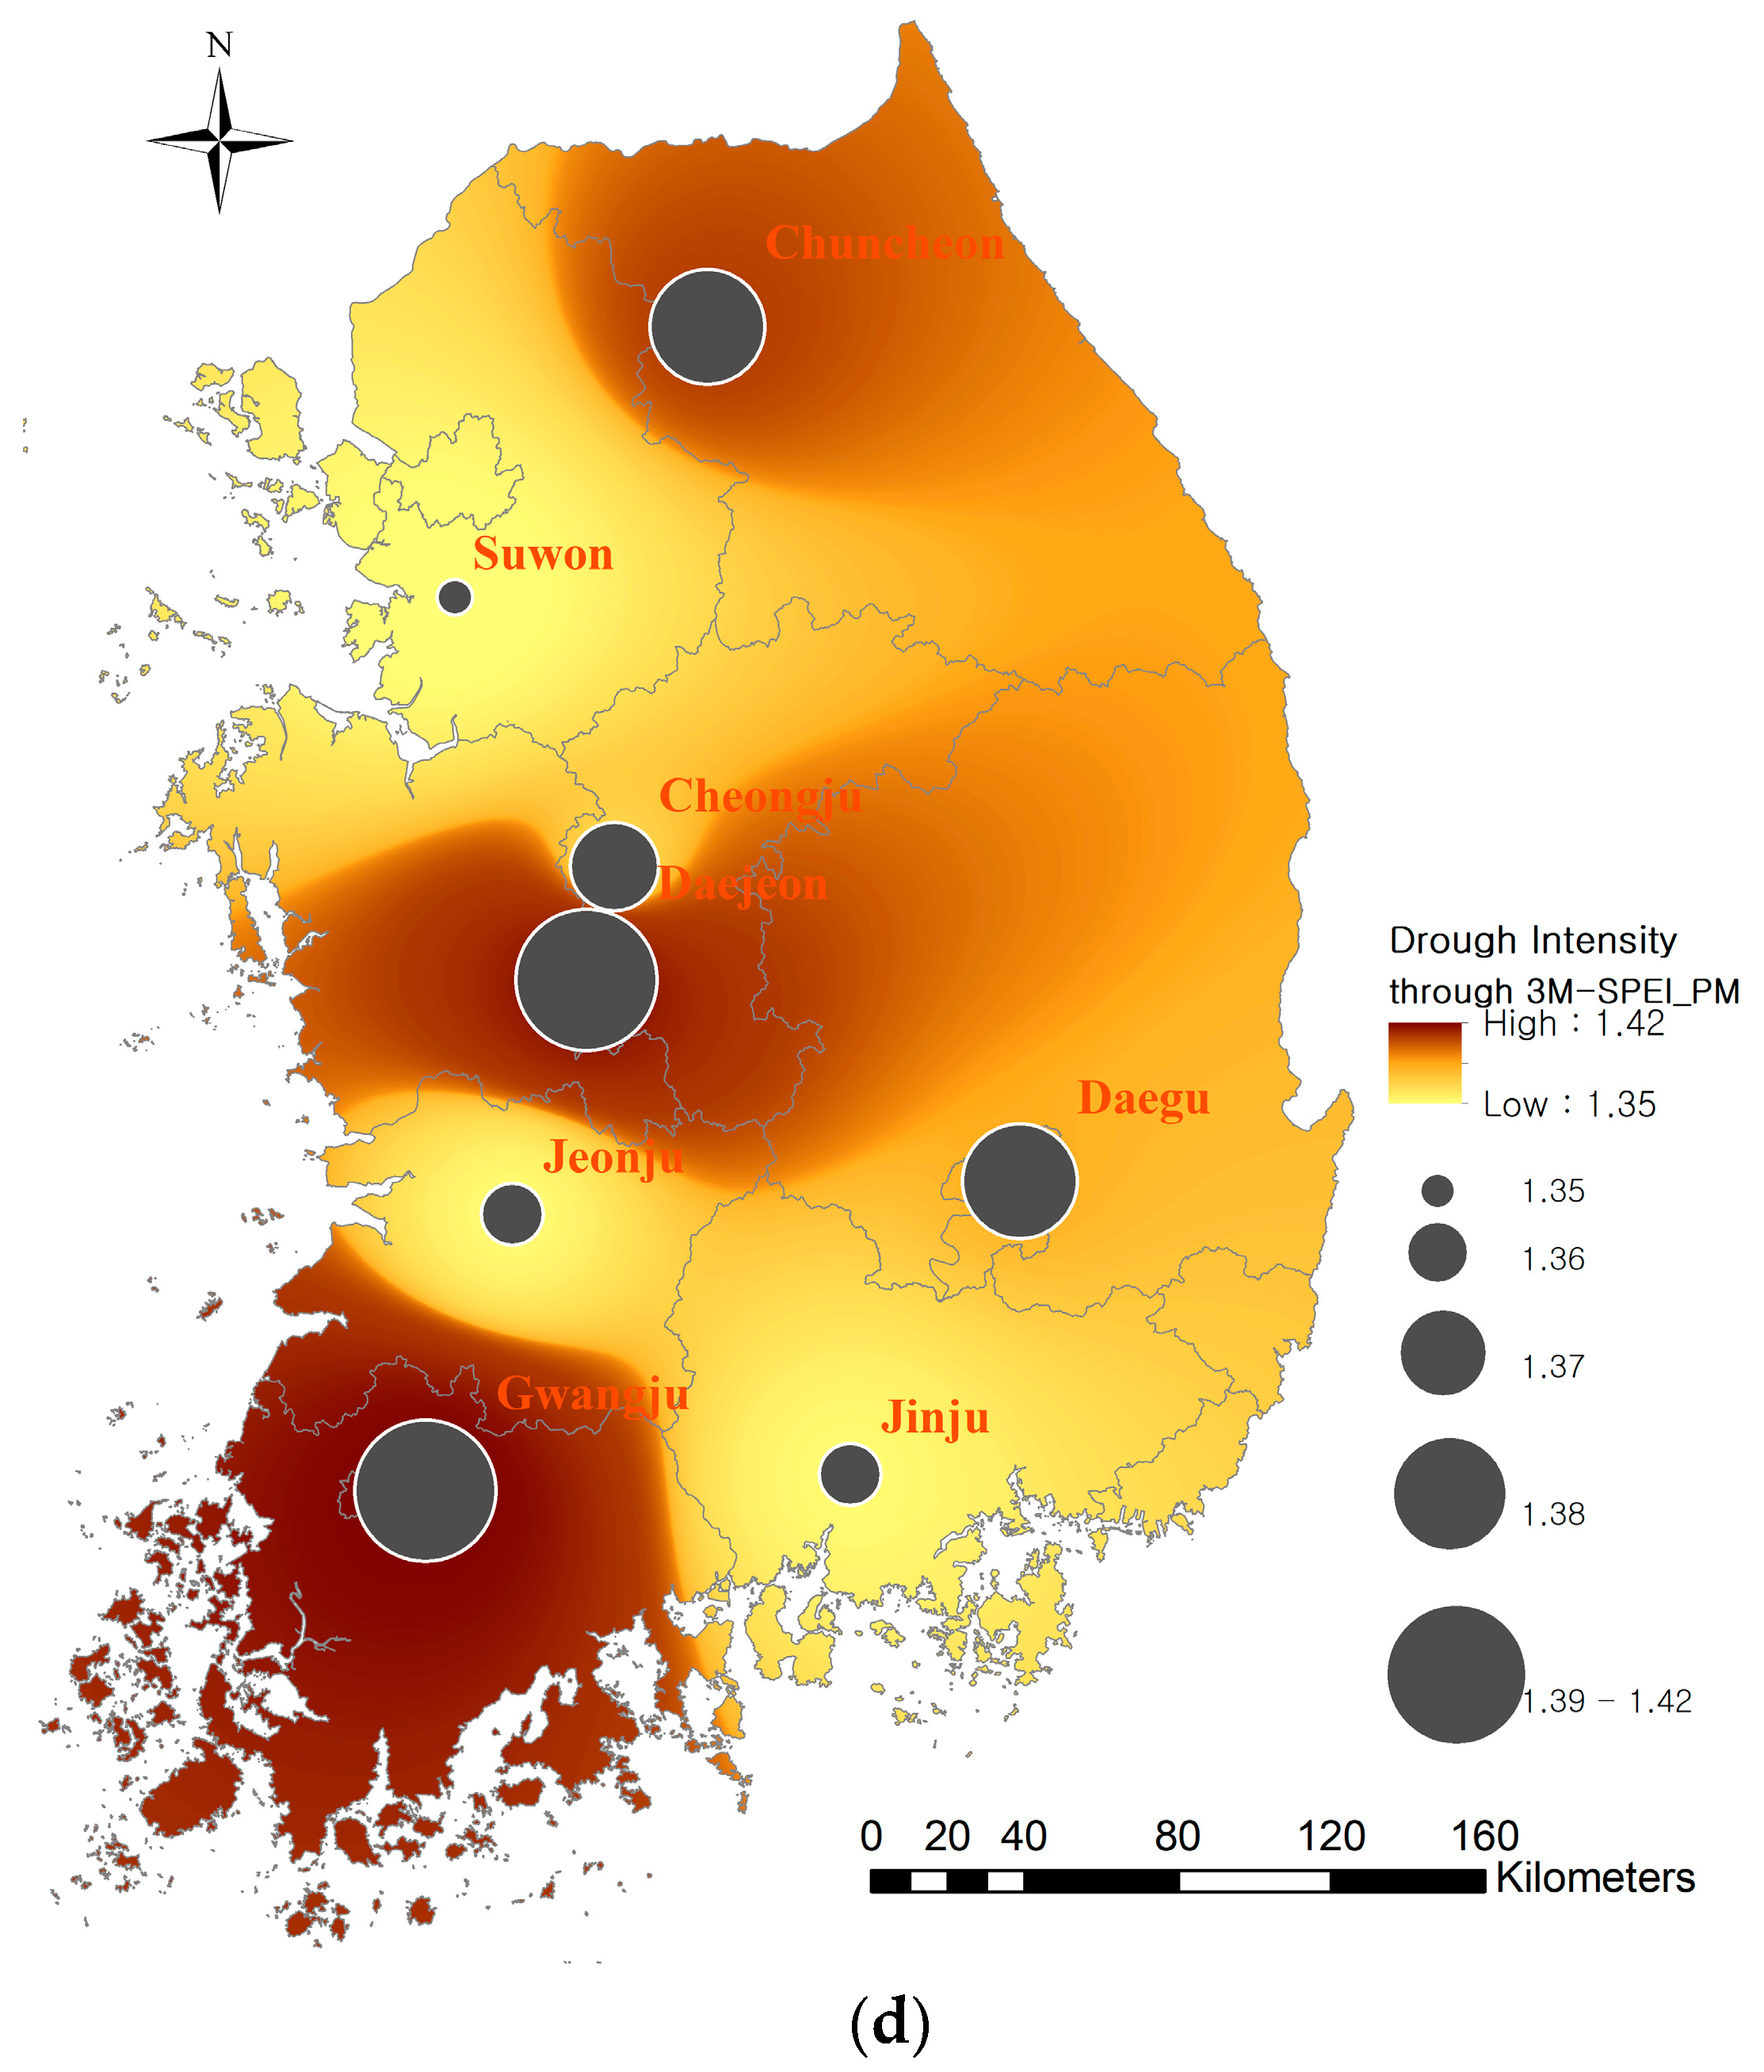
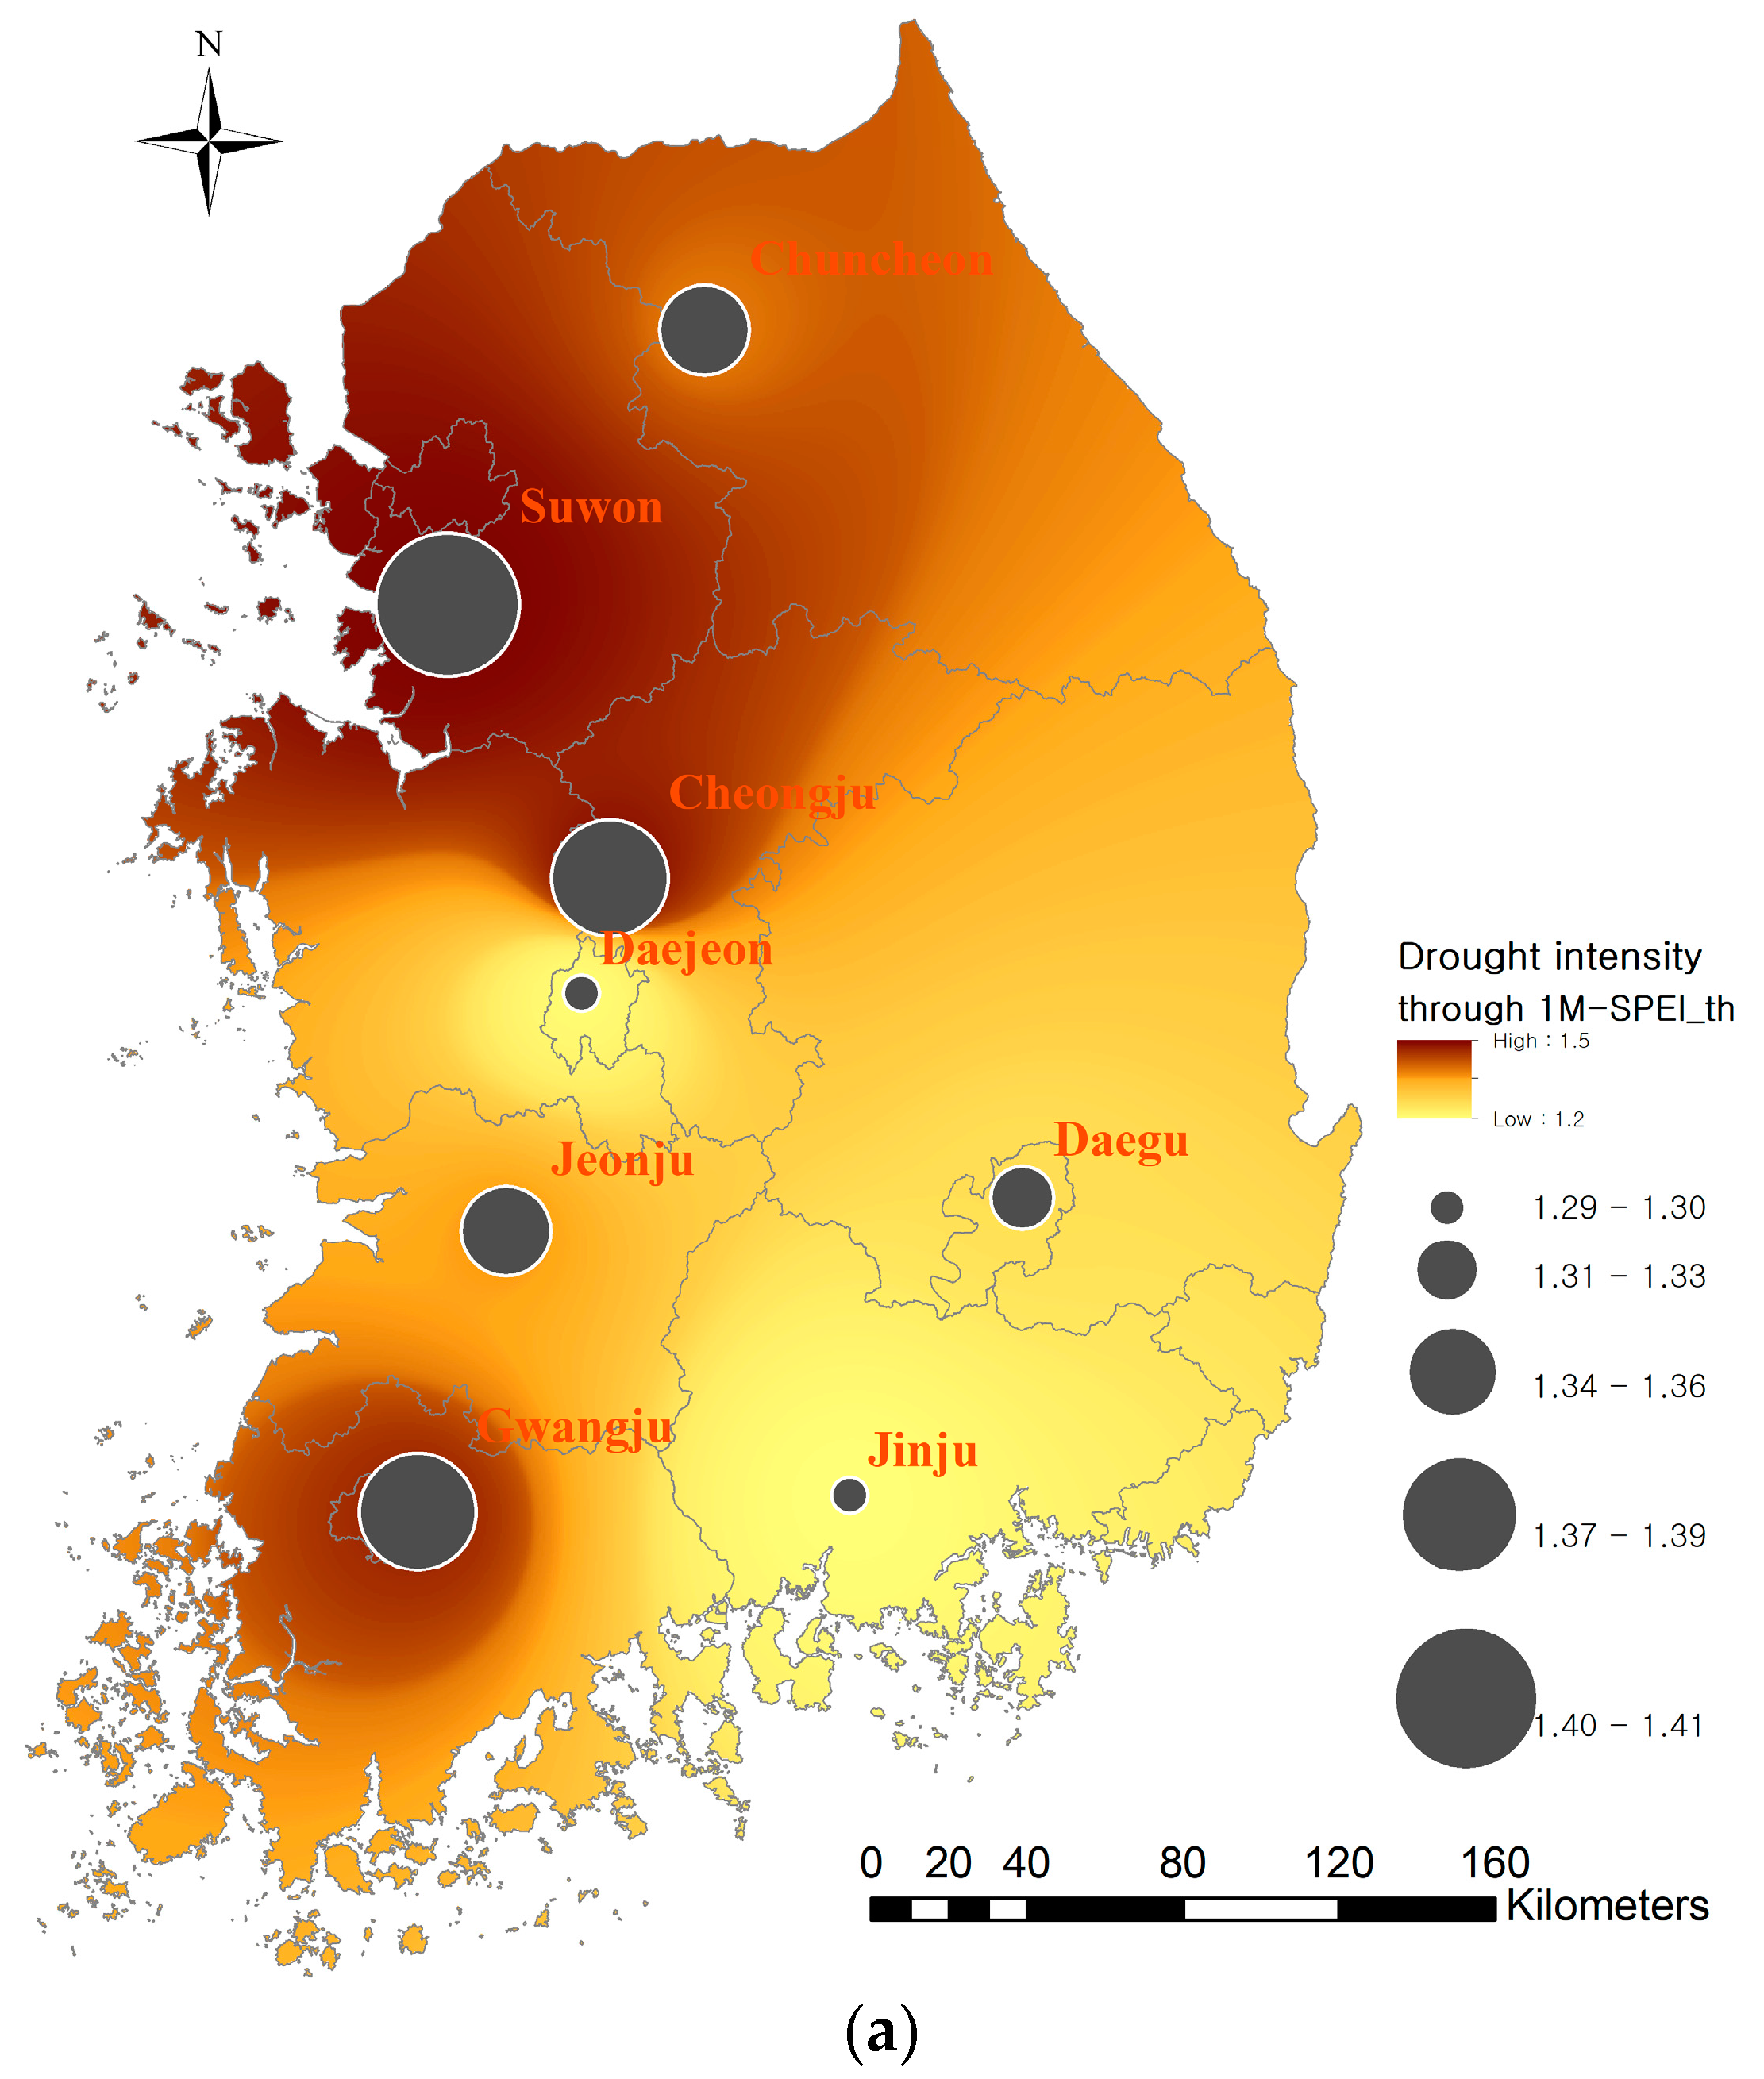
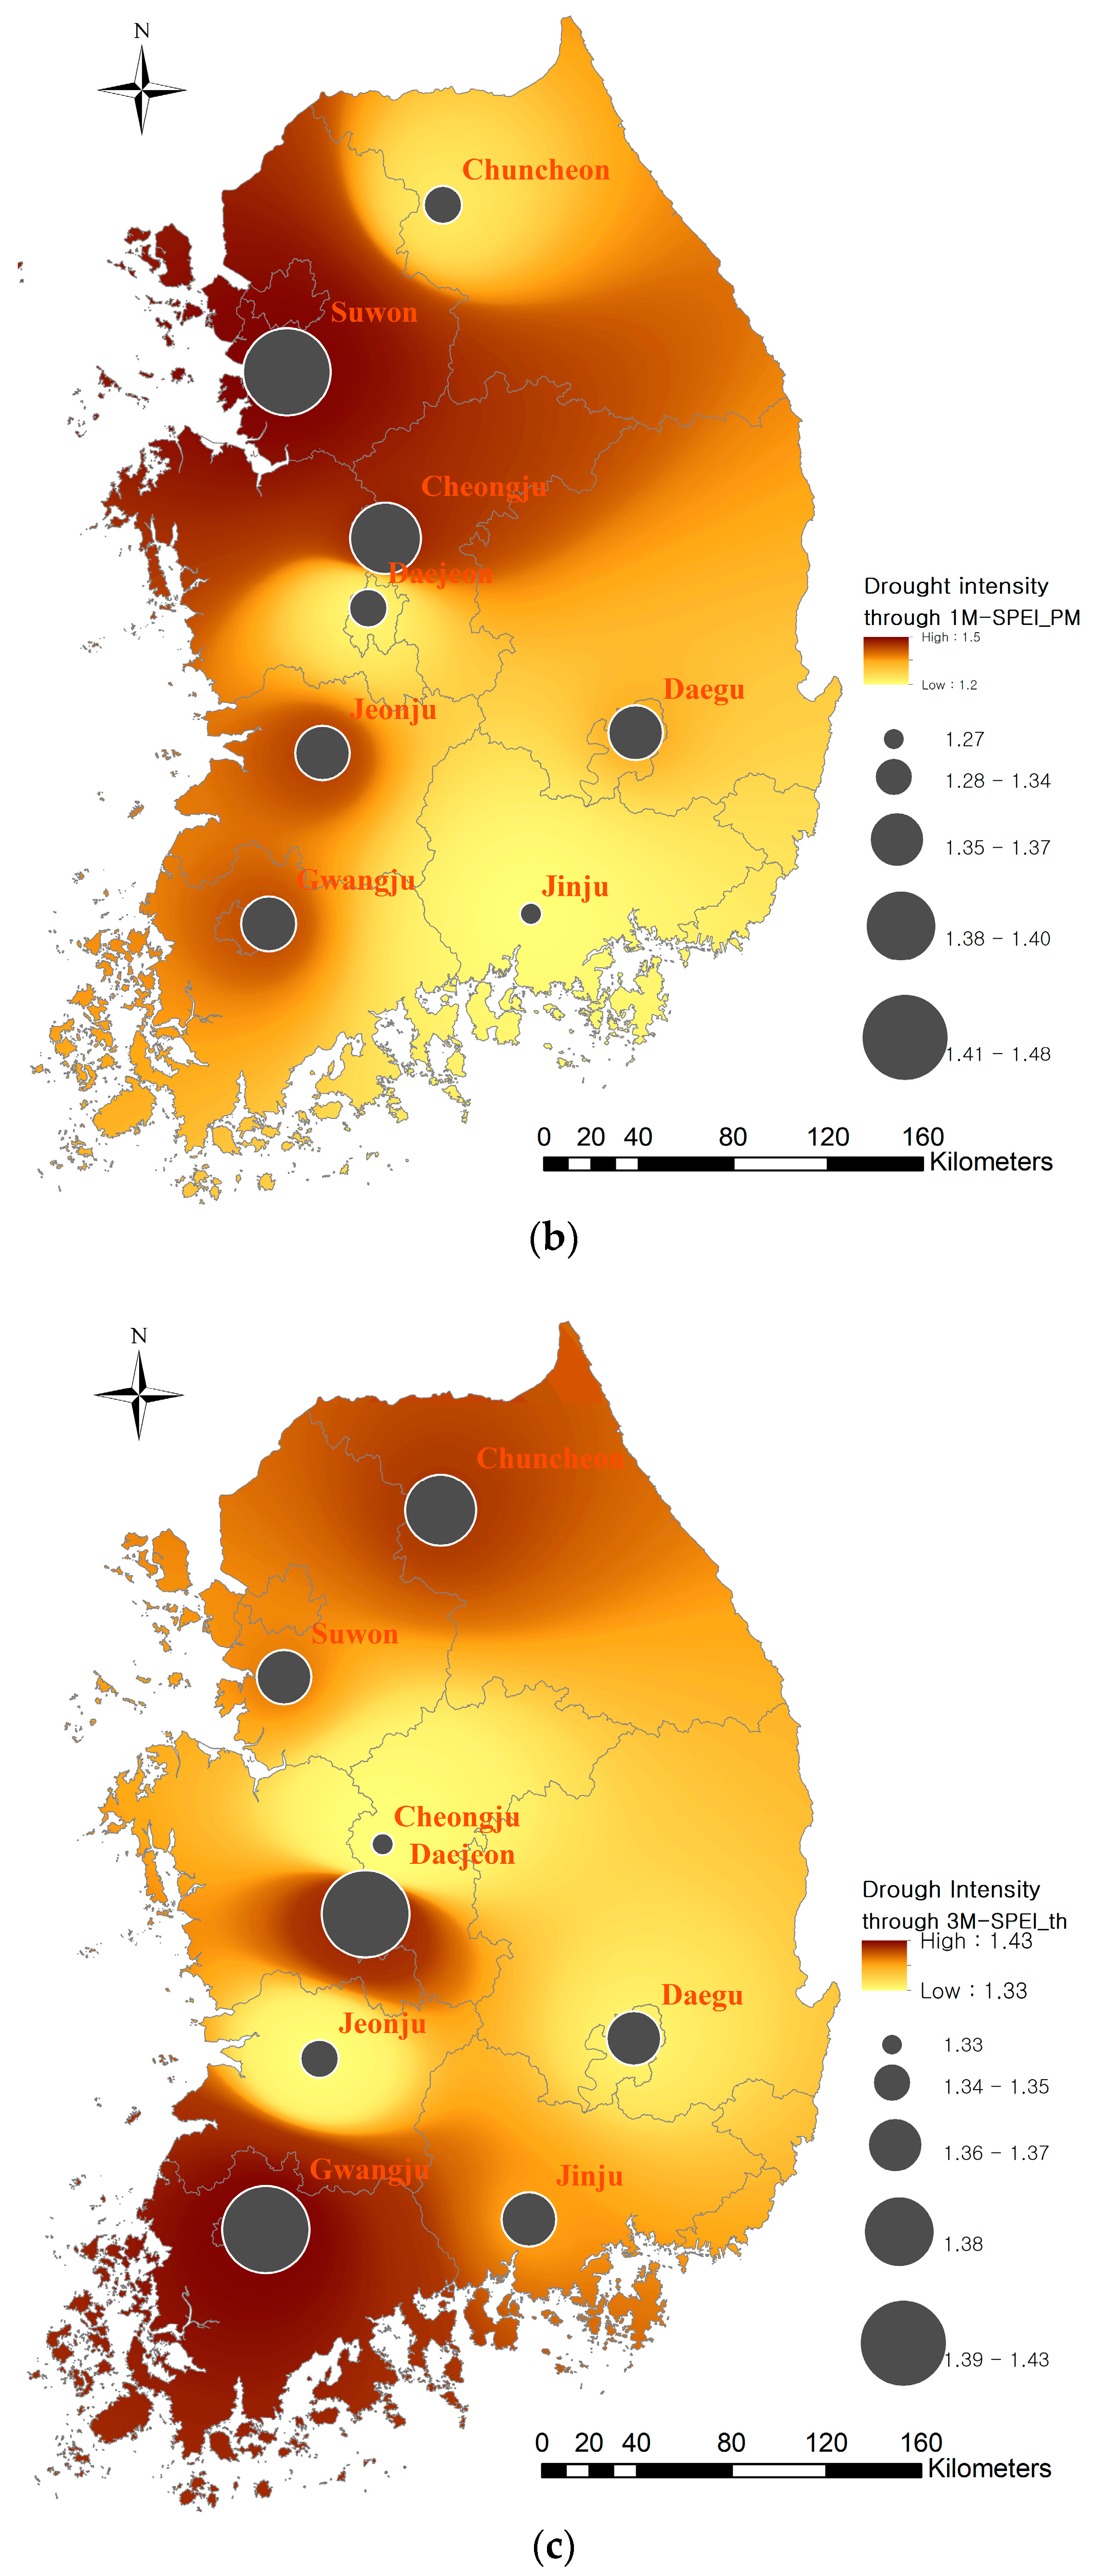
3.2. Analysis of Intensity and Frequency of Drought

The drought intensity based on SPEI_th and SPEI_pm was analyzed at each station using runs theory, as shown in Figure 4, which also displays the distributed drought intensity using inverse distance weight interpolation as the background. 1-month SPEI_pm showed slightly more intensive drought than 1-month SPEI_th at most of the stations, except for Chuncheon and Gwangju. In particular, in Suwon, drought intensity obtained from 1-month SPEI_pm was 1.47, but 1-month SPEI_th showed 1.41. In the case of 3-month SPEIs, the southern and central regions had more intensive drought than the northern region. In particular, Gwangju and Daejeon showed the highest-intensity drought from both 3-month SPEI_th and SPEI_pm. To sum up, the northwest and southwest regions had a higher intensity of 1-month drought, and the central and southwest regions had a higher intensity of 3-month drought. In particular, the largest farmlands are located in the southern and western regions; thus, the impacts of drought on agriculture could be serious in Korea.
We also analyzed the probability of drought occurrence when estimated using the cumulative curves of SPEI. First, the SPEI was calculated for the total period (1981–2010); after that, we collected SPEI results during each period (1981–1995 and 1996–2010). Finally, we analyzed the cumulative curves of SPEI for the two periods, respectively, as shown in Figure 5. At 5 stations—excluding Chuncheon, Gwangju and Jinju—the cumulative probability that 1-month SPEI_pm was below −1.5 increased significantly from 1981–1995 to 1996–2010. The greatest increase of cumulative probability was shown in Jeonju (4.8% increase), followed by Cheonju (4.5% increase), Suwon (4.4% increase), Daejeon (3.3% increase), and Daegu (1.7% increase). In the case of 3-month SPEI_pm, in Daejeon, Daegu, Jeonju and Suwon, the cumulative probability that 3-month SPEI_pm was below −1.5 decreased from 1981–1995 to 1996–2010. The greatest increase of cumulative probability was shown in Jeonju, from 4.4% (1981–1995) to 7.8% (1996–2010), followed by Daejeon from 5.6% to 6.7%. However, Chuncheon and Gangju showed an increase in the cumulative probability that 3-month SPEI_pm was below −1.5; in particular, the cumulative probability that 3-month SPEI_pm was below –1.5 in Chuncheon during the period 1981–1995 was 8.9%, and it decreased to 2.8%.

3.3. Analysis of Variability and Trends of Drought

In the Korean peninsula, meteorological characteristics are classified into four seasons of 3 months: Winter (December–February: DJF), spring (March–May: MAM), summer (June–August: JJA), and fall (September–November: SON). Table 4 indicates the trends of seasonal drought based on MK tests of 1-month and 3-month SPEIs. The trends of SPEI_th varied by season and region. In the SON season, 5 stations (Cheongju, Daejeon, Daegu, Jeonju, and Gwangju) had a decreasing trend of 1-month SPEI_th at a 0.05 significance level. In the MAM season, a decreasing trend of 1-month SPEI_th was observed in Jeonju, but an increasing trend of 1-month SPEI_th was shown in JJA. However, the trends of 1-month SPEI_th in MAM and JJA were not significant at the 0.05 significance level. The 1-month SPEI_pm showed similar trends to the 1-month SPEI_th; for example, Jeonju had a decreasing trend of 1-month SPEI-pm at the 0.05 significance level. In the SON season, only 2 stations (Daejeon and Jeonju) had a decreasing trend of 1-month SPEI-pm at the 0.05 significance level. Table 5 indicates the trends of 3-month SPEIs, and it showed that the drought in the winter season (DJF) has become more severe. In addition, the trend of 3-month SPEI_pm showed that spring drought has also become more sever, especially in the southern region (Daegu and Jeonju).

4. Conclusions

Drought characteristics including duration, severity, and intensity were analyzed at 8 stations using the modified SPEI from 1981 to 2010. The SPEI is the representative drought index, and considers both precipitation and evapotranspiration, which are essential factors for evaluating crop growth. In this study, the SPEI was divided into SPEI_th and SPEI_pm, depending on ETo equations such as the Thornthwaite and FAO Penman–Monteith. It is hard to determine which SPEI is most correct or suitable for analyzing drought conditions. However, it is important to understand what is different between SPEI_pm and SPEI_th. As the results of drought intensity, the SPEI_pm identified drought as being more intensive than SPEI_th, even when the same climate data were given.
The FAO Penman–Monteith equation is recommended for estimating evapotranspiration; therefore, SPEI_pm might be recommended as a drought index over SPEI_th. However, the FAO Penman–Monteith equation requires various variables; therefore, the Thornthwaite equation, which is a simple approach, can be feasible in specific regions. Accordingly, this study can be used to review whether the Thornthwaite approach can derive comparable results to the FAO Penman–Montheith equations.
We also analyzed the trends of time-series SPEIs using the MK test. The increasing trend of SPEIs was shown for the fall season, and the cumulative probability that the SPEI_pm was below −1.5 also increased significantly. These results indicated that the frequency of severe drought had increased between 1981 and 1990.
However, precipitation has a high natural variability over time and space, and SPEI is strongly dependent on the study period. The trend analysis of SPEI for 30 years might not be enough to interpret the trend of drought. In spite of these limitations, this study is able to show the drought characteristics for an exact period, including more recent or future seasons. In particular, climate change affects the aggregate of severe drought. Accordingly, the analysis of drought trends could be useful for coping with agricultural drought under climate change conditions.

Acknowledgments

This research was supported by the Korea Institute of Planning and Evaluation for Technology in Food, Agriculture, Forestry and Fisheries (iPET) through Advanced Production Technology Development Program funded by Ministry of Agriculture, Food and Rural Affairs (MAFRA) (116051-3).

Author Contributions

Seungjong Bae and Seung-Hwan Yoo conceived and designed the research; Sang-Hyun Lee and Seung-Hwan Yoo analyzed the data; Taegon Kim contributed analysis tools; Seungjong Bae and Sang-Hyun Lee wrote the paper.

Conflicts of Interest

The authors declare that there is no conflict of interest regarding the publication.

References

  1. Wilhite, D.A. Drought as a natural hazard: Concepts and definitions. In Drought: A Global Assessment; Wilhite, D.A., Ed.; Routledge: London, UK, 2000; pp. 3–18. [Google Scholar]
  2. Vrochidou, A.E.; Tsanis, I.K.; Grillakis, M.G.; Koutroulis, A.G. The impact of climate change on hydrometeorological droughts at a basin scale. J. Hydrol. 2013, 476, 290–301. [Google Scholar] [CrossRef]
  3. Koutroulis, A.G.; Vrochidou, A.-E.K.; Tsanis, I.K. Spatiotemporal characteristics of meteorological drought for the island of Crete. J. Hydrometeorol. 2011, 12, 206–226. [Google Scholar] [CrossRef]
  4. Rossi, G. Drought mitigation measures: A comprehensive framework. In Drought and Drought Mitigation in Europe; Voght, J., Somma, F., Eds.; Kluwer Academic Publishers: Dordrecht, The Netherlands, 2000; pp. 233–246. [Google Scholar]
  5. Mishra, A.K.; Singh, V.P. A review of drought concepts. J. Hydrol. 2010, 391, 202–216. [Google Scholar] [CrossRef]
  6. Lei, T.; Pang, Z.; Wang, X.; Li, L.; Fu, J.; Kan, G.; Shao, C. Drought and carbon cycling of grassland ecosystems under global change: A review. Water 2016, 8, 460. [Google Scholar] [CrossRef]
  7. Stocker, T.F.; Dahe, Q.; Plattner, G.-K. Climate Change 2013: The Physical Science Basis. Working Group I Contribution to the Fifth Assessment Report of the Intergovernmental Panel on Climate Change; Summary for Policymakers (IPCC, 2013); IPCC: Bern, Switzerland, 2013; pp. 1–33. [Google Scholar]
  8. Vogel, A.; Scherer-Lorenzen, M.; Weigelt, A. Grassland resistance and resilience after drought depends on management intensity and species richness. PLoS ONE 2012, 7, e36992. [Google Scholar] [CrossRef] [PubMed]
  9. Heim, R.R. A review of twentieth-century drought indices used in the United States. Bull. Am. Meteorol. Soc. 2002, 83, 1149–1165. [Google Scholar] [CrossRef]
  10. Svoboda, M.D.; LeComte, D.; Hayes, M.; Heim, R.; Gleason, K.; Angel, J.; Miskus, D. The drought monitor. Bull. Am. Meteorol. Soc. 2002, 83, 1181–1190. [Google Scholar] [CrossRef]
  11. Wilhite, D.A.; Glantz, M.H. Understanding the drought phenomenon: The role of definitions. Water Int. 1985, 10, 111–120. [Google Scholar] [CrossRef]
  12. World Meteorological Organization. Drought and Agriculture. WMO Tech. Note 138, Report of the CAgM Working Group on the Assessment of Drought; World Meteorological Organization: Geneva, Switzerland, 1975; p. 127. [Google Scholar]
  13. Dai, A. Drought under global warming: A review. Wiley Interdiscip. Rev. Clim. Chang. 2011, 2, 45–65. [Google Scholar] [CrossRef]
  14. Dubrovsky, M.; Svoboda, M.D.; Trnka, M.; Hayes, M.J.; Wilhite, D.A.; Zalud, Z.; Hlavinka, P. Application of relative drought indices in assessing climate change impacts on drought conditions in Czechia. Theor. Appl. Climatol. 2009, 96, 117–155. [Google Scholar] [CrossRef]
  15. Loukas, A.; Vasiliades, L.; Tzabiras, J. Climate change effects on drought severity. Adv. Geosci. 2008, 17, 23–29. [Google Scholar] [CrossRef]
  16. Mavromatis, T. Drought index evaluation for assessing future wheat production in Greece. Int. J. Climatol. 2007, 27, 911–924. [Google Scholar] [CrossRef]
  17. Vicente-Serrano, S.M.; Beguería, S.; López-Moreno, J.I. A multiscalar drought index sensitive to global warming: The standardized precipitation evapotranspiration index. J. Clim. 2010, 23, 1696–1718. [Google Scholar] [CrossRef]
  18. Hayes, M.J.; Svoboda, M.D.; Wilhite, D.A.; Vanyarkho, O.V. Monitoring the 1996 drought using the standardized precipitation index. Bull. Am. Meteorol. Soc. 1999, 80, 429–438. [Google Scholar] [CrossRef]
  19. Nam, W.H.; Hayes, M.J.; Wilhite, D.A.; Tadesse, T.; Svoboda, M.D.; Knutson, C.L. Drought management and policy based on risk assessment in the context of climate change. Mag. Korean Soc. Agric. Eng. 2014, 56, 2–15. (In Korean) [Google Scholar]
  20. Wilhite, D.A.; Svoboda, M.D.; Hayes, M.J. Understanding the complex impacts of drought: A key to enhancing drought mitigation and preparedness. Water Resour. Manag. 2007, 21, 763–774. [Google Scholar] [CrossRef]
  21. Kwak, J.W.; Lee, S.D.; Kim, Y.S.; Kim, H.S. Return period estimation of droughts using drought variables from standardized precipitation index. J. Korean Water Resour. Assoc. 2013, 46, 795–805. (In Korean) [Google Scholar] [CrossRef]
  22. Nam, W.H.; Yoo, S.H.; Jang, M.W.; Choi, J.Y. Application of meteorological drought indices for North Korea. J. Korean Soc. Agric. Eng. 2008, 50, 3–15. (In Korean) [Google Scholar] [CrossRef]
  23. So, J.M.; Sohn, K.H.; Bae, D.H. Estimation and assessment of bivariate joint drought index based copula functions. J. Korean Water Resour. Assoc. 2014, 47, 171–182. (In Korean) [Google Scholar] [CrossRef]
  24. Yoo, J.Y.; Choi, M.H.; Kim, T.W. Spatial analysis of drought characteristics in Korea using cluster analysis. J. Korean Water Resour. Assoc. 2010, 43, 15–24. (In Korean) [Google Scholar] [CrossRef]
  25. Yoo, J.Y.; Song, H.Y.; Kim, T.W.; Ahn, J.H. Evaluation of short-term drought using daily standardized precipitation index and ROC analysis. J. Korean Soc. Civ. Eng. 2013, 33, 1851–1860. (In Korean) [Google Scholar] [CrossRef]
  26. Jeung, S.J.; Sung, J.H.; Kim, B.S. Change projection of extreme indices using RCP climate change scenario. J. Korean Water Resour. Assoc. 2013, 46, 1089–1101. (In Korean) [Google Scholar] [CrossRef]
  27. Rim, C.S.; Kim, S.Y. Climate aridity/humidity characteristics in Seoul according to changes in temperature and precipitation based on RCP 4.5 and 8.5. J. Korean Water Resour. Assoc. 2014, 47, 421–434. (In Korean) [Google Scholar] [CrossRef]
  28. Yoon, S.K.; Cho, J.P.; Moon, Y.I. Non-parametric low-flow frequency analysis using RCPs scenario data: A case study of the Gwangdong storage reservoir, Korea. J. Korean Soc. Civ. Eng. 2014, 34, 1125–1138. (In Korean) [Google Scholar] [CrossRef]
  29. Thornthwaite, C.W. An approach toward a rational classification of climate. Geogr. Rev. 1948, 38, 55–94. [Google Scholar] [CrossRef]
  30. Kim, B.S.; Sung, J.H.; Kang, H.S.; Cho, C.H. Assessment of drought severity over South Korea using standardized precipitation evapotranspiration index (SPEI). J. Korean Water Resour. Assoc. 2012, 45, 887–900. (In Korean) [Google Scholar] [CrossRef]
  31. Jensen, M.E.; Burman, R.D.; Allen, R.G. Evapotranspiration and Irrigation Water Requirements; American Society of Civil Engineers (ASCE): Reston, VA, USA, 1990. [Google Scholar]
  32. Van der Schrier, G.; Jones, P.D.; Briffa, K.R. The sensitivity of the PDSI to the Thornthwaite and Penman-Monteith parameterizations for potential evapotranspiration. J. Geophys. Res. Atmos. 2011, 1984–2012. [Google Scholar] [CrossRef]
  33. Allen, R.G.; Pereira, L.S.; Raes, D.; Smith, M. Crop Evapotranspiration-Guidelines for Computing Crop Water Requirements-FAO Irrigation and Drainage Paper 56; FAO: Rome, Italy, 1998; Volume 300, p. D05109. [Google Scholar]
  34. Yevjevich, V. An Objective Approach to Definitions and Investigations of Continental Hydrologic Drought; Hydrology Paper No. 23; Colorado State University: Fort Collins, CO, USA, 1967. [Google Scholar]
  35. González, J.; Valdés, J.B. New drought frequency index: Definition and comparative performance analysis. Water Resour. Res. 2006, 42. [Google Scholar] [CrossRef]
  36. Lee, S.H.; Yoo, S.H.; Choi, J.Y.; Bae, S. Assessment of the impact of climate change on drought characteristics in the Hwanghae plain, North Korea using time series SPI and SPEI: 1981–2100. Water 2017, 9, 579. [Google Scholar] [CrossRef]
  37. Mann, H.B. Nonparametric tests against trend. Econometrica 1945, 13, 245–259. [Google Scholar] [CrossRef]
  38. Wang, W.; Van Gelder, P.H.A.J.M.; Vrijling, J.K. Trend and stationarity analysis for streamflow processes of rivers in Western Europe in the 20th century. In Proceedings of the IWA International Conference on Water Economics, Statistics, and Finance, Rethymno, Greece, 8–10 July 2005; p. 810. [Google Scholar]
  39. Kendall, M.G. Rank Correlation Methods; Griffin: London, UK, 1975. [Google Scholar]
  40. Kim, B.S.; Sung, J.H.; Lee, B.H.; Kim, D.J. Evaluation on the impact of extreme droughts in South Korea using the SPEI and RCP8.5 climate change scenario. J. Korean Soc. Hazard Mitig. 2013, 13, 97–109. (In Korean) [Google Scholar] [CrossRef]
  41. Korea Meteorological Administration (KMA). Understanding of Climate Change and Application of Climate Change Scenarios; National Institute of Meteorological Research: Seoul, Korea, 2010. (In Korean)
  42. Korea rural community corporation (KRC). Mitigation History of Drought; KRC: Naju, Korea, 2001. [Google Scholar]
  43. Lee, J.H.; Seo, J.W.; Kim, C.J. Analysis on trends, periodicities and frequencies of Korean drought using drought indices. J. Korea Water Resour. Assoc. 2012, 45, 75–89. [Google Scholar] [CrossRef]
  44. Ministry of Construction and Transportation (MCT). Drought Impact Survey Report; MCT: Sejong, Korea, 2002. [Google Scholar]
Figure 1. Drought characteristics using the run theory for a given threshold level [36].
Water 10 00327 g001
Figure 2. Locations of the eight meteorological stations.
Water 10 00327 g002
Figure 3. 1- and 3-month SPEIs at 8 stations from 1981 to 2010. (a) 1-month SPEI_th, (b) 1-month SPEI_pm, (c) 3-month SPEI_th, (d) 3-month SPEI_pm.
Water 10 00327 g003aWater 10 00327 g003b
Figure 4. Intensity of drought obtained by applying SPEI_th and SPEI_pm to runs theory. (a) Intensity of drought based on 1-month SPEI_th., (b) Intensity of drought based on 1-month SPEI_pm., (c) Intensity of drought based on 3-month SPEI_th, (d) Intensity of drought based on 3-month SPEI_pm.
Water 10 00327 g004aWater 10 00327 g004bWater 10 00327 g004c
Figure 5. Cumulative probability curves of 1- and 3-month SPEI_pm for different regions. (a) 1-month SPEI_pm, (b) 3-month SPEI_pm.
Water 10 00327 g005aWater 10 00327 g005b
Table 1. Classification of Standardized Precipitation Evapotranspiration Index (SPEI).
SPEI ValueClass
More than 2.00Extremely wet (humid)
1.50–1.99Severely wet
1.00–1.49Moderately wet
0.50–0.99Slightly wet
−0.49–0.49Near normal
−0.99–−0.50Mild dry
−1.49–−1.00Moderately dry
−1.99–−1.50Severely dry
Less than −2.00Extremely dry (drought)
Table 2. Climatic characteristics at the eight meteorological stations.
Stations (No.)Annual Mean Temperature (°C)Annual Rainfall (mm)
Chuncheon (101)11.21357.4
Suwon (119)12.21333.3
Cheongju (131)12.61249.8
Daejeon (133)12.81373.9
Daegu (143)14.21076.1
Jeonju (146)13.41317.7
Gwangju (156)13.91385.7
Jinju (192)13.21523.0
Table 3. Goodness of fit of log-logistic distribution of D series from 1981 to 2010 in Chuncheon (101).
Chuncheon (101) MonthGoodness of Fit of D Series by Kolmogorov–Smirnov
ThornthwaiteFAO Penman–Monteith
Static ValueRank *Static ValueRank *
10.087110.1110811
20.1423210.1444612
30.0890140.08735
40.102090.062982
50.1075210.1155921
60.079230.0983212
70.1210120.1197714
80.069550.0833410
90.086980.090279
100.0917110.130553
110.1011150.1340210
120.096170.0892214
* The rank indicates the rank of Log-Logistic in 65 probability distribution functions.
Table 4. The results of the Mann–Kendall (MK) trend test for 1-month SPEI_th and SPEI_pm.
SPEIsRegionsStations (No.)Z Score
DJFMAMJJASON
SPEI_thNorthern and CentralChuncheon (101)0.170.001.59−1.03
Suwon (119)−0.25−0.361.59−1.30
Cheongju (131)−0.360.030.68−2.37 *
Daejeon (133)0.220.130.51−2.46 *
SouthernDaegu (143)0.06−0.36−0.38−2.30 *
Jeonju (146)−0.16−1.250.72−3.65 *
Gwangju (156)1.250.371.35−2.39 *
Jinju (192)0.170.790.17−1.38
SPEI_pmNorthern and centralChuncheon (101)0.110.631.78−0.38
Suwon (119)−1.32−0.171.75−1.11
Cheongju (131)−0.960.130.91−1.68
Daejeon (133)−0.33−0.240.69−2.25 *
SouthernDaegu (143)−0.23−0.21−0.03−1.35
Jeonju (146)−0.80−1.610.88−3.55 *
Gwangju (156)0.990.371.52−1.88
Jinju (192)1.140.750.19−0.99
* Statistically significant at the 5% level.
Table 5. The results of the Mann–Kendall (MK) trend test for 3-month SPEI_th and SPEI_pm.
SPEIsRegionsStations (No.)Z Score
DJFMAMJJASON
SPEI_thNorthern and centralChuncheon (101)−0.481.292.16 *0.75
Suwon (119)−2.36 *0.063.01 *0.48
Cheongju (131)−2.83 *−0.271.270.14
Daejeon (133)−2.15 *0.411.320.10
SouthernDaegu (143)−1.90−2.02 *0.23−0.87
Jeonju (146)−3.28 *−1.560.64−0.63
Gwangju (156)−1.380.101.070.50
Jinju (192)−0.420.510.95−0.79
SPEI_pmNorthern and centralChuncheon (101)−0.521.472.67 *1.15
Suwon (119)−3.16 *−0.343.26 *0.72
Cheongju (131)−3.26 *−0.591.840.49
Daejeon (133)−2.65 *−0.331.390.25
SouthernDaegu (143)−1.59−2.05 *0.89−0.27
Jeonju (146)−3.88 *−2.17 *0.75−0.54
Gwangju (156)−1.46−0.021.380.68
Jinju (192)−0.030.501.03−0.67
* Statistically significant at the 5% level.

