1. Introduction
The study of suspended load in open channels has a central role in the analysis of river dynamics, in which suspended particles affect both the flow field and the interaction between flow and river-bed. Humans can alter fine sediment supply to river networks and solid transport processes within them via activities, such as agriculture, mining, forestry operations, and the construction of dams. Particularly, a dam creates an upstream area with low water velocity, which affects solute/sediment dynamics and river morphology and induces sedimentation in reservoirs that gradually lose their useful capacity [
1,
2,
3,
4,
5,
6,
7,
8]. Even reservoir sediment trapping reduces the supply of sediments to the downstream river, where modifications of peak flow rate and sediment load impact on channel morphological equilibrium, and on the stability of river banks and fluvial engineering works (e.g., bridges, embankments, etc.). Moreover, reservoir rehabilitation strategies, i.e., flushing operations, may alter water turbidity and suspended sediment load, with unpreventable negative effects on the ecology of downstream rivers and the conservation of its biological components, such as fish communities, benthic invertebrates, and aquatic plants. Finally, suspended load can be a pollution source for rivers and channels because of toxic substances absorbed by fine sediment particles [
9,
10]. As a consequence, knowledge and forecasting of sediment concentration distributions, both along the depth and in the cross-section of channels, are relevant in the monitoring of regulated fluvial reaches for engineering and ecological reasons.
The advection-dispersion equation (ADE) for suspended load in river flows is [
11]:
where
C indicates the turbulent ensemble-mean concentration,
vs is the sediment migration velocity, and
E indicates the dispersion tensor defined by:
In Equation (2), and represent the fluctuation of concentration and sediment migration velocity, respectively, and the angle brackets stand for turbulent ensemble mean.
In steady and uniform conditions for flow and sediment distribution in very large rivers (2-D flow domains in the longitudinal-vertical plane), the turbulent ensemble mean concentration
C is assumed to be governed by the following equation:
where
y is the vertical coordinate,
εs =
Eyy represents the vertical dispersion coefficient and
indicates particle settling velocity. Based on Reynolds’ analogy, the dispersion coefficient
εs is typically estimated as
βεm, where
β is a constant of proportionality and
εm is the corresponding coefficient for momentum transfer:
In Equation (4), ρ indicates fluid density, u is the local longitudinal turbulent-mean velocity of water, the shear velocity, du/dy the velocity gradient, the shear stress at the generic depth y, and τ0 = τ(0).
The integration of Equation (3) based on Equation (4) yields:
where
C0 =
C(0). Equation (5) can be solved by resorting to different approximate closures for velocity and shear stress distribution. A classic example that is based on the use of Prandtl’s logarithmic velocity profile is the well-known Rouse equation [
12]:
where
Ca =
C(
a) is a reference value (
a is a conventional lower limit of sustainability of transport by suspension),
D is the flow depth,
is the grain Froude number and
k indicates von Karman’s constant.
Since Rouse’s model, several analytical and empirical laws have been obtained over the years.
Vanoni, Einstein and Chien demonstrated that the logarithmic velocity distribution[
13,
14], on which Rouse’s theory is based, agrees with their experimental data of velocity and suspension distributions throughout the flow depth only if a smaller value of von-Karman constant,
k, is used. Their results allowed concluding that an increase in suspension concentration corresponds to a reduction in constant
k.
Later, Itakura and Kishi, Coleman pointed out that this conclusion may actually be the result of a misinterpretation of velocity data by the earliest investigators, to whom the existence of the wake region of flow was unknown [
15,
16,
17]. Indeed, their von-Karman constant, instead of decreasing like it did for Vanoni, Einstein and Chien [
13,
14], remained essentially constant through the increase in sediments suspension from zero to full-capacity concentration. The adjustment to experimental data was achieved by resorting to a different type of velocity distribution. Specifically, Itakura and Kishi derived a suspended sediment concentration profile from a log-linear velocity law based on Monin-Obukhow theory (Monin and Obukhov; Turner) [
15,
18,
19]. Coleman resorted to a velocity profile that was the sum of the log-velocity distribution for sediment-laden flow [
16,
17], which strictly applies in the near-wall region, and a semi-empirical law based on the wake-strength function developed by Coles [
20], which applies in the whole flow domain. He argued that the wake coefficient, rather than the constant
k, is affected by the presence of suspended sediment and showed how the coefficient varies from a clear-water value of about 0.2 to a suspension-capacity value of about 0.9.
Overall, all the above studies stress how water and solid particles in sediment-laden flow follow distinct hydrodynamics, and thereby show the inaccuracy of the customary treatment of water and sediment motion as a single fluid. In the last few decades, some investigators such as Greimann and Holly, Righetti and Romano, Muste et al., Zhong et al. have analyzed sediment-laden flows by a two-phase approach [
21,
22,
23,
24]. Greimann and Holly developed mathematical relationships that account for particle inertia and particle-particle interactions aimed at modelling the sediment concentration behavior in open-channel flows over flat sediment-starved beds with single-sized suspended sediment [
21]. Although the proposed two-phase model manages to better predict the near-bed concentration distribution, where both the effects of particle inertia and particle-particle interactions are significant, it needs to estimate two empirical coefficients that account for the influence of the sediment on turbulence intensity. The experimental studies by Righetti and Romano focused on the characteristics of suspended heavy particles and their turbulence modulation effects in open as well as in confined channel flows [
22]. They observed that, in particle-laden flows, the vertical profiles of stream-wise mean velocity for both fluid and solid phases and turbulence intensity were reduced in the outer layer and increased in the viscous sublayer as compared to the clear-water case, which led to an apparent slip kinematic boundary condition near the wall. Moreover, in the presence of solid particles, the flow exhibited a velocity that was respectively smaller and larger than that characterizing the sediments in the near-wall and in the outer region. Muste et al. experimentally demonstrated how the suspended particles affect the turbulent flow by decreasing the bulk water velocity and the von Karman constant [
23], with the shear velocity remaining approximately constant. Furthermore, they showed how Rouse’s law quantitatively departs from the measured concentration profile when in the outer region of the flow the clear-water values of
β,
k, and
Ca are used. Zhong et al. developed a two-fluid transport model that [
24], while formally remaining a typical advection-diffusion equation, incorporates the effects of external forces, particle-particle interactions, and particle inertia, and is applicable to both diluted and moderately dense sediment-laden flows. In this model, the velocity of sediment is not imposed but it is determined as an asymptotic solution to the momentum conservation equation for solid phase. The use of simple analytical or empirical relations to determine the variables contained in the governing equation restricts the applicability of the model to stable and uniform flows only.
Other researchers included the effect of stratification in the concentration profiles ([
25,
26], to name a few). McLean showed that stratification and bed-forms typically reduce flow transport capacity and the heterogeneity of sediment sizes increases the expected transport [
25]. Wright and Parker proposed different methods for the prediction of flow depth [
26], grain-size specific near-bed concentration, and bed-material suspended sediment transport rate in sand-bed rivers. They modified existing formulations by including density stratification effects and by introducing a new predictor for near-bed entrainment rate into suspension and for form drag.
Finally, Yang, Ghoshal and Kundu investigated the effect of secondary currents in terms of fluid vertical velocity and concentration distribution [
27,
28,
29]. Yang developed a model aimed at the simultaneous prediction of velocity and sediment concentration profile [
27], based on the re-examination of Prandtl’s theory for sediment-laden flows and the condition of nonzero wall-normal velocity induced by secondary currents and sediment settlement. Ghoshal and Kundu elaborated a mathematical model for the sediment concentration distribution in steady uniform flow that incorporates the effect of both secondary currents and sediment-induced stratification [
28,
29]. They found that the stratification leads to a decrease in sediment concentration, while secondary currents might influence sediment-laden flow by either increasing or decreasing its concentration.
A relatively recent study on steady uniform flows has shown the possibility of obtaining the vertical distribution of concentration starting from the maximization of velocity information entropy (e.g., [
30]) and the physical description of the transport process. This entropic model provides good qualitative and quantitative results, depends on a single parameter (a given function of the ratio of mean
to maximum
umax cross-sectional velocity) and allows for the evaluation of the concentration also in the wall boundary layer, where it reaches its maximum and where the velocity logarithm law does not apply. Although the model by Chiu et al. proves to perform better than Rouse’s [
30], its analytical solution would require a complex integration. The present study proposes a simplification of this model that allows for analytically solving Equation (3) while consistently incorporating the effect of velocity dip position (e.g., [
31]). Tests were performed by applying the proposed simplified model to a set of measurements collected by Coleman and Valiani during laboratory surveys in steady flows [
16,
17,
32,
33]. According to Equation (3), the model applies along the depth of large open channels in equilibrium conditions, that is, it assumes that the turbulent ensemble mean concentration
C has achieved an asymptotic space-time domain (i.e., independence from time and from the channel-axis coordinate). Analytical solutions of the transient advection-dispersion equation for dissolved chemicals and fine sediments in open channels were given by the authors in the case of deterministic depth-averaged velocity distributions and different initial conditions by the method of moments (e.g., [
34]); in the case of randomly uniform flows in the presence of morphologic heterogeneity by a stochastic Lagrangian approach (e.g., [
35,
36]); and in terms of second-order concentration statistics based on a stochastic Eulerian approach (e.g., [
37]). An analytical-numerical model was proposed to solve ADE in a stochastic Lagrangian framework in the case of backwater flows, highlighting the occurrence of a global re-densification of the cloud and a permanent transverse non-uniformity (e.g., [
4]). Finally, a stochastic Lagrangian numerical model was developed to handle ADE in the case of non-uniform transverse mixing, highlighting the occurrence of concentration boundary side-pockets (e.g., [
38]).
2. Simplified Entropic Model of Concentration
Let us start from the entropic distribution of velocity (e.g., [
39,
40]):
where
ξ is a dimensionless variable such that the velocity increases monotonically with it,
ξ0 and
ξmax are the position of the minimum (
u = 0) and the maximum (
u = umax), respectively, and
M is the so-called entropic parameter, defined by
.
In case of velocity monotonically increasing from the bed to the free surface, one has:
and, after Chiu et al. for linearly distributed shear stress
the distribution of suspended sediment concentration is given by [
30]:
where:
In the above equation,
indicates the dimensionless Chézy friction coefficient and
is a function of
ws evaluated as:
where
d is sediment particle diameter,
ν kinematic viscosity of the fluid,
, and
ρs sediment density. Due to its negligible variation with the sediment concentration and along the depth (e.g., [
41]), coefficient
β is assumed to be nearly unit.
When the velocity peak is detected below the free surface,
ξ becomes a more complex function of
y:
where
h indicates velocity dip position. The corresponding concentration profile obtained by Chiu et al. for shear stress distributed according to the following law [
30,
42]:
is given by:
where
hξ is a scaling factor defined by:
The integral in Equation (15) is not analytically treatable and requires numerical solution.
In the present study, a simplified formulation of the model is proposed by expanding the exponential function in Equation (13) about
y = 0, and by keeping the leading order term only:
where
e indicates Euler’s constant. The linear shear stress distribution will be expressed by:
and Equation (5) will become:
Then, from Equations (17), (18) and (7):
It should be emphasized that the use of a diffusion-dispersion model like Equation (1), very close to the bed (
y→0), corresponds to a pure mathematical approximation, since in the near-wall region the convective entrainment prevails on diffusive particle motion due to the imperfect reaction of particles to turbulence (e.g., [
22]). The integration in Equation (20) can be performed in closed-form leading to:
with
h =
h(
M) according to Mirauda et al. [
31]. Due to the wall approximation implied by Equation (17), Equation (21) is in principle mainly valid in the area near the channel bed, where the maximum concentration occurs.
3. Model Validation
The robustness of the simplified entropic formulation in the presence of velocity dip position was tested based on the laboratory data collected by Coleman and Valiani [
16,
17,
32,
33]. Coleman measured 40 velocity profiles along the axis of the channel flow in laboratory experiments performed in a 0.356 m wide × 15 m long recirculating flume. During the experimental runs, the Plexiglass flume slope was adjusted from time to time in such a way as to maintain uniform flow. The experiments were repeated with three different sands characterized by nominal diameters equal to 0.105, 0.210, and 0.420 mm. Flow rate and average flow depth were set at 0.064 m
3/s and 0.169 m, respectively. Valiani’s experiences are similar to Coleman’s, which were performed in a 0.37 m wide × 10.5 m long Plexiglas flume. In Valiani’s tests, solid discharge was gradually increased until saturation of the uniform flow transport capacity. The experiments were carried out for fixed flow rate (0.022–0.024 m
3/s), slope (0.002), and flow depth (0.10 m), with three different grain sizes (0.150 mm (4 runs), 0.106 mm (6 runs), and 0.075 mm (12 runs)). All the velocity profiles reconstructed at different cross-sections show that the maximum velocity systematically occurs below the free surface. Therefore, the (approximate) generalized vertical coordinate to be used to estimate the corresponding concentration distribution is that given by Equation (17).
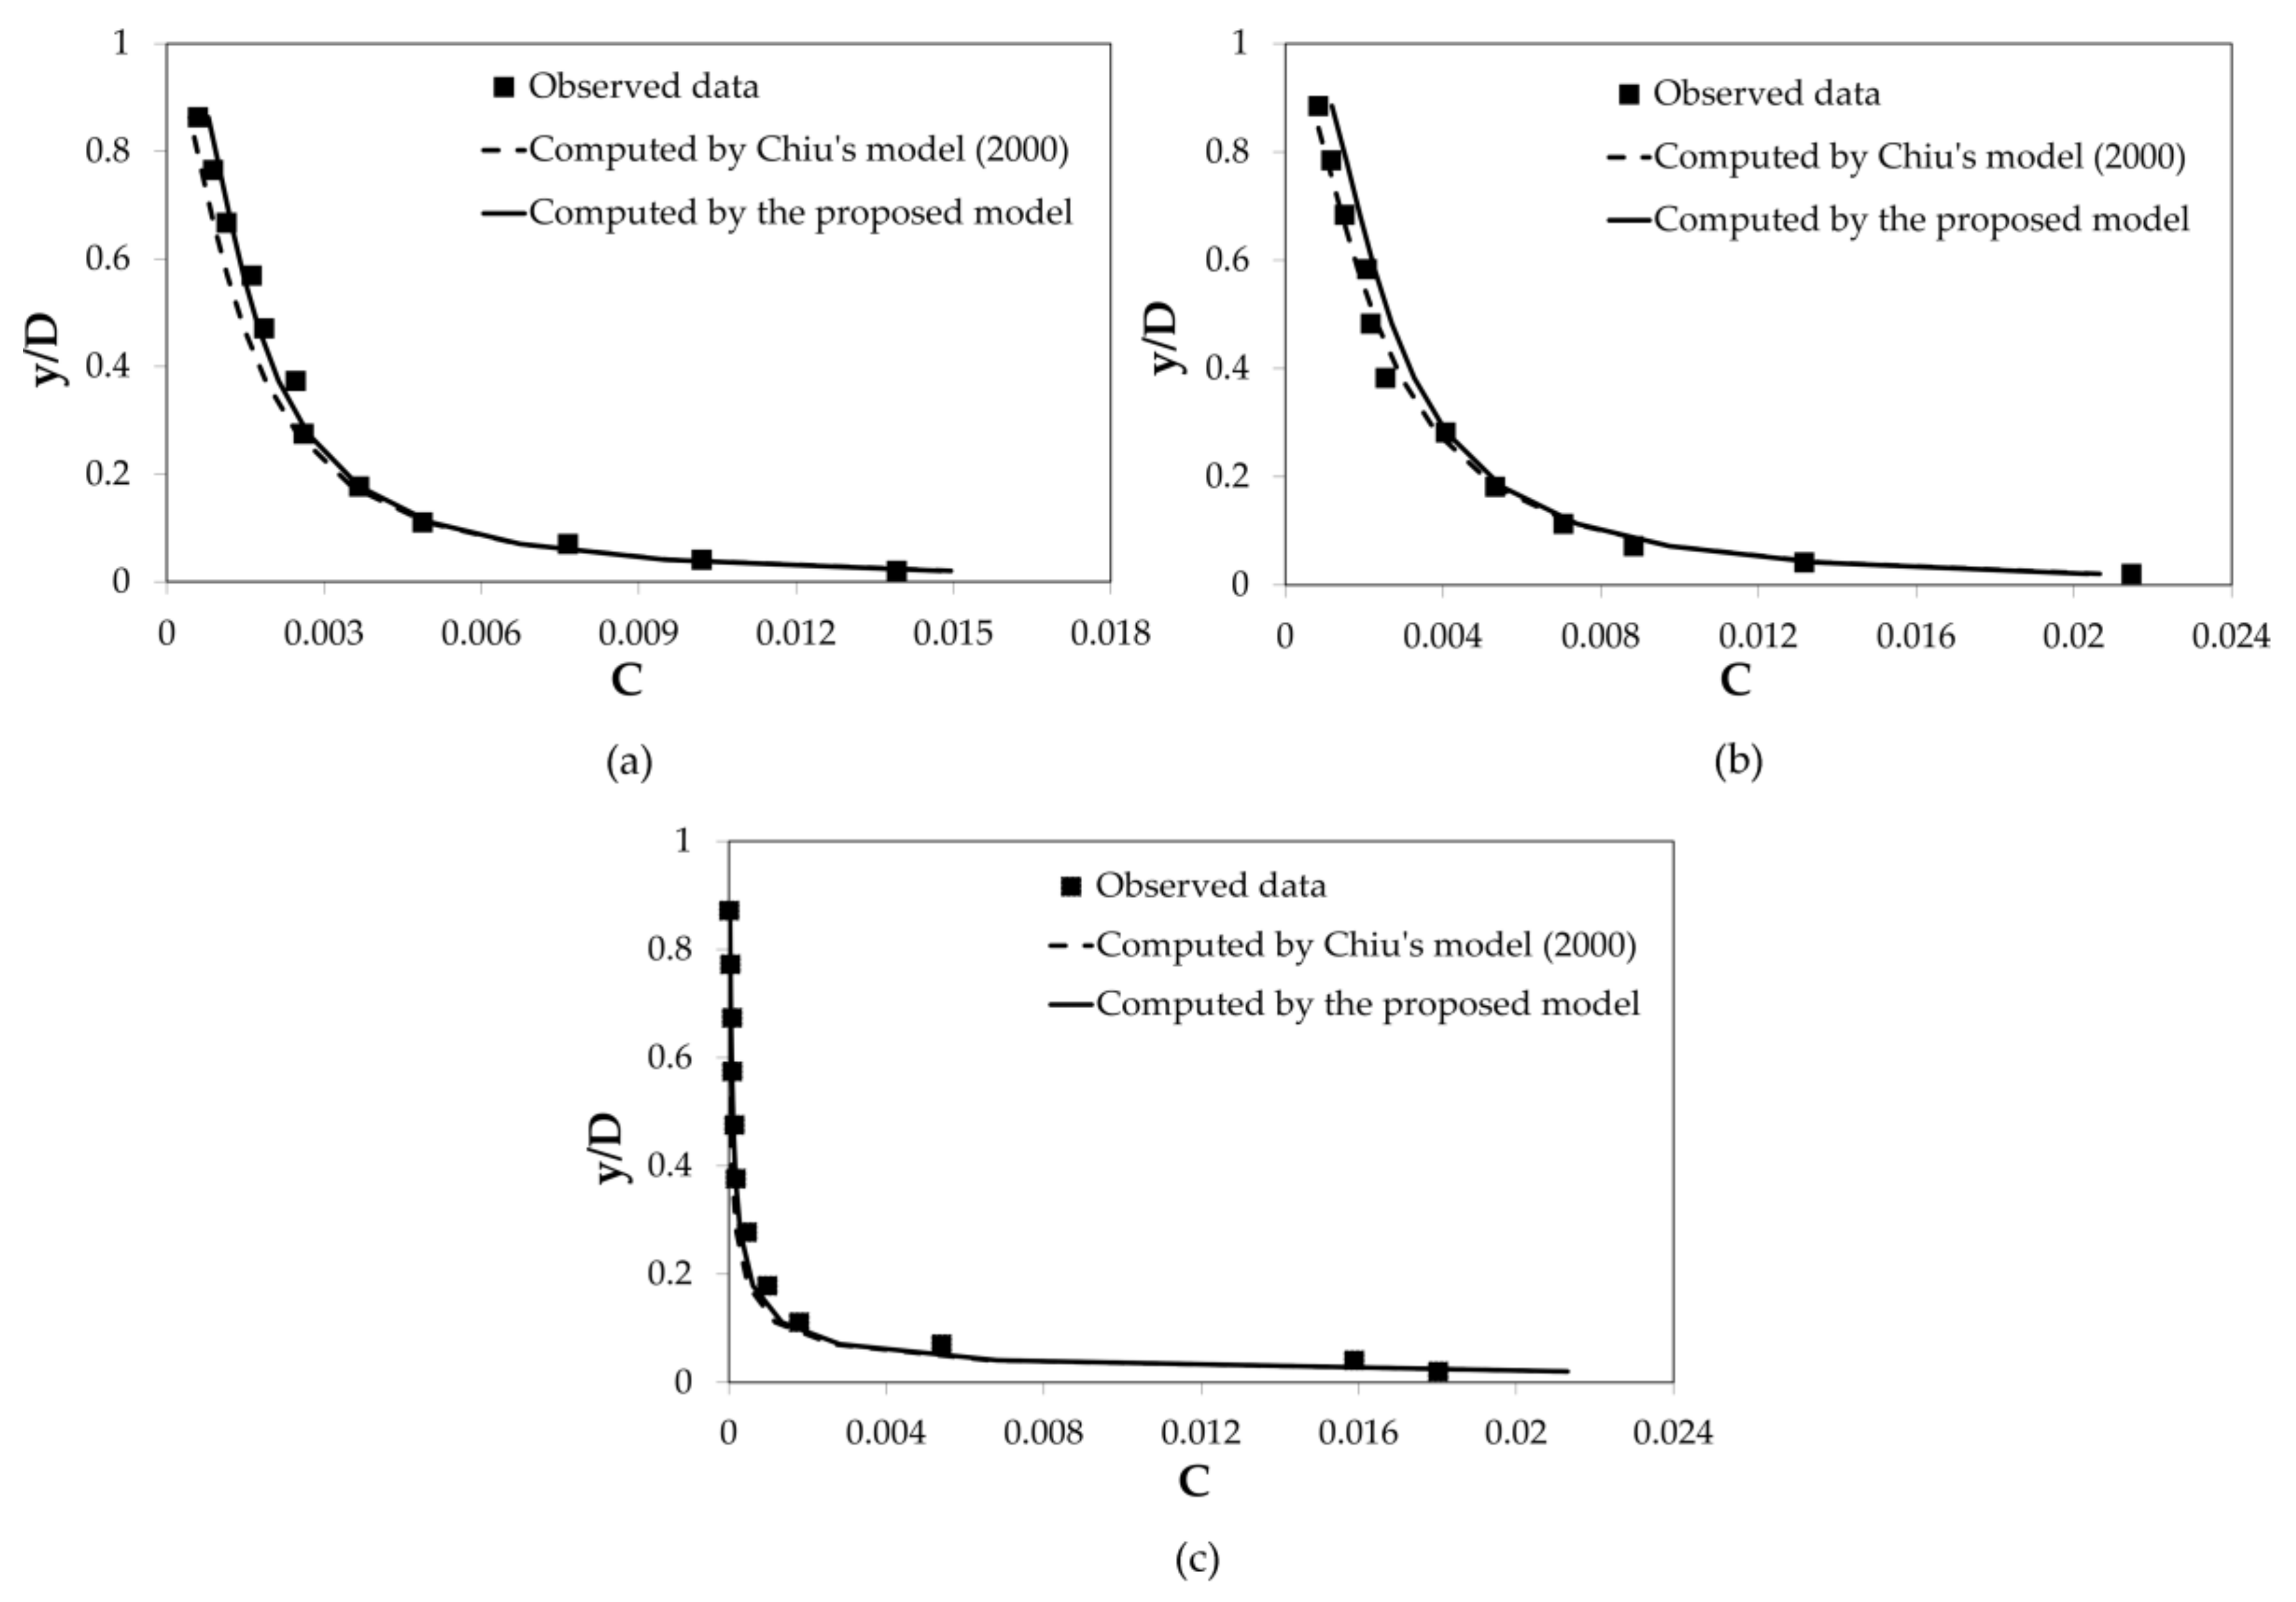
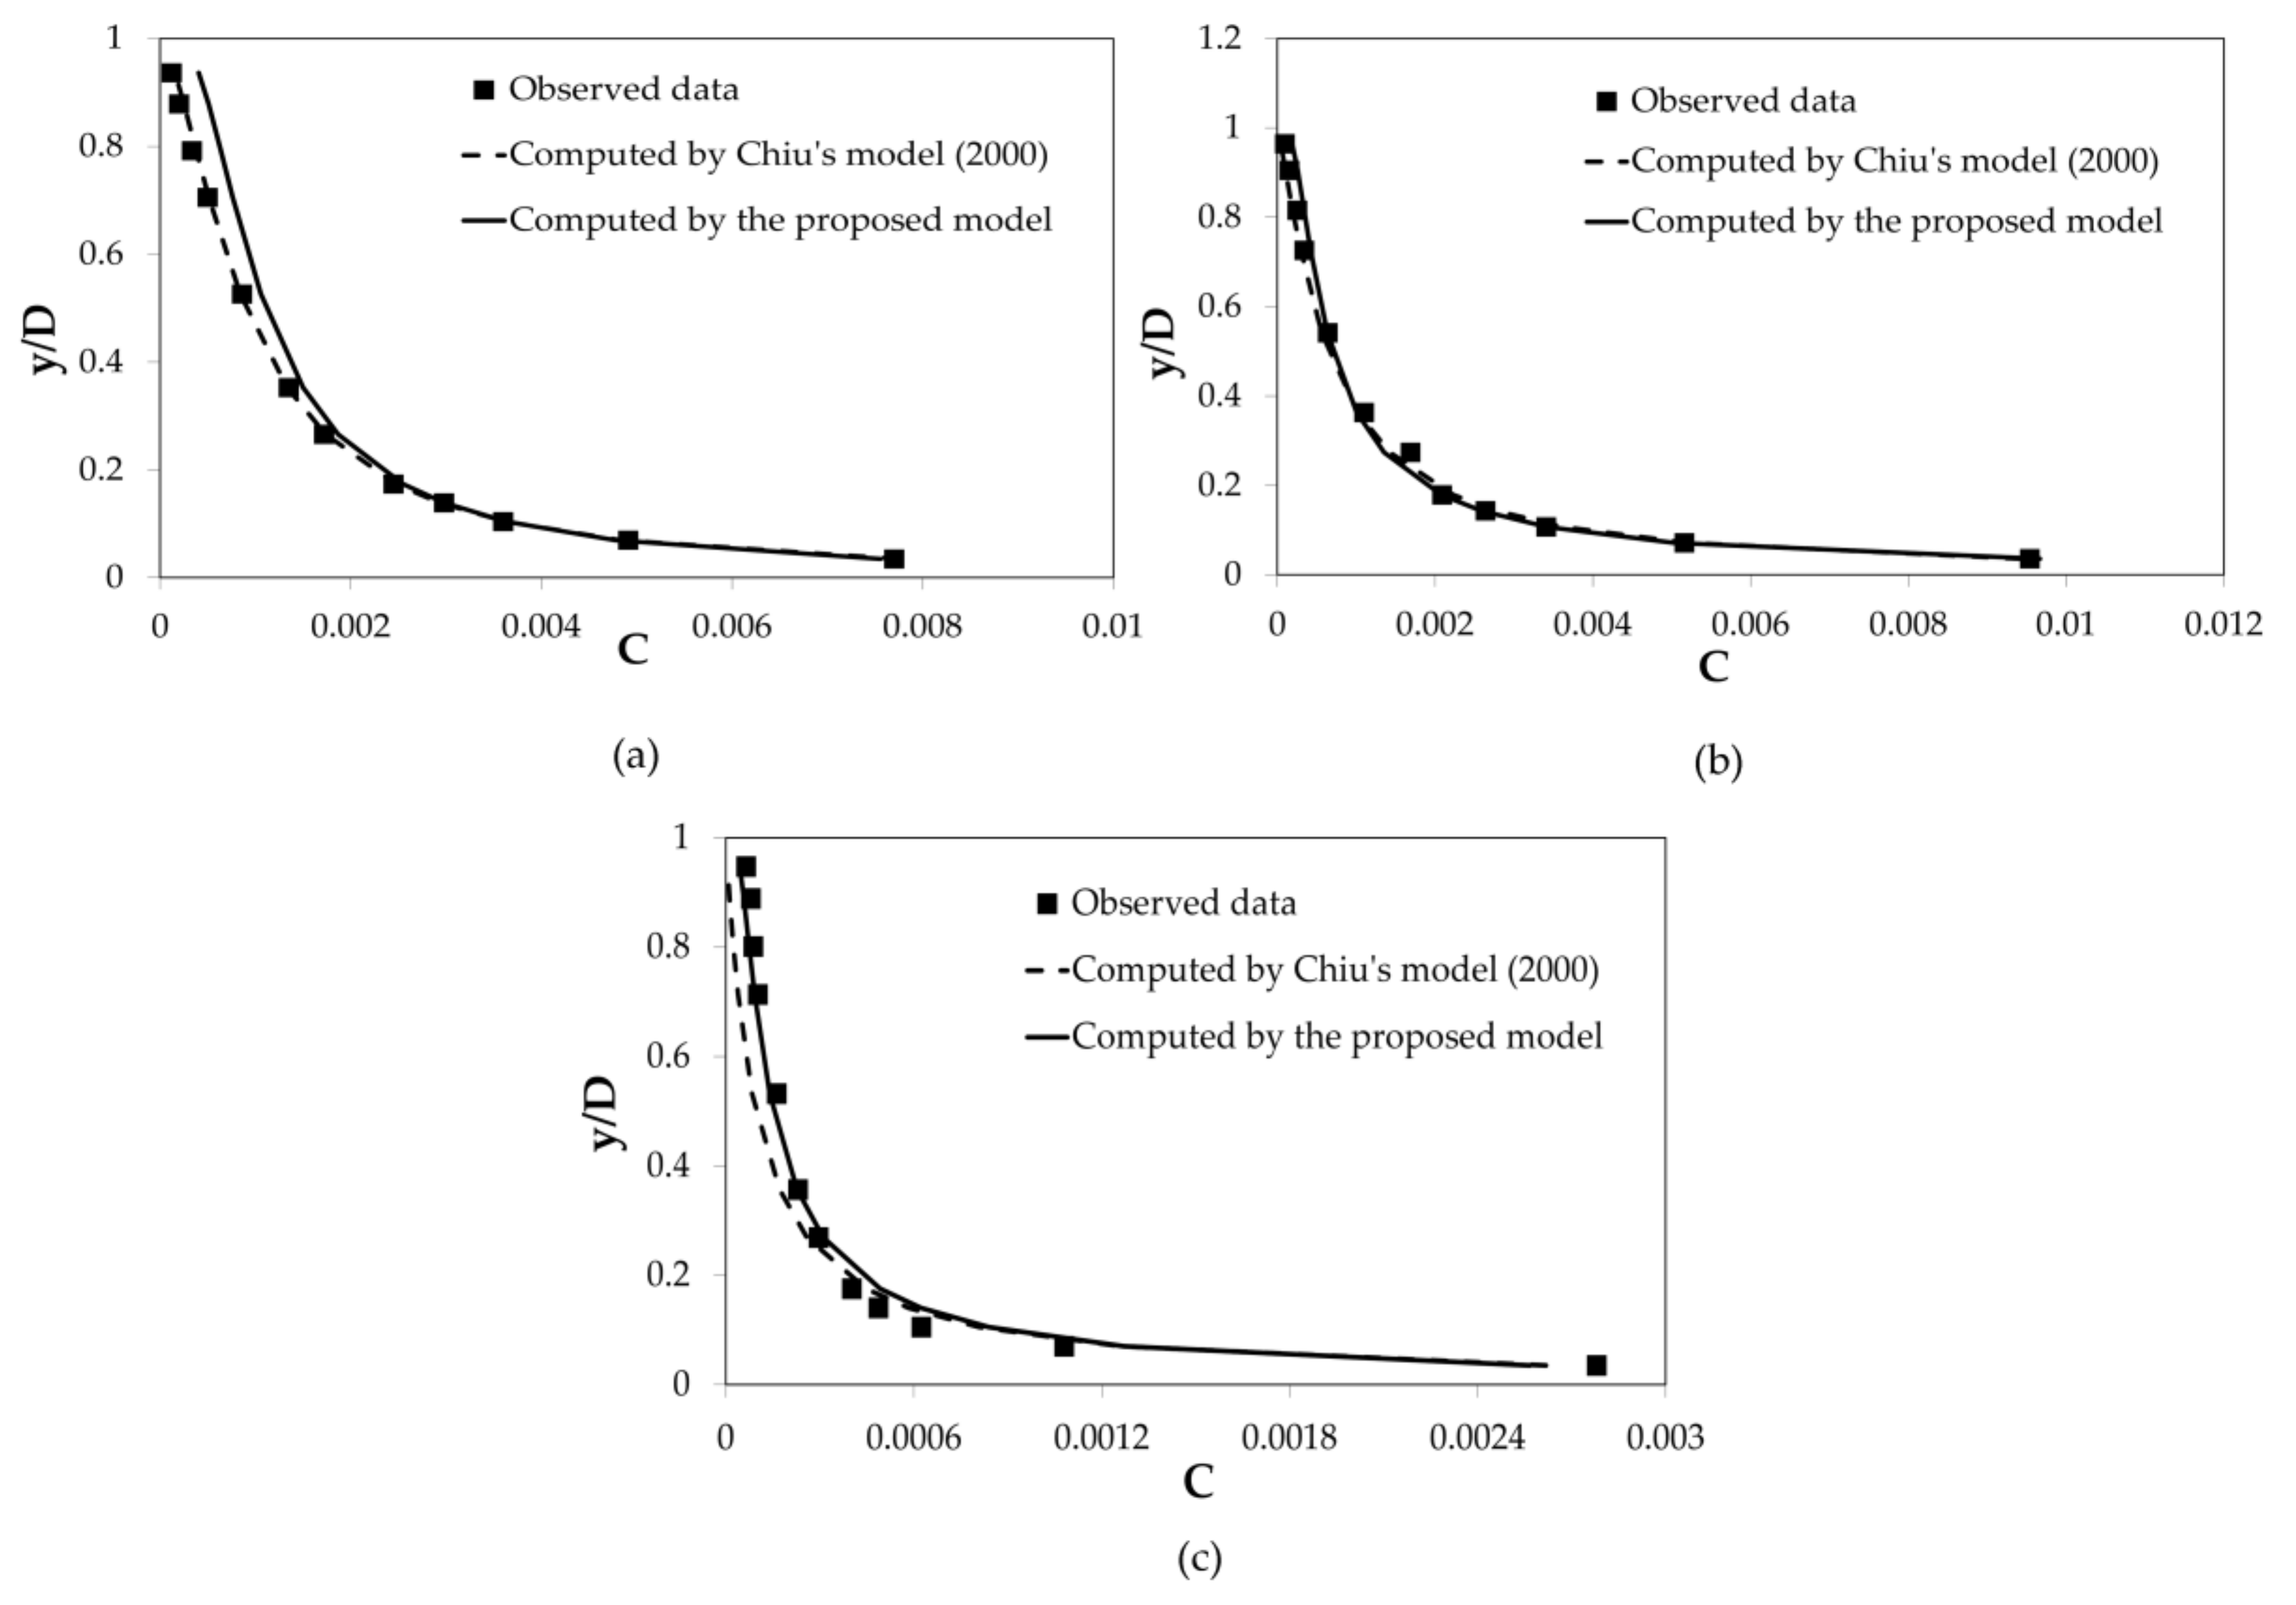
Figure 1 and
Figure 2 show the comparison between the observed concentrations referred to different diameters of sediment particles and the two theoretical curves (numerical Equation (15) vs. first-order analytical Equation (21)).
As can be seen from the figures above, the proposed simplified fully-analytical curve converges to the exact numerical solution near the bed and proves to be a very good predictor for the higher concentrations. Conversely, it is overall slightly less accurate in the upper part of the flow, as one would expect due to the wall approximation introduced by Equation (17). Interestingly enough, the present study’s model performs better than the numerical counterpart even near the free surface in the d50 = 0.075 mm-runs by Valiani and in the d50 = 0.420 mm-runs by Coleman.
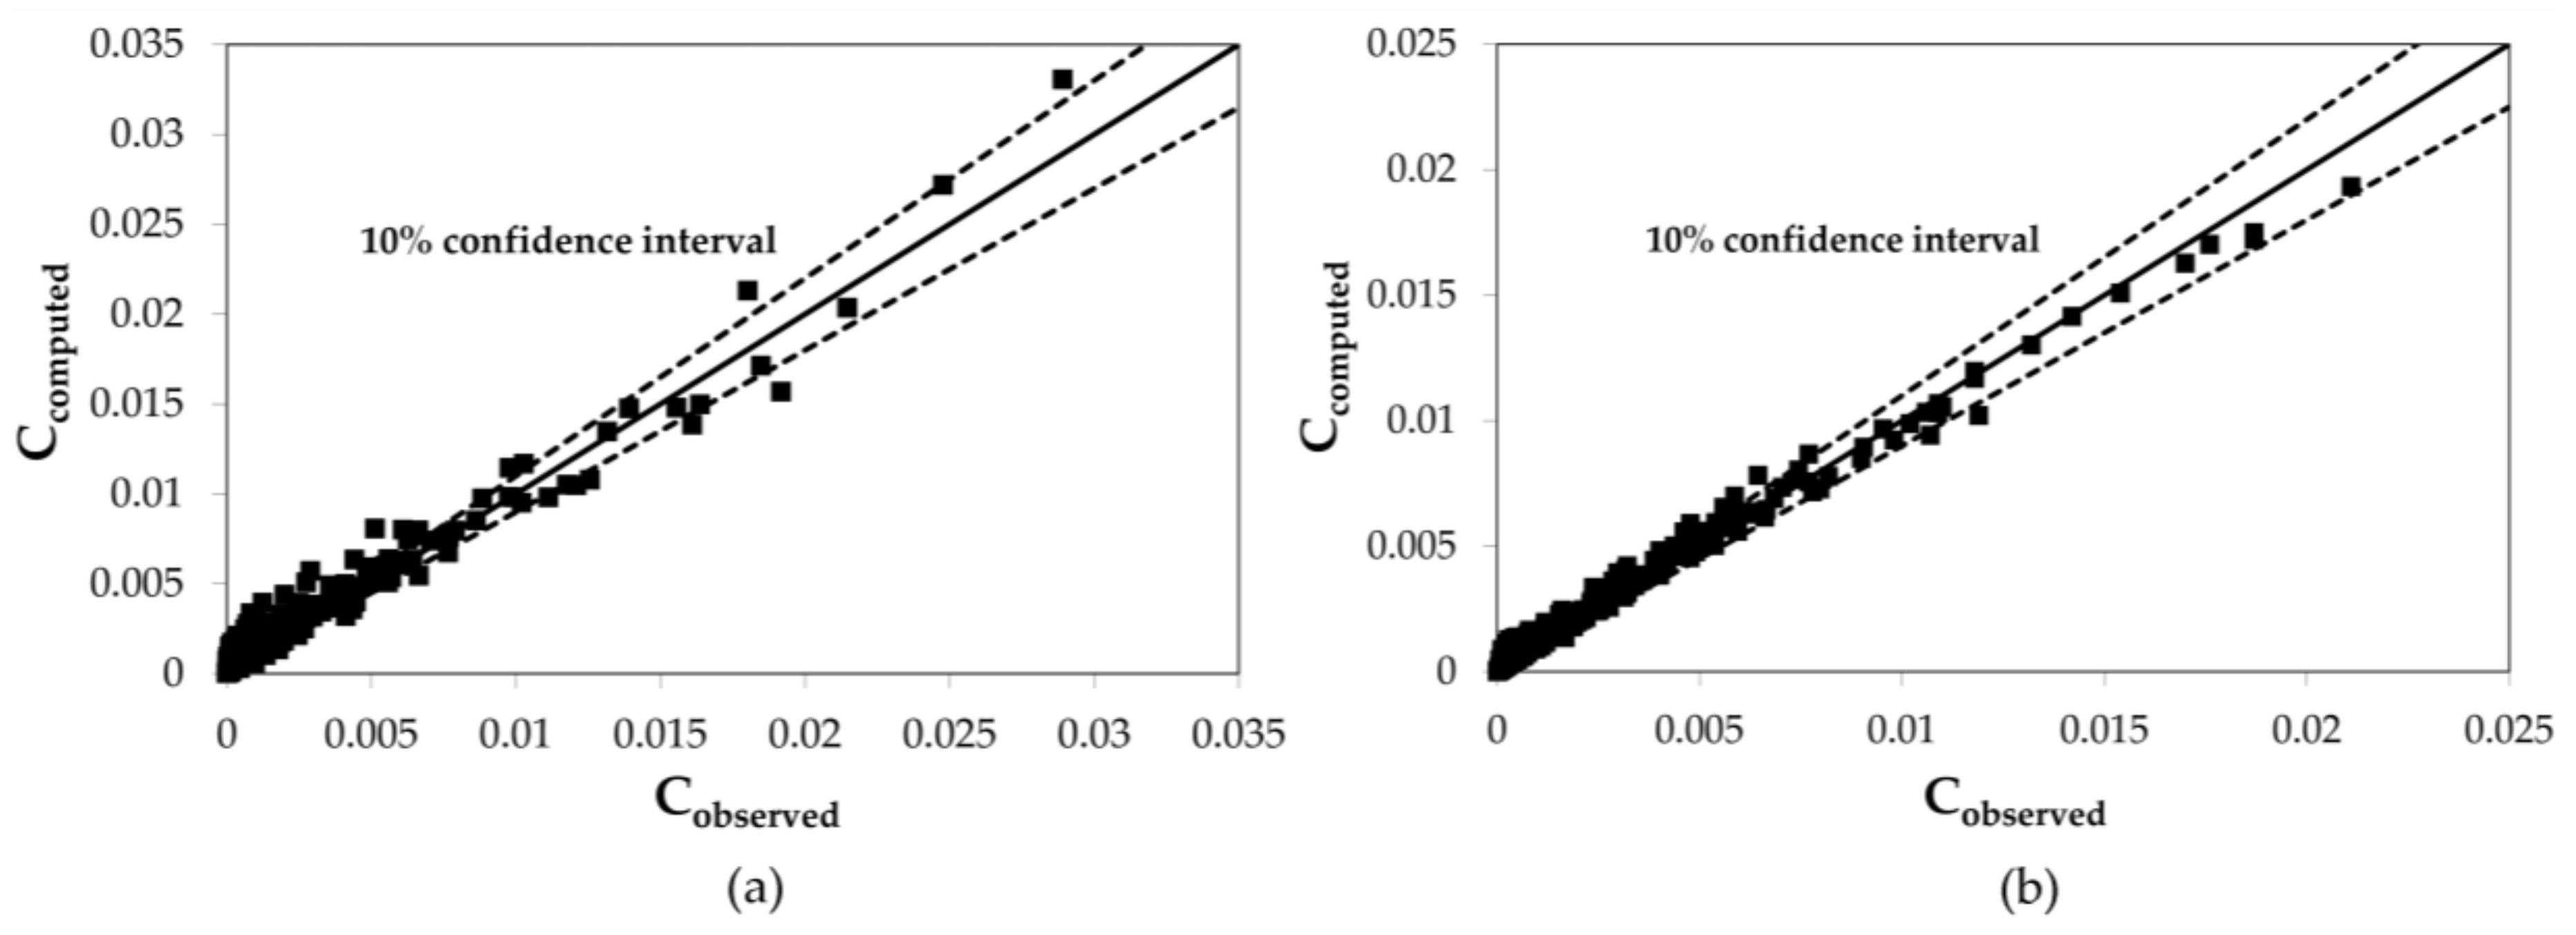
The accuracy of the proposed model is confirmed by the reduced standard deviation (7–12%), whose higher values correspond to the lower concentrations, typically affected by significant instrumental error (
Figure 3).
Equation (21) shows that the concentration distribution is controlled by parameters M and λ.
The entropic parameter
M accounts for cross-section geometry, roughness, and morphology, affecting the “slope” of velocity profile and shear stress distribution within the flow and on the bed [
31,
43,
44,
45,
46,
47,
48].
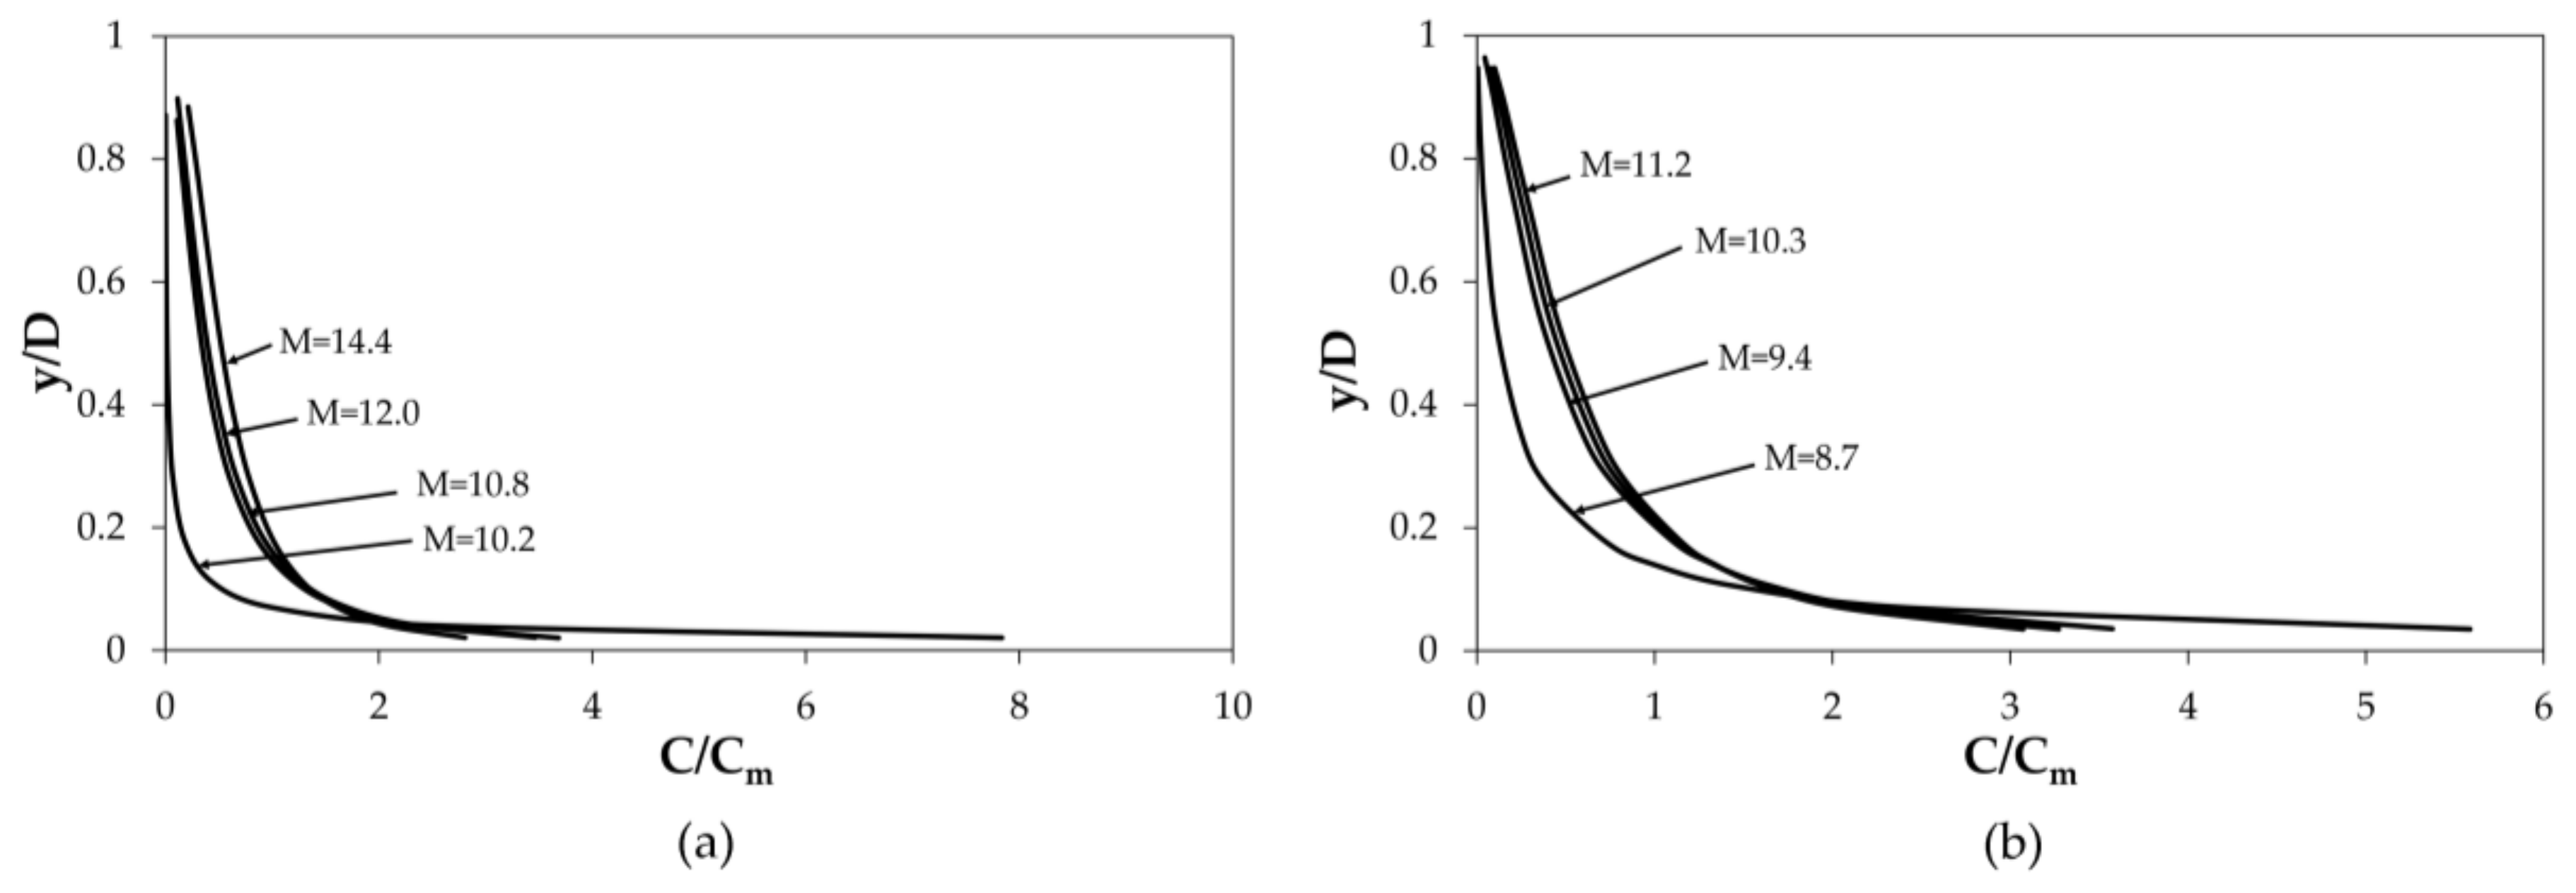
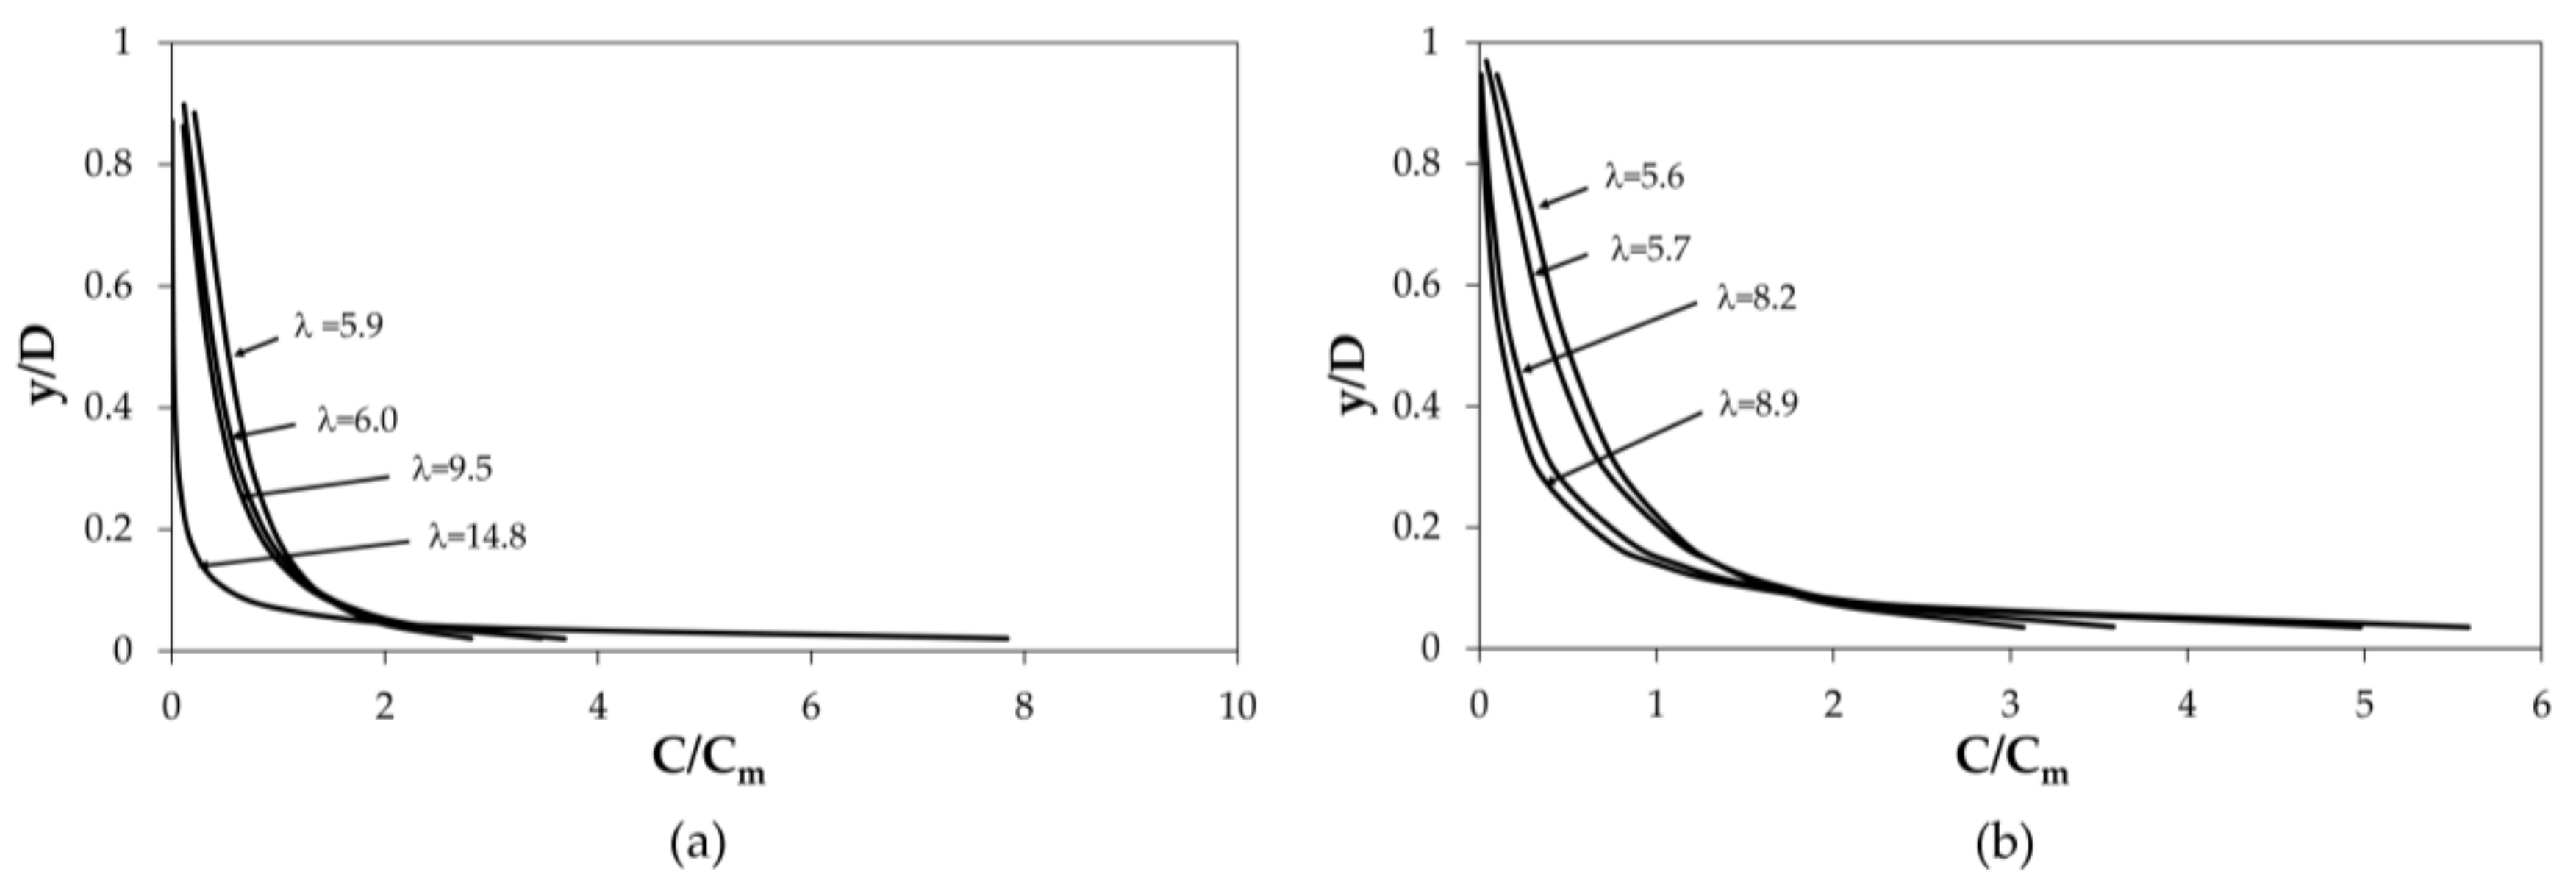
Figure 4, which shows
C/Cm (
Cm indicates the depth-average of
C) as a function of
y/D for different
M, computed from Equation (21), and the input flow data by Coleman and Valiani, illustrates how
M modifies the shape of the concentration profile. Specifically, according to Chiu’s statements [
40], as the entropic parameter increases and the cross-sectional velocity entropy diminishes, the distribution becomes more homogeneous and the suspended load interests also the upper part of cross-section. Conversely, as
M decreases and the entropy increases, the velocity profile becomes more heterogeneous and the suspended load is mainly concentrated in the lower part of the flow. Note that, as shown in
Figure 4a,b,
M has a limited variability as a function of flow rate. As a matter of fact, Chiu and Said highlighted how an erodible channel, due to changes in the boundary conditions [
43], can achieve a new equilibrium state by modifying hydraulic and geometrical characteristics as well as suspended load concentration. In this case, the velocity distribution and the related entropic parameter
M typically undergo negligible variations.
Being a function of the dimensionless Chèzy coefficient and grain Froude number, parameter
λ has a specific physical meaning that is associated with the relevance of particle gravitational convective forces as compared to shear stresses, and with the intensity of turbulence. For larger values of
λ, that is, for larger Ψ or smaller
sediment particles tend to be trapped near the bed and the concentration profile tends to be less uniform. Conversely, for smaller values of
λ, that is, for smaller Ψ or larger
the stream power is higher and the more intense particle lifting makes the suspended load concentration profile more homogeneous (see
Figure 5, which shows
C/Cm as a function of
y/D for different
λ computed from Equation (21) and the input flow data by Coleman and Valiani.
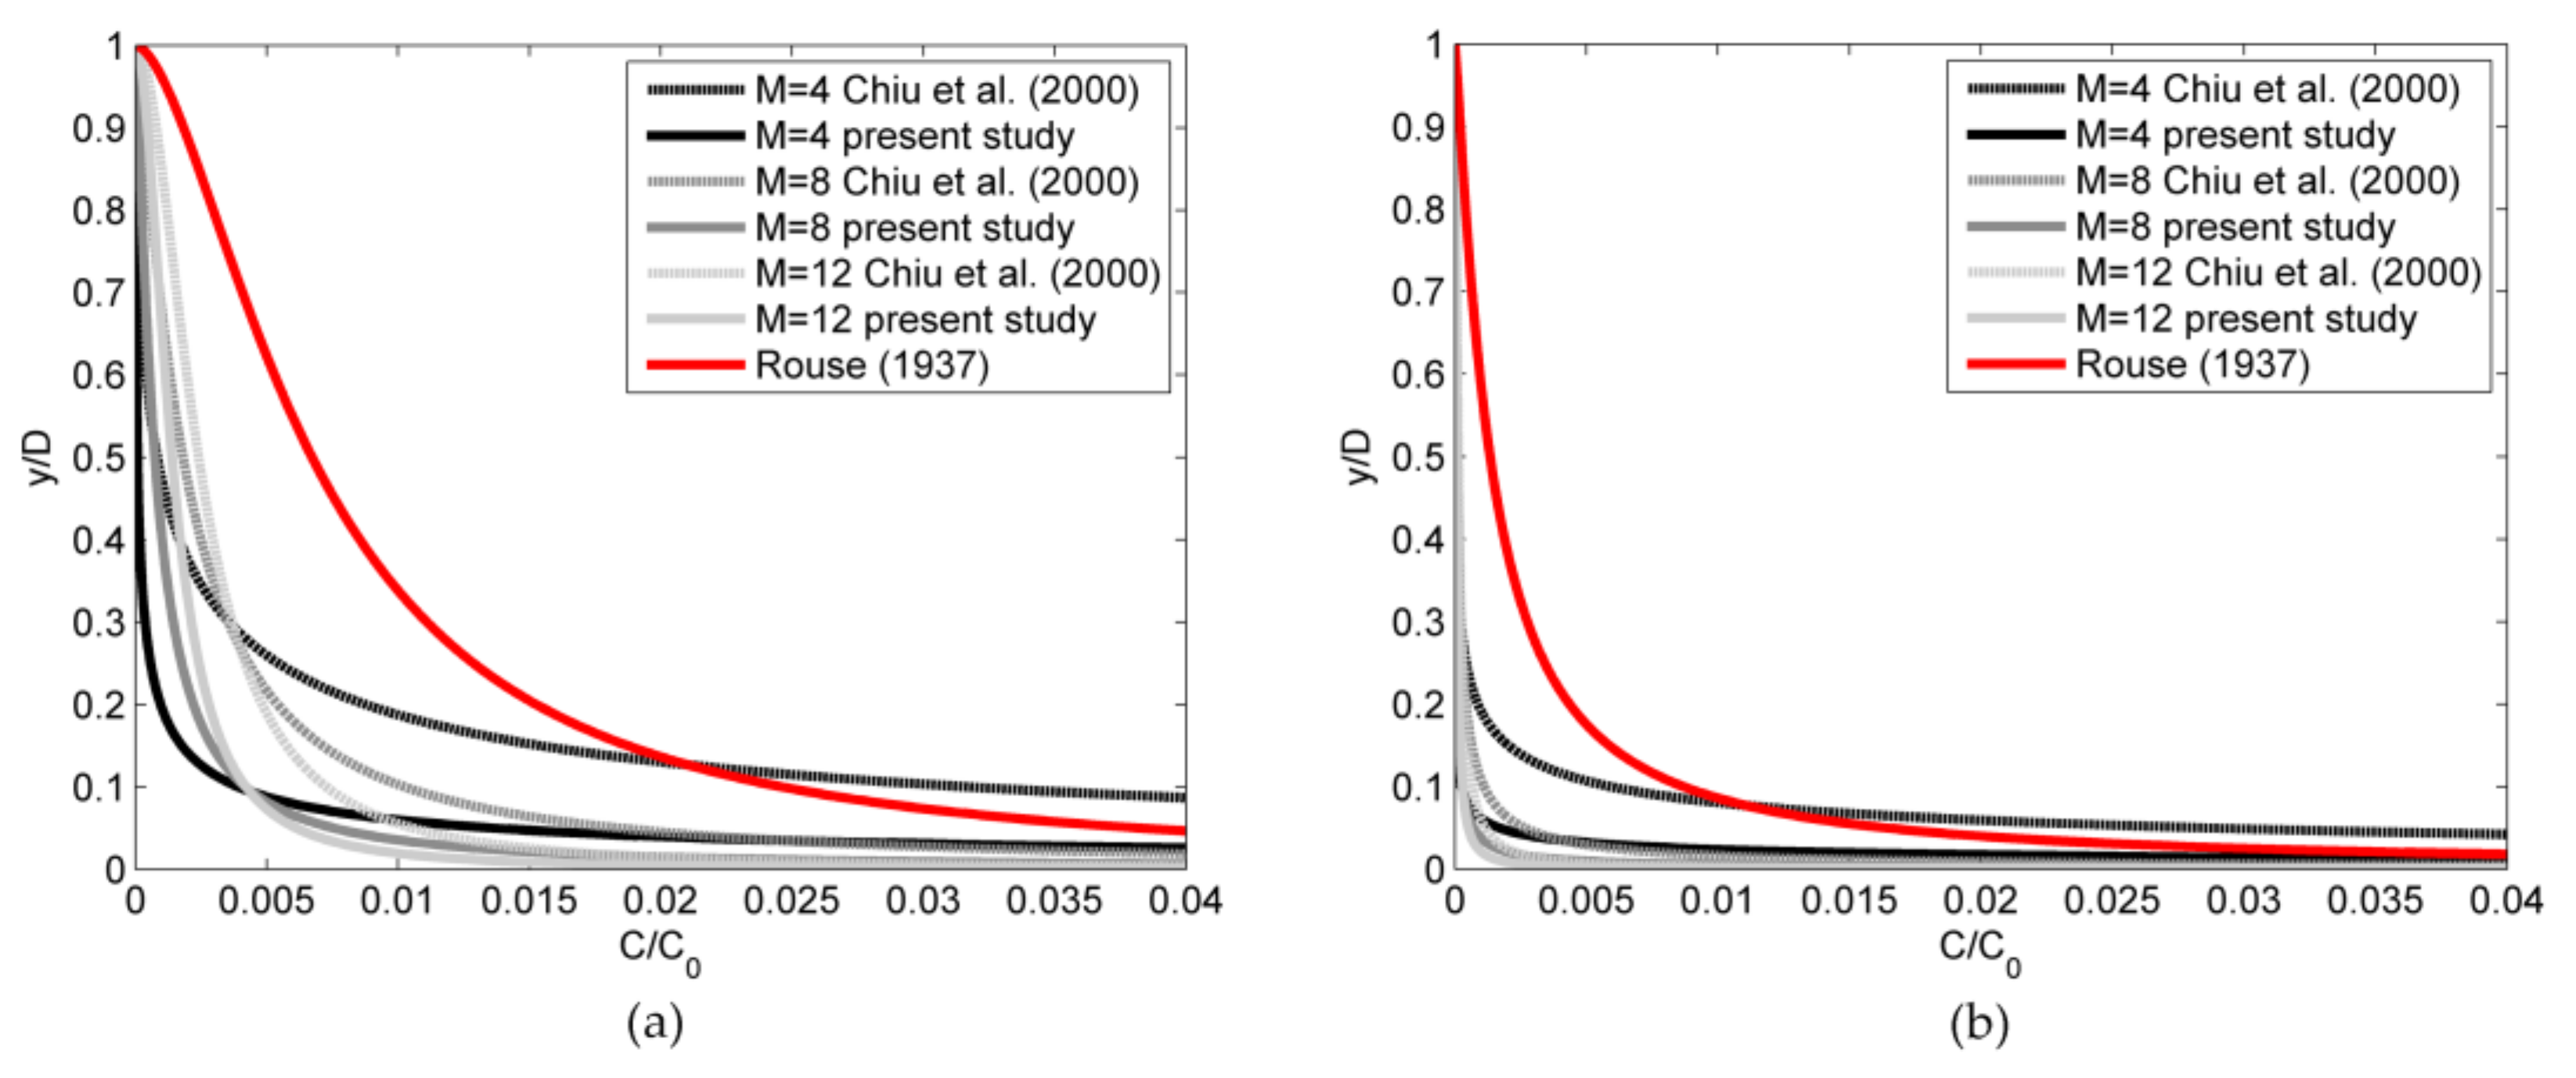
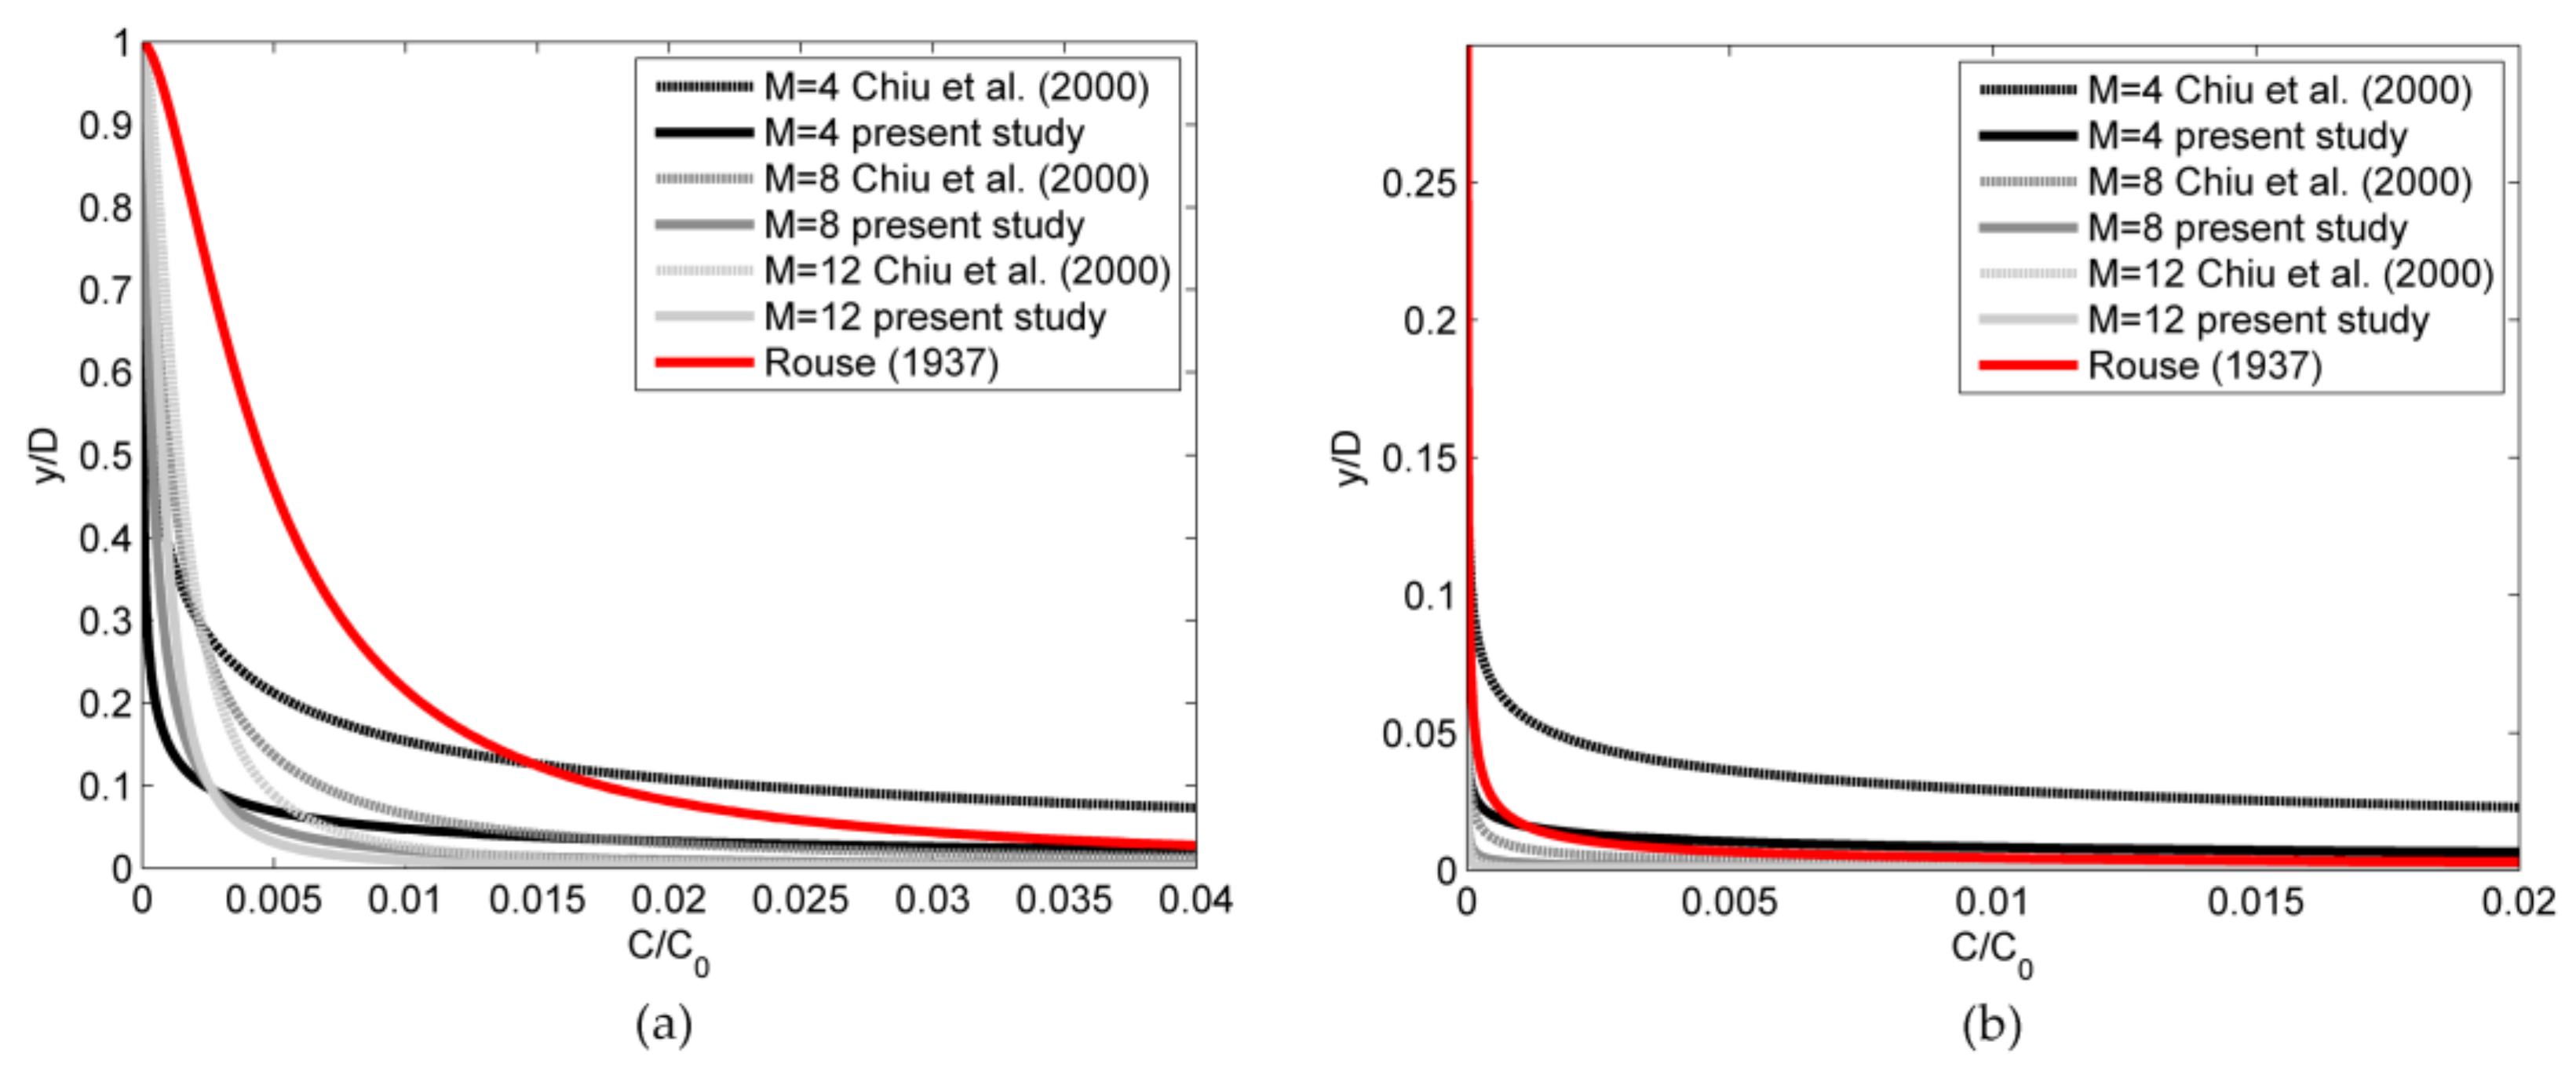
Figure 6a,b and
Figure 7a,b show the comparison among three truly analytical equations: Equation (6) by Rouse with a = 2d [
12], Equation (9) by Chiu et al. and Equation (21) (present study) [
30]. The proposed method starts from the simultaneous assessment of
h and
umax by an iterative procedure that only requires a very limited field sampling [
31], where the velocity dip position,
h, is a function of
M according to the following relationship:
As one can see from the figures, Rouse’s formula tends to overestimate the suspended load within the turbulent core for larger
λ (smaller grain sizes) and to underestimate it for smaller
λ (larger grain sizes). This is because the Equation (6) cannot suitably account for the reduction in mixing length due to the presence of sediment suspension. The occurrence of velocity dip position, which induces an effect that is similar to the virtual increment of viscosity in the upper fluid layers, determines a corresponding reduction of suspended sediment concentration. When the dip is more pronounced (
M = 4,
h = 0.23D), the analytical curve by Chiu et al. [
30], which ignores it, gives definitely out-of-range results. As mentioned in the introduction, several studies in the recent past reported detailed investigation on the interaction between suspended sediment concentration and vertical velocity profile. The method proposed by the present study synthesizes in a single parameter to be field-determined from time to time (
M) the effect of velocity gradient reduction due to the bi-phasic flow (by the assessment of
umax for given
D) and the occurrence of velocity dip position (by the assessment of
h). Indeed, from Equations (7) and (17) one obtains:
Thus, when umax increases D being the same, the gradient increases and vice versa. Similarly, when M decreases and h increases, the gradient increases and vice versa (which justifies the reduction in C/C0 for y/D→1 that was detected in the figures).
