Article

Estimating Time of Concentration for Overland Flow on Pervious Surfaces by Particle Tracking Method

1
Department of Civil Engineering, Auburn University, Auburn, AL 36849-5337, USA
2
Key Laboratory of Urban Stormwater System and Water Environment, Ministry of Education, Beijing University of Civil Engineering and Architecture, Beijing 100044, China
3
Billingsley Engineering, Las Vegas, NM 87701, USA
4
College of Hydrology and Water Resources, Hohai University, No. 1 Xikang Road, Nanjing, Jiangsu 210098, China
*
Author to whom correspondence should be addressed.
Water 2018, 10(4), 379; https://doi.org/10.3390/w10040379
Submission received: 5 February 2018 / Revised: 20 March 2018 / Accepted: 23 March 2018 / Published: 25 March 2018

Abstract

:
The particle tracking method (PTM) module was added into the open source Full Shallow-Water equations for Overland Flow in a two-dimensional (FullSWOF_2D) program, which has coupled rainfall–runoff and infiltration modules to determine the time of concentration (Tc) for impervious (Tci) and pervious (Tcp) surfaces. The updated program FullSWOF-PTM was tested using observed rainfall events with Nash–Sutcliffe efficiencies ranging from 0.60 to 0.95 (average of 0.75) for simulated runoff hydrographs. More than 400 impervious modeling cases with different surface slope (S0), roughness coefficient (n), length (L), and rainfall intensity (i) combinations were developed and simulated to obtain the Tci for developing the regression equation of Tci as a function of the four input parameters. More than 700 pervious modeling cases with different combinations of S0, n, L, i, and infiltration parameters including the saturated hydraulic conductivity, suction head, and moisture deficit were simulated to estimate the Tcp based on the travel time of 85% of particles arriving at the outlet and the ponding time. The regression equation of Tcp was developed as the sum of Tci and additional travel time as a function of infiltration parameters and i. The Tcp equation can be applied to wide ranges of input parameters in comparison to Akan’s equation.

1. Introduction

Mulvany [1] first put forward the concept of time of concentration (Tc) and Kuichling [2] defined Tc as the time needed for the runoff from the most remote part of a catchment to travel to the outlet during the rainfall–runoff process. It is widely used to design the highway and urban stormwater drainage facilities [3] using Tc as design rainfall duration [4]. There are dozens of studies where researchers developed and tested/compared Tc equations [5,6]. They obtained the Tc estimation using hydrograph analysis for laboratory plots/watersheds [7,8,9], theoretical derivation based on kinematic wave theory [4,10,11,12], and distributed physically-based numerical simulation programs utilizing topographic elevation and geometric data [13,14,15,16]. Izzard [7] developed a method to calculate the runoff hydrography and the time necessary to substantially reach an equilibrium of flow resulting from given rainfall intensity, roughness, slope, and the length of the overland flow plan based on the laboratory experiments. Compared to laboratory analysis and theory deduction, the distributed and physically-based numerical models solving the shallow-water equations (SWEs) are more and more widely used in overland flow simulation for its better performance dealing with mixed subcritical and supercritical flow compared to kinematic wave and diffusive wave approach or other approximation [17,18]. Su and Fang [15] established a two-dimensional numerical model based on shallow-water equations to estimate traveling time for different rainfall intensity, roughness, length, and slope modeling cases and developed the travel time estimation equation for relatively steep and very flat watersheds. Recently, more and more researchers moved their focus to the overland flow of pervious surfaces [19,20,21,22]. Hjelmfelt [23] analyzed the infiltration influence on the overland flow by combining the storage–depletion model of the U.S. Soil Conservation Service with the kinematic wave equations and found the variation of infiltration rate during a storm had a significant effect on the time of concentration and on the shape of the runoff hydrograph. In Guo’s study [4], the Wooding’s solution was expanded to overland flow on pervious surfaces by coupling the kinematic wave equations with the Horton infiltration model. Only Akan developed a time of concentration calculation chart [10] and a formula [24] using Manning’s friction law on rectangular pervious plots under constant-intensity rainfall based on the kinematic wave equations and Green–Ampt (GA) infiltration model. The time of concentration in Akan’s study was measured from the beginning of the rainfall event, which meant the ponding time (tp) and runoff travel time were lumped together in the formula. The chart and formula are mainly appropriate for the cases when Manning’s friction law is acceptable and there are limited ranges of rainfall and soil infiltration parameters. Further work is still needed, e.g., to expand the formula to other flow resistance laws and wide ranges of rainfall and soil infiltration parameters.
Conceptually, the time of concentration is when the entire catchment becomes contributory to the runoff at the outlet, but there are various methods that have been developed/used to estimate Tc. Tc for impervious areas (Tci) was typically estimated from hydrograph analysis, e.g., Tci as lapsed time from the beginning of a rainfall event to the outlet flow reaching 98% of the peak discharge, which is called Tc_q98 hereafter, since the runoff starts immediately after the rainfall, and Tc and the runoff equilibrium time are basically the same for impervious surfaces. The above method does not work for determining the time of concentration on pervious surfaces (Tcp) since the runoff does not start before the ponding time (tp) and then discharge increases asymptotically to peak or equilibrium discharge under constant rainfall intensity even after a long period of simulation. Guo [4] suggested evaluating Tcp of a small catchment by velocity-based methods rather than those empirical formulas developed for and calibrated by the observed hydrographs. The particle tracking method (PTM) is popular for generating path lines and travel time information since it directly utilizes the simulated velocity field results [25,26,27,28]. KC and Fang [29] developed a quasi-two-dimensional (2D) diffusion wave model (DWM) coupled with particle tracking to determine the time parameters including the travel time for 85%, 95%, and 100% of particles to arrive at the outlet (Tr_p85, Tr_p95, Tr_p100) of overland flow on impervious surfaces. These travel times have significant linear correlations with each other and a significant agreement between the Tr_p85 and Tc_q98 was found.
To understand and estimate Tcp for pervious surfaces is particularly important and useful to smart stormwater management using the lower impact development (LID) and green infrastructures (GI) that promote the infiltration [22]. Therefore, the goal of this study is to develop a Tcp equation for pervious surfaces that can be applied to wide ranges of rainfall, watershed, and soil parameters. First, the PTM module was added into the open source Full Shallow-Water equations for Overland Flow in a two-dimensional (FullSWOF_2D, version 1.07, Lab. J. A. Dieudonné & EPU Nice Sophia, Nice, France) [30] program for determining Tcp for pervious surfaces. The FullSWOF_2D program has already coupled the rainfall–runoff modules with the infiltration module [29] for possibly exploring Tcp after adding the PTM module (called FullSWOF-PTM). A total of 750 pervious modeling cases that are combinations of diverse values of rainfall intensity i (m/s or mm/h), watershed slope S0, Manning’s roughness coefficient n, length L (m), hydraulic conductivity K (m/s), suction head φ (m), and moisture deficit Δθ of pervious surfaces were generated considering different types of soil groups. Travel time for 85% of particles arriving at the outlet from the beginning of rainfall, which is determined using FullSWOF-PTM and called Tr_p85 hereafter, was used directly to evaluate Tci for impervious surfaces, and the Tr_p85 subtracting the ponding time tp was used to evaluate Tcp for pervious surfaces, which is consistent with Guo’s study [4] but different from Akan’s equation [24]. The multiple linear regression (MLR) method was used to derive the Tci and Tcp equations as a function of input parameters.

2. Materials and Methods

2.1. Shallow Water Equations (SWEs) and FullSWOF_2D

As a Saint-Venant system [31], the simplified SWEs model is widely used to simulate the incompressible Navier–Stokes flow occurring in rivers, channels, ocean, and land surfaces [32]. It is derived with two assumptions: one is that the fluid velocity is constant along the vertical (z) direction and that the water depth is small with respect to the horizontal (x, y) dimensions; another is that the pressure of the fluid is hydrostatic ( p / z = g ), which means the pressure field could be calculated with simple integration along the vertical (z) direction [30,33]. The conservative form of the 2D SWEs including the continuity equation and two momentum equations for x and y directions are stated as the following equations:
h t + h u x + h v y = R I
h u t + x ( h u 2 + g h 2 2 ) + y ( h u v ) = g h ( z x + S f x )
h v t + x ( h u v ) + y ( h v 2 + g h 2 2 ) = g h ( z y + S f y )
where R (m/s) is the rainfall intensity; I (m/s) is the infiltration rate; h (m) is the cell water height (depth); z (m) is the cell topography elevation; u (m/s) and v (m/s) are the cell depth-averaged velocities in x and y directions, respectively; Sfx and Sfy are the cell friction slopes in x and y directions, respectively; g (m/s2) is gravity acceleration; t (s) is time.
The FullSWOF_2D program fully solves SWEs on a structured mesh in two space dimensions using the finite volume method (FVM) which ensures mass conservation compared to the finite difference method (FDM) [34]. A well-balanced scheme was adapted to guarantee the positivity of water depth and the preservation of steady states for specific hydrological features such as during wet-dry transitions and tiny water depth [30,35]. Different boundary conditions, friction laws, and numerical schemes were developed which make the program a very powerful overland flow simulation software. The parallelization strategies of FullSWOF_2D were also examined to improve its simulation efficiency dealing with large-scale cases [35]. A modified bi-layer (crust- and soil-layer) Green–Ampt (GA) infiltration model [36] to calculate I for Equation (1) was coupled in the FullSWOF_2D [34] which enables the program to simulate overland flow on impervious and pervious surfaces.
FullSWOF_2D has five boundary condition choices including the imposed discharge and water height case, wall condition, Neumann boundary (open boundary) condition, periodic variations of discharge and water height, and imposed discharge condition. It has three options of friction formulas including the Manning’s equation, the Darcy–Weisbach equation, and the laminar law, as well as the no-friction setting. The simulation domain could be set nonuniformly by defining the friction value of every computational cell with an input file. The Rusanov flux, Harten–Lax–Van Leer (HLL) flux, Harten–Lax–Van Leer with Contact surface (HLLC) flux, HLL2, and HLLC2 [30] methods are provided to calculate every time level flux between computational cells. Three linear reconstruction methods include the MUSCL, ENO, and modified ENO, as well as three slope limiters, including the classical Minmod slope limiter, Van Albada limiter, and Van Leer’s limiter, which are used in the reconstruction part of the 2nd order numerical scheme. The details about the numerical flux, reconstruction methods, and the limiters could be found in Bouchut’s book [37].
The FullSWOF_2D has been validated using several analytical solutions and benchmarks of the steady-state solutions and the transitory solutions. The steady-state solutions validated by FullSWOF_2D include the emerged bump at rest and Mac Donald test cases with different settings. The transitory solutions include the dam break on a dry domain and Thacker test case with a planar surface in paraboloid [38]. It is also widely used in the river flood simulation in a complex environment based on high-resolution topographic data [39] and spatial global sensitivity analysis of high-resolution classified topographic data in 2D urban flood modeling [40].

2.2. Particle Tracking Method (PTM) and FullSWOF-PTM

The PTM is a powerful method to study the characteristics of complex flow velocity fields during steady and transient state using simulated velocities from flow-governing equations, e.g., Equations (1)–(3) for shallow overland flow. It is widely used in different research areas, especially the groundwater flow and pollutant transport study [41]. Most of the commonly used PTMs provide satisfactory results for steady-state analysis [42]. PTMs could also be used for transient analysis under the assumption that the velocity field does not significantly change during the simulation duration. In Cheng’s study [28], a PTM was developed based on the Lagrangian–Eulerian finite element method (FEM) which could reduce the numerical errors considerably and enable the PTM to trace fictitious particles in a complex flow field. It is suggested that the PTM could be extended to transient simulations by tracking velocity calculated with the velocity field of previous time levels and current time levels (stepwise approximation) when the FEM is used to solve the transport equations. Bensabat et al. [27] and Lu [43] developed a linear temporal interpolation scheme instead of a stepwise temporal approximation in order to count for the changes in velocity during a time step in complex unsteady flow while it is only suited to the FDM rather than FEM or FVM. The travel time and the pathlines could be generated using PTM directly incorporated with the overland flow simulation velocity field results.
In the previous study [29], the PTM using simulated velocities from DWM was developed to determine the travel time of different percentage particles’ arrival at the outlet. The travel time of each particle in the simulation domain is computed using the PTM module that uses flow velocity fields simulated by the quasi-two-dimensional DWM at every time level. Over each time step, the particle travel distance is determined by the product of the appropriate tracking velocity (interpolated by the spatial linear method) and time step interval. In this study, a PTM module was incorporated with FullSWOF_2D using a simulated velocity field at each time step, and the updated program became FullSWOF-PTM. A fourth-order Runge–Kutta (RK4) spatial interpolation scheme rather than linear spatial interpolation scheme [42] was adapted to get the particle velocity at each time step at different locations of the simulation domain. The temporal change of all particles was calculated and updated using the simulated particle velocity and time interval at every time step.
The following algorithm is implemented in the PTM code of FullSWOF-PTM at each time step: (1) The particle location is checked to determine whether it is within the simulation domain. If the particle arrives at the outlet cell, it is ignored and the tracking process moves on to the next particle. (2) The computational cell that the particle locates in and the adjacent cell for each particle are determined based on the particle location. (3) The particle velocities in x- and y-directions are spatially interpolated using a RK4 scheme based on the simulated x and y velocities of the cell that the particle locates in and adjacent computational cells at the time step. (4) The new locations of all particles are calculated and updated using previous locations, current particle velocities, and time step intervals. (5) The particle with the new location is checked again to determine whether it stays in the simulation domain or arrives at the outlet cell and gets out of the domain. (6) The percentage of particles remaining in the simulation domain is counted. The particle evolution information of each time step including the total number and percentage of particles remaining in the simulation domain is outputted during the whole simulation period with FullSWOF-PTM. A user interface for FullSWOF-PTM was developed using MATLAB r2017a (MathWorks, Natick, MA, United States) [44] to run all impervious and pervious cases in batches.

2.3. Modeling Cases

Three kinds of modeling cases were developed and simulated in this study: 11 testing cases, 446 impervious cases, and 750 pervious cases, and details are described below.

2.3.1. FullSWOF-PTM Testing Cases

FullSWOF-PTM was validated using 11 rainfall events as testing cases to demonstrate that it can be used for accurate overland flow simulations. In Esteves’s study [36], a 2D overland flow model solving SWEs based on an explicit FDM and coupled with the GA infiltration module was developed and calibrated/validated with the observed data on a natural hillslope plot. These observed rainfall and runoff data from 11 events plus the plot topography and soil infiltration data were obtained from Dr. Esteves and first used to test the FullSWOF-PTM model. The plot was 14.25 m long and 5 m wide, bordered by 150 mm wide cement blocks driven about 50 mm into the ground [45]. The cell size used in the simulation was 0.25 m based on a detailed topographic survey. The Darcy–Weisbach friction law (friction coefficient = 0.25) was used in the simulation. The plot was crusted, almost without vegetation. The infiltration model parameters including the saturated hydraulic conductivity (K, 0.0162 mm/h for crust and 77.4 mm/h for soil below), saturated water content (θs, 0.245 for crust and 0.296 for soil), and suction head (φ) of crust layer and soil, as well as the crust layer thickness (0.005 m) were all the same as the calibrated parameters used in Esteves’s study [36].
The plot slope in x- and y-directions were 0.0640 ± 0.0292 (from the right to left boundary) and 0.0196 ± 0.0155 (from the top to bottom boundary), respectively. The right, top, and bottom boundaries of the study plot were all set as wall condition and the left (downstream) boundary was as Neumann (open) condition based on the field situation. The HLLC flux choice in FullSWOF-PTM was selected from the 1st order numerical scheme to calculate the new time level flux of each computational cell in the simulation. The Courant–Friedrichs–Lewy (CFL) condition (CFL = 0.4) was used to guarantee the numerical stability and calculate the time step interval for the simulation.
The rainfall data was measured with an electronic tipping-bucket recording rain gauge (each tip corresponding to 0.5 mm of rainfall). The discharge at the plot outlet was measured through a triangular 20° V-notch weir at every 5-second interval. The initial water content of the soil at the beginning of the rainfall was measured using a neutron-probe access tube located in the center of the plot [36]. The moisture deficit was calculated as the difference of saturation water content ( θ s = prosity ) and initial moisture content (θi).
The goodness of fit for the simulated hydrograph is evaluated using the Nash–Sutcliffe Efficiency (NSE) coefficient [46].
N S E = 1 j = 1 m ( Q o j Q s i ) 2 j = 1 m ( Q o j Q ¯ ) 2
where Q o j (m3/s) is the jth observed runoff rate, Q s j (m3/s) is the corresponding simulated runoff rate, Q ¯ (m3/s) is the mean observed runoff rate, and m [-] is the total number of observed runoff rates. The NSE values for 11 rainfall events were calculated and compared with those reported by Esteves’s program to evaluate the FullSWOF-PTM. The FullSWOF-PTM’s performance was further evaluated by comparing simulated and observed runoff depth and peak discharge at the outlet.

2.3.2. Impervious Modeling Cases

Using FullSWOF-PTM to model the overland flow on impervious surfaces has two purposes: (1) validating FullSWOF-PTM since calculated Tci can be compared with many previous studies or established equations, and (2) Tci will be used to develop Tcp equation. A total of 446 impervious modeling cases with different combinations of S0, n, L, and i were simulated. In this study, the cell sizes in x- and y-directions and simulation domain width used for impervious and pervious modeling cases were 0.25, 0.25, and 1 m (4 cells in the y-direction, no cross slope), respectively. The Manning’s friction formula was selected among three friction formulas of FullSWOF-PTM. Figure 1 shows the model-parameter value distributions of the 446 cases, which also prove the parameter values are representative and set in the commonly used ranges [3].
For 446 impervious modeling cases, the plot longitudinal slope S0 ranges from 0.0005 to 0.1 with the average slope of 0.0133 and standard deviation of 0.0175, and 86% of the cases have S0 ≤ 2%. The Manning’s roughness n ranges from 0.01 to 0.8 with 86% of n values less than 0.1. The plot length L ranges from 20 to 250 m; the rainfall intensity i ranges from 10.2 to 256.5 mm/h with the average value and standard deviation of 80.8 and 64.0 mm/h, respectively. There are 384 modeling cases with S0 ≤ 0.02, 395 cases with n ≤ 0.15, 435 cases with L ≤ 150 m, and 381 cases with i ≤ 150 mm/h.
The topography file, rainfall file, particle initialization file, and model parameter file are required for FullSWOF-PTM in the impervious modeling cases, which were created using user-developed MATLAB code. The 2nd order numerical scheme in FullSWOF-PTM including the numerical flux methods (5 choices), linear reconstruction settings (3 choices), and slope limiters (3 choices) were tested using one impervious modeling case (S0 = 0.05, L = 35 m, n = 0.01, and i = 12.7 mm/h), which aims to identify the best numerical scheme among the 45 combinations. After performing the tests, all other impervious modeling cases were run in batches with MATLAB code using the tested best numerical scheme combination.

2.3.3. Pervious Modeling Cases

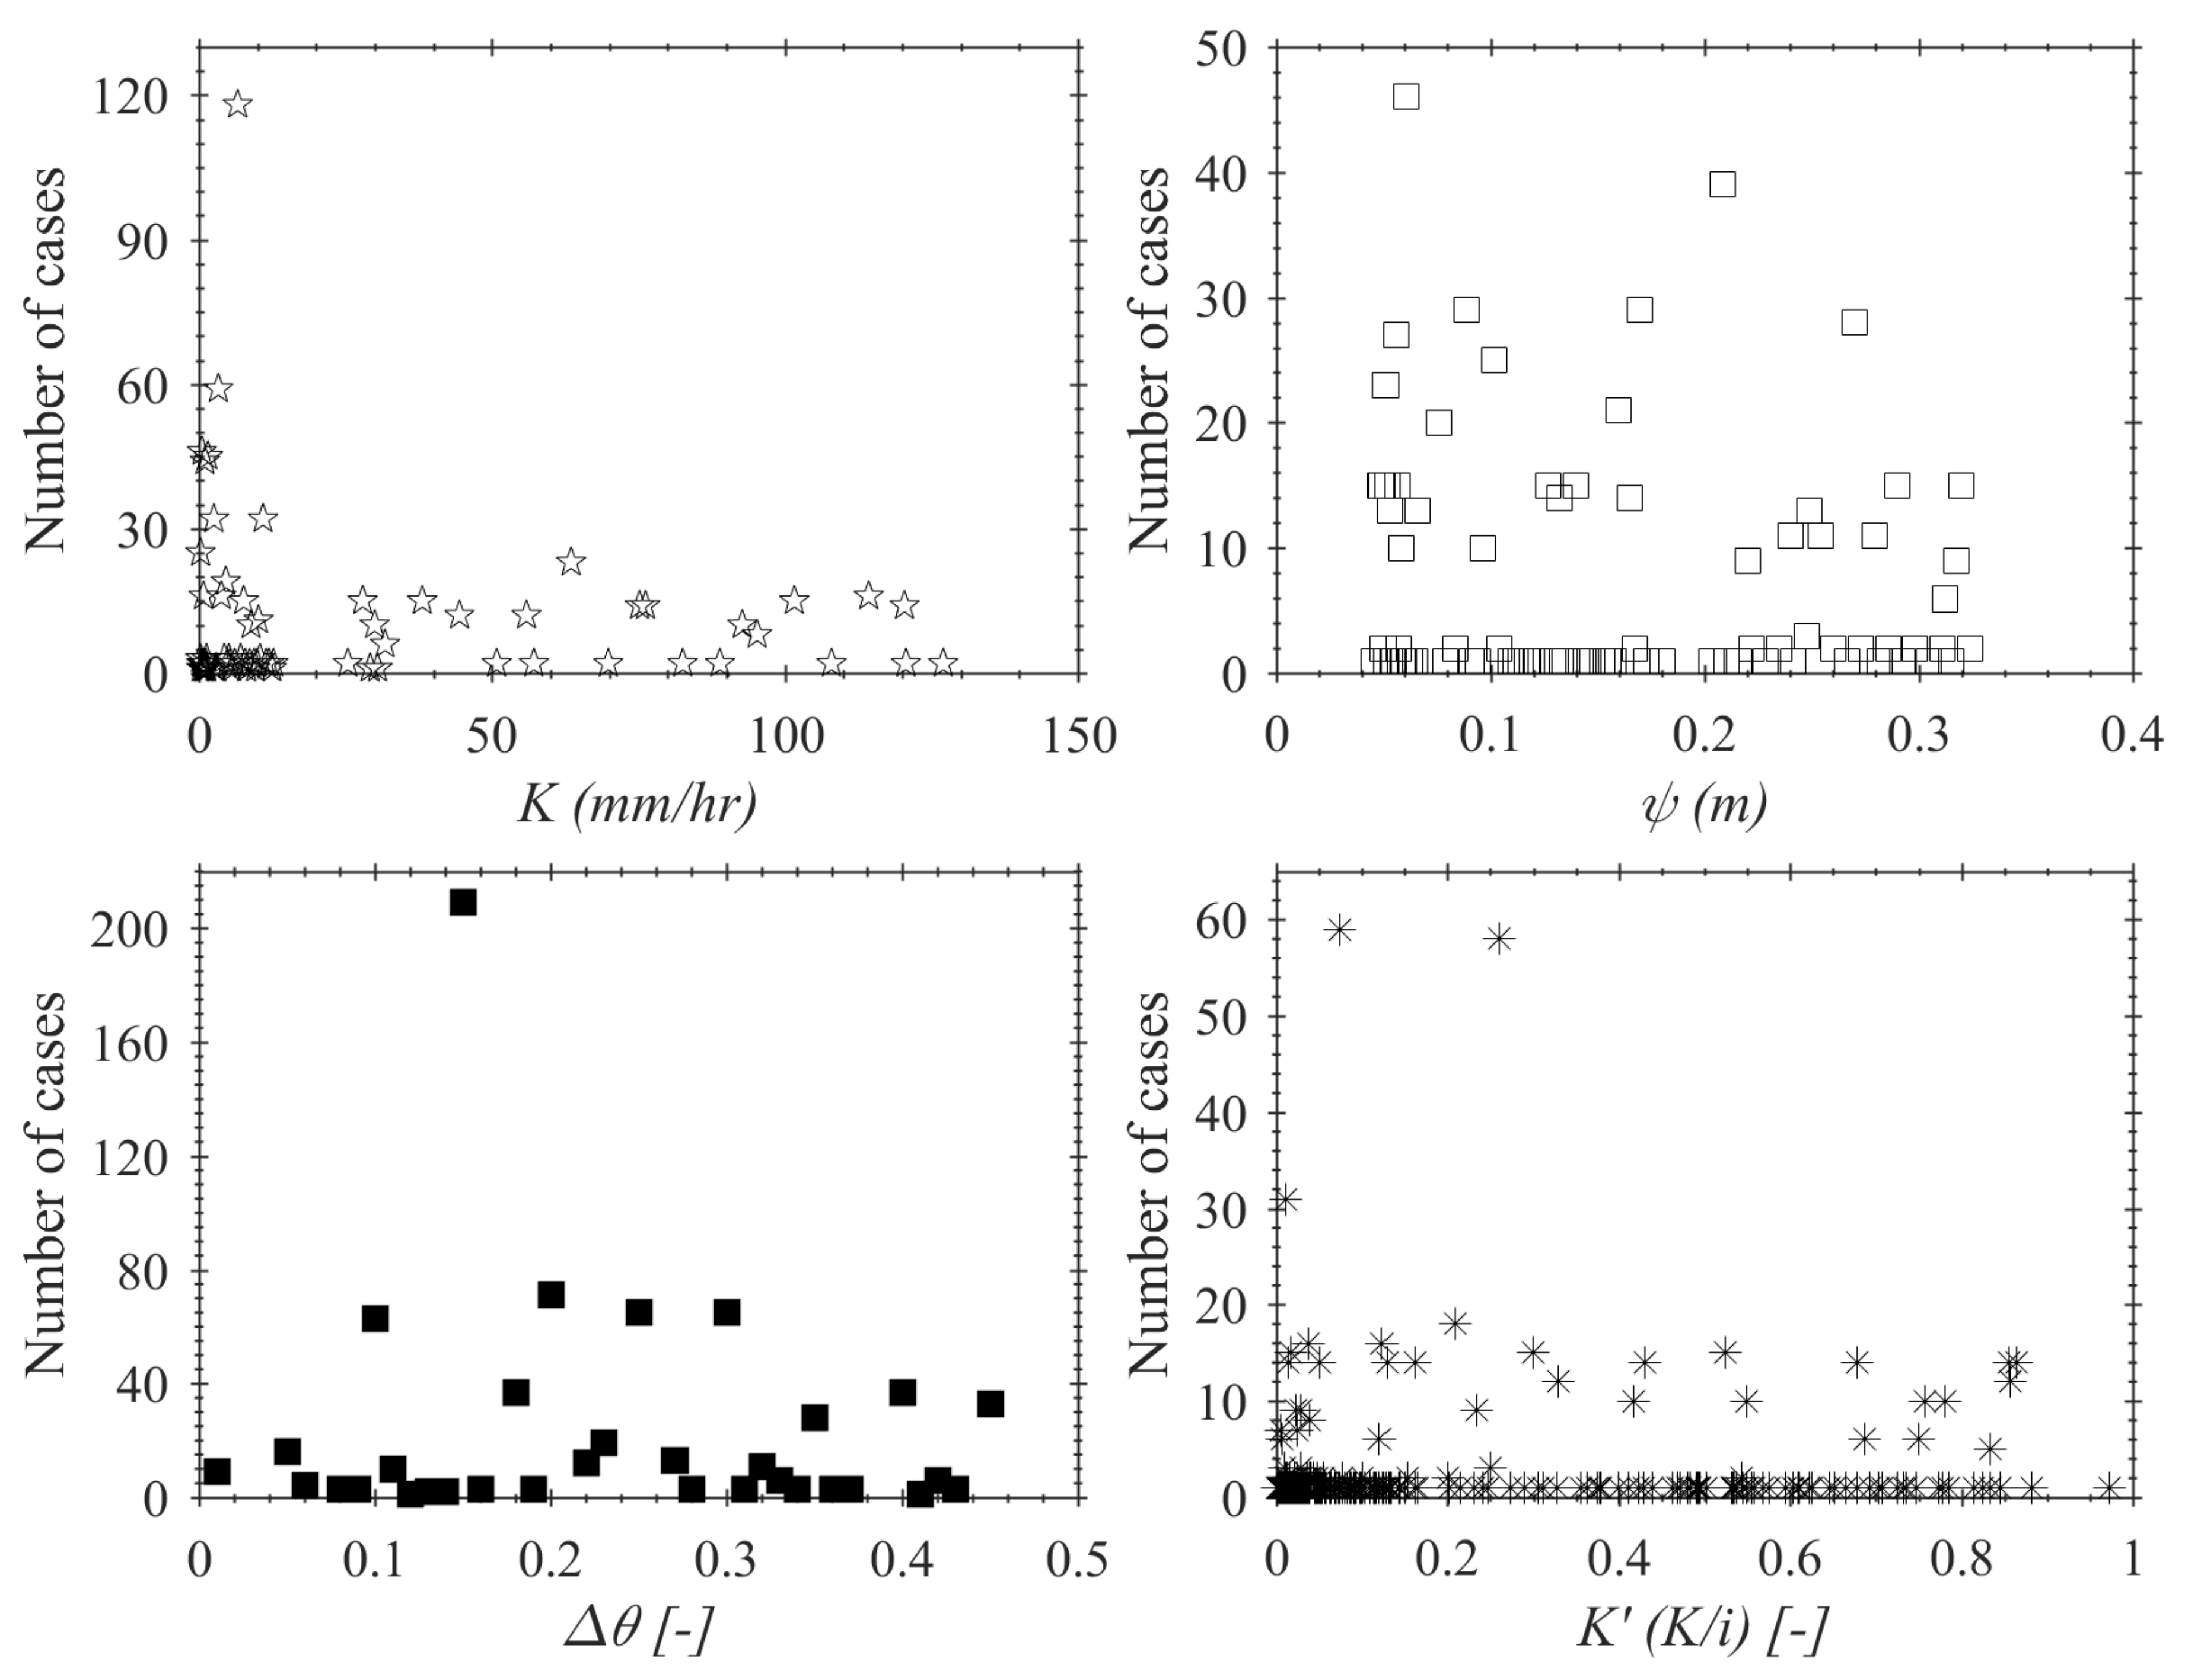
The GA infiltration parameters for different soil types of pervious surfaces were adapted from the research conducted by Rawls et al. [47]. The soil was categorized in this study into three groups: sand (K ranging from 25.4 to 127.0 mm/h), loam (K ranging from 2.54 to 12.7 mm/h), and clay (K ranging from 0.23 to 1.52 mm/h) groups depending upon the saturated hydraulic conductivity. There were 204, 350, and 196 modeling cases for sand, loam, and clay soil, respectively. A total of 750 modeling cases were developed and simulated while one Tcp equation was derived from the results of all pervious surfaces rather than developing three equations for different soil groups. The crust thickness of the pervious plots is set equal to zero because this study focused on the influence of soil property on the Tcp for pervious surfaces. The soil infiltration parameters (saturated hydraulic conductivity K, suction head φ, and moisture deficit Δθ) used for the 750 modeling cases are shown in Figure 2. A dimensionless saturated hydraulic conductivity K′ (=K/i), which was used by Akan in the derivation of the Tcp equation for pervious surfaces [24], was calculated and ranged from 0.001 to 0.97 for the 750 modeling cases (Figure 2). Since K′ is less than 1, it means K < i and all pervious modeling cases should produce runoff eventually when the rainfall duration is long enough. Equation (5) developed by Akan [24] is limited to K′ ≤ 0.4, i.e., i ≥ 2.5 K, which means Akan’s equation does not apply to relatively small rainfall intensity in comparison to K, but in reality i can be larger or even smaller than K. When iK, it is not applicable to determine the Tcp for pervious surfaces since there is no surface runoff as all rainfall is infiltrated.
T c p _ A = ( L n S 0 ) 0.60 1 ( i K ) 0.40 + 3.1 K 1.33 φ Δ θ i 2.33      ( For   K     0.4 )
The representative values of infiltration parameters of three soil groups were selected from literature [47] for 750 modeling cases. The saturation hydraulic conductivity ranges from 0.23 to 127 mm/h. The soil dry suction head ranges from 0.0457 to 0.3238 m. The moisture deficit ranges from 0.01 to 0.45.

3. Results and Discussion

3.1. FullSWOF-PTM Testing Results

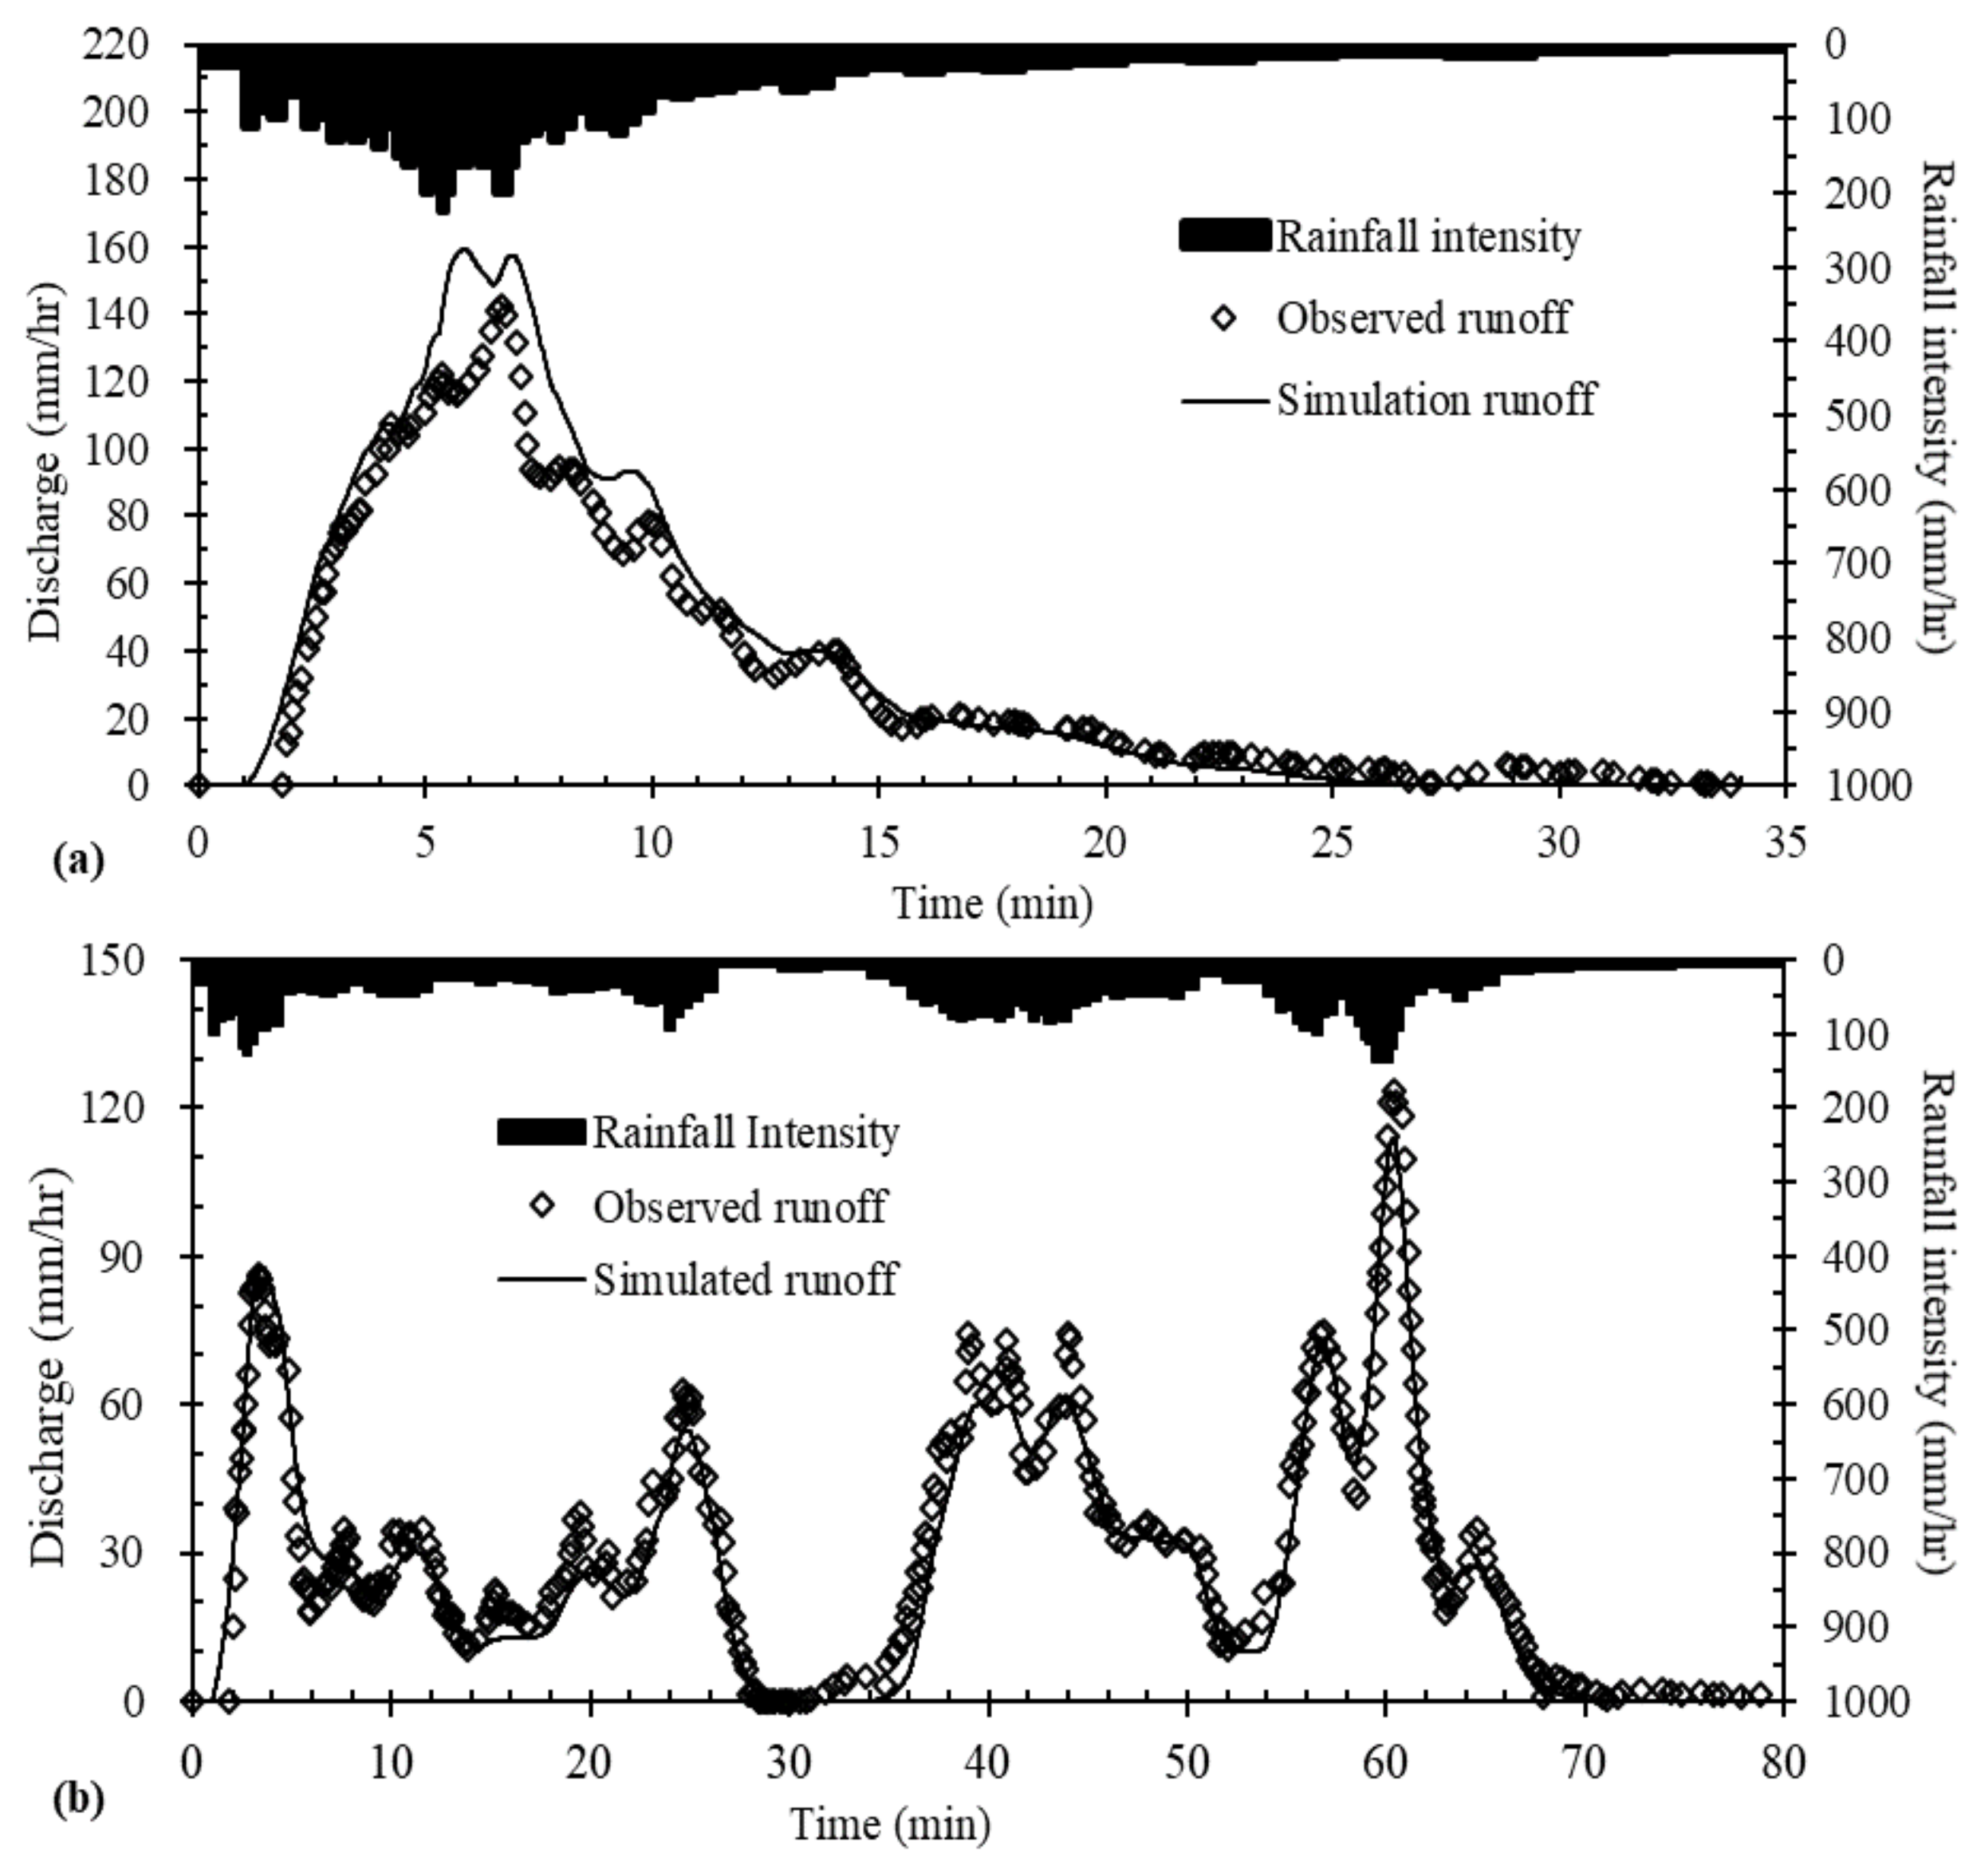
The simulated discharges from FullSWOF-PTM were divided by the drainage area and compared to the observed runoff data (mm/h) for all 11 testing events. The comparison of observed and simulated discharge hydrographs on 24 August and 4 September, 1994, are shown in Figure 3 as sample results, and the hydrographs closely follow rainfall variations. It shows that the FullSWOF-PTM simulation results have strong consistency with the observed data during the whole rainfall period.
For 11 rainfall events, the initial moisture content θi ranged from 0.048 to 0.106 (Table 1). Since the soil porosity of the field was 0.296, the moisture deficit Δθ ranged from 0.190 to 0.248. The discharge NSE values of FullSWOF-PTM and Esteves’s programs ranged from 0.64 to 0.95 (average ± standard deviation as 0.75 ± 0.11) and from 0.46 to 0.93 (0.79 ± 0.15), respectively; and this indicates FullSWOF-PTM performed as well as Esteves’s program in simulating overland flows. Table 1 also gives the comparison of simulated and observed runoff depths (mm) and peak discharges (mm/h). The percent errors of simulated runoff depths and peak discharges are 1.9% ± 15.9% (average ± standard deviation) and −4.4% ± 16.3%, respectively. The results for all 11 rainfall events (Table 1 and Figure 3) show that the FullSWOF-PTM program predicts the rainfall–runoff process of overland flows on a pervious surface with reasonable accuracy.

3.2. Time of Concentration (Tci) of Impervious Surfaces

In previous studies [2,7,9,15,48], Tc was evaluated as the time when discharge at the outlet reaches a specific percentage of the equilibrium discharge, e.g., 90%, 95%, or 98% of peak discharge (Qp). However, it is difficult to evaluate Tc for pervious surfaces using the fixed percent Qp because there is almost no equilibrium discharge for pervious surfaces. In this study, the travel time for 85% of particles arriving at the drainage outlet (Tr_p85) was used to evaluate the Tc for both impervious and pervious surfaces based on the previous PTM studies [29].
Figure 4 shows simulated outlet discharge and the in-domain particle percentage versus time under eight Manning’s roughness coefficients but the same plot slope, length, and rainfall intensity. The 2nd order numerical scheme combinations HLL2 for the numerical flux, ENO for the linear reconstruction, and Vanleer for the slope limiter [37] were used for the simulation because the simulated Qp was exactly the same as Qp calculated by the rational method and the run time for the program is the shortest. Simulated discharges verses time by FullSWOF-PTM give S-hydrographs [49] in Figure 4 under the constant rainfall intensities over a long period of time. The outlet discharge increases and the in-domain particle percentage decreases as the constant rainfall continues, and finally both reach the equilibriums. Based on the rational equation, the peak discharge (Qpr) for all eight runs should be the same and equal to 0.864 L/s, which is the same as FullSWOF-PTM simulated Qp (Figure 4).
On Figure 4, Tc_q98 is the Tc defined or calculated as the travel time when the runoff reaches the 98% percent of the equilibrium discharge Qpr, and Tr_p85 is the travel time when the in-domain particle percentage is 15%. Both Tc_q98 and Tr_p85 increase with the increase of the roughness (Figure 4) since the flow velocity is smaller with higher roughness. Figure 4 indicates that Tc_q98 is somewhat smaller than Tr_p85 for each case, which is the same as the conclusion of the previous research [29].
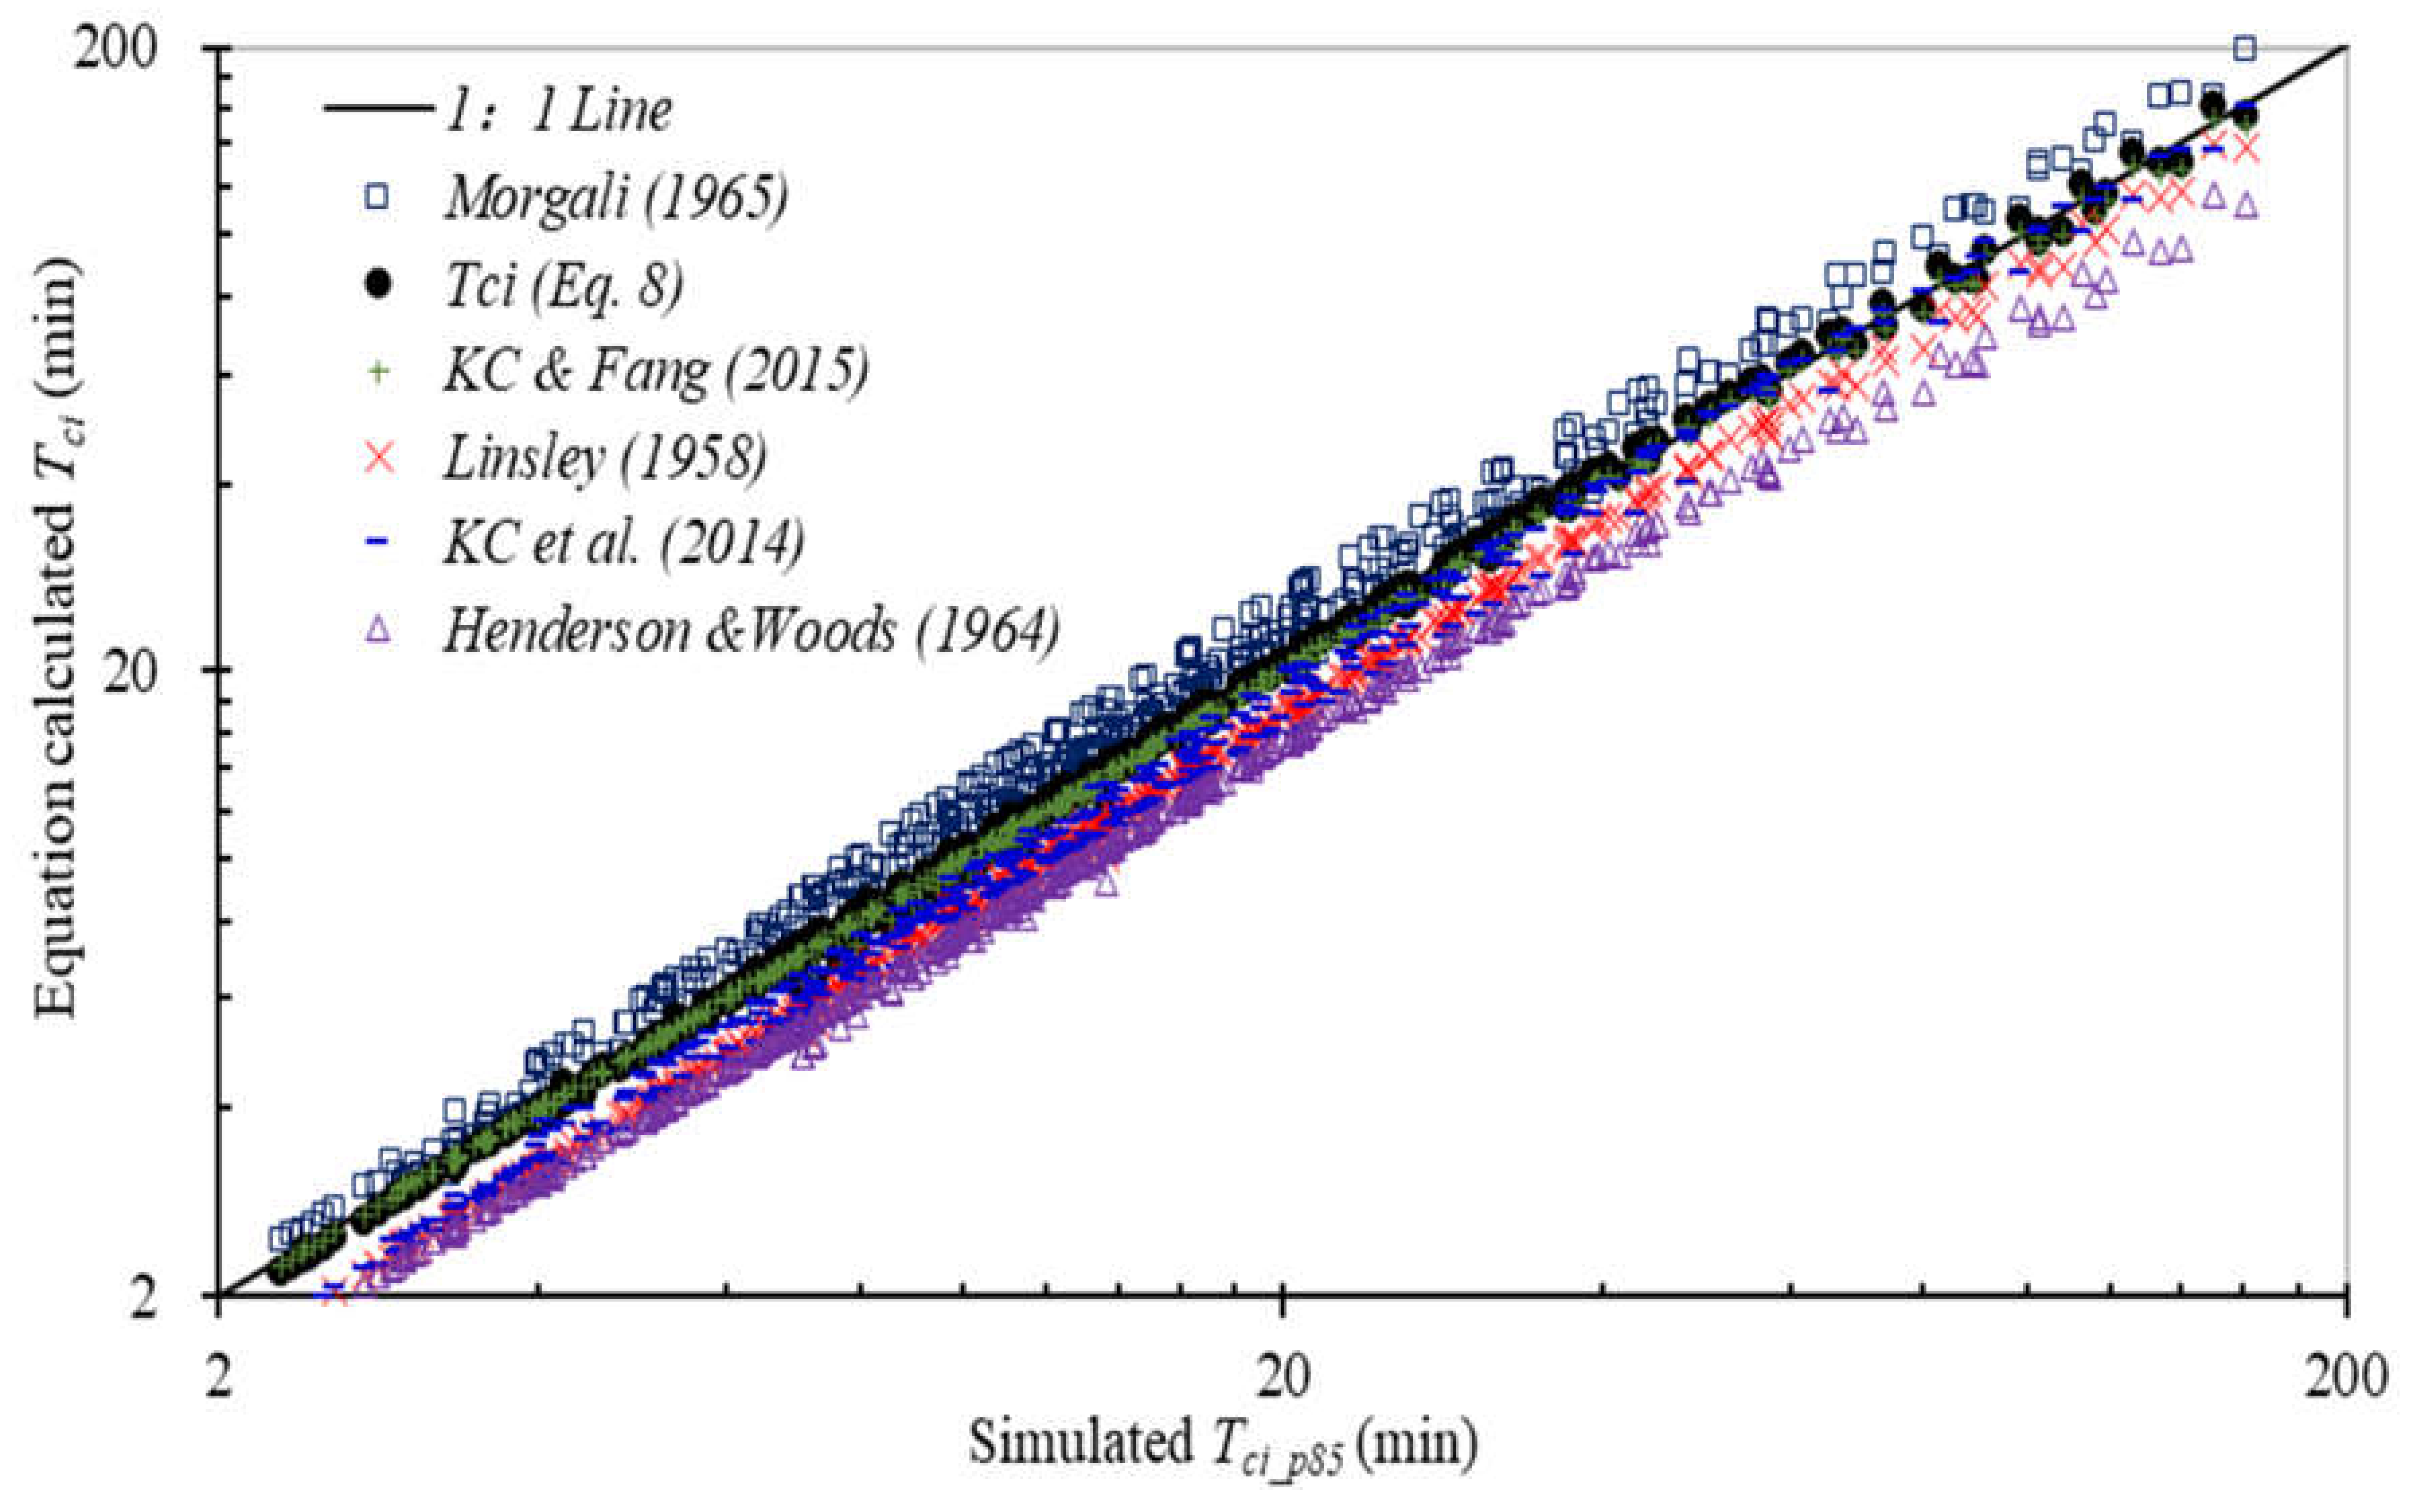
A generalized power relation, Equation (6) was chosen to develop the regression equation for Tci as a function of four input/influencing parameters (L, n, So, and i). The three influencing parameters L, n, and So that describe/characterize the overland flow surface were grouped as a combined parameter (Ln/ S 0 ) because the Manning’s equation was used in FullSWOF-PTM as friction formula for the overland flow resistance [24]. The Tr_p85 obtained from FullSWOF-PTM was considered as Tci or Tci_p85 (Figure 5), and Tr_p85 values for all 446 impervious modeling cases were used to develop the Tci regression equation.
T c i = ( L n S 0 ) k 1 1 i k 2
The exponents (k1 and k2) were estimated using the MLR method after the log transformation of Equation (6), and the resulting regression equations of Tci_p85 are:
T c i = ( n L S 0 ) 0.608 1 i 0.422     ( R 2   =   0.996 )
T c i = 9.741 × ( n L S 0 ) 0.608 1 i 0.422
where L is in (m), n is in [-], S0 is in [-], Tci of Equation (7) is in seconds and Equation (8) in minutes, respectively, when i for Equation (7) is in m/s and for Equation (8) in mm/h. FullSWOF-PTM uses i in m/s for all computations (1 m/s = 3,600,000 mm/h). The 95% confidence intervals for k1 and k2 are [0.606, 0.610] and [0.421, 0.423] with p-value < 0.0001, respectively. The average difference between Tci calculated using Equation (7) and simulated Tci_p85 is 0.11 min with a standard deviation of 1.45 min (Figure 5).
Figure 5 shows calculated Tci from Equation (8) and five other equations [50,51,52,53,54] versus simulated Tci_p85. The calculated Tci from all six equations (Table 2) linearly correlates well with the simulated Tci_p85 as indicated by R2 > 0.994 and regression equations in Table 2. This proves Equation (8) developed from Tci_p85 predicts well Tc for impervious surfaces and the travel time for 85% of particles to arrive at the outlet can be considered as Tci with reasonable accuracy. The root-mean-square error (RMSE) value of the KC and Fang’s equation (2015), also based on the travel time for 85% of particles to arrive at the outlet [29], is the smallest (1.38 min, Table 2) and the RMSE of Equation (8) is just slightly larger. In overall, the Henderson & Woods and Linsley equations underestimate Tci_p85 while the Morgali equation overestimates, and the remaining three equations predict Tci well with lower RMSE for impervious surfaces.

3.3. Time of Concentration (Tcp) of Pervious Surfaces

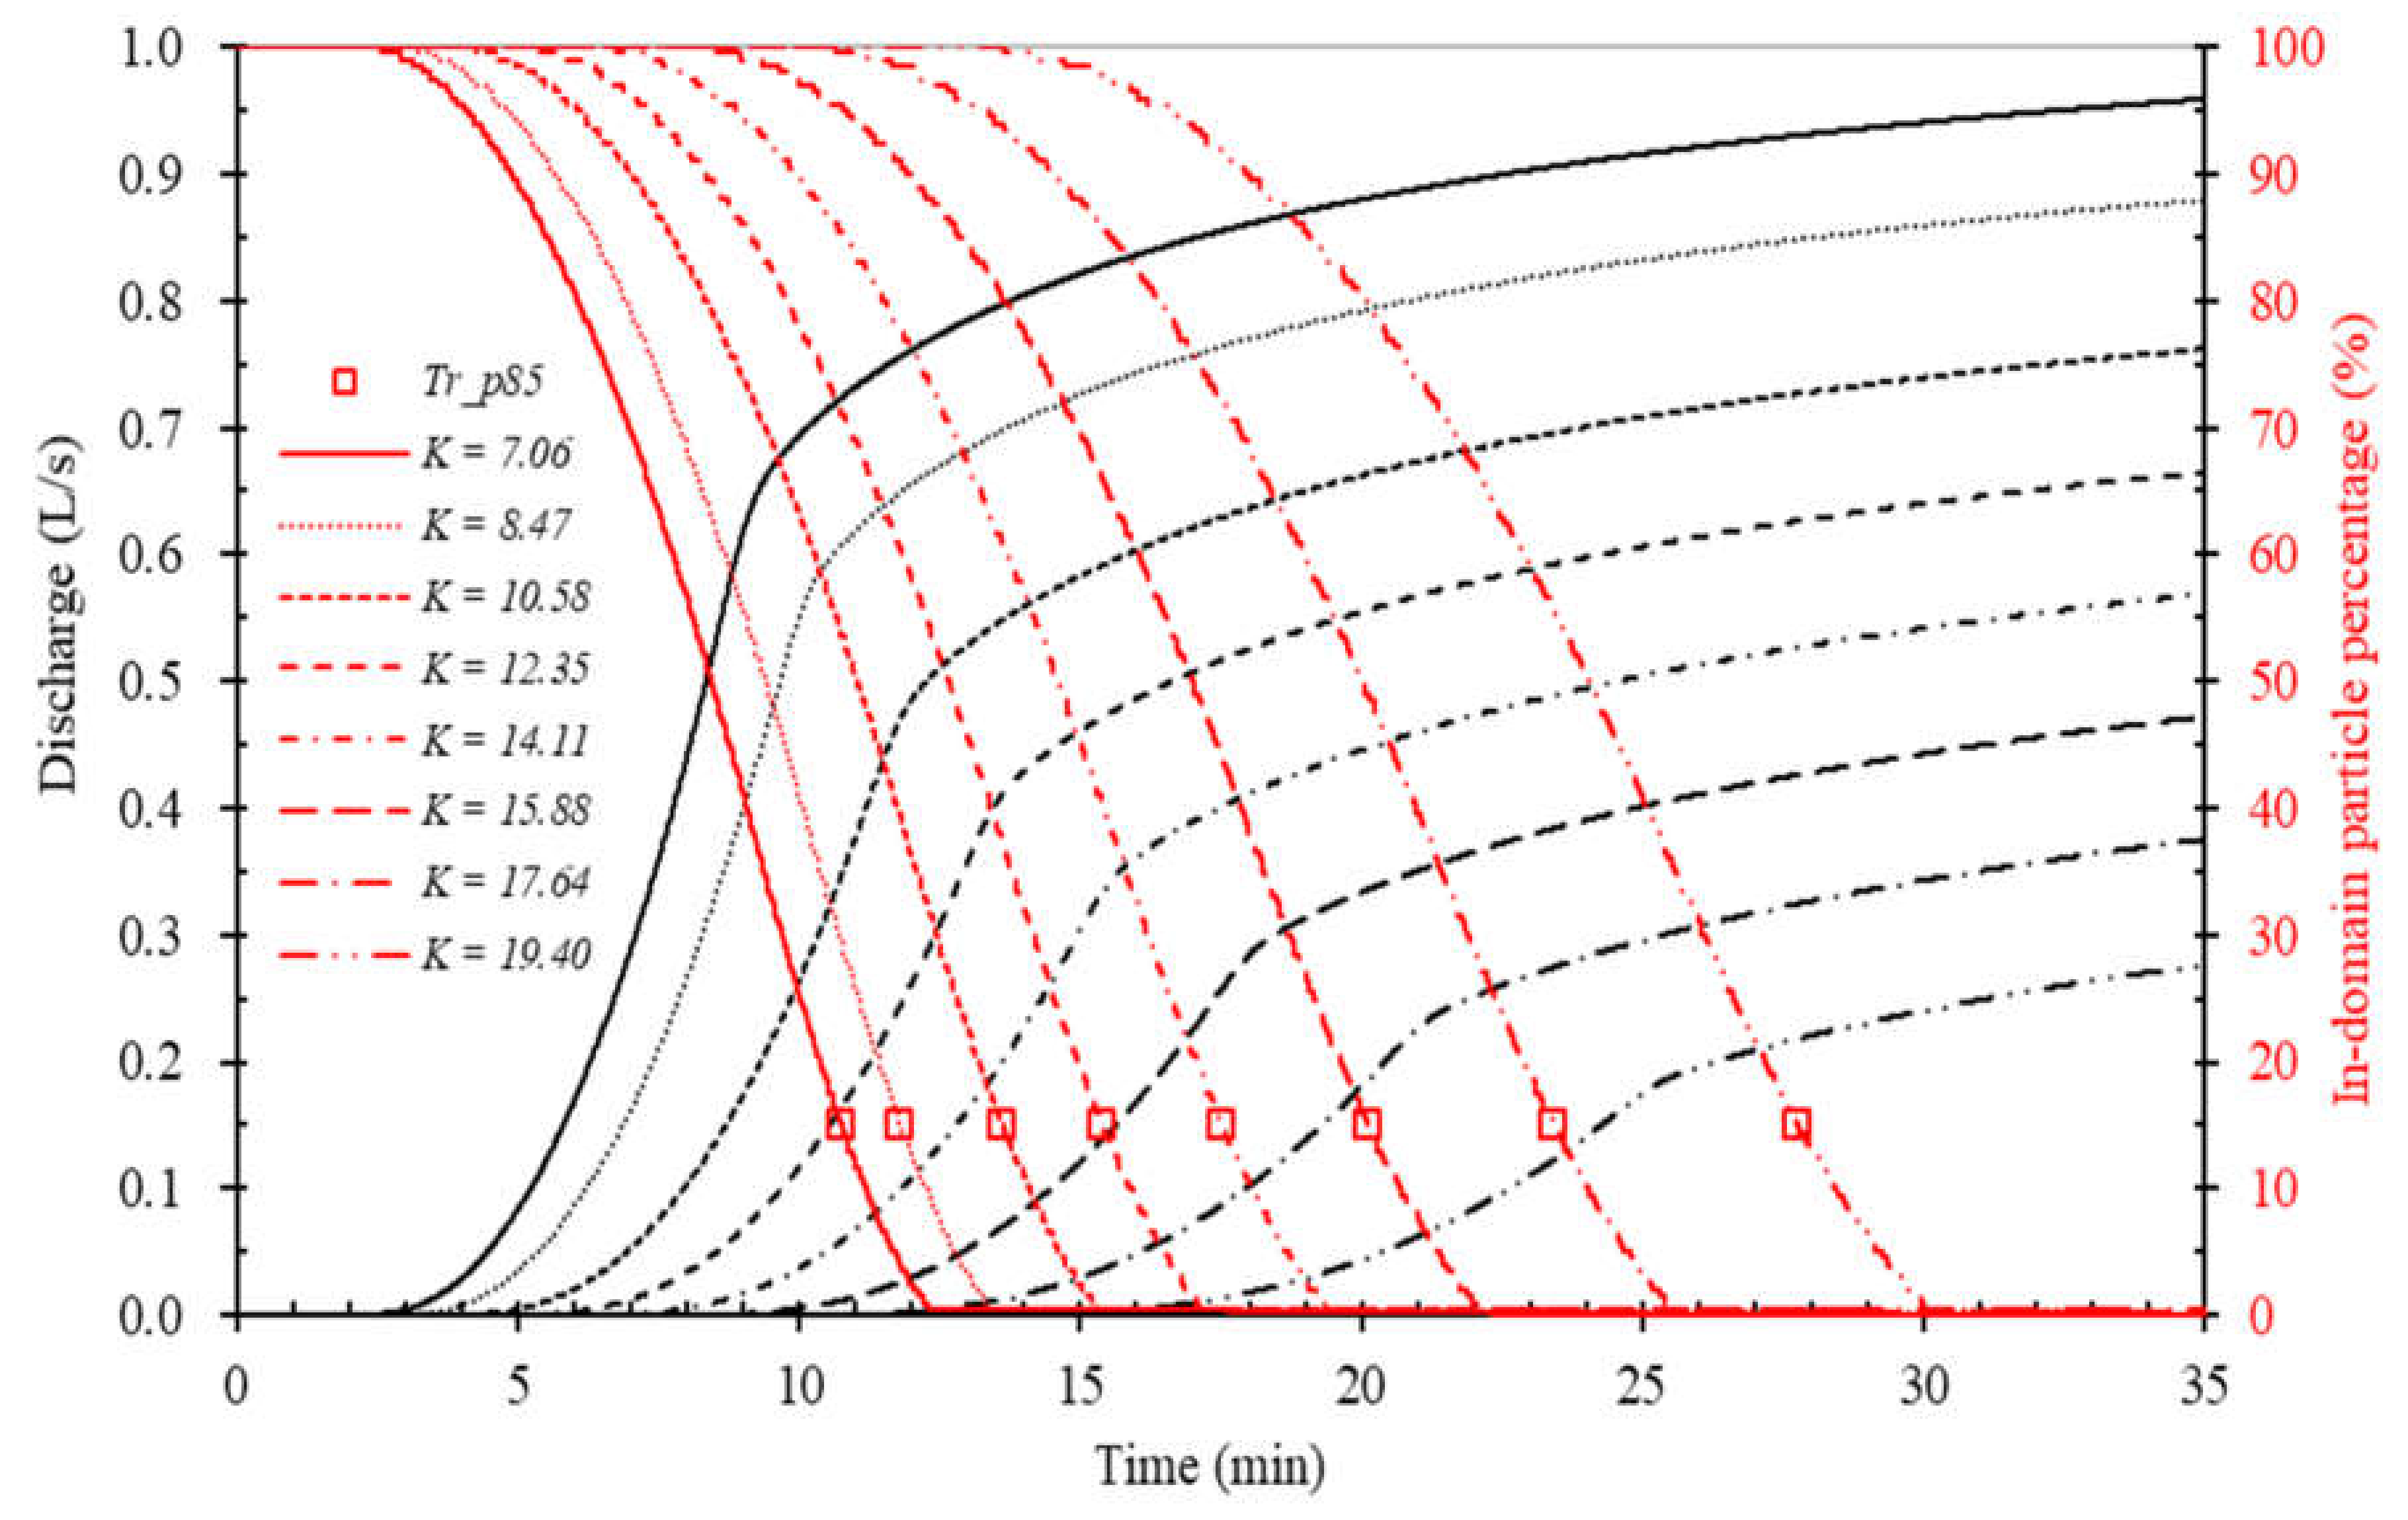
The responding runoff hydrographs and in-domain particle percentages of eight saturation hydraulic conductivity values for pervious surfaces (S0 = 0.01, L = 50 m, φ = 0.06 m, Δθ = 0.18) are summarized and compared in Figure 6 under constant rainfall intensity (i = 105.2 mm/h). Figure 6 clearly indicates that the PTM is the only choice to evaluate Tcp for pervious surfaces because it is not practical to run the simulation for very long periods for the runoff to reach acceptable equilibrium. For a pervious surface, the rainfall in the early period will completely infiltrate when the rainfall intensity is smaller than the infiltration capacity [55] (Figure 6). The time prior to ponding or the start of surface runoff is defined as the ponding time, which depends on both the rainfall intensity and infiltration rate. When the Green–Ampt infiltration model is used, the ponding time (tp) under constant rainfall intensity is calculated using Equation (9) [56].
t p = φ Δ θ K i ( i K ) = φ Δ θ K i ( 1 K )
For eight modeling cases on Figure 6, K ranges from 7.06 × 10⁻⁶ to 19.4 × 10⁻⁶ m/s (25.4–69.8 mm/h), which belongs to sandy loam or sand soil groups, and the ponding time from Equation (9) ranges from 1.96 to 12.2 min, which is the same as predicted by FullSWOF-PTM. Equation (9) is valid when i > K, but if ttp even when i > K, there is still no surface runoff and then it is not necessary and not meaningful to determine Tcp for pervious surfaces. For impervious surfaces, Tci always exists for any non-zero rainfall intensity (Table 2).
For pervious surfaces, the outlet discharge decreases with the increase of K (Figure 6) because of more infiltration. The outlet discharge and in-domain particle percentage are postponed more and more when K and the soil infiltration capacity increases. The in-domain particle percentage is 100% when ttp. The travel time for 85% of particles to arrive at the outlet Tr_p85 was calculated by FullSWOF-PTM from the beginning of the rainfall event and ranges from 10.7 to 27.8 min (open squares on Figure 6) for these eight cases.
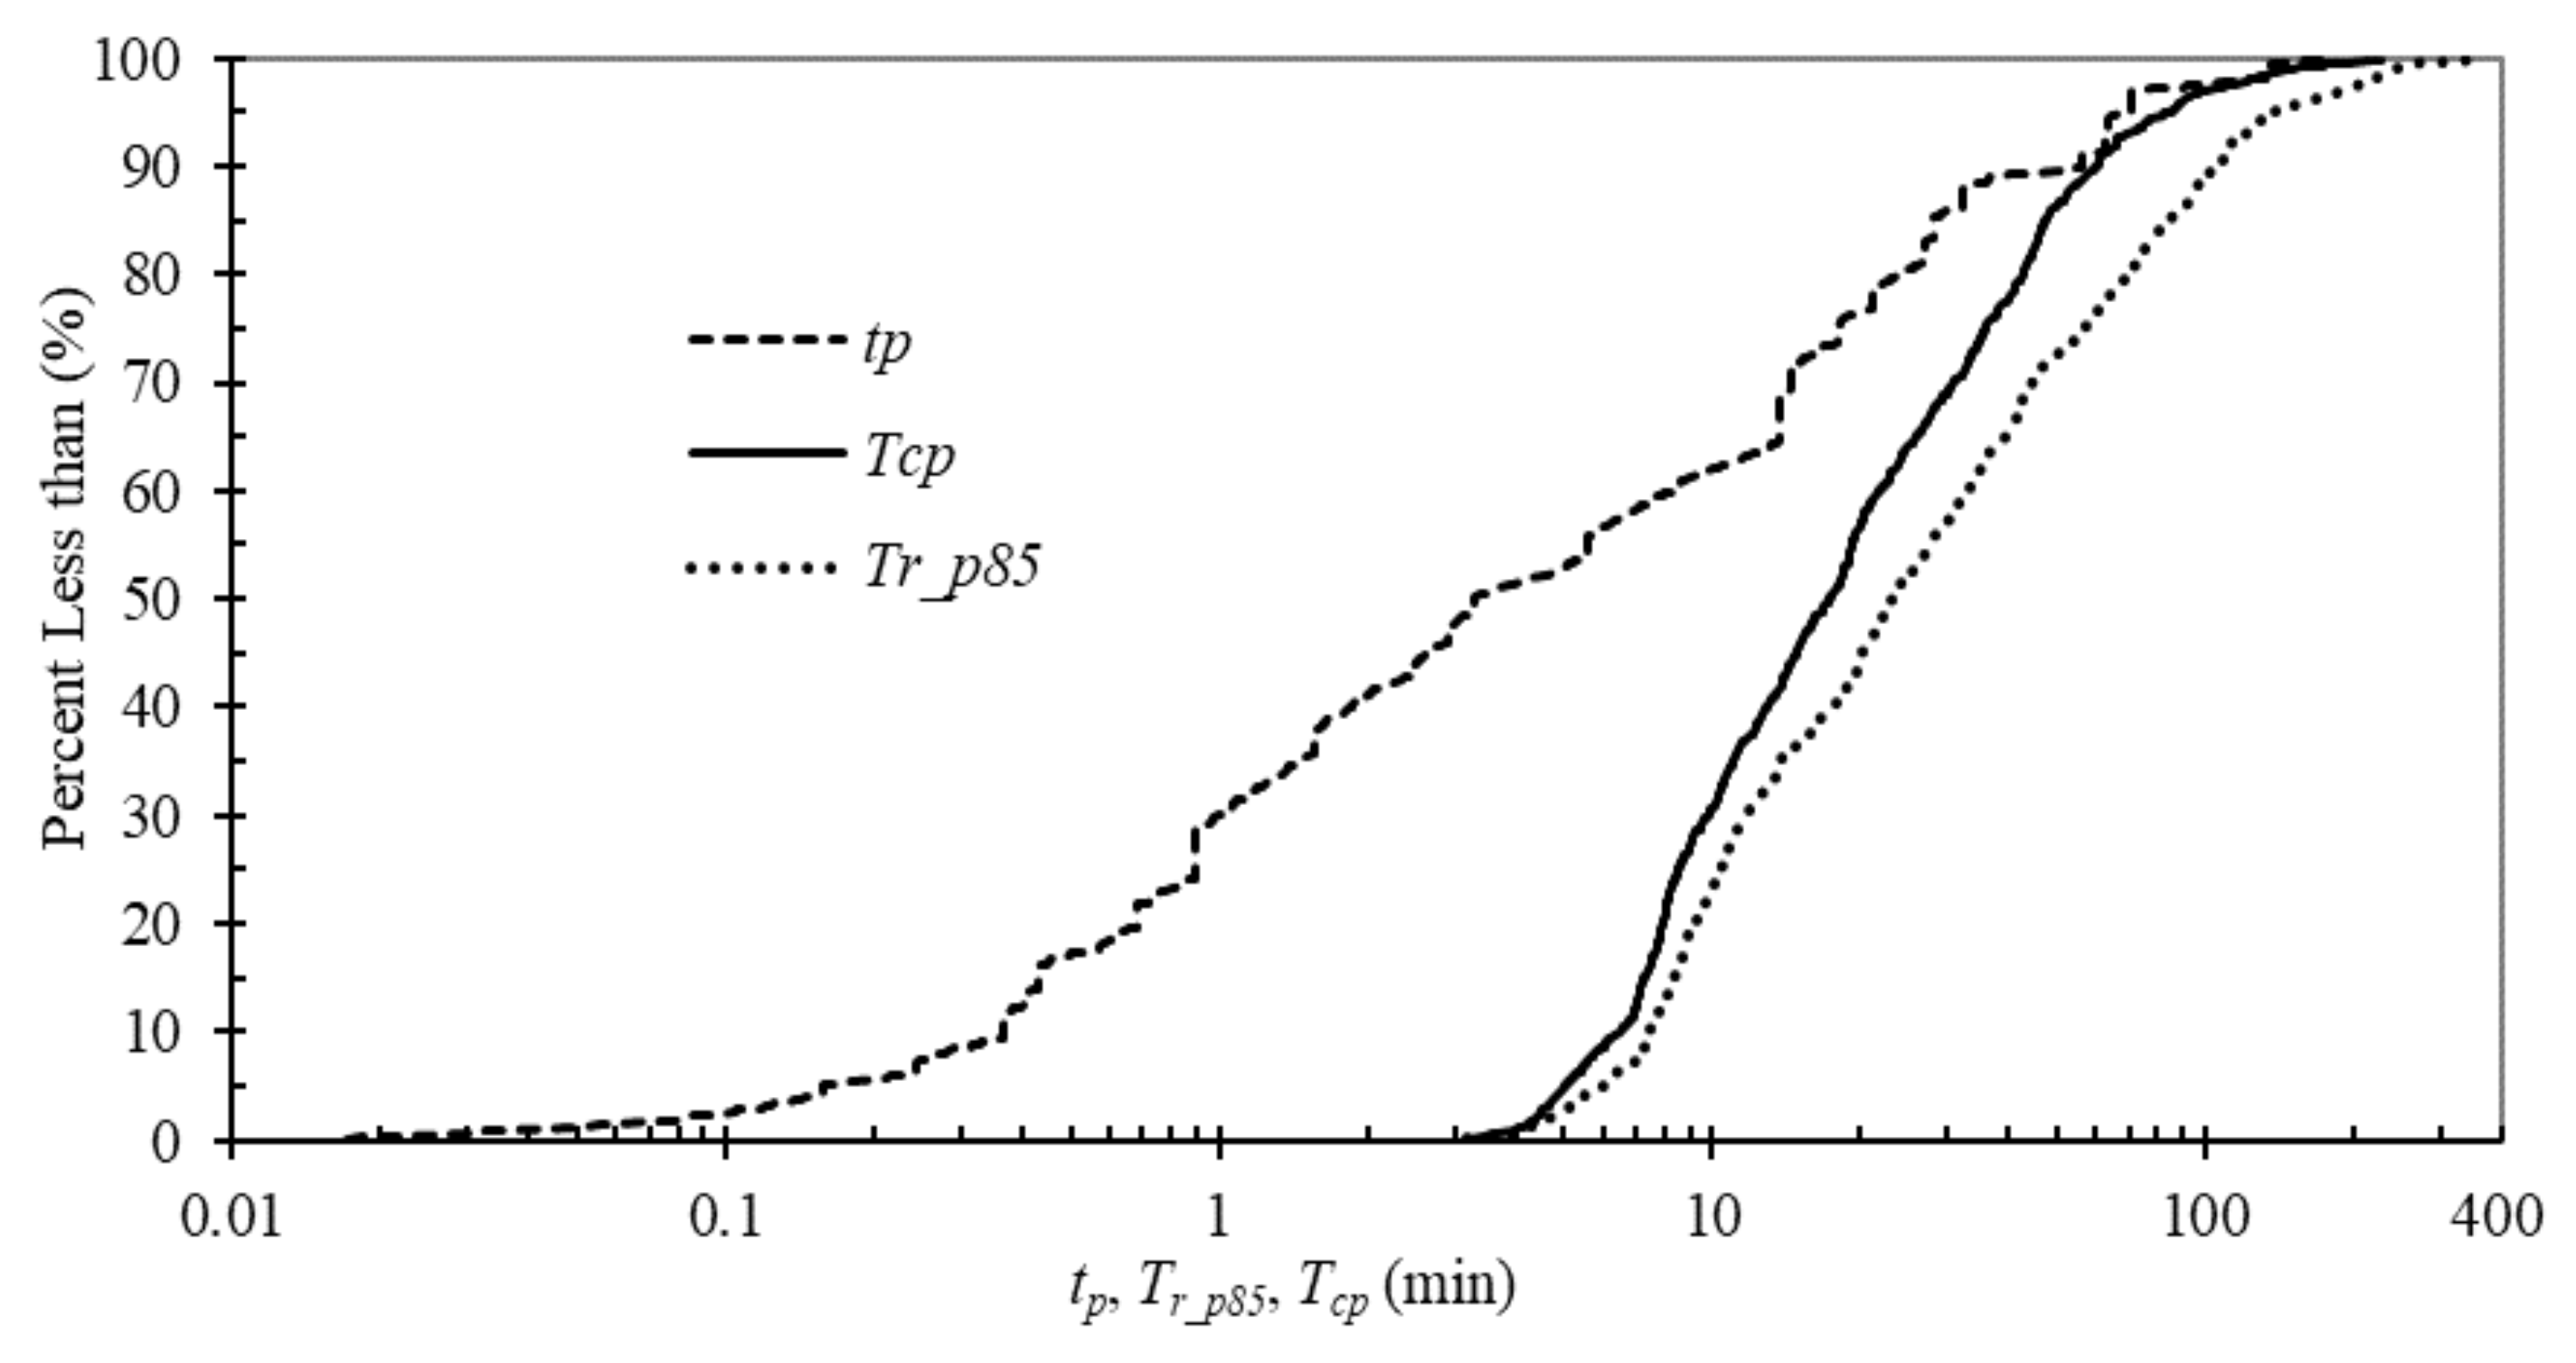
In this paper, the time of concentration for a pervious surface Tcp is considered as Tr_p85 of pervious surfaces determined from FullSWOF-PTM minus the ponding time tp determined using Equation (9), and presented in Equation (10). Figure 7 plots cumulative distributions of tp calculated from Equation (9), simulated Tr_p85, and Tcp for all 750 modeling cases, and their statistical summary is given in Table 3. The modeling cases with large tp and Tr_p85 have small differences between i and K. For 750 cases, tp is 0.2% to 82.6% of Tr_p85, and 50% of tp is less than 18.8% of Tr_p85. Excluding tp from Tr_p85, it means Tcp is not counted from the beginning of the rainfall but the commencing of the runoff, and this is consistent with Guo’s study [4]. The purpose of subtracting tp from Tr_p85 is also to advise engineers and designers that it is not meaningful to determine Tcp for pervious surfaces when the rainfall duration is less than tp. It is recommended that tp should be calculated, e.g., using Equation (9), before Tcp for a pervious surface is calculated.
Following Akan’s study [24], Tcp is considered as the sum of the time of concentration of an equivalent impervious surface (Tci) using (iK) as effective rainfall and additional travel time due to infiltration (Trs) related to the soil infiltration properties. A generalized power relation in Equation (10) was used to develop a regression equation for Trs and then for Tcp equation of pervious surfaces based on the simulated Tr_p85 of 750 pervious modeling cases.
T c p = T r _ p 85 t p = T c i + T r s = ( L n S 0 ) 0.608 1 ( i K ) 0.422 + c 1 K c 2 φ c 3 Δ θ c 4 i c 5
The exponents (C1, C2, C3, C4, and C5) in Equation (10) were determined using the MLR regression between y = Tr_p85 − tp − Tci and x = (K, φ, Δθ, and i) after log-transformed. The fit results of five exponents were summarized in Table 4 and Equation (11).
T c p = ( L n S 0 ) 0.608 1 ( i K ) 0.422 + 2.162 K 0.535 φ 0.161 Δ θ 0.645 i 1.213
where Tcp is in seconds when L is in m; n, S0, and Δθ are dimensionless, i and K are in m/s, and φ in m. The regression equation for Tcp has a p-value < 0.0001, and the residuals between calculated Tcp from Equation (11) and Tr_p85 − tp range from −15.4 to 53.3 min with average residual of 1.12 min (standard deviation 6.13 min). One can see that Equation (11) developed from this study can be used to determine Tc of overland flows for both impervious (setting K = 0) and pervious surfaces.
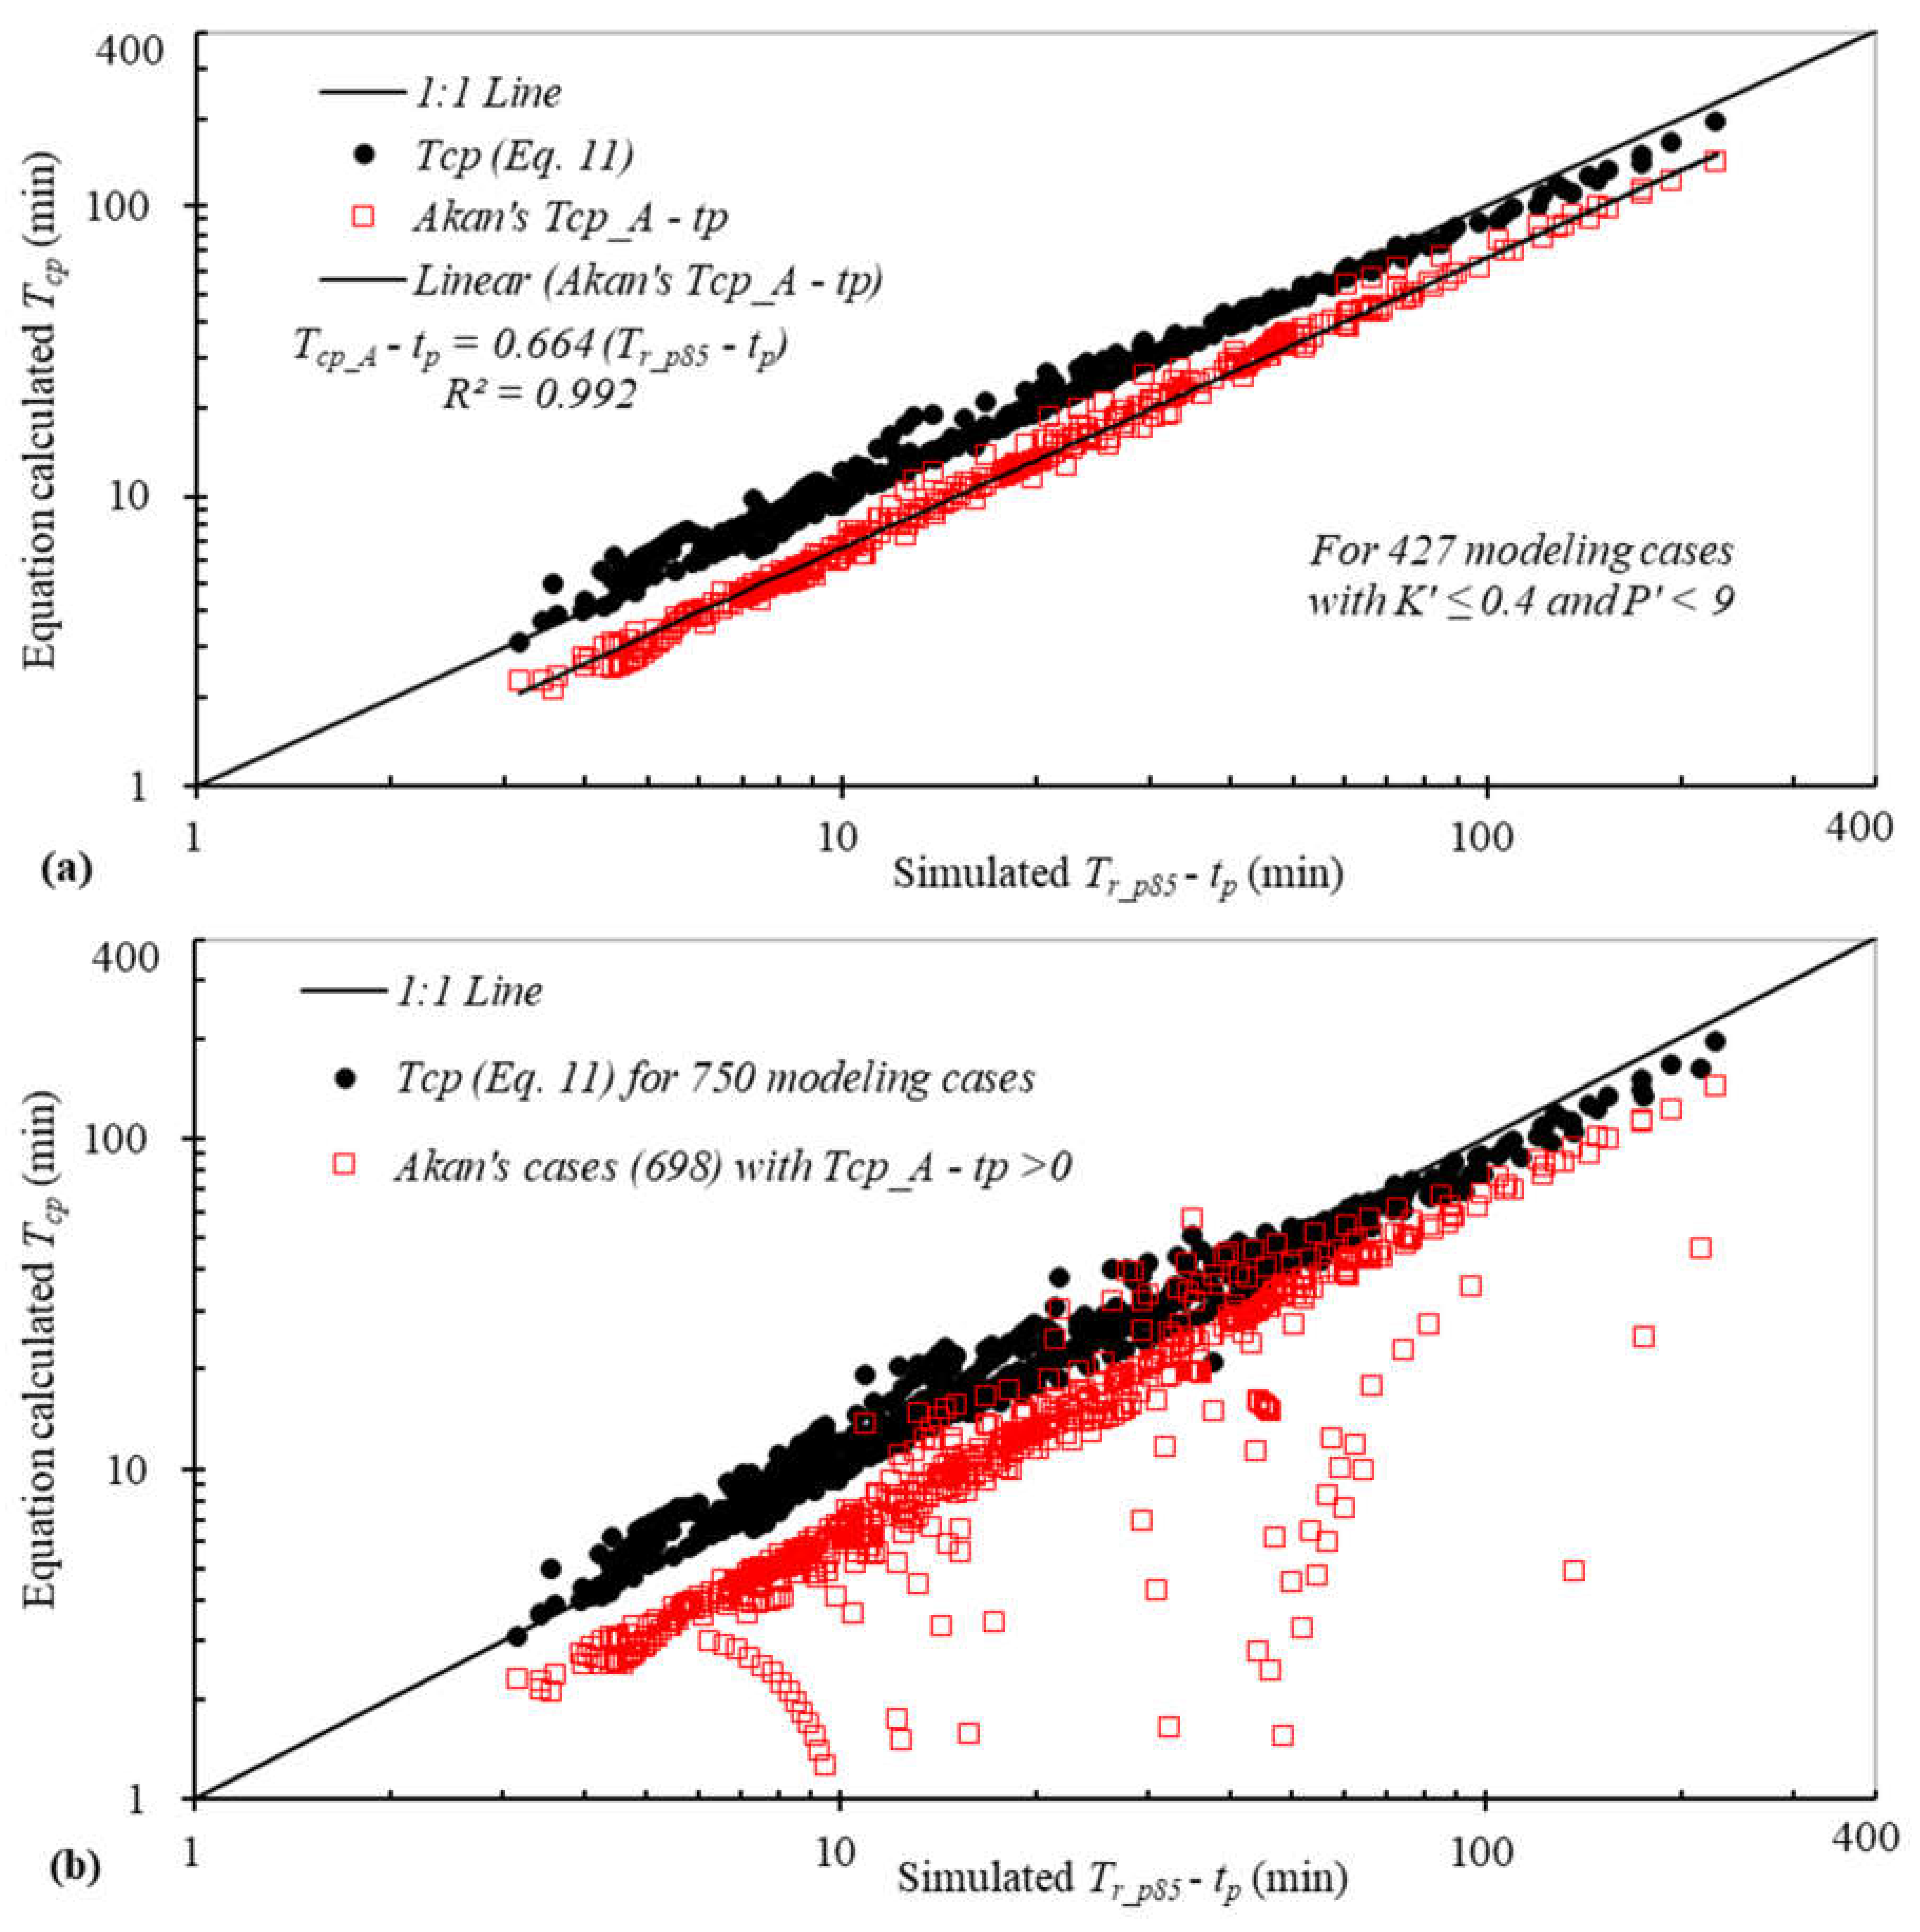
The comparison of Equation (11) and Akan’s Equation (5) was shown in Figure 8: (a) for K′ ≤ 0.4 (427 modeling cases) and (b) for all 750 modeling cases since Akan [24] developed Equation (5) for K′ ≤ 0.4. Akan’s time of concentration for pervious surfaces (Tcp_A) is counted from the beginning of the rainfall event and includes the period before the ponding time; therefore, Tcp from Equation (11) and Tcp_Atp are plotted against Tr_p85tp on Figure 8. Akan’s Tcp_Atp is linearly correlated well with Tr_p85tp when the overall R2 is 0.992, but underestimated since Tcp_Atp = 0.664 (Tr_p85tp) (Figure 8) and RMSE is 13.7 min. The RMSEs of Equation (11) is 4.8 min and the overall R2 are 0.993.
Figure 8b shows the comparison of calculated Tcp from Equation (11) for 750 modeling cases and Tcp_Atp for 698 cases with Tcp_Atp > 0 against Tr_p85tp. When Akan’s Equation (5) is applied to 323 modeling cases with K′ > 0.4, there are 52 cases having Tcp_Atp < 0 or Tcp_A < tp, which were not shown on the log scale plot (Figure 8). The R2 of Equation (11) and Akan’s Tcp_Atp are 0.979 for 750 cases and 0.792 for 698 cases with Tcp_Atp > 0, respectively. The RMSE of Equation (11) and Akan’s Tcp_Atp are 6.2 min and 18.0 min, respectively. Figure 8 and the above analysis show Akan’s Equation (5) should not be applied to beyond its limits: K′ ≤ 0.4 and P′ < 9, where P′ = φΔθ/iTci and Tci used by Akan in Equation (5) is the same as Henderson and Woods’ Tci equation [24]. Akan introduced P′ for solving non-dimensional flow and infiltration equations but did not explain any physical meaning of P′ [10,19,24]. One can see that iTci is rainfall depth over Tci of impervious surface of the same geometry and the ponding time increases with φΔθ indicated by Equation (9). Akan [24] indicated K′ ≤ 0.4 and P′ < 9 are for most practical applications without providing any reason. For 750 modeling cases studied here, the limits of K′ values are [0.001, 0.97] and of P′ values are [0.18, 55.27]. Therefore, Equation (11) developed from this study can be used to estimate Tcp for pervious surfaces with reasonable accuracy and over wide ranges of input parameters, especially for small rainfall intensities in comparison to K.

4. Summary and Conclusions

The particle tracking method (PTM) module was added into the 2D overland flow simulation program based on the open-source program FullSWOF_2D that can be used to estimate the time of concentration for impervious and pervious surfaces. The FullSWOF-PTM program was tested using published rainfall and runoff data and simulated hydrographs match well with observed data (Table 1), which proves it can predict the overland flow accurately. Four hundred and forty-six impervious modeling cases were developed and simulated to explore Tci of overland flow on impervious surfaces. The travel time of 85% of particles to arrive at the drainage outlet (Tr_p85) was calculated by FullSWOF-PTM for determining the time of concentration of impervious and pervious surfaces in this study. A regression equation of Tci, Equation (7) was derived using the MLR regression method and as a power function of L n / S 0 and i. The derived impervious surface Tci equation matches well with Tr_p85 and correlates well with Tci from other five published equations, which further proves FullSWOF-PTM can be used to estimate Tcp of overland flow on pervious surfaces.
Seven hundred and fifty pervious modeling cases were developed and simulated to explore the Tcp equation. In this study, Tcp is considered as Tr_p85 of pervious surfaces determined from FullSWOF-PTM minus the ponding time tp determined using Equation (9). It means Tcp is not counted from the beginning of the rainfall but the commencing of the runoff. Engineers and designers should calculate tp first, e.g., using Equation (9), before Tcp for pervious surface is calculated because it is not meaningful to determine Tcp for pervious surfaces when the rainfall duration is less than tp. A regression equation for Tcp, Equation (11) was developed using simulated Trp_p85 and calculated tp from 750 pervious modeling cases. Equation (11) includes Tci for an equivalent impervious surface using (iK) as effective rainfall and additional travel time due to infiltration (Trs) as a function of rainfall intensity and the soil infiltration parameters (K, φ, and Δθ). Therefore, Equation (11) can be used for both impervious and pervious surfaces. The derived Tcp equation has higher R2 and smaller RMSE compared to Akan’s equation as well as wide ranges of input parameters.

Acknowledgments

The research was partially supported by the National Natural Science Foundation of China (No. 51478026), Beijing Higher Education High Level Teachers Team Construction Program (CIT&TCD 201704055) and Beijing University of Civil Engineering and Architecture Research Fund for Pyramid Talents Development. The author, Xiaoning Li, wishes to express his gratitude to the Chinese Scholarship Council for financial support pursuing his graduate study at Auburn University.

Author Contributions

Xiaoning Li added the PTM code into FullSWOF_2D program, conducted the model runs and result analysis, and prepared the manuscript draft. Xing Fang supervised model development, simulation runs, and data analysis, and revised the manuscript. Manoj KC collected the basic simulation data and revised the manuscript. Junqi Li, Yongwei Gong, and Gang Chen supervised the writing and data analysis, and revised the manuscript. All authors made contributions to the study and writing the manuscript.

Conflicts of Interest

The authors declare no conflict of interest.

References

  1. Mulvany, T.J. On the use of self-registering rain and flood gauges in making observations of the relations of rainfall and flood discharges in a given catchment. Proc. Inst. Civil Eng. Irel. 1851, 4, 18–33. [Google Scholar]
  2. Kuichling, E. The relation between the rainfall and the discharge of sewers in populous areas. Trans. Am. Soc. Civ. Eng. 1889, 20, 1–56. [Google Scholar]
  3. Brown, S.; Stein, S.; Warner, J. Urban Drainage Design Manual: Hydraulic Engineering Circular No. 22; FHWA-NHI-10–009 HEC-22; National Highway Institute: Fort Collins, CO, USA, 2009.
  4. Guo, J.C.Y. Overland flow on a pervious surface. Water Int. 1998, 23, 91–96. [Google Scholar] [CrossRef]
  5. Kibler, D.F. Desk-top methods for urban stormwater calculation. Urban Stormwater Hydrol. 1982, 87–135. [Google Scholar] [CrossRef]
  6. McCuen, R.H.; Wong, S.L.; Rawls, W.J. Estimating urban time of concentration. J. Hydraul. Eng. 1984, 110, 887–904. [Google Scholar] [CrossRef]
  7. Izzard, C.F. Hydraulics of runoff from developed surfaces. In Proceedings of the 26th Annual Meetings of the Highway Research Board, Washington, DC, USA, 5–8 December 1946; Crum, R.W., Burggraf, F., William, N.C., Jr., Eds.; Highway Research Board: Washington, DC, USA, 1946; pp. 129–150. [Google Scholar]
  8. Muzik, I. Laboratory experiments with surface runoff. J. Hydraul. Div. 1974, 100, 501–516. [Google Scholar]
  9. Wong, T.S.W. Assessment of time of concentration formulas for overland flow. J. Irrig. Drain. Eng. 2005, 131, 383–387. [Google Scholar] [CrossRef]
  10. Akan, A.O. Time of concentration of overland flow. J. Irrig. Drain. Eng. 1986, 112, 283–292. [Google Scholar] [CrossRef]
  11. Wooding, R.A. A hydraulic model for the catchment-stream problem: I. Kinematic-wave theory. J. Hydrol. 1965, 3, 254–267. [Google Scholar] [CrossRef]
  12. Woolhiser, D.A.; Liggett, J.A. Unsteady, one-dimensional flow over a plane—The rising hydrograph. Water Resour. Res. 1967, 3, 753–771. [Google Scholar] [CrossRef]
  13. Olivera, F.; Maidment, D.R. Geographic information systems (GIS)-based spatially distributed model for runoff routing. Water Resour. Res. 1999, 35, 1155–1164. [Google Scholar] [CrossRef]
  14. Hromadka, T.V., II; McCuen, R.H.; Yen, C.C. Comparison of overland flow hydrograph models. ASCE J. Hydraul. Eng. 1987, 113, 1422–1439. [Google Scholar] [CrossRef]
  15. Su, D.; Fang, X. Estimating traveling time of flat terrain by 2-dimensional overland flow model. In Proceedings of the International Symposium on Shallow Flows, Delft University of Technology, Delft, The Netherlands, 16–18 June 2003. [Google Scholar]
  16. Niri, M.Z.; Saghafian, B.; Golian, S.; Moramarco, T.; Shamsai, A. Derivation of travel time based on diffusive wave approximation for the time-area hydrograph simulation. J. Hydrol. Eng. 2012, 17, 85–91. [Google Scholar] [CrossRef]
  17. Gourbesville, P.; Cunge, J.; Caignaert, G. Advances in Hydroinformatics-Simhydro 2014, 1st ed.; Springer: Singapore, 2014; p. 624. [Google Scholar]
  18. Teng, J.; Jakeman, A.; Vaze, J.; Croke, B.F.; Dutta, D.; Kim, S. Flood inundation modelling: A review of methods, recent advances and uncertainty analysis. Environ. Model. Softw. 2017, 90, 201–216. [Google Scholar] [CrossRef]
  19. Akan, A.O. Similarity solution of overland flow on pervious surface. J. Hydraul. Eng. 1985, 111, 1057–1067. [Google Scholar] [CrossRef]
  20. Deng, Z.Q.; De Lima, J.L.M.P.; Singh, V.P. Transport rate-based model for overland flow and solute transport: Parameter estimation and process simulation. J. Hydrol. 2005, 315, 220–235. [Google Scholar] [CrossRef]
  21. Hamouda, B.; Lahbassi, O. Integration of pervious area stream flow in urban hydrological model. Energy Procedia 2012, 18, 1573–1582. [Google Scholar] [CrossRef]
  22. García Serrana, M.; Gulliver, J.S.; Nieber, J.L. Non-uniform overland flow-infiltration model for roadside swales. J. Hydrol. 2017, 552, 586–599. [Google Scholar] [CrossRef]
  23. Hjelmfelt, A. Influence of infiltration on overland flow. J. Hydrol. 1978, 36, 179–185. [Google Scholar] [CrossRef]
  24. Akan, A.O. Time of concentration formula for pervious catchments. J. Irrig. Drain. Eng. 1989, 115, 733–735. [Google Scholar] [CrossRef]
  25. Suk, H.; Yeh, G.T. Development of particle tracking algorithms for various types of finite elements in multi-dimensions. Comput. Geosci. 2010, 36, 564–568. [Google Scholar] [CrossRef]
  26. Schafer-Perini, A.L.; Wilson, J.L. Efficient and accurate front tracking for two-dimensional groundwater flow models. Water Resour. Res. 1991, 27, 1471–1485. [Google Scholar] [CrossRef]
  27. Bensabat, J.; Zhou, Q.; Bear, J. An adaptive pathline-based particle tracking algorithm for the eulerian–lagrangian method. Adv. Water Resour. 2000, 23, 383–397. [Google Scholar] [CrossRef]
  28. Cheng, H.P.; Cheng, J.R.; Yeh, G.T. A particle tracking technique for the lagrangian-eulerian finite element method in multi-dimensions. Int. J. Numer. Methods Eng. 1996, 39, 1115–1136. [Google Scholar] [CrossRef]
  29. KC, M.; Fang, X. Estimating time parameters of overland flow on impervious surfaces by the particle tracking method. Hydrol. Sci. J. 2015, 60, 294–310. [Google Scholar] [CrossRef]
  30. Delestre, O.; Darboux, F.; James, F.; Lucas, C.; Laguerre, C.; Cordier, S. FullSWOF: A free software package for the simulation of shallow water flows. arXiv 2014. preprint arXiv:1401.4125. [Google Scholar]
  31. Barré de Saint-Venant, A.J.C. Théorie du mouvement non permanent des eaux, avec application aux crues des rivières et à l’introduction des marées dans leurs lits. Comptes Rendus des Séances de l’Académie des Sci. 1871, 73, 237–240. [Google Scholar]
  32. Zhang, W.; Cundy, T.W. Modeling of two-dimensional overland flow. Water Resour. Res. 1989, 25, 2019–2035. [Google Scholar] [CrossRef]
  33. Audusse, E.; Bouchut, F.; Bristeau, M.-O.; Klein, R.; Perthame, B.T. A fast and stable well-balanced scheme with hydrostatic reconstruction for shallow water flows. SIAM J. Sci. Comput. 2004, 25, 2050–2065. [Google Scholar] [CrossRef]
  34. Unterweger, K.; Wittmann, R.; Neumann, P.; Weinzierl, T.; Bungartz, H.-J. Integration of FullSWOF_2D and PeanoClaw: Adaptivity and local time-stepping for complex overland flows. In Recent Trends in Computational Engineering-CE2014; Springer: Cham, Switzerland, 2015; pp. 181–195. [Google Scholar]
  35. Cordier, S.; Coullon, H.; Delestre, O.; Laguerre, C.; Le, M.H.; Pierre, D.; Sadaka, G. FullSWOF paral: Comparison of two parallelization strategies (MPI and SkelGIS) on a software designed for hydrology applications. In ESAIM: Proceedings; EDP Sciences: Les Ulis, France, 2013; pp. 59–79. [Google Scholar]
  36. Esteves, M.; Faucher, X.; Galle, S.; Vauclin, M. Overland flow and infiltration modelling for small plots during unsteady rain: Numerical results versus observed values. J. Hydrol. 2000, 228, 265–282. [Google Scholar] [CrossRef]
  37. Bouchut, F. Nonlinear Stability of Finite Volume Methods for Hyperbolic Conservation Laws and Well-Balanced Schemes for Sources; Springer Science & Business Media: Berlin, Germany, 2004. [Google Scholar]
  38. Delestre, O.; Lucas, C.; Ksinant, P.A.; Darboux, F.; Laguerre, C.; Vo, T.N.; James, F.; Cordier, S. Swashes: A compilation of shallow water analytic solutions for hydraulic and environmental studies. Int. J. Numer. Methods Fluids 2013, 72, 269–300. [Google Scholar] [CrossRef] [Green Version]
  39. Abily, M.; Delestre, O.; Amossé, L.; Bertrand, N.; Laguerre, C.; Duluc, C.-M.; Gourbesville, P. Use of 3D classified topographic data with FullSWOF for high resolution simulation of a river flood event over a dense urban area. arXiv 2016. arXiv:1603.07463. [Google Scholar]
  40. Abily, M.; Bertrand, N.; Delestre, O.; Gourbesville, P.; Duluc, C.-M. Spatial global sensitivity analysis of high resolution classified topographic data use in 2D urban flood modelling. Environ. Model. Softw. 2016, 77, 183–195. [Google Scholar] [CrossRef] [Green Version]
  41. Cordes, C.; Kinzelbach, W. Continuous groundwater velocity fields and path lines in linear, bilinear, and trilinear finite elements. Water Resour. Res. 1992, 28, 2903–2911. [Google Scholar] [CrossRef]
  42. Pollock, D.W. User’s Guide for MODPATH/MODPATH-PLOT, Version 3: A Particle Tracking Post-Processing Package for MODFLOW, the U.S. Geological Survey Finite-Difference Ground-Water Flow Model; U.S. Geological Survey: Reston, VA, USA, 1994; pp. 4–9.
  43. Lu, N. A semianalytical method of path line computation for transient finite-difference groundwater flow models. Water Resour. Res. 1994, 30, 2449–2459. [Google Scholar] [CrossRef]
  44. Matlab and Statistics Toolbox Release 2017a; The MathWorks Inc.: Natick, MA, USA, 2017.
  45. Peugeot, C.; Esteves, M.; Galle, S.; Rajot, J.-L.; Vandervaere, J. Runoff generation processes: Results and analysis of field data collected at the east central supersite of the hapex-sahel experiment. J. Hydrol. 1997, 188, 179–202. [Google Scholar] [CrossRef]
  46. Nash, J.E.; Sutcliffe, J.V. River flow forecasting through conceptual models part I—A discussion of principles. J. Hydrol. 1970, 10, 282–290. [Google Scholar] [CrossRef]
  47. Rawls, W.J.; Brakensiek, D.L.; Miller, N. Green-Ampt infiltration parameters from soils data. J. Hydraul. Eng. 1983, 109, 62–70. [Google Scholar] [CrossRef]
  48. KC, M.; Fang, X.; Yi, Y.-J.; Li, M.-H.; Thompson, D.B.; Cleveland, T.G. Improved time of concentration estimation on overland flow surfaces including low-sloped planes. J. Hydrol. Eng. 2014, 19, 495–508. [Google Scholar] [CrossRef]
  49. Viessman, W.; Lewis, G.L. Introduction to Hydrology, 5th ed.; Pearson Education: Upper Saddle River, NJ, USA, 2003; p. 612. [Google Scholar]
  50. Henderson, F.M.; Wooding, R.A. Overland flow and groundwater flow from a steady rainfall of finite duration. J. Geophys. Res. 1964, 69, 1531–1540. [Google Scholar] [CrossRef]
  51. Morgali, J.R.; Linsley, R.K. Computer analysis of overland flow. J. Hydraul. Div. 1965, 91, 81–100. [Google Scholar]
  52. Kirpich, Z.P. Time of concentration of small agricultural watersheds. Civ. Eng. 1940, 10, 362. [Google Scholar]
  53. Johnstone, D.; Cross, W.P. Elements of Applied Hydrology; Ronald Press: New York, NY, USA, 1949. [Google Scholar]
  54. Linsley, R.K.; Kohler, M.A.; Paulhus, J.L.H. Hydrology for Engineers; McGraw Hill Publications: New York, NY, USA, 1958. [Google Scholar]
  55. Diskin, M.; Nazimov, N. Ponding time and infiltration capacity variation during steady rainfall. J. Hydrol. 1996, 178, 369–380. [Google Scholar] [CrossRef]
  56. Chow, V.T.; Maidment, D.R.; Mays, L.W. Applied Hydrology, 2nd ed.; McGraw Hill: New York, NY, USA, 1988. [Google Scholar]
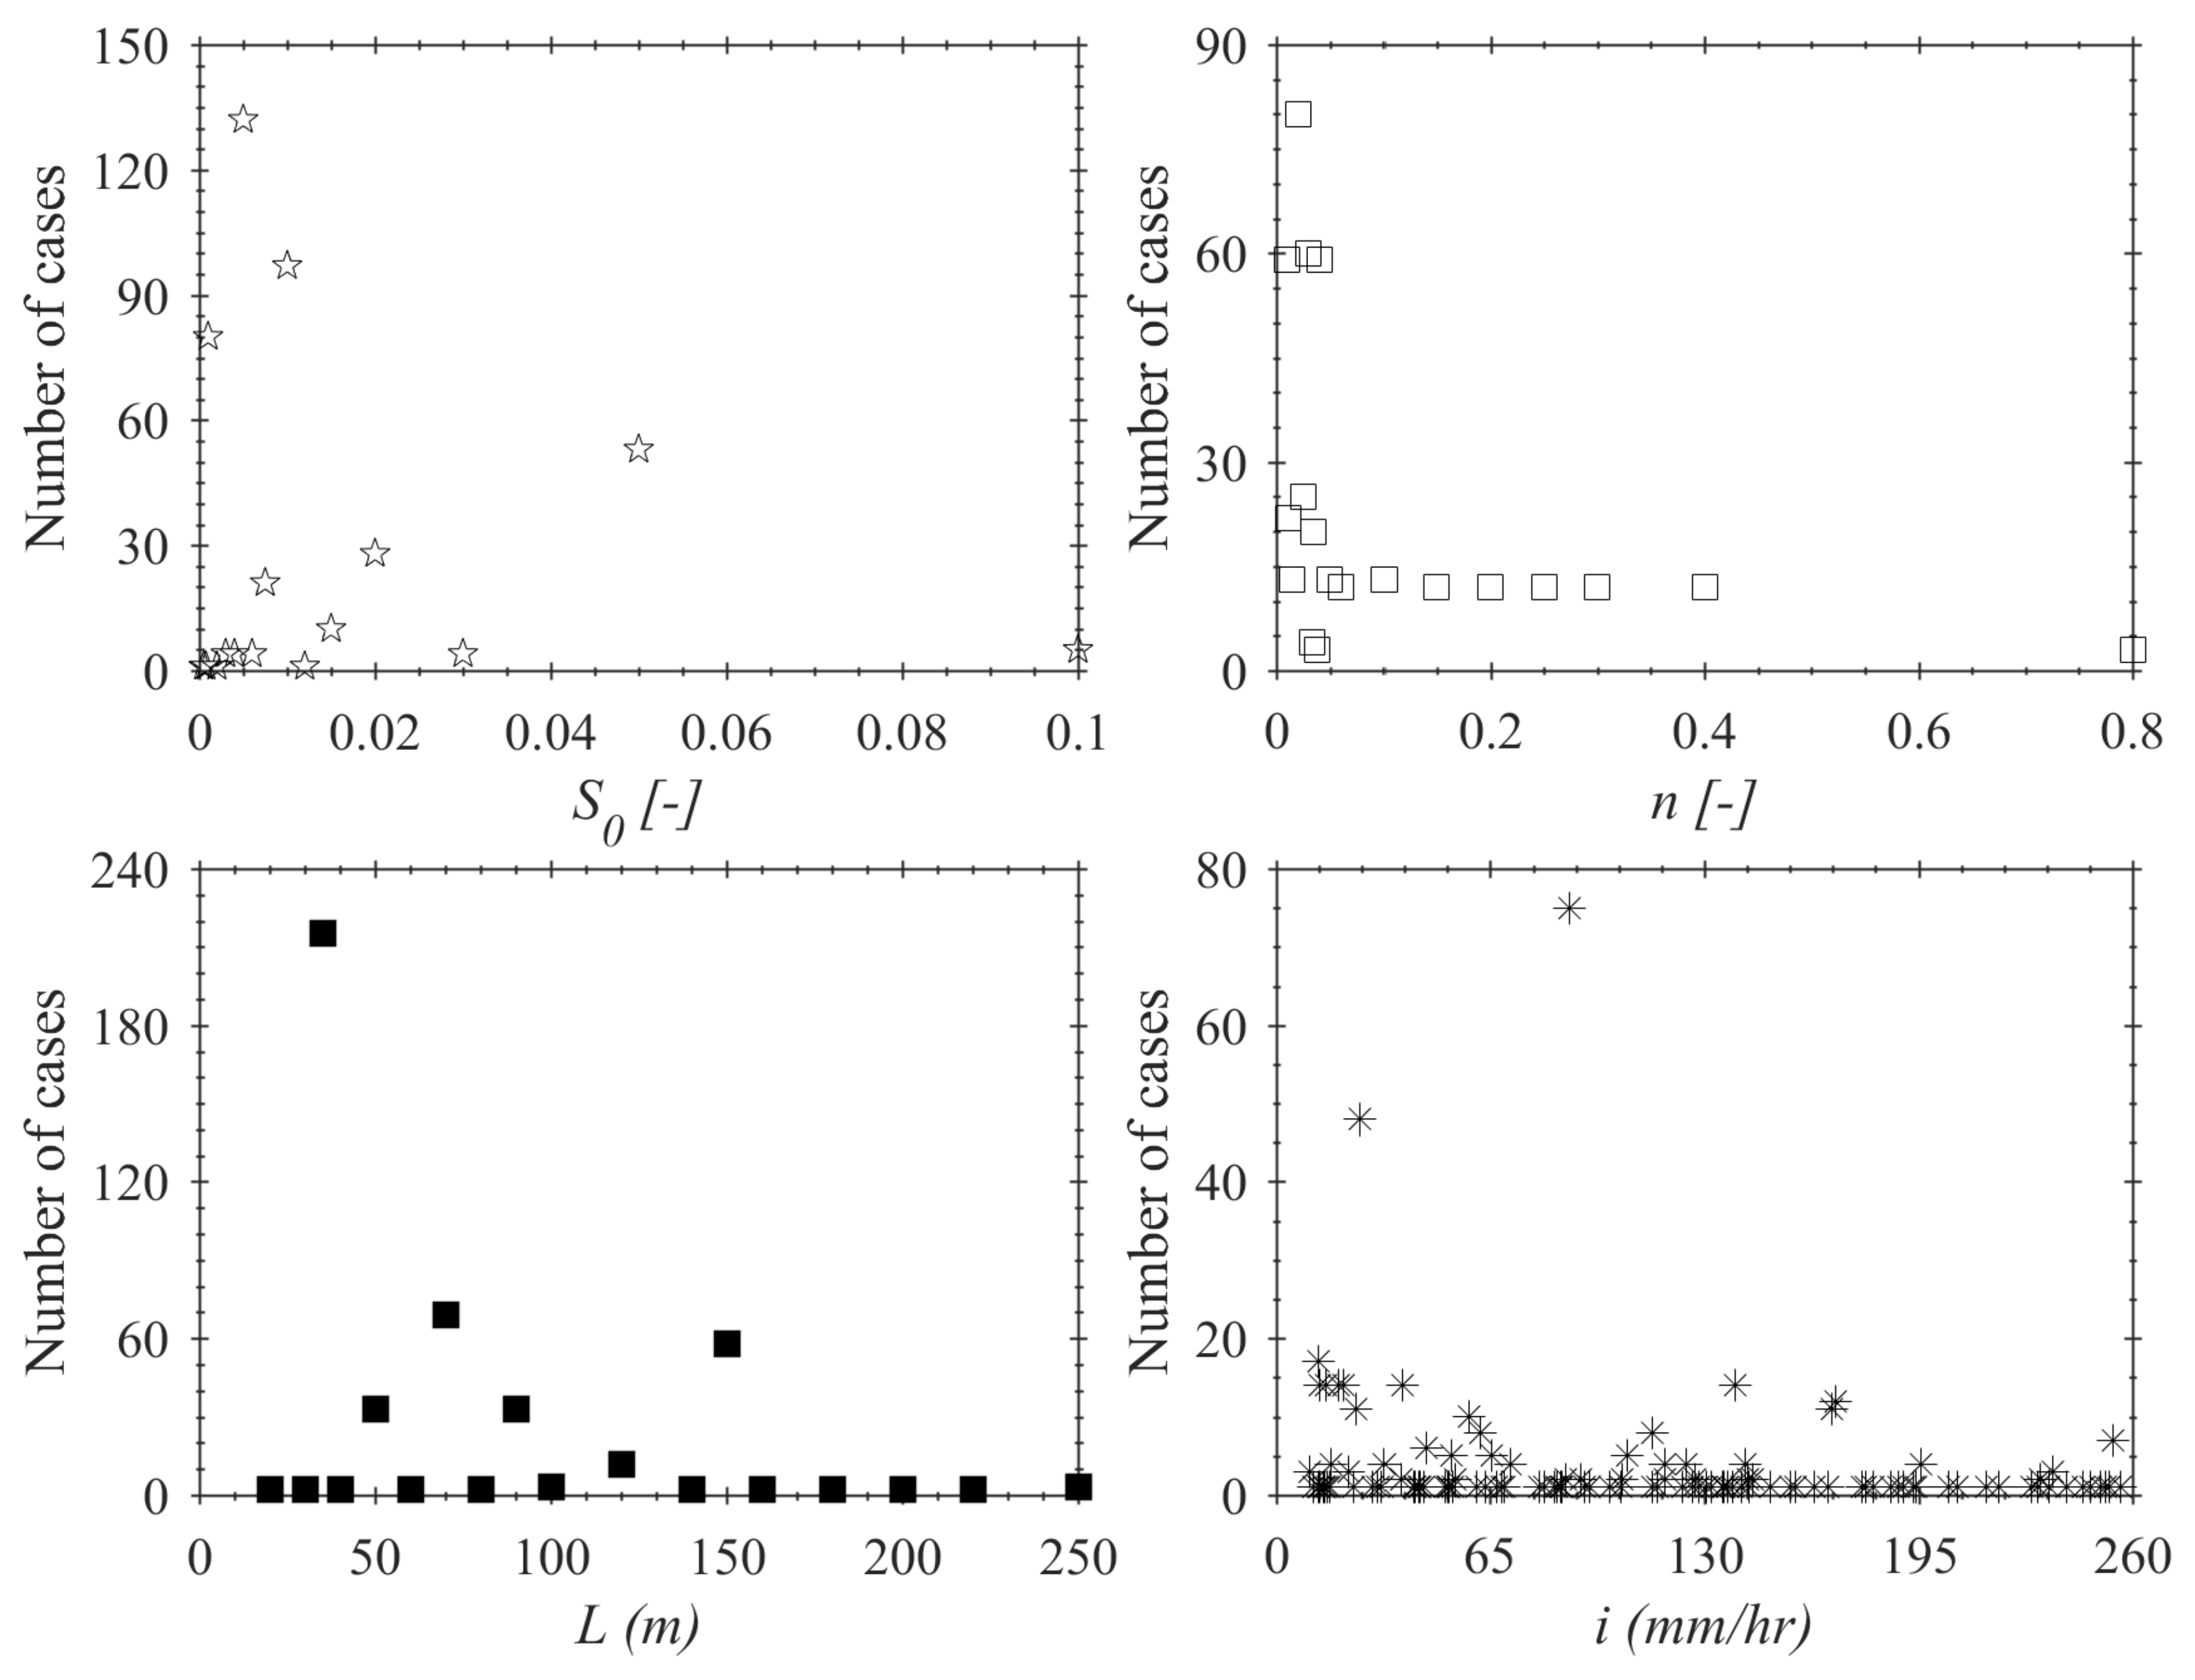
Figure 1. Distributions of the values of four model input parameters used for the 446 impervious modeling cases.
Water 10 00379 g001
Figure 2. Distributions of the values of three soil infiltration parameters and calculated K′ = K/i used for 750 pervious modeling cases.
Water 10 00379 g002
Figure 3. Comparison of simulated and observed hydrographs of two events on (a) 24 August and (b) 4 September, 1994.
Water 10 00379 g003
Figure 4. Simulated outlet discharge and in-domain particle percentage versus time under different roughness (n) coefficients for eight modeling cases with i = 88.9 mm/h, S0 = 0.005, and L = 35 m of impervious surfaces.
Water 10 00379 g004
Figure 5. Tci calculated from six equations (Table 2) versus simulated Tci_p85 for 446 modeling cases of impervious surfaces.
Water 10 00379 g005
Figure 6. Simulated runoff hydrograph and in-domain particle percentage versus time for eight modeling cases of different saturation hydraulic conductivity (K, in 10−6 m/s) with S0 =0.01, i = 105.2 mm/h, L = 50 m, φ = 0.06 m, Δθ = 0.18 of pervious surfaces.
Water 10 00379 g006
Figure 7. Cumulative distributions of calculated ponding time tp from Equation (9), time of 85% of particles to arrive at the outlet Tr_p85, and time of concentration Tcp of pervious surfaces for 750 modeling cases.
Water 10 00379 g007
Figure 8. Comparison of equation calculated Tcp and Tr_p85 − tp: (a) 427 modeling cases with K′ ≤ 0.4 and P′ < 9 cases, (b) 750 modeling cases for Equation (11) and 698 modeling cases with Akan’s Tcptp > 0.
Water 10 00379 g008
Table 1. Comparison of simulated and observed discharge parameters for 11 rainfall events.
Events [θi, RD]NSE 1NSE 2Dob 2 (mm)Dsi 1 (mm)∆D (%)Qpo 2 (mm/h)Qps 1 (mm/h)∆Qp (%)
Jul 20 [0.048, 51.5]0.810.8529.032.411.7144.5165.514.5
Jul 21 [0.103, 59.5]0.680.6626.730.112.777.085.210.6
Aug 7 [0.100, 30.0]0.710.9022.020.8−5.5179.4138.3−22.9
Aug 10 [0.106, 11.0]0.750.905.65.60.059.152.4−11.3
Aug 20 (1) [0.067, 22.0]0.690.639.77.2−25.842.033.1−21.2
Aug 20 (2) [0.095, 4.0]0.700.902.21.7−22.750.537.0−26.7
Aug 24 [0.088, 31.0]0.900.8818.821.011.7142.2159.011.8
Aug 25 [0.085, 24.0]0.820.8914.314.30.091.686.7−5.3
Sep 4 [0.082, 62.0]0.950.9337.835.1−7.1123.5113.7−7.9
Sep 8 [0.082, 31.0]0.620.4615.320.433.386.7107.323.8
Sep 16 [0.061, 9.5]0.600.662.42.712.548.441.8−13.6
Note: θi is initial soil moisture content, RD is rainfall depth in mm, 1 is calculated using FullSWOF-PTM simulated and observed data, 2 is adapted from Esteves’s paper after comparing with observed data [36], Dob (mm) is the observed total runoff depth, Dsi (mm) is the simulated total runoff depth, ∆D (%) is the percent error of simulated runoff depth = (Dsi − Dob)/Dob × 100%, Qpo (mm/h) is the observed peak runoff rate, Qps (mm/h) is the simulated peak runoff rate, ∆Qp (%) is the percent error of simulated peak discharge = (Qps − Qpo)/Qpo × 100%.
Table 2. Six Tci equations and statistical results when compared with simulated Tci_p85 (Figure 5).
SourceTci Formula (min)R2RMSE (min)
Tci (Equation (8)) T c i = 9.741 × ( n L / S 0 ) 0.608 / i 0.422 0.996 (1.00 × Tci_p85) 11.45
Linsley (1958) T c i = 6.82 ( n L / S 0 ) 0.633 / i 0.398 0.998 (0.87 × Tci_p85)4.15
Henderson & Woods (1964) T c i = 6.98 ( n L / S 0 ) 0.60 / i 0.40 0.997 (0.74 × Tci_p85)8.04
Morgali (1965) T c i = 7.05 L 0.593 n 0.605 / ( i 0.388 S 0 0.38 ) 0.995 (1.19 × Tci_p85)6.08
KC et al., (2014) T c i = 8.67 × L 0.541 n 0.649 / ( i 0.391 S 0 0.359 ) 0.994 (0.96 × Tci_p85)2.33
KC & Fang (2015) T c i = 9.25 × L 0.599 n 0.609 / ( i 0.399 S 0 0.303 ) 0.997 (0.98 × Tci_p85)1.38
Note: 1—the fitted equation between each equation-calculated Tci and Tci_p85 is given inside brackets after R2.
Table 3. Statistical summary of tp, Tr_p85, and Tcp of pervious surfaces for 750 modeling cases.
Parametertp (min)Tr_p85 (min)Tcp (min)
Minimum0.023.23.2
50 percentiles3.323.217.3
75 percentiles18.056.635.8
90 percentiles56.0104.760.3
95 percentiles69.1136.382.6
Maximum180.1351.6227.8
Note: tp is the ponding time, Tr_p85 is the travel time for 85% of particles to arrive at the outlet from the beginning of rainfall, and Tcp is the time of concentration for pervious surfaces, which is equal to Tr_p85 − tp.
Table 4. MLR fitted exponents C1 to C5 of Equation (10) and corresponding 95% confidence intervals.
ParameterValue95% Confidence Interval
C12.162[0.875, 5.340]
C20.535[0.488, 0.582]
C30.161[0.030, 0.292]
C40.645[0.591, 0.699]
C51.213[1.172, 1.255]