Abstract
Organic de-icing chemicals, such as propylene glycol and potassium formate, cause environmental degradation in receiving water if left untreated, due to the high organic load resulting in oxygen depletion. Biofilters are commonly used for the treatment of biodegradable organic carbon in water treatment. This study investigated the potential for using biofilters for treating organic de-icing compounds. Lab-scale adsorption tests using filter media made of crushed clay (Filtralite) and granular activated carbon were conducted. Further, a column filtration experiment testing two different crushed clay size ranges was carried out investigating the effect of filter media depth, nutrient addition, and filtration rate. The surrogate parameter used to monitor the removal of de-icing chemicals was dissolved organic carbon (DOC). The adsorption test showed no significant adsorption of DOC was observed. The column test showed that the most active separation occurred in the first ~20 cm of the filter depth. This was confirmed by results from (1) water quality analysis (i.e., DOC removal and adenosine tri-phosphate (ATP) measurement); and (2) calculations based on a filtration performance analysis (Iwasaki model) and filter hydraulic evaluation (Lindquist diagram). The results showed that, for the highest C:N:P ratio tested (molar ratio of 24:7:1), 50–60% DOC removal was achieved. The addition of nutrients was found to be important for determining the biofilter performance.
1. Introduction
Air travel during winter months is made safer owing to the de-icing practices in place. In most cases, low molecular weight alcohols are used for de-icing the airplanes, whereas for the runways, alcoholic compounds are often combined other non-corrosive deicers. Consequently, the run-off water from airplanes and runways contains high concentrations of the aforementioned chemicals. These chemicals infiltrate into the soil or are released into water bodies around the airports when the snow melts. Even though the de-icing chemicals are readily biodegradable, the degradation requires a high oxygen demand and this may affect the natural state of the soil [1,2].
For airports in Norway, propylene glycol (PG, C3H8O2) is the main component of aircraft de-icing fluids and potassium formate (PF, HCO2K) is used for de-icing of runways and taxiways. Studies were conducted investigating the infiltration of such chemicals into groundwater during the development of Gardermoen Airport in Oslo. At low concentrations, these chemicals are readily biodegradable over a wide range of temperature, but exhibit inhibitory behavior at higher concentrations, i.e., in the order of a few grams/kg [3]. In addition, French et al. [4] showed that the rate of biodegradation of de-icing chemicals is limited not only due to low temperatures but also due to their limited residence time in the unsaturated zone for the soil bacteria to perform biodegradation. Residence time plays a major role especially if biodegradation rates are low.
Notwithstanding this, climate change poses real threats in coming years. In cold regions such as Norway, winter temperatures are expected to increase. This means that temperatures will frequently be around zero degrees. Temperatures in the winter might also be more variable. A statistical model of Oslo Airport Gardermoen indicates more wind, precipitation and flights. This, combined with low temperatures, will result in an increased use of de-icing chemicals in the future [1].
Moreover, airport operators worldwide are under scrutiny to cope with the regulations focusing on the environmental impacts of de-icing practices. Particularly for airports in Europe, the Water Framework Directive (2000/60/EC) and Soil Directive (2004/35/EC) have put de-icing practices under the microscope. Many major international airports are operating management systems to handle these chemicals. A wide range of practices is currently in place ranging from sophisticated recycling units to simple aerated lagoons. The focus of managing de-icing chemicals containing water has been put on source reduction, containment, stormwater treatment, and/or safe disposal [5,6].
Among the many treatment alternatives mentioned above, this study has focused exclusively on a biofiltration system for de-icing chemicals containing stormwater. Biofiltration system is considered a promising method for reducing both dissolved and particulate pollutants that improves water quality improvement and flow retention [7,8,9,10]. The main objectives of this study have been application of a biofiltration system for treatment of de-icing chemicals containing stormwater and investigation of factors affecting the performance of such a biofiltration system especially when biological activity within the filter is established.
2. Materials and Methods
2.1. De-Icing Chemicals
PG and PF solutions obtained from Værnes Airport in Trondheim were used as the chemicals for the tests. PG was obtained in a concentrated form with a density of 1.04 g/cm3. PF solution was delivered in a diluted form consisting of 1:1 water-to-PF ratio that gives the solution a density of 1.33–1.37 g/cm3. Average concentrations of PG and PF during winter 2013–2014 as monitored in the runoff water from Trondheim Airport Værnes were 20 ± 29 mg/L and 13 ± 35 mg/L, respectively. The average concentrations were used for the column filtration tests.
2.2. Filter Media
Commercially available filter media Filtralite (Leca) of different sizes and granular activated carbon (GAC) HOK W-II (Miljøkalk) were used in the experiments. Table 1 summarizes the media commercial names, size ranges, effective diameters (Deff, correspond to 10% passing weight from sieving test), and the type of tests they were assigned to.

Table 1.
Filter media used in the study with corresponding test.
Filtralite is produced from the incineration process of expanded clay material at 1200 °C, making the density of the material very low (1100 kg/m3) and highly porous. Despite differences in size and, consequently, specific physical properties (e.g., specific surface area, shape factor, uniformity coefficient), the different Filtralite media should display similar physico-chemical properties (e.g., surface charge, hydrophobicity/hydrophilicity). The bulk density of GAC is 450 kg/m3 with approximately 48.5% porosity, which permits a large surface area for adsorption.
2.3. Adsorption Studies
The adsorption of de-icing chemicals onto granular activated carbon (GAC), Filtralite NC 0–2 and Filtralite NC 0.8–1.6 was studied in a batch experiment. The Filtralite and GAC media were presoaked in distilled water to ensure wettability as specified by the manufacturers. The experiment was carried out in 1 L beakers with continuous mixing (Kemira Kemwater Flocculator 2000). The dry weight of media was 2 g media for each beaker. Different concentrations of de-icing chemicals were prepared by diluting PG and PF with Milli-Q water and the corresponding dissolved organic carbon (DOC) concentrations were ranging from 0.6–24 mg C/L.
2.4. Filtration Test
Two parallel sets of 120 mm inner diameter, 180 cm tall plexi-glass columns filled with a total of ~160 cm media bed were used (Figure 1). Column 1 and 2 were filled with Filtralite NC 0.8–1.6 and NC 1.5–2.5, respectively. Each column was equipped with valves to allow sampling at different depths. Pressure along the filters depths were continuously monitored and recorded by installing pressure transducers (ABB 51T series) along several filter depths, a logger (Agilent 34970a), and a computer.
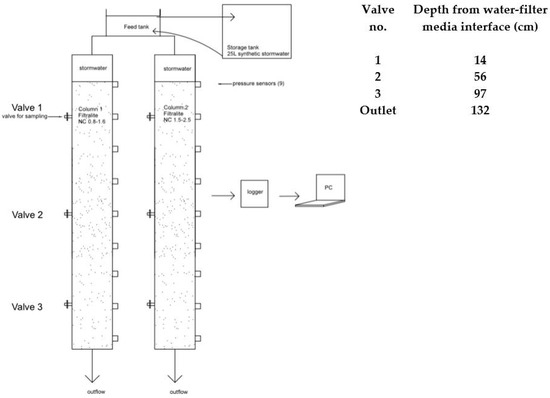
Figure 1.
Setup of the column filtration experiment and sampling valve depths.
Fresh synthetic stormwater (diluted PG and PF solutions in distilled water) was prepared daily to avoid biodegradation in the feedwater container. The concentrations of PG and PF in the feed was kept constant at 20 mg/L and 13 mg/L following the monitored average concentration in stormwater runoff at Værnes Airport (Trondheim, Norway). The corresponding inlet DOC concentration was between 6 and 7 mg C/L. Nutrients were added at later stages of the test in form of inorganic salts of monopotassium phosphate (KH2PO4) and ammonium nitrate (NH4NO3). Suspended solid (real sediment taken along the airport runway and de-icing area) was added to mimic the actual condition at ~50 mg/L (turbidity of 6–13 NTU) and to seed the filter with indigenous microbes naturally adapted to the de-icing chemicals. The feedwater temperature was cooled to ~10 °C by a cooling element (Grant GD100).
The column study was divided into four phases based on nutrient ratio (molar ratio of carbon, nitrogen, and phosphorus—C:N:P) owing to the observed filtration performance. Phase 1 (C:N:P of 6500:750:1) relates to the acclimatization step of the filters in which biological activity was established. The filters were fed with water containing only de-icing chemicals. Phases 2 and 3 investigate the effect of nutrients addition (N and P) represented by specific C:N:P molar ratios (100:10:1 and 24:7:1, respectively). The flow was kept constant at 7 mL/min by peristaltic pumps (Masterflex LS) giving hydraulic and DOC loading rates of ~0.9 m/day and 5.4–6.2 g C/m2/day, respectively. This flow was calculated from the average rainfall at Værnes Airport in year 2015 obtained from The Norwegian Meteorological Institute (www.met.no) and the corresponding ratio of filter bed to drainage area of 3.33%. The flow was also monitored regularly by weight-based measurement (Mettler Toledo PB8001-L). Phase 4 investigates the accelerated filter fouling test with higher filtration rate (40 mL/min) to simulate clogging of the filters giving a hydraulic and DOC loading rates of ~5.1 m/day and 30.6–35.7 g C/m2/day, respectively.
2.5. Filtration Performance Analysis
The Iwasaki model was initially developed to elucidate physicochemical phenomena in filtration. However, recent developments have seen the application of the model in systems involving biological processes [11,12,13]. A variety of approaches have been developed to represent the propensity of filtration coefficient (λ) as a function of a specific deposit. For biologically active filters, the specific deposit could be interpreted as the sum of specific deposits exerted by both living, non-living, and inert components [11]. In this study, λ was analytically calculated and treated as a black-box variable by assessing the change of influent and effluent DOC in each filter layer (i.e., filter depth between sampling ports in Figure 1) at different stages of the experiment:
where
- = concentration at the outlet and inlet of each layer, respectively (mass/volume);
- = the media depth (length);
- = the filter coefficient (length−1).
2.6. Water Quality Analysis
Samples from inlet, outlet, and along the filter depth were drawn regularly. DOC, adenosine triphosphate (ATP), turbidity, phosphorous, and nitrogen were monitored to assess the filtration performance. DOC was measured using Teledyne-Tekmar Apollo 9000. ATP was quantified by measuring the amount of light produced from its reaction with luciferase enzyme using a luminometer (Hygiena PI102). Turbidity is measured using Hach 2100N Turbidimeter. Total phosphorus and nitrogen are measured spectrophotometrically using Hach test tubes and a spectrophotometer (DR3900).
3. Results
3.1. Lab-Scale Adsorption Test
Figure 2 shows a typical DOC profile during adsorption tests of PG onto Filtralite and GAC. Little to no adsorption of PG was observed on Filtralite as seen from the nearly constant values of DOC. The fluctuations shown in the figure are within the standard deviation of the DOC measurements. The same observation was found for PF, rendering adsorption ineffective in removal of the de-icing chemicals. The data in the figure were subjected to adsorption isotherm models (i.e., linear, Langmuir, Freundlich); however, this resulted in very poor correlations except for those of GAC. Indeed, affinity for adsorption is dependent on the hydrophilic nature of the adsorbed species [14]. PG is a semi-polar hydrophilic chemical with dielectric constants (ε) of 32. A solvent might be classified as semi-polar if its ε-value lies between 20 and 50 [15]. PF is a salt with high solubility in water and, hence, is found in water in its dissociated form. This explains the relatively low adsorption onto Filtralite observed in the batch experiment. Adsorption onto GAC, although better than that of Filtralite, was shown to be unsatisfactory. As seen from the figure, DOC levels after more than 24 h were still comparable to the initial concentration. Thus, adsorption alone may not be sufficient for effective removal of the de-icing chemicals targeted in this study.
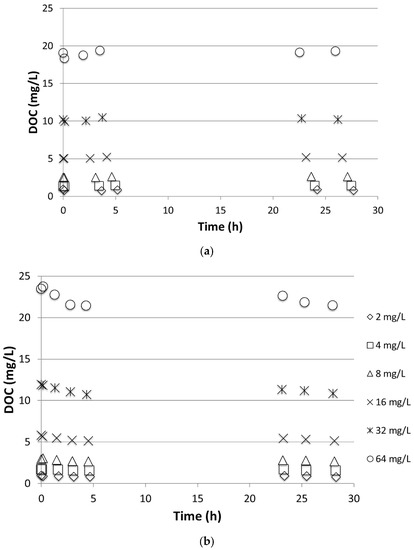
Figure 2.
Dissolved organic carbon (DOC) concentration profile of during adsorption test of propylene glycol (PG) onto (a) NC 0-2 and (b) GAC.
Persson et al. [16] investigated removal of geosmin and 2-methylisoborneol (MIB) by biofiltration with filters of Filtralite NC 0.8–1.6 compared to GAC. Good removal of the chemicals was achieved by both filters during biofiltration when concentrations were low. The properties of the target compounds used in the abovementioned study are of course different than the de-icing chemicals. However, the study also underlined that the degradation of chemicals in the GAC filter was due to both adsorption and biodegradation. For the filter with Filtralite NC 0.8–1.6, the degradation was shown mainly due to biodegradation and, consequently, was temperature-dependent. It is indeed shown by the results of this study that adsorption played a minor role in the removal of de-icing chemicals, and thus investigation of biodegradation process in the media in a biofilter setup capable of degrading de-icing chemicals was of paramount importance.
3.2. Column Filtration Test—The Effect of Nutrients on Biofilter Performance
The treatment performance of the biofilters was assessed by comparing the inlet and outlet DOC levels of Columns 1 and 2 (Figure 3). The DOC values in the figure are normalized to the initial concentrations to highlight the trend better. Phases 1 to 4 represent the experimental conditions tested as describe in the methodology section. The low DOC concentrations on the first days of operation may be attributed to the fact that the media was soaked with distilled water before use. Owing to long empty bed contact time (EBCT ~34 h), dilution may have occurred at the beginning of filtration test before the intended concentration of DOC was achieved throughout the filter volume. After ~5 days of operation, the effect of dilution diminished as observed from the steady DOC concentration.
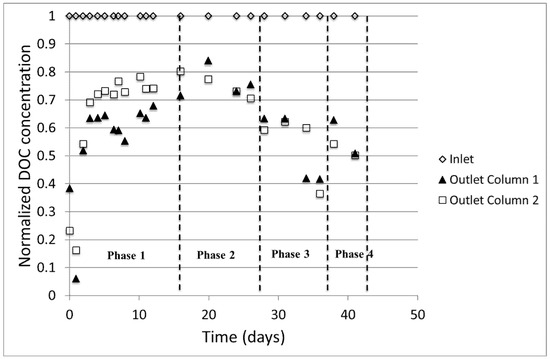
Figure 3.
Normalized DOC profile at the inlet and outlet of the filters at different phases.
It was observed that the DOC concentrations, and consequently DOC removal levels, varied as a function of the filter depth. Figure 4 presents the average % DOC removal in the column at different phases of the experiment. During Phase 1, the removal rates along the filter depth ranged from ~20–40% and ~10–25% for Column 1 and Column 2, respectively. It is unlikely that adsorption onto filter media plays a major role in the removal of the de-icing chemicals, as evident from the adsorption tests. However, since suspended materials were added to the feed water and the likelihood of adsorption of de-icing chemicals onto suspended materials exists, steric exclusion may contribute to the removal process. In such a case, the grain size of the filter media is important. However, one can observe that there is a minor difference in DOC concentrations leaching from both columns. Thus, steric exclusion may not play a significant role either; at least at this early stage, when the accumulation of suspended materials along the filter depth is still low.
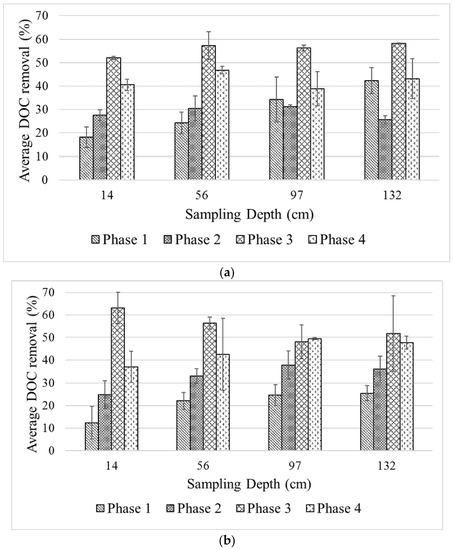
Figure 4.
Level of DOC at different sampling points (i.e., filter depths) in (a) Column 1 and (b) Column 2 at different phases of experiment.
The availability of nutrients is a major factor in establishing a fully functional biofilter. The amount of naturally available nutrients may not be sufficient and may thus be a limiting factor for an engineered biofilter [17]. The impact of nutrient addition is pronounced in this study, as seen from the increase of DOC removal after addition of N and P (specific C:N:P molar ratios of 100:10:1 and 24:7:1 in Phases 2 and 3, respectively). Indeed, given the rich carbon content in de-icing chemicals, N and P may be the limiting factors for the microbes for biological carbon degradation. In Phase 2, the average % DOC removal along the filter depth was slightly improved, ranging from ~30–40% and ~25–40% for Column 1 and Column 2, respectively. Only when the specific molar ratio was increased again in Phase 3 could the filters achieve 50–60% of DOC removal depending on the depth of the filter. The optimal nutrient ratio would depend on the treatment objectives; i.e., how much carbon should be removed. However, there is no specific regulation imposed by the authorities in Norway regarding the acceptable level of de-icing chemicals that may be safely released to the environment. On the other hand, artificial nutrient addition may pose other issues to the environment if this is practiced in an uncontrolled manner [18,19]. Monitoring of nutrients in the effluent of the biofilters was not comprehensively done. Consequently, this issue should be amply addressed in the pilot test, design, operation, and maintenance stages of the biofilter to ensure fulfilment of the treatment goal and to avoid downstream detrimental impacts on the environment.
The impact of higher filtration rate on the separation performance studied in Phase 4 suggests that there was a slight decrease of DOC removal compared to that of Phase 3. Given the same level of nutrient ratio as in Phase 3, the average % DOC removal in Phase 4 ranges from 40–50%. Lower retention time in the filter can be seen as an explanation for this phenomenon. A higher flow means higher availability of the nutrients. However, this may become shock-loading for the already established biology in the filters. Even though the biological activity may increase, it may take a while before the biological community adapts to the change of condition. The decrease of biofilter performance due to increase inflow was also reported by Hatt et al. [10]. A higher flow may also promote microorganism wash-out due to sloughing effect of interstitial water along the pore channels of a filter [20]. This in turn will decrease the viable microorganisms, contributing to the biological degradation process.
The simultaneous development of biofilms and solid accumulation seem to be the two predominant DOC removal mechanisms by the biofilters. Given the discussion presented above, the former mechanism is believed to exert DOC removal more than the latter. The removal efficiencies observed in each phase should be affected by the preceding one given that the filtration continues from one phase to another. This procedure gives an indication of how the biology responds to the changing assay conditions and the expected trend/range of DOC removal as a function of the biofilter operating time. This approach is thought to better represent the conditions that the biofilter would cope in a real application.
3.3. Separation Behavior along the Filter Depth
Judging the filtration performance by solely looking at the DOC removal levels in Figure 4 can be misleading, since the thickness of filter media in which separation takes place is neglected in the calculation. Iwasaki model evaluates the filtration performance by considering different filtration layers along the filter depth and characterizes these layers according to the amount of separation that takes place at different filter depths. Figure 5 presents the calculated filtration coefficient (λ) for the two columns based on DOC removal as a function of filter depth.
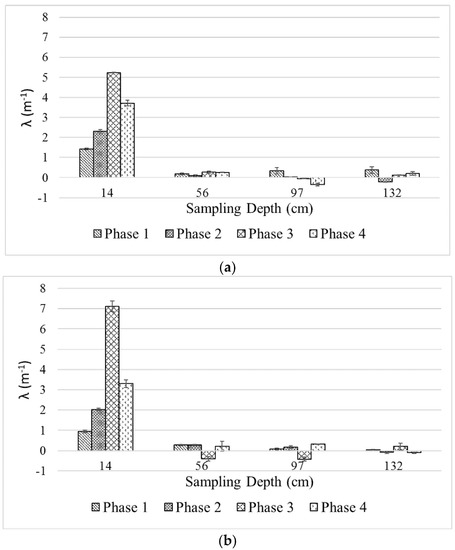
Figure 5.
Filtration coefficients (λ) of (a) Column 1 and (b) Column 2 as a function of filter depth at different phases of the experiment.
As seen in the figure, λ values for both filter media in Phases 1, 2 and 4 are similar (~1–1.5, ~2–2.5 and ~3–3.5 m−1, respectively); except for Phase 3, in which the larger filter media exerts significantly higher λ (~7 vs. ~5 m−1). For both filters, λ is highest in the first predetermined filter layer (i.e., 14 cm) and acquires similarly low values in the subsequent layers. The negative values of λ in deeper filter layers, indicating higher DOC at the effluent compared to that of influent, were observed during the experiment. Temporal DOC transfer, accumulation, or release between these layers may be responsible for this phenomenon, but a more comprehensive explanation cannot be made based on the set of data currently obtained from this study. The trend of λ values of the deeper filter layers is lacking and the standard deviation values suggest the values are not significantly different from zero. Nonetheless, it is clear that DOC separation occurs mainly on the top layer of the filter columns while the subsequent depth has little to no contribution in the process.
Although the λ of the larger filter media was significantly higher in Phase 3, the levels of DOC removal were similar (50–60%). This indicates that the grain size plays a minor role in enhancing DOC removal. Grain size, however, may affect the hydraulic and operation time of a biofilter owing to solid retention and biofilm growth in the filter pores as discussed later in the text. The impact of nutrient addition coincides with the trend of λ in the upper filter layer for both filters. As seen from Figure 5, λ increases as nutrients are added to the feedwater in an increasing manner from one phase to another. This suggests that nutrient addition is of paramount importance and can be a tradeoff one must incur to optimize the biofilter performance. The impact of an increased filtration rate in Phase 4 is also represented by the lower λ values for both filters. Interestingly, the top filter layer was still the most active separation layer, even though the possibility of the microorganism carrying over to the lower layer exists. The discussion on λ highlights two important key factors that affect the biofilter performance: requirements for biofilter depth and nutrient addition. These factors should be considered in the design and operation of a biofilter.
As discussed briefly in the methodology section, this study applied the Iwasaki model to a system that involves biological processes as also investigated by previous researchers [11,12,13]. For biologically active filters, the specific deposit (σ) could be interpreted as the sum of specific deposits exerted by both living, non-living, and inert components [11]. Based on the trend of nutrient addition, DOC removal, and λ values, it can be thought that the increase of λ is directly proportional to the uptake rate of biodegradable DOC by the microbial mass or biofilm inside the filter layer. This study, however, did not aim to meticulously quantify the exact components of σ that led to the observed dynamics of λ. Rather, λ was treated as a black-box variable by investigating the possible mechanisms that led to a change in DOC concentrations. This rather phenomenological approach is commonly applied to elucidate various phenomena in water treatment processes and, though limited, may result in a satisfactory design [21]. Insights into the internal workings of such a black-box approach may be achieved by more thorough experiments and modelling, and this optimization issue should be prioritized in the pilot test.
3.4. Biological Activity in the Filter Media
Biological activity along the filter depths was investigated by measuring ATP as a measure of viable cells. Figure 6 presents the values of ATP as a function of filter depth. The figure confirms the discussion on the predominant DOC removal mechanism in the previous section. As seen in the figure, as C:N:P ratio increases, the ATP values become larger. The figure also confirms the higher ATP values at the top filter layer suggesting that it is a more biologically active layer compared to the succeeding ones. The fact that the ATP values of both filter columns in Phases 1–3 are comparable is rather intriguing. One would argue that smaller filter grains would provide a larger surface area for microorganism attachment and, thus, results in more densely packed active layer. However, this premise is not necessarily true from the observation of this study, as seen from the similar DOC removal percentage and the ATP values. Even though nutrients become more available from Phase 1 to 3, other factors important for the biological process may become limiting as the biofilm grows. Take oxygen and carbon dioxide as an example: an increase in biomass would require higher oxygen uptake and higher carbon dioxide production. Such conditions could clearly be detrimental for the biological process. This may provide an explanation of the higher microorganism viability on the top layer and growth limitation in the succeeding layers, and rendering an extra bed depth would not be beneficial for the type of application studied.
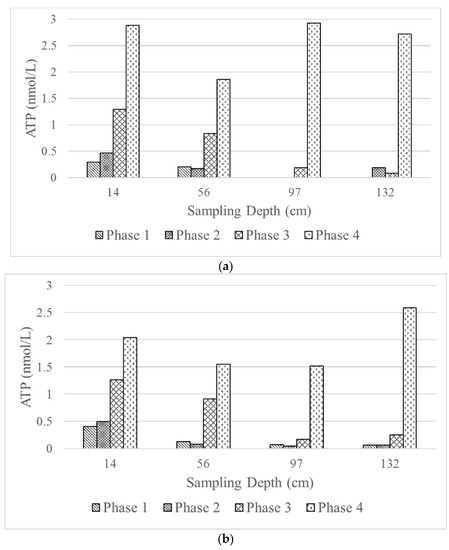
Figure 6.
Biological activity represented by adenosine tri-phosphate (ATP) levels in (a) Column 1 and (b) Column 2 at different filter depths and phases of the experiment.
The ATP values in Phase 4 are indeed highest compared to Phases 1–3. As discussed previously, DOC removal in Phase 4 is actually lower than that of Phase 3, even though the nutrient availability should be higher in a higher filtration rate. Thus, the higher ATP values may be explained by a possible carry-over of microorganisms to the lower filter layers rather than growth of biofilms.
The ATP values observed in this study are much lower than those found in wastewater application, e.g., as reported by Hong [22] and Bourke et al. [23]. This is completely logical given the type of application of biofilter considered in this study, i.e., no intensive aeration that promote growth of microorganisms. Indeed, biological activity for biofilters treating stormwater may have to cope with potentially more challenging issues such as low nutrient content in stormwater, temperature fluctuations, etc.
3.5. Hydraulic Performance of the Filters
Material buildup inside the porous structure due to solid retention and the growth of biofilm leads to a reduction of the filtration capacity of the biofilters. Figure 7 shows the progression of headloss throughout the filter depth during the phases of the experiment represented by the Lindquist diagram. The diagram shows the deviation from a theoretical line (hydrostatic pressure) in which no headloss occurs. As expected, Column 1, which consists of smaller media, exhibits higher headloss compared to Column 2. The initial clean water resistance (headloss) that corresponds to headloss in the media if tap water flows through the column is, however, very small (<5 cm) for both filter media. After the filters are fed with feedwater containing particles and de-icing chemicals, the lines start to deviate from the hydrostatic line indicating an increase of headloss due to particle retention and, in later stages, the growth of active biofilm onto the media surface, as will be discussed in the following paragraphs.
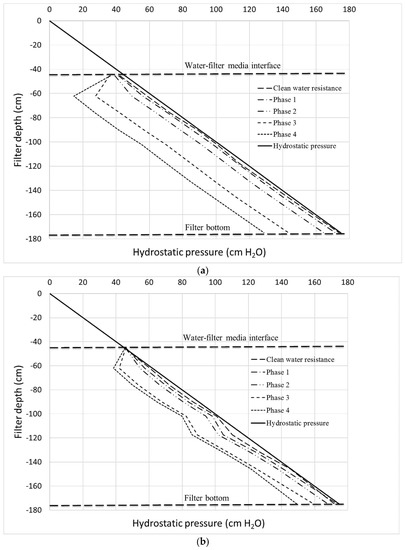
Figure 7.
Headloss development at different phases of filtration test for (a) Column 1 and (b) Column 2.
The Lindquist diagram also indicates the depth in which the activities of such separation and biofilm growth occur. Interestingly, for both filters, these activities occur on the top layer, i.e., the first ~20 cm of filter depth as indicated by the lines confirming the trends shown by λ and ATP values. The headloss below this point is more or less stable, i.e., indicated by similar deviation from the ideal hydrostatic pressure line. The diagram also indicates that separation occurs along the filter depth (i.e., depth filtration) as in the case of rapid sand filters, rather than surface filtration, which predominantly occurs in slow sand filters. This finding is interesting and suggests that the separation performance may be independent of the effective size of the filter media; i.e., the size of the media affects only the filtration hydraulic.
Figure 8 depicts the fouling rate of the two filter columns calculated from the Lindquist diagram. Values in the x-axis correspond to the assigned filter depth equipped with pressure sensors. As seen from the figure, each phase of the experiment resulted in different fouling rates. However, the trend is consistent with those of DOC removal and λ and confirms the depth of the active layer in the filters which contributes to DOC degradation.
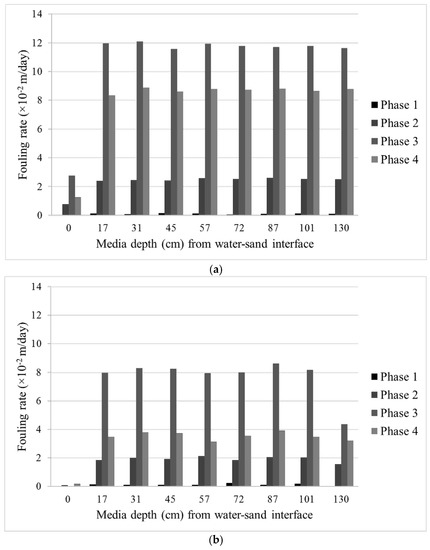
Figure 8.
Fouling rates of (a) Column 1 and (b) Column 2 calculated from the Lindquist diagram.
As expected, Column 1, with smaller filter media, exhibits a higher fouling rate compared to the larger ones in Column 2. Column 1 was clogged at the end of the experiment period while Column 2 could still maintain a degree of flow after ~45 days of experiment. Even though the operation time of the filters were rather short, one must concede that this type of test can be seen as an accelerated filtration performance test in which a constant amount of solids, nutrients, and target compounds were supplied and the flow was adjusted. In reality, one must also consider many factors that were not covered in this study and may pose operational challenges to such a biofilter such as intermittent flow, freezing condition, first flush, etc.
4. Conclusions
The treatment potential of biofilters for the treatment of water containing de-icing chemicals was assessed. Lab-scale adsorption tests using filter media made of crushed clay (Filtralite) and granular activated carbon showed that adsorption was unsuitable for removal of de-icing chemicals (propylene glycol and potassium formate) considered in this study.
A column filtration experiment testing two different crushed clay size ranges was conducted to assess de-icing chemical removal by biodegradation. The results showed that DOC removal was dependent on a number of factors. This study investigated the impact of filter depth, nutrients addition, and filtration rate.
DOC removal suggested that DOC degradation occurred on the top filter layer and, hence, additional filter depth would be unnecessary. It was shown that the most active separation occurred in the first ~20 cm of filter depth. This was confirmed by results from water quality analysis (i.e., DOC removal and ATP measurement) and calculations based on a filtration performance analysis (Iwasaki model) and filter hydraulic evaluation (Lindquist diagram). It was shown that, for the highest C:N:P ratio tested (molar ratio of 24:7:1), 50–60% DOC removal was achieved. The addition of nutrients was found important and determined the biofilter performance.
The filtration test conducted in this study can be seen as an accelerated filtration performance test in which a constant amount of solids, nutrients, and target compounds were supplied and the filtration rate was adjusted. Other factors that could be of importance for the design and operation of a biofilter treating de-icing chemicals, e.g., intermittent flow, freezing condition, first flush, were not covered in this study and should be further investigated.
Author Contributions
All authors contributed to the design of experiment. K.A. led the study. H.K.H.L. and G.S.R. were responsible for performing the experiment and data analysis. T.M.M. and K.A. contributed to results interpretation. G.S.R. wrote the paper with input from T.M.M. and K.A.
Acknowledgments
This study has been a part of Center for Research-based Innovation KLIMA 2050 funded by The Research Council of Norway (NFR). The funding support from NFR and contribution from LECA and AVINOR as KLIMA 2050 partners are greatly appreciated.
Conflicts of Interest
The authors declare no conflict of interest.
References
- French, H.K.; Eggestad, H.-O.; Øvstedal, J.; Jahren, P.-E. Climate conditions and consequences for de-icing operations as exemplified by the situation on a motorway and airport at Gardermoen, Norway. Hydrol. Res. 2010, 41, 269–281. [Google Scholar] [CrossRef]
- Corsi, S.R.; Mericas, D.; Bowman, G.T. Oxygen Demand of Aircraft and Airfield Pavement Deicers and Alternative Freezing Point Depressants. Water Air Soil Pollut. 2012, 223, 2447–2461. [Google Scholar] [CrossRef]
- Klecka, G.M.; Carpenter, C.L.; Landenberger, B.D. Biodegradation of Aircraft Deicing Fluids in Soil at Low Temperatures. Ecotoxicol. Environ. Saf. 1993, 25, 280–295. [Google Scholar] [CrossRef] [PubMed]
- French, H.K.; Van Der Zee, S.E.A.T.M.; Leijnse, A. Transport and degradation of propyleneglycol and potassium acetate in the unsaturated zone. J. Contam. Hydrol. 2001, 49, 23–48. [Google Scholar] [CrossRef]
- Betts, K.S. Airport Pollution Prevention Takes Off. Environ. Sci. Technol. 1999, 33, 210A–212A. [Google Scholar] [CrossRef] [PubMed]
- Griesmer, M.J. Welcome aboard: Aircraft deicing fluid and the environmental epidemic it is causing. J. Air Law Commer. 2007, 72, 727–750. [Google Scholar]
- Kim, H.; Seagren, E.A.; Davis, A.P. Engineered bioretention for removal of nitrate from stormwater runoff. Water Environ. Res. 2003, 75, 355–367. [Google Scholar] [CrossRef] [PubMed]
- Dietz, M.E. Low Impact Development Practices: A Review of Current Research and Recommendations for Future Directions. Water Air Soil Pollut. 2007, 186, 351–363. [Google Scholar] [CrossRef]
- Read, J.; Wevill, T.; Fletcher, T.; Deletic, A. Variation among plant species in pollutant removal from stormwater in biofiltration systems. Water Res. 2008, 42, 893–902. [Google Scholar] [CrossRef] [PubMed]
- Hatt, B.E.; Fletcher, T.D.; Deletic, A. Hydrologic and pollutant removal performance of stormwater biofiltration systems at the field scale. J. Hydrol. 2009, 365, 310–321. [Google Scholar] [CrossRef]
- Campos, L.C.; Smith, S.R.; Graham, N.J.D. Deterministic-based model of slow sand filtration. J. Environ. Eng. 2006, 132, 872–886. [Google Scholar]
- Campos, L.C.; Smith, S.R.; Graham, N.J.D. Deterministic-based model of slow sand filtration. J. Environ. Eng. 2006, 132, 887–894. [Google Scholar]
- Li, H.; Davis, A.P. Urban particle capture in bioretention media. I: Laboratory and field studies. J. Environ. Eng. 2008, 134, 409–418. [Google Scholar]
- Nam, S.-W.; Choi, D.-J.; Kim, S.-K.; Her, N.; Zoh, K.-D. Adsorption characteristics of selected hydrophilic and hydrophobic micropollutants in water using activated carbon. J. Hazard. Mater. 2014, 270, 144–152. [Google Scholar] [CrossRef] [PubMed]
- Gorman, W.G.; Hall, G.D. Dielectric constant correlations with solubility and solubility parameters. J. Pharm. Sci. 1964, 53, 1017–1020. [Google Scholar] [CrossRef] [PubMed]
- Persson, F.; Heinicke, G.; Hedberg, T.; Hermansson, M.; Uhl, W. Removal of geosmin and MIB by biofiltration—An investigation discriminating between adsorption and biodegradation. Environ. Technol. 2007, 28, 95–104. [Google Scholar] [CrossRef] [PubMed]
- Lauderdale, C.; Chadik, P.; Kirisits, M.J.; Brown, J. Engineered biofiltration: Enhanced biofilter performance through nutrient and peroxide addition. J. Am. Water Works Assoc. 2012, 104, E298–E309. [Google Scholar] [CrossRef]
- Carpenter, S.R.; Caraco, N.F.; Correll, D.L.; Howarth, R.W.; Sharpley, A.N.; Smith, V.H. Non-point pollution of surface waters with phosphorus and nitrogen. Ecol. Appl. 1998, 8, 559–568. [Google Scholar] [CrossRef]
- Camargo, J.A.; Alonso, Á. Ecological and toxicological effects of inorganic nitrogen pollution in aquatic ecosystems: A global assessment. Environ. Int. 2006, 32, 831–849. [Google Scholar] [CrossRef] [PubMed]
- Li, Q.; Yu, S.; Li, L.; Liu, G.; Gu, Z.; Liu, M.; Liu, Z.; Ye, Y.; Xia, Q.; Ren, L. Microbial communities shaped by treatment processes in a drinking water treatment plant and their contribution and threat to drinking water safety. Front. Microbiol. 2017, 8, 2465. [Google Scholar] [CrossRef] [PubMed]
- Ives, K.J. The inside story of water-treatment processes. J. Environ. Eng. 1995, 121, 846–849. [Google Scholar] [CrossRef]
- Hong, C. ATP content and biomass activity in sequential anaerobic/aerobic reactors. J. Zhejiang Univ. Sci. A 2004, 5, 727–732. [Google Scholar]
- Bourke, M.F.; Marriott, P.J.; Glud, R.N.; Hasler-Sheetal, H.; Kamalanathan, M.; Beardall, J.; Greening, C.; Cook, P.L.M. Metabolism in anoxic permeable sediments is dominated by eukaryotic dark fermentation. Nat. Geosci. 2017, 10, 30–35. [Google Scholar] [CrossRef] [PubMed]
© 2018 by the authors. Licensee MDPI, Basel, Switzerland. This article is an open access article distributed under the terms and conditions of the Creative Commons Attribution (CC BY) license (http://creativecommons.org/licenses/by/4.0/).