Article

Analysis on Operation and Water Quality Characteristics of Centralized Wastewater Treatment Plants of Industrial Parks in Yellow River Basin, China

1
Chinese Research Academy of Environmental Sciences, Beijing 100012, China
2
Jiangsu Changzhou Environment Monitoring Center, Changzhou 213000, China
3
Yellow River Basin Ecological and Environmental Administration Ministry of Ecology and Environment, Zhengzhou 450004, China
4
Ecological and Environmental Monitoring and Scientific Research Center, Yellow River Basin Ecological and Environmental Administration Ministry of Ecology and Environment, Zhengzhou 450004, China
*
Authors to whom correspondence should be addressed.
These authors contributed equally to this work.
Water 2024, 16(6), 806; https://doi.org/10.3390/w16060806
Submission received: 20 February 2024 / Revised: 3 March 2024 / Accepted: 6 March 2024 / Published: 8 March 2024
(This article belongs to the Special Issue Sustainable Wastewater Treatment and the Circular Economy)

Abstract

:
The Yellow River basin serves as an important economic belt and industrial base in China, featuring numerous industrial parks. However, alongside its economic significance, the basin struggles with significant water environmental challenges. This study analyzed the operational status, influent water quality, and energy consumption of 63 centralized wastewater treatment plants (WWTPs) from 54 major industrial parks in the Yellow River basin. The scale of these WWTPs was primarily within the range of 1 × 10⁴~5 × 10⁴ m3/d, with an average hydraulic loading rate of 53.8%. Aerobic treatment processes are predominant. The influent concentrations of chemical oxygen demand (COD), biochemical oxygen demand (BOD), ammonia nitrogen (NH3-N), total nitrogen (TN), and total phosphorus (TP) in the WWTPs exhibited a right-skewed distribution. The BOD/COD ratio of the WWTPs fluctuated between 0.1 and 1.6, and 75% of the WWTPs showed a COD/TN ratio lower than eight. The average BOD5/TN was 2.7, and the probability of influent BOD5/TP > 20 was 84.6%. A significant linear correlation exists between the influent BOD and COD concentrations, while moderate linear relationships are also observed among NH3-N, TN and TP, emphasizing the importance of maintaining appropriate nitrogen and phosphorus levels for efficient pollutant removal. The average electricity consumption of WWTPs in the Yellow River basin in 2023 was 1.1 kWh/m3. It is important to upgrade these WWTPs and reduce their energy consumption. Further strengthening the construction of industrial wastewater collection and treatment facilities based on regional characteristics is recommended to promote the high-quality development of industrial wastewater treatment in the Yellow River basin.

1. Introduction

Water is a vital natural and strategic resource, directly related to the sustainable development of both the economy and society. Globally, water scarcity poses a pressing challenge, projected to affect two-thirds of the world’s population by 2025 [1]. The Yellow River ranks as the fifth largest river in the world and serves as an important water source in northern China [2]. Approximately 15% of China’s agriculturally irrigated land and 12% of its population rely on the Yellow River for water supply [3]. Furthermore, it facilitates long-distance water supply to key regions such as Beijing, Tianjin and Hebei [4]. Ecological preservation and green development in the Yellow River basin are two of China’s major national strategies. The Chinese government issued the “Outline of Ecological Protection and High-Quality Development Plan for the Yellow River Basin” in 2021, emphasizing environmental improvement and sustainable development [5].
The Yellow River basin is not only an important ecological barrier and economic region in China but also an important energy, chemical industry, raw material and basic industrial base. It accommodates a large number of high-energy-consuming and high-pollution industries and has become an important industrial infrastructure cluster [6,7]. Factor endowments and development circumstances determine that traditional industries in the Yellow River basin primarily thrive on resource mining and processing, shaping a resource- and energy-reliant industrial framework based on coal, oil, natural gas, metal mining and processing [8,9,10].
Industry is the main driver of economic and social development in the Yellow River basin, concurrently serving as a key contributor to water resource consumption and water environmental pollution. The accelerated pace of economic expansion has exacerbated the risks of water resource depletion and water pollution in this region. The per capita water resource of the Yellow River basin is 905 m3, approximately one-third of the national per capita water, and below the standard for water-scarce areas (1000 m3) [11,12]. Over the past two decades, the total water consumption in the basin has increased from 112.74 billion m3 in 2000 to 125.87 billion m3 in 2020, accompanied by a rise in wastewater discharge from 9.06 to 21.3 billion tons [13]. Industrial wastewater discharge accounts for nearly one-third of the total wastewater discharge in this area. In recent years, escalating tensions stemming from carrying capacity shortages, water shortages, and water environment issues in the Yellow River basin have become prominent [3,14]. According to the 2022 China Ecological Environment Status Bulletin, 2.3% of the 263 water quality sections across the Yellow River were categorized as below Class V, significantly surpassing the national average of 0.7% [15]. The contradiction between water supply and demand, coupled with water pollution problems, has gradually become an important factor impeding the sustainable economic and social development of the Yellow River basin.
Industrial parks represent a ubiquitous aspect of global industrial development [16]. With China’s rapid urbanization and industrialization, the development of industrial parks has been accelerated in recent decades. China currently has 2543 industrial parks, with approximately a quarter situated within the Yellow River basin [17]. The establishment of shared infrastructure, such as centralized wastewater treatment plants (WWTPs) in industrial parks, is a global practice and constitutes a fundamental strategy to promote industrial symbiosis [18,19]. Centralized industrial WWTPs are centrally managed facilities or independently operated units that specialize in treating industrial wastewater originating from industrial parks as well as neighboring enterprises or industrial facilities. Given the concentration of industrial activities in diverse industrial parks, the construction of centralized industrial WWTPs is growing rapidly. The number of centralized industrial WWTPs and their wastewater treatment capacities in 2017 were 3.6 times and 3.2 times those of 2007, respectively [20]. Centralized industrial WWTPs play an important role in controlling industrial water pollution and maintaining the safety of the water environment in the Yellow River basin, which serves as an indispensable safeguard for promoting the green and high-quality development of industrial parks.
Current research on centralized industrial WWTPs mainly focuses on the process design or improvement of individual or multiple plants, as well as suggestions for supervision and management policies [21,22,23]. However, comprehensive analyses and research on centralized WWTPs in industrial parks in the Yellow River basin have been absent. This study took 63 centralized WWTPs in 54 national and provincial industrial parks in the Yellow River basin as the research objects and investigated aspects including the scale and operation of the WWTPs, the characteristics and correlations of the main pollutants in the influent, and their energy consumption and operational costs. The objective is to identify challenges in the construction and operation of centralized WWTPs in industrial parks in the Yellow River basin and to provide insights for the high-quality development of industrial wastewater treatment in the basin.

2. Methods

2.1. Data Collection

The Yellow River basin includes nine provincial districts, namely Qinghai, Sichuan, Gansu, Ningxia, Inner Mongolia, Shaanxi, Shanxi, Henan and Shandong. In this study, 54 industrial parks in the Yellow River basin were selected as the research objects due to their importance among all parks. Specifically, all selected parks are classified as national or provincial and have centralized industrial WWTPs instead of sharing with municipal WWTPs or treating water separately. Figure 1 depicts the geographical locations of 54 industrial parks in the Yellow River basin. The leading industries in these industrial parks included the petrochemical industry, the coal chemical industry, the fine chemical industry, the smelting industry, the pharmaceutical sector and the pesticide industry. The research objects comprised a total of 63 centralized WWTPs located within these industrial parks.
Considering the provincial administrative divisions and the geographical division of the upper, middle and lower reaches of the Yellow River basin, in this study, 43 centralized industrial WWTPs were identified in the upper reaches of the Yellow River basin, encompassing Gansu, Ningxia and Inner Mongolia, while 11 centralized industrial WWTPs were situated in the middle reaches, spanning Shaanxi and Shanxi, with an additional 9 centralized industrial WWTPs located in the lower reaches, including Henan and Shandong.
Overall, the operation and water quality data of 63 centralized industrial WWTPs in 2023 were obtained from surveys. However, due to the diverse operating realities, the water quality index varied between parks, and some of the data were missing or abnormal. Thus, all the data were pretreated and screened to eliminate outliers, and a random sampling survey was carried out to ensure the reliability of the data.

2.2. Data Analysis

In this study, the construction and operational status were analyzed considering regional distribution, design processing capacity, actual wastewater treatment volume, and wastewater treatment processes. The influent quality parameters of 63 centralized industrial WWTPs, including the chemical oxygen demand (COD), biochemical oxygen demand (BOD), ammoniacal–nitrogen (NH3-N), total nitrogen (TN) and total phosphorus (TP), were analyzed, as their concentrations and ratios are vital for wastewater treatment process selection and design. Influent water quality characteristics were measured, and a correlation analysis was conducted. Statistical analyses on the wastewater influent quality at industrial WWTPs in the Yellow River basin were performed by OriginPro 8.5 (developed by OriginLab Corporation, Northampton, MA, USA).

3. Results and Discussion

3.1. Operating Status

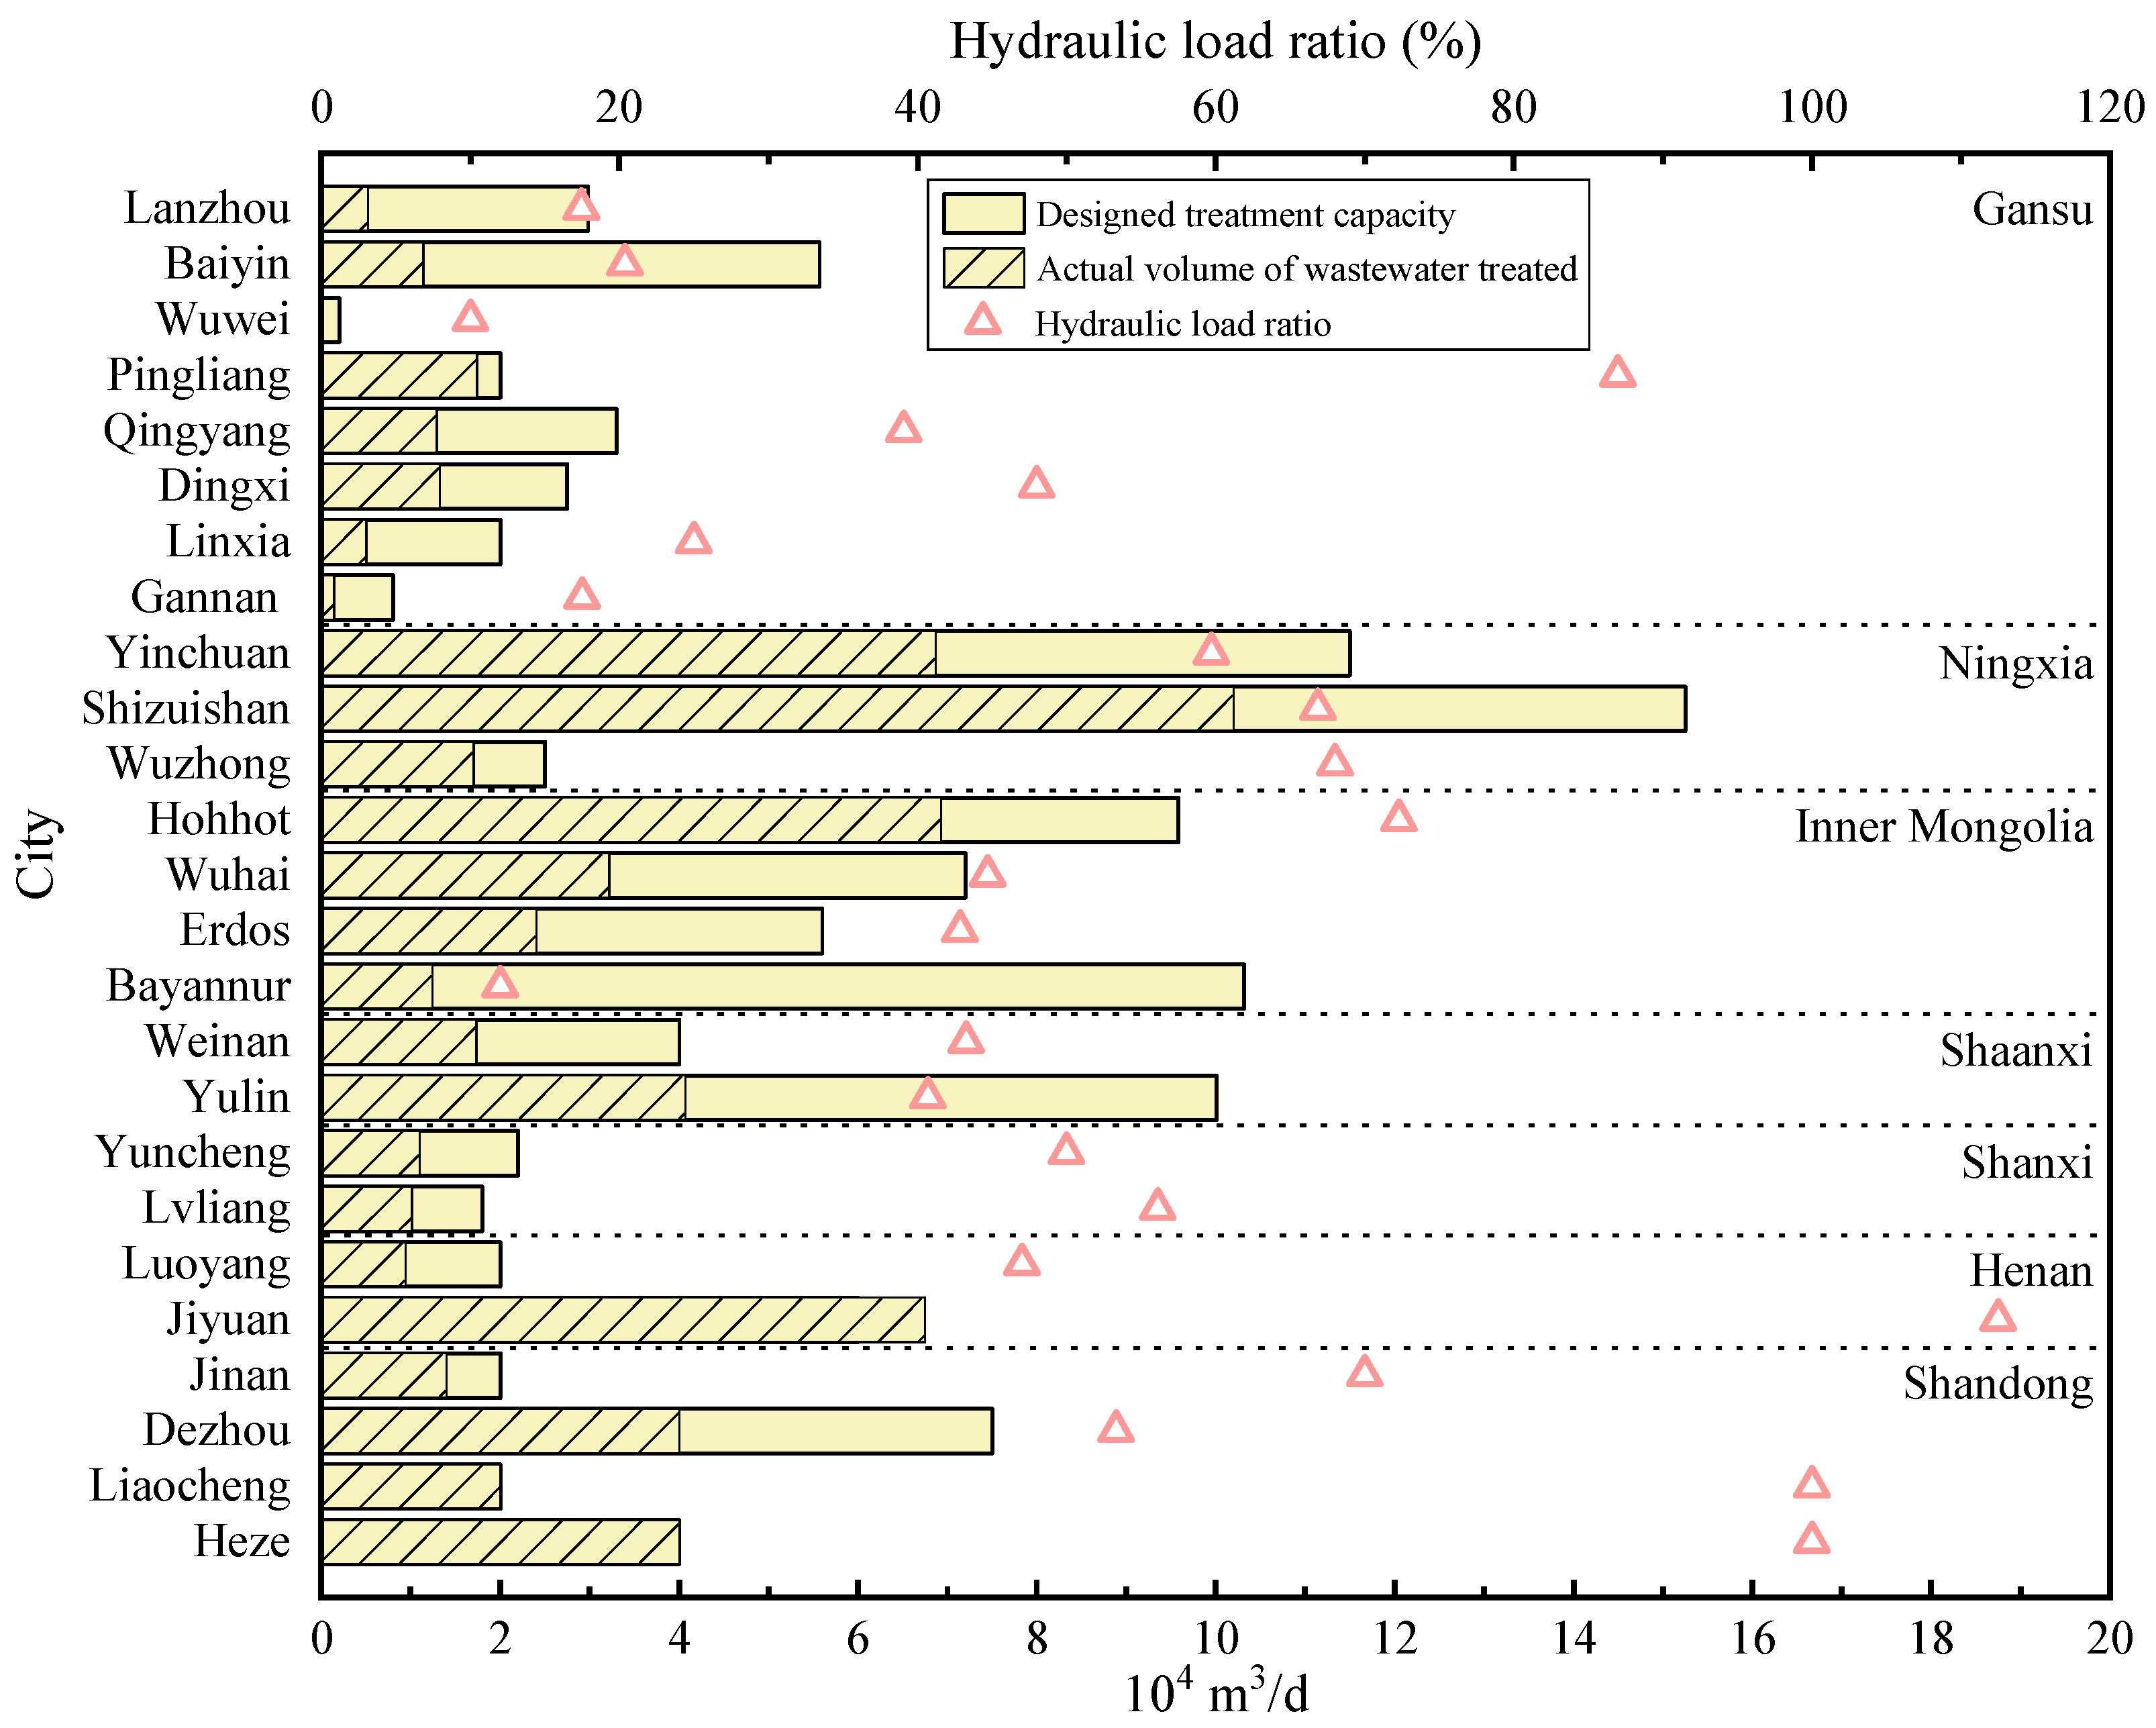
3.1.1. Treatment Capacity of Centralized Industrial WWTPs

The quality of industrial wastewater was characterized by its complexity and significant variations in concentration. Centralized industrial WWTPs, as specialized units dedicated to handling complex industrial wastewater, play a crucial role in industrial wastewater treatment. In 2023, the 63 centralized industrial WWTPs of the major cities in the Yellow River basin had a total designed processing capacity of 123.06 × 10⁴ m3/d, accounting for approximately 4.34% and 5.29%, respectively, in terms of both the number and processing capacity compared to China’s overall statistics on centralized industrial WWTPs. Centralized industrial WWTPs could be divided into five grades according to their processing capacity: ≥10 × 104, 5 × 10⁴~10 × 104, 1 × 10⁴~5 × 10⁴, 0.5 × 10⁴~1 × 10⁴ and <0.5 × 10⁴ m3/d. The distribution of centralized industrial WWTPs in the Yellow River basin is shown in Table 1. The centralized industrial WWTPs in the Yellow River basin were primarily designed with a capacity ranging from 1 × 10⁴ to 5 × 10⁴ m³/d. These facilities constitute 68.25% of the total number of centralized industrial WWTPs and contribute approximately 71.03% to the overall design processing capacity in the Yellow River basin. Only a few of the centralized industrial WWTPs had a capacity greater than 5 × 10⁴ m3/d. These two categories accounted for only 6.35% of the total number in the Yellow River basin but represented a significant portion (24.79%) of the total designed processing capacity. The proportion of centralized industrial WWTPs with a capacity less than 1 × 10⁴ m3/d accounted for 25.40% of the total quantity. However, their designed processing capacity only represented 4.19% of the Yellow River basin’s total.
In different regions, the construction of centralized industrial WWTPs in the upper reaches of the Yellow River basin was relatively well developed, with a total of 43 plants and a combined processing capacity of 81.55 × 10⁴ m3/d. In the middle reaches of the Yellow River basin, there were a total of 11 centralized industrial WWTPs with a combined processing capacity of 18.01 × 10⁴ m3/d. In the lower reaches, there were nine centralized industrial WWTPs with a total processing capacity of 23.5 × 10⁴ m3/d.
The hydraulic loading rate refers to the proportion between the actual volume of wastewater treated and the designed treatment capacity during a specific operational period. It is a fundamental metric that reflects the stable functioning of WWTPs. Figure 2 illustrates the wastewater treatment conditions of the centralized industrial WWTPs in the Yellow River basin. The average hydraulic loading rate of the centralized industrial WWTPs in the Yellow River basin in 2023 was 53.8%. There were significant variations in the hydraulic loading rates among different cities, ranging from 10% to 112.5%. Notably, Jiyuan, Liaocheng and Heze exhibited the highest hydraulic loading rates at 112.5%, 100% and 100%, respectively. Conversely, Wuwei, Bayannur and Lanzhou demonstrated the lowest hydraulic loading rates at 10%, 12.01% and 17.45%, respectively. In terms of geographical distribution, the average hydraulic loading rates of major cities located in the upper, middle and lower reaches of the Yellow River basin were recorded as 43.94%, 48.09% and 81.23%, respectively.
In summary, most centralized industrial WWTPs in the Yellow River basin were small to medium-sized facilities with a processing capacity of less than 5 × 10⁴ m3/d. However, their wastewater collection rates exhibited a relatively low level. Notably, around 95.45% of the centralized industrial WWTPs had a wastewater treatment rate below 90%. The actual water volume treated by the centralized industrial WWTPs fell significantly below its designed capacity, indicating a substantial potential for enhancing wastewater treatment utilization. The load rate of the centralized industrial WWTPs in the lower reaches of the Yellow River basin significantly exceeded that in the middle and upper reaches. The operational capacity of Jiyuan, Liaocheng and Heze’s industrial wastewater treatment plants was either at or over their limits, indicating a pressing need for the further expansion of these facilities.

3.1.2. Wastewater Treatment Process

The predominant treatment processes used in the centralized industrial WWTPs were aerobic and anaerobic biological treatments. In the Yellow River basin, 91.84% of these plants combined two or more of these processes. The continuous advancement of water quality improvement objectives has led to increasingly stringent emission limits for water pollutants, resulting in the growing adoption of advanced treatment processes. Consequently, 36.73% of the centralized industrial WWTPs had implemented advanced treatment processes. The main emphasis of this article is on the analysis of centralized industrial WWTPs that utilize biological treatment systems. In the Yellow River basin, aerobic biological treatment processes were predominantly utilized in a significant proportion (55.1%) of the centralized industrial WWTPs. The primary processes used were the anaerobic–anoxic–oxic (AAO) process, the anaerobic–oxic (AO) process, an oxidation ditch, and the membrane bioreactor (MBR) process.

3.2. Characteristics of Influent Quality

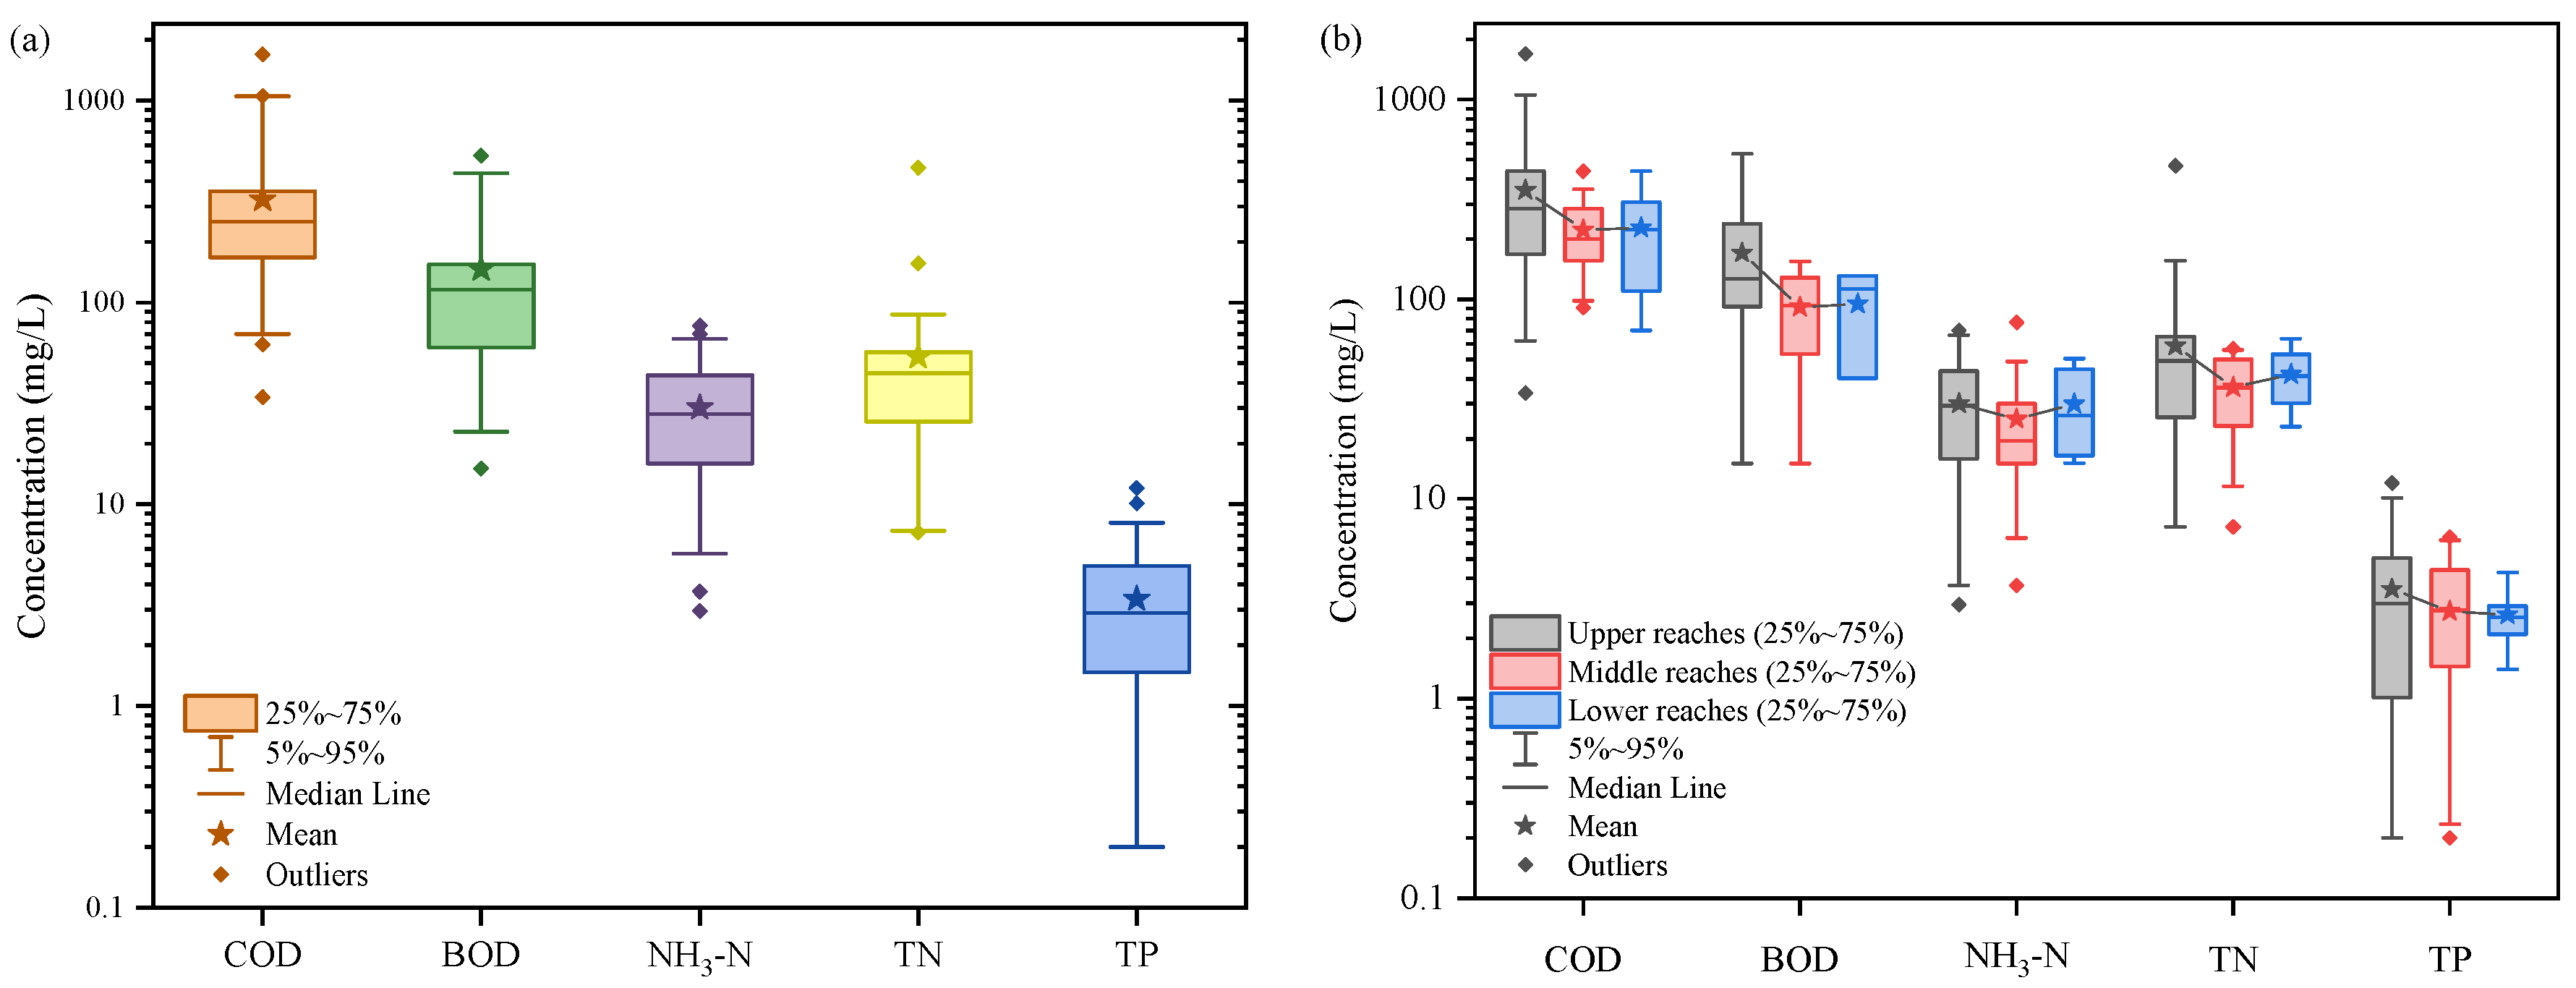
3.2.1. Influent Quality of Industrial, Centralized WWTPs

The concentrations of five basic water quality parameters of the 63 centralized industrial WWTPs in the Yellow River basin are presented in Figure 3a. The average influent COD, BOD, NH3-N, TN and TP concentrations were 323.3, 145.9, 30.2, 53.9 and 3.4 mg/L, respectively, while the median influent COD, BOD, NH3-N, TN and TP concentrations were 252.0, 116.4, 28.1, 44.7 and 2.9 mg/L, respectively. For all the parameters, the average concentration is higher than the median concentration, exhibiting a right-skewed distribution for the influent quality. The 5~95% ranges of the influent COD, BOD, NH3-N, TN and TP concentrations were 70.0~1050.7, 22.9~435, 5.7~66.1, 7.4~87.0 and 0.2~8.1 mg/L, respectively. This considerable fluctuation in water quality fully reflects the complex composition, wide variation, and unpredictable characteristics of industrial wastewater. The 25~75% ranges of the influent COD, BOD, NH3-N, TN and TP concentrations of the centralized industrial WWTPs were 167.4~355.6, 60.0~155.0, 15.9~43.6, 25.7~56.7 and 1.5~5.0 mg/L, respectively. These data indicate that the influent COD and BOD concentrations were relatively low, which might lead to an insufficient carbon source for the biological processes of the WWTPs and consequently inhibit the removal of nitrogen and phosphorus [24]. A possible explanation for the relatively low COD and BOD concentrations is that the studied industrial parks are generally large in scale and have complex industrial structures. The composition of the wastewater produced by enterprises in different industries varies, and after being mixed into the centralized WWTPs, COD and BOD concentrations are likely to decrease due to mutual dilution. Therefore, it is necessary to carry out classified collection through the industry- and quality-based treatment of wastewater in large industrial parks.
The influent water quality of the centralized industrial WWTPs showed regional variations in the Yellow River basin, as illustrated in Figure 3b. Generally, the mean and median concentrations of parameters in the upper reaches (including Gansu, Ningxia and Inner Mongolia) were marginally higher than those in the middle reaches (including Shaanxi and Shanxi) and the lower reaches (including Henan and Shandong), likely attributable to the heightened industrial activity in the region. This increased industrialization also correlates with the greater volume of data for the upper reaches, resulting in a wider range of variation in the pollutant concentrations.

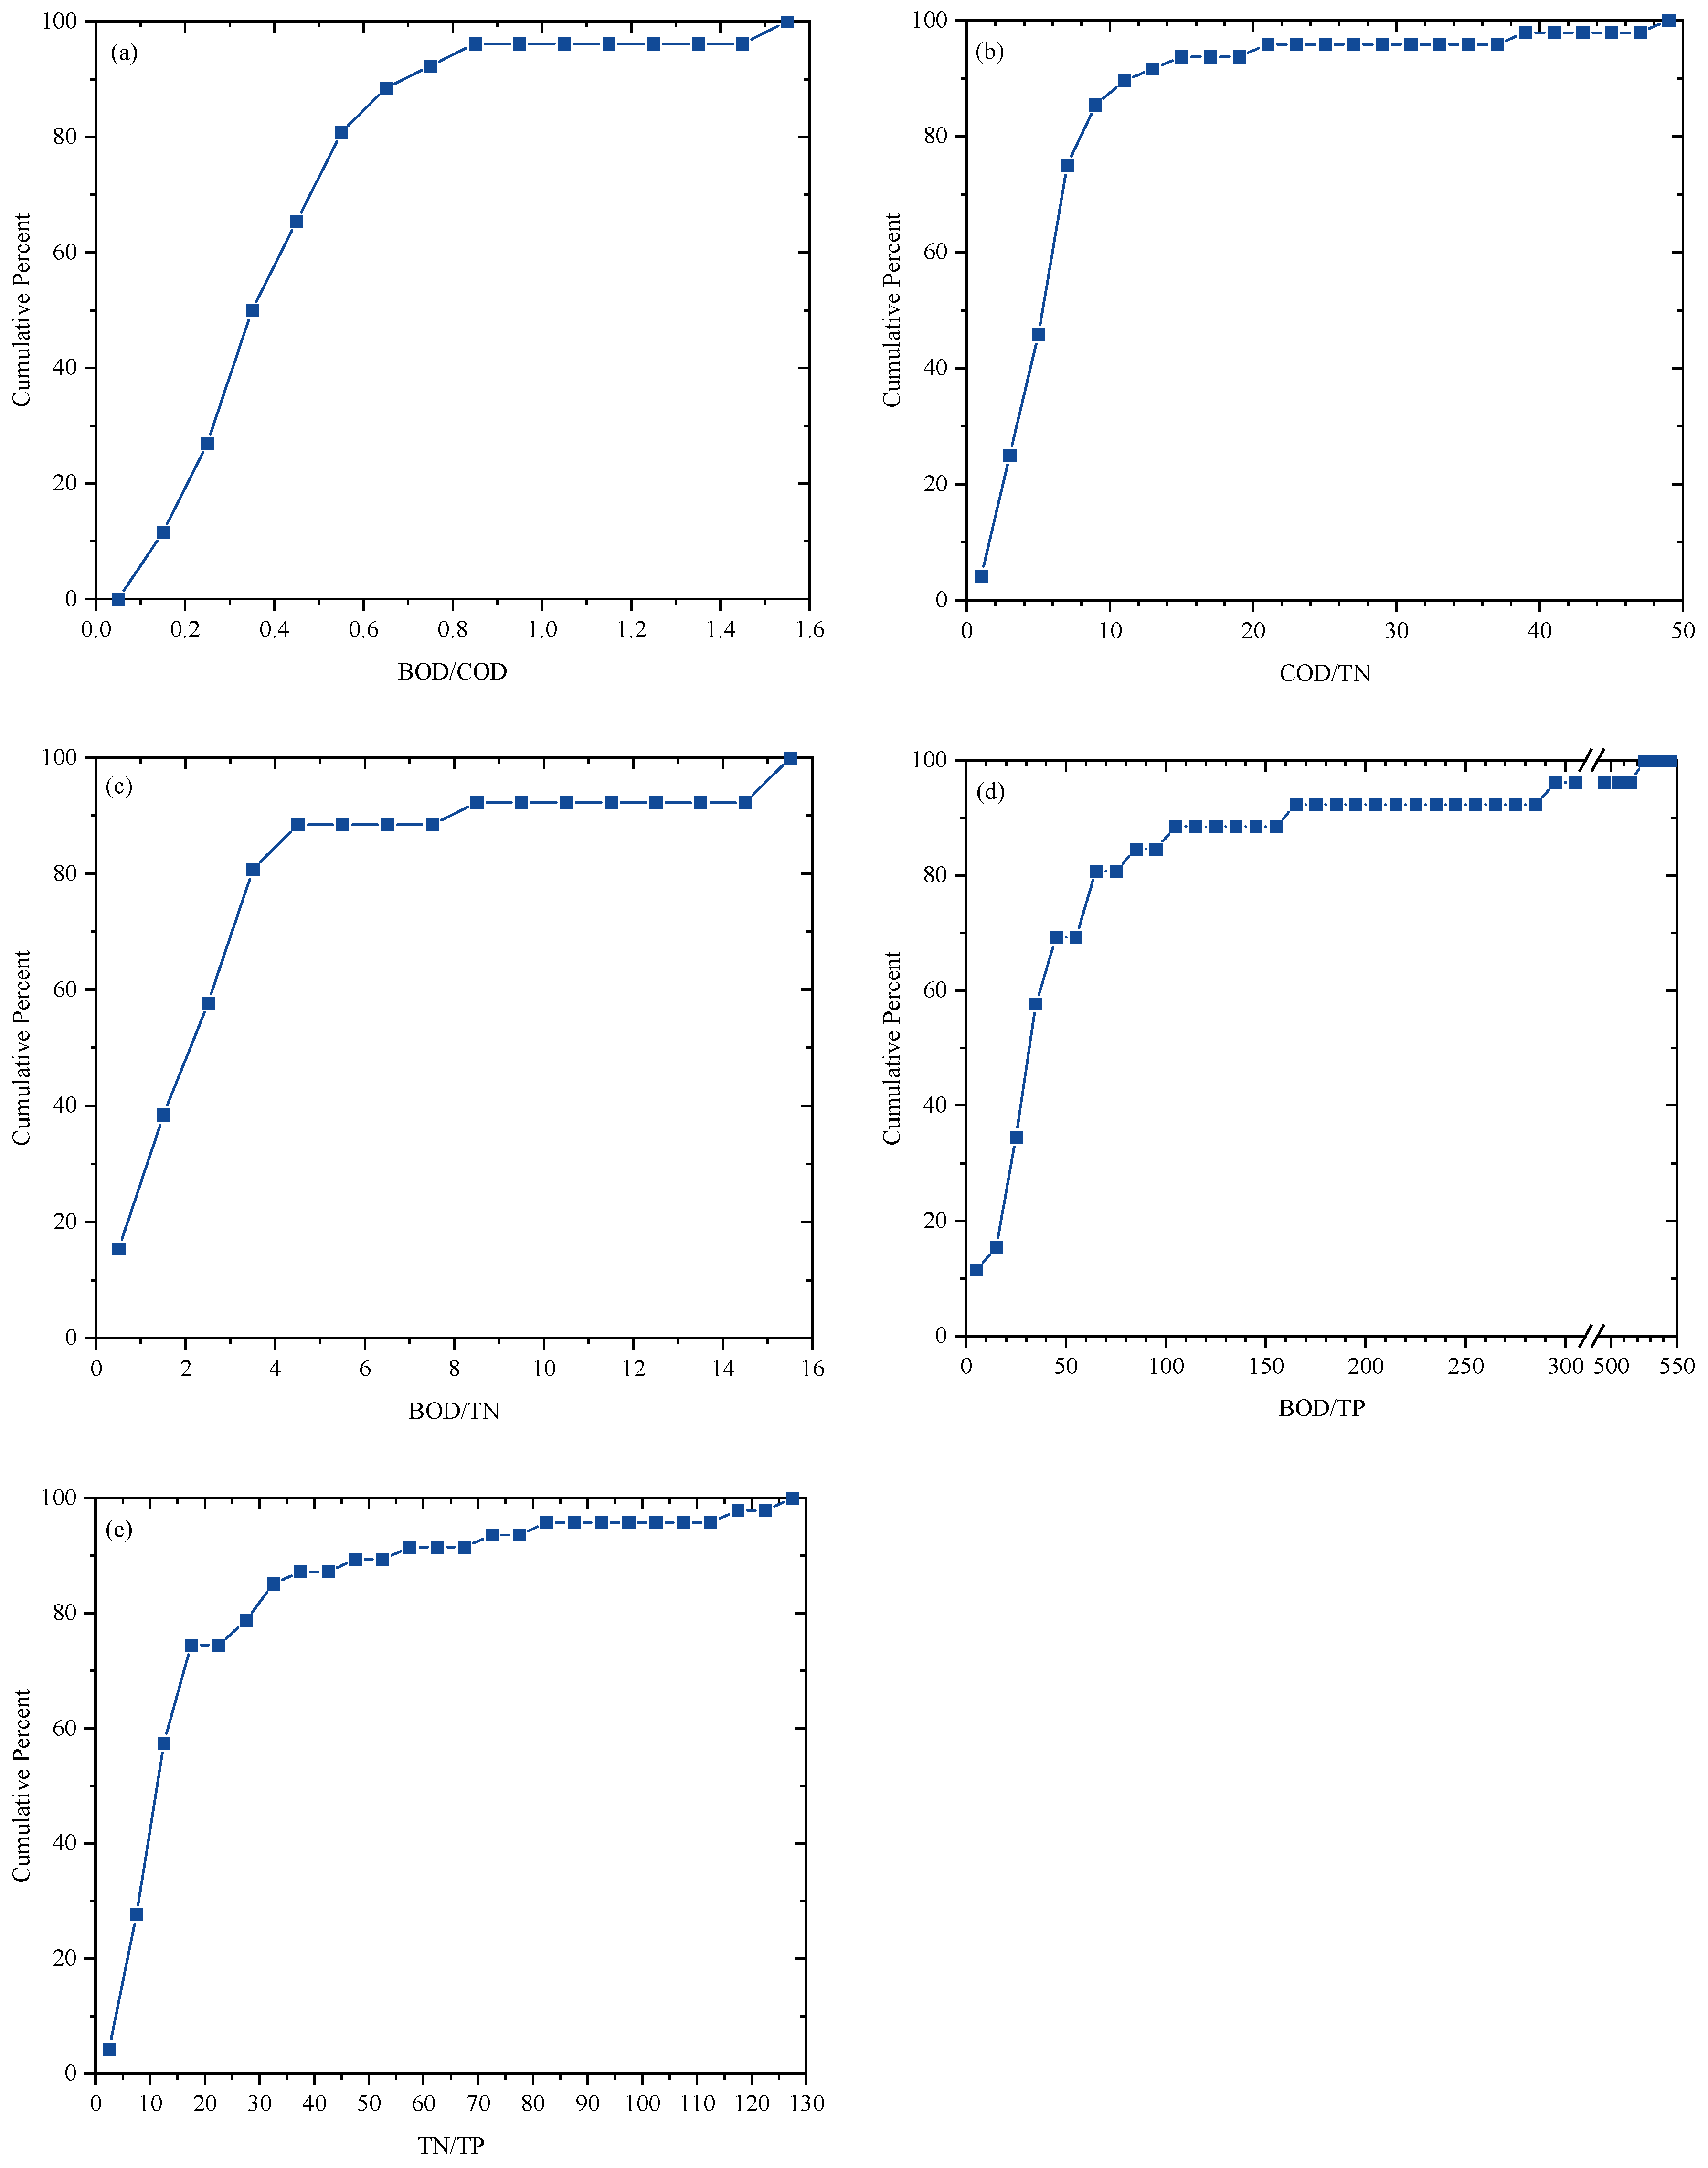
3.2.2. Ratios of Water Quality Parameters

The ratios of different water quality parameters of the centralized industrial WWTPs in the Yellow River basin were calculated, and the analyzed results are shown in Figure 4.
The BOD/COD ratio can reflect the biodegradability of sewage. When the BOD/COD ratio is between 0.4 and 0.6, the biodegradability of the wastewater is considered good, and lower values indicate that the wastewater is poorly biodegradable [25]. The BOD/COD ratio of the WWTPs fluctuates between 0.1 and 1.6, with an average value of 0.5 and a medium value of 0.4, which means that 50% of the influent of the WWTPs was not favorable for biological treatment (Figure 4a). The overall biodegradability of the influent was poor as the studied industrial parks are mainly focused on chemical, metallurgical, pharmaceutical and other industries, which usually produce non-degradable or refractory organic pollutants.
COD represents a constraining factor in the process of denitrification. Effective denitrification can be achieved when the influent COD/TN ratio falls between 8 and 12, and if the COD/TN ratio is too low, the carbon source is considered insufficient and additional supplementation is required [26]. As shown in Figure 4b, the COD/TN ratio ranges from 0.6 to 49.4; however, 75% of the WWTPs showed values lower than 8, revealing that insufficient carbon sources are a vital problem for centralized industrial wastewater treatment. In fact, 37 of the 63 centralized industrial WWTPs surveyed in this study have been using additional carbon sources to effectively remove nitrogen and phosphorus from wastewater, resulting in a total additional carbon source consumption of 17,372.5 ton per year.
The BOD/TN ratio can also reflect whether there is enough organic matter in the wastewater influent for the efficient removal of TN. The carbon source is considered adequate when BOD/TN > 4 [27]. Figure 4c shows that the range of the BOD/TN ratio is 0.8~15.8, the average value is 2.7, and the median value is 3.7. Similar to COD, 80.8% of the BOD/TN ratios for the WWTPs were below four, once again proving the lack of carbon sources in the wastewater from the industrial parks in the Yellow River basin.
The BOD/TP ratio can be used to assess the feasibility of biological phosphorus removal. Generally, a BOD/TP ratio greater than 20 ensures good phosphorus removal efficiency [28]. As presented in Figure 4d, the BOD/TP ratio varies significantly from 8.9 to 529.4, with an average value of 63.9 and a medium value of 32.0. Only 15.4% of WWTPs exhibited a BOD/TP ratio less than 20, indicating that phosphorus could be effectively removed during biotreatment.
From Figure 4e, the centralized industrial WWTPs had a TN/TP ratio between 3.0 and 126.6. The balance of C, N and P in the influent is the key to effective biological treatment processes. It is generally believed that when the BOD/TN/TP ratio is between 100:5:1 and 100:10:1, an aerobic process is the most efficient, and when the BOD/TN/TP ratio is 250:5:1, an anaerobic process is the most efficient [26]. In this study, the TN/TP ratio of 72.3% of the WWTPs exceeded 10, which did not meet the optimum conditions for microbial growth.
Overall, the centralized industrial WWTPs in the Yellow River basin exhibit challenges, including low concentrations of COD and BOD, limited biodegradability and imbalanced compositions of C, N and P in their wastewater influent, all of which hinder the effect of the biological treatment process. Pretreatment techniques to improve biodegradability and additional carbon sources are essential, but substantial carbon source consumption not only diverges from the objectives outlined in the Global Sustainable Development Goals but also amplifies the financial strain of operational costs.

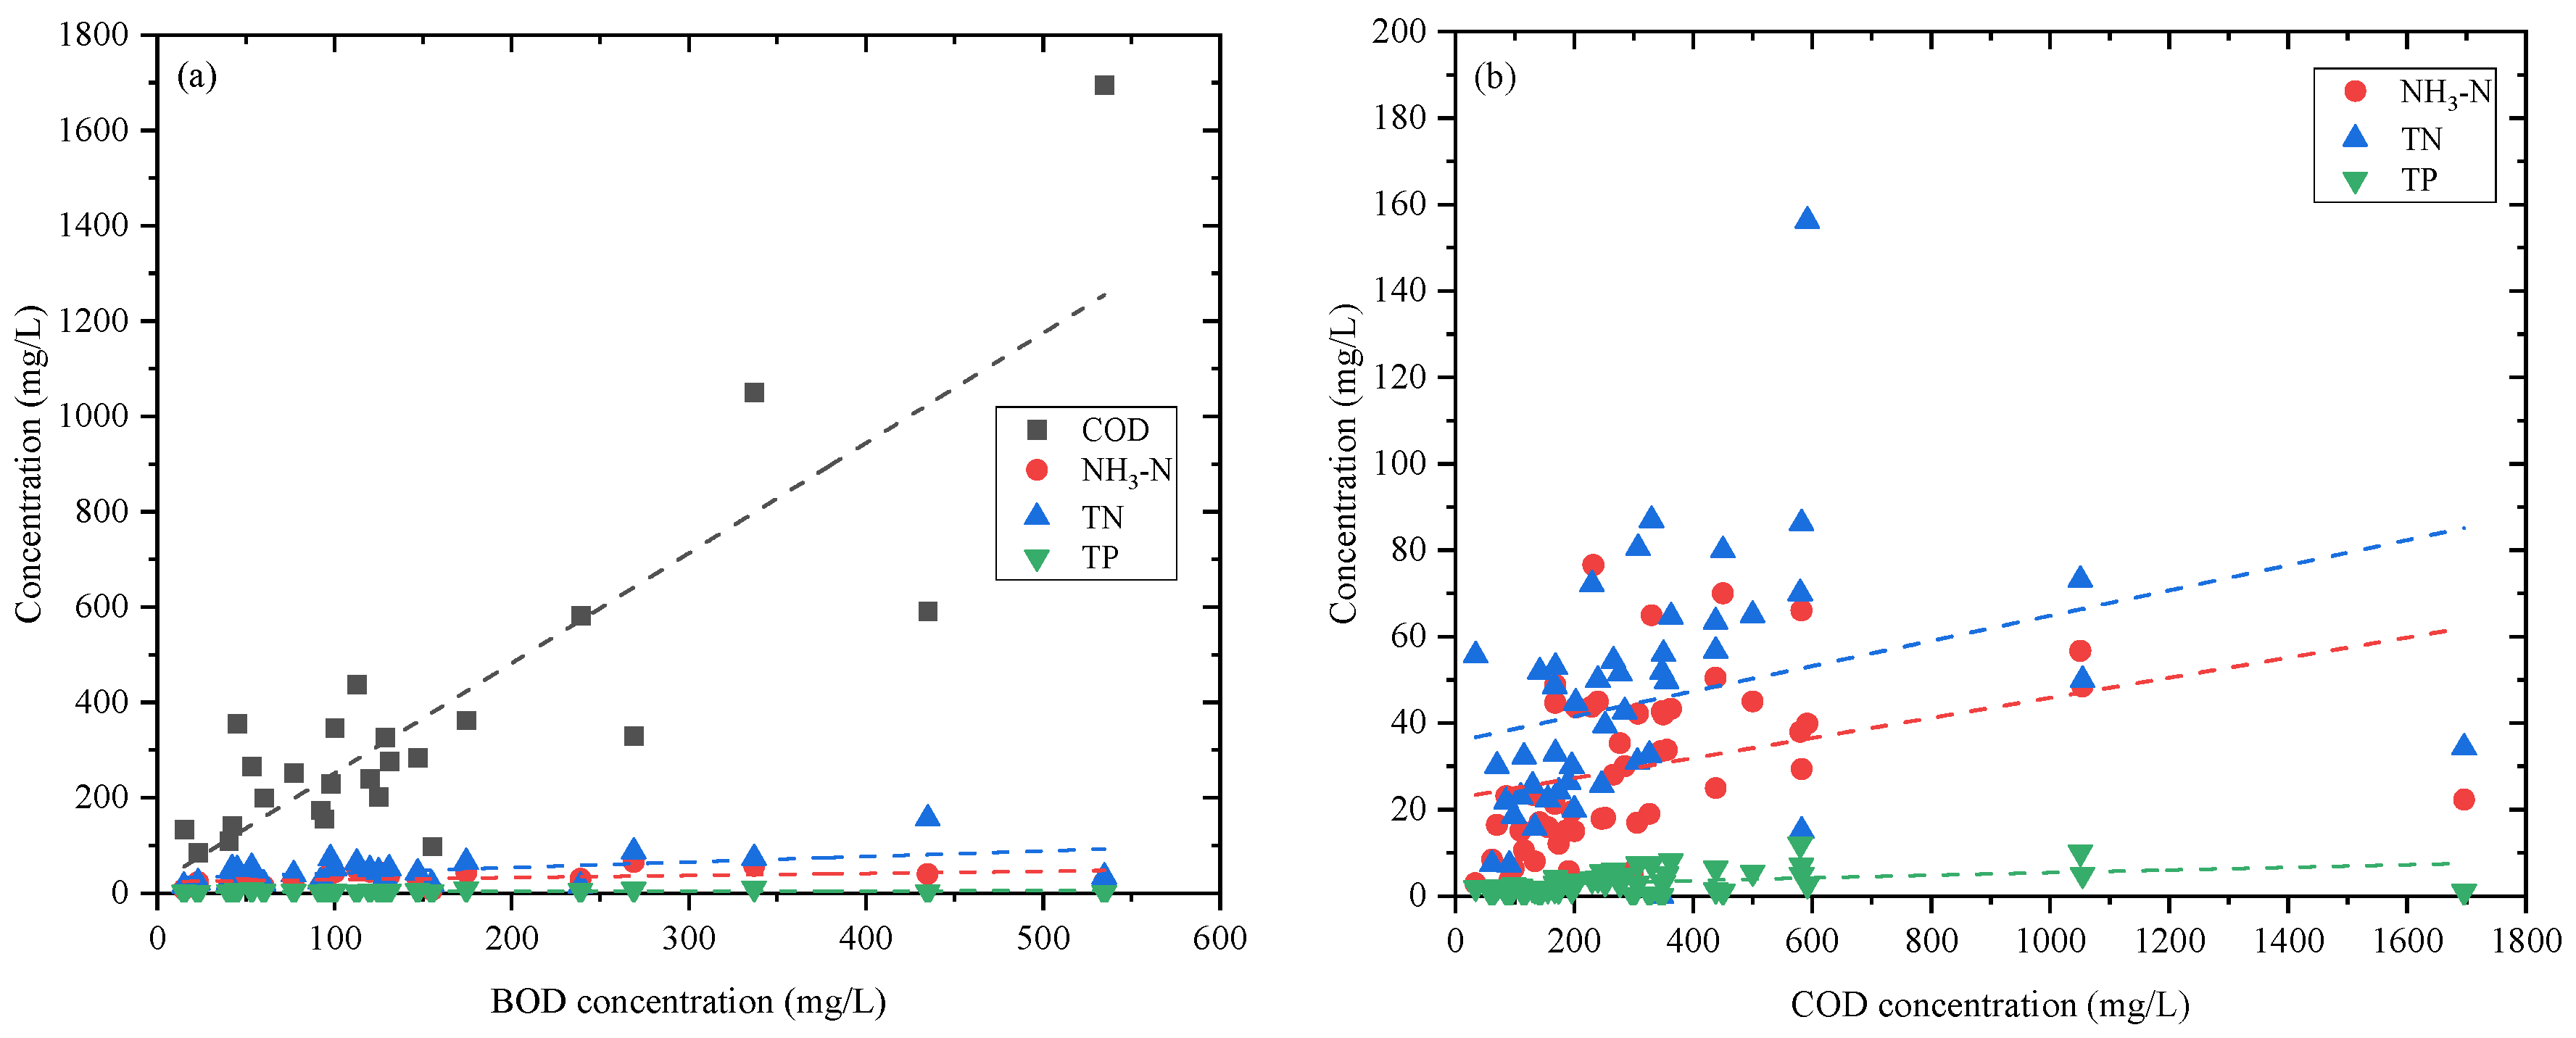
3.2.3. Correlation of Influent Water Quality Parameters

Based on the influent levels of BOD, COD, NH3-N, TN and TP in the centralized industrial wastewater treatment plants (WWTPs) within the Yellow River basin, a linear regression analysis was conducted using the least squares method. The relationships among these water quality parameters, along with the corresponding regression equations and correlation coefficients (R2), are presented in Figure 5 and Table 2. Figure 5a demonstrates a significant linear correlation between BOD and COD (R2 = 0.73118), while the associations between NH3-N (R2 = 0.12457) and TN (R2 = 0.24157) are moderate. In contrast, no linear correlation is observed between BOD and TP (R2 = 0.05991). The correlation analysis of COD and BOD reveals a proportional relationship, where the COD concentration increases with rising BOD levels. Figure 5b illustrates weak linear relationships between COD and NH3-N (R2 = 0.1309), TN (R2 = 0.10026), and TP (R2 = 0.11159), respectively. Additionally, Figure 5c demonstrates a clear correlation between NH3-N and TN (R2 = 0.426), underscoring the necessity of controlling influent NH3-N and enhancing nitrification and denitrification efficiency to achieve effective total nitrogen removal in WWTPs. A general linear relationship is found between NH3-N and TP (R2 = 0.26939) as well as TN and TP (R2 = 0.22071) from Figure 5c,d. Thus, maintaining appropriate nitrogen and phosphorus levels is crucial for the efficient removal of pollutants.

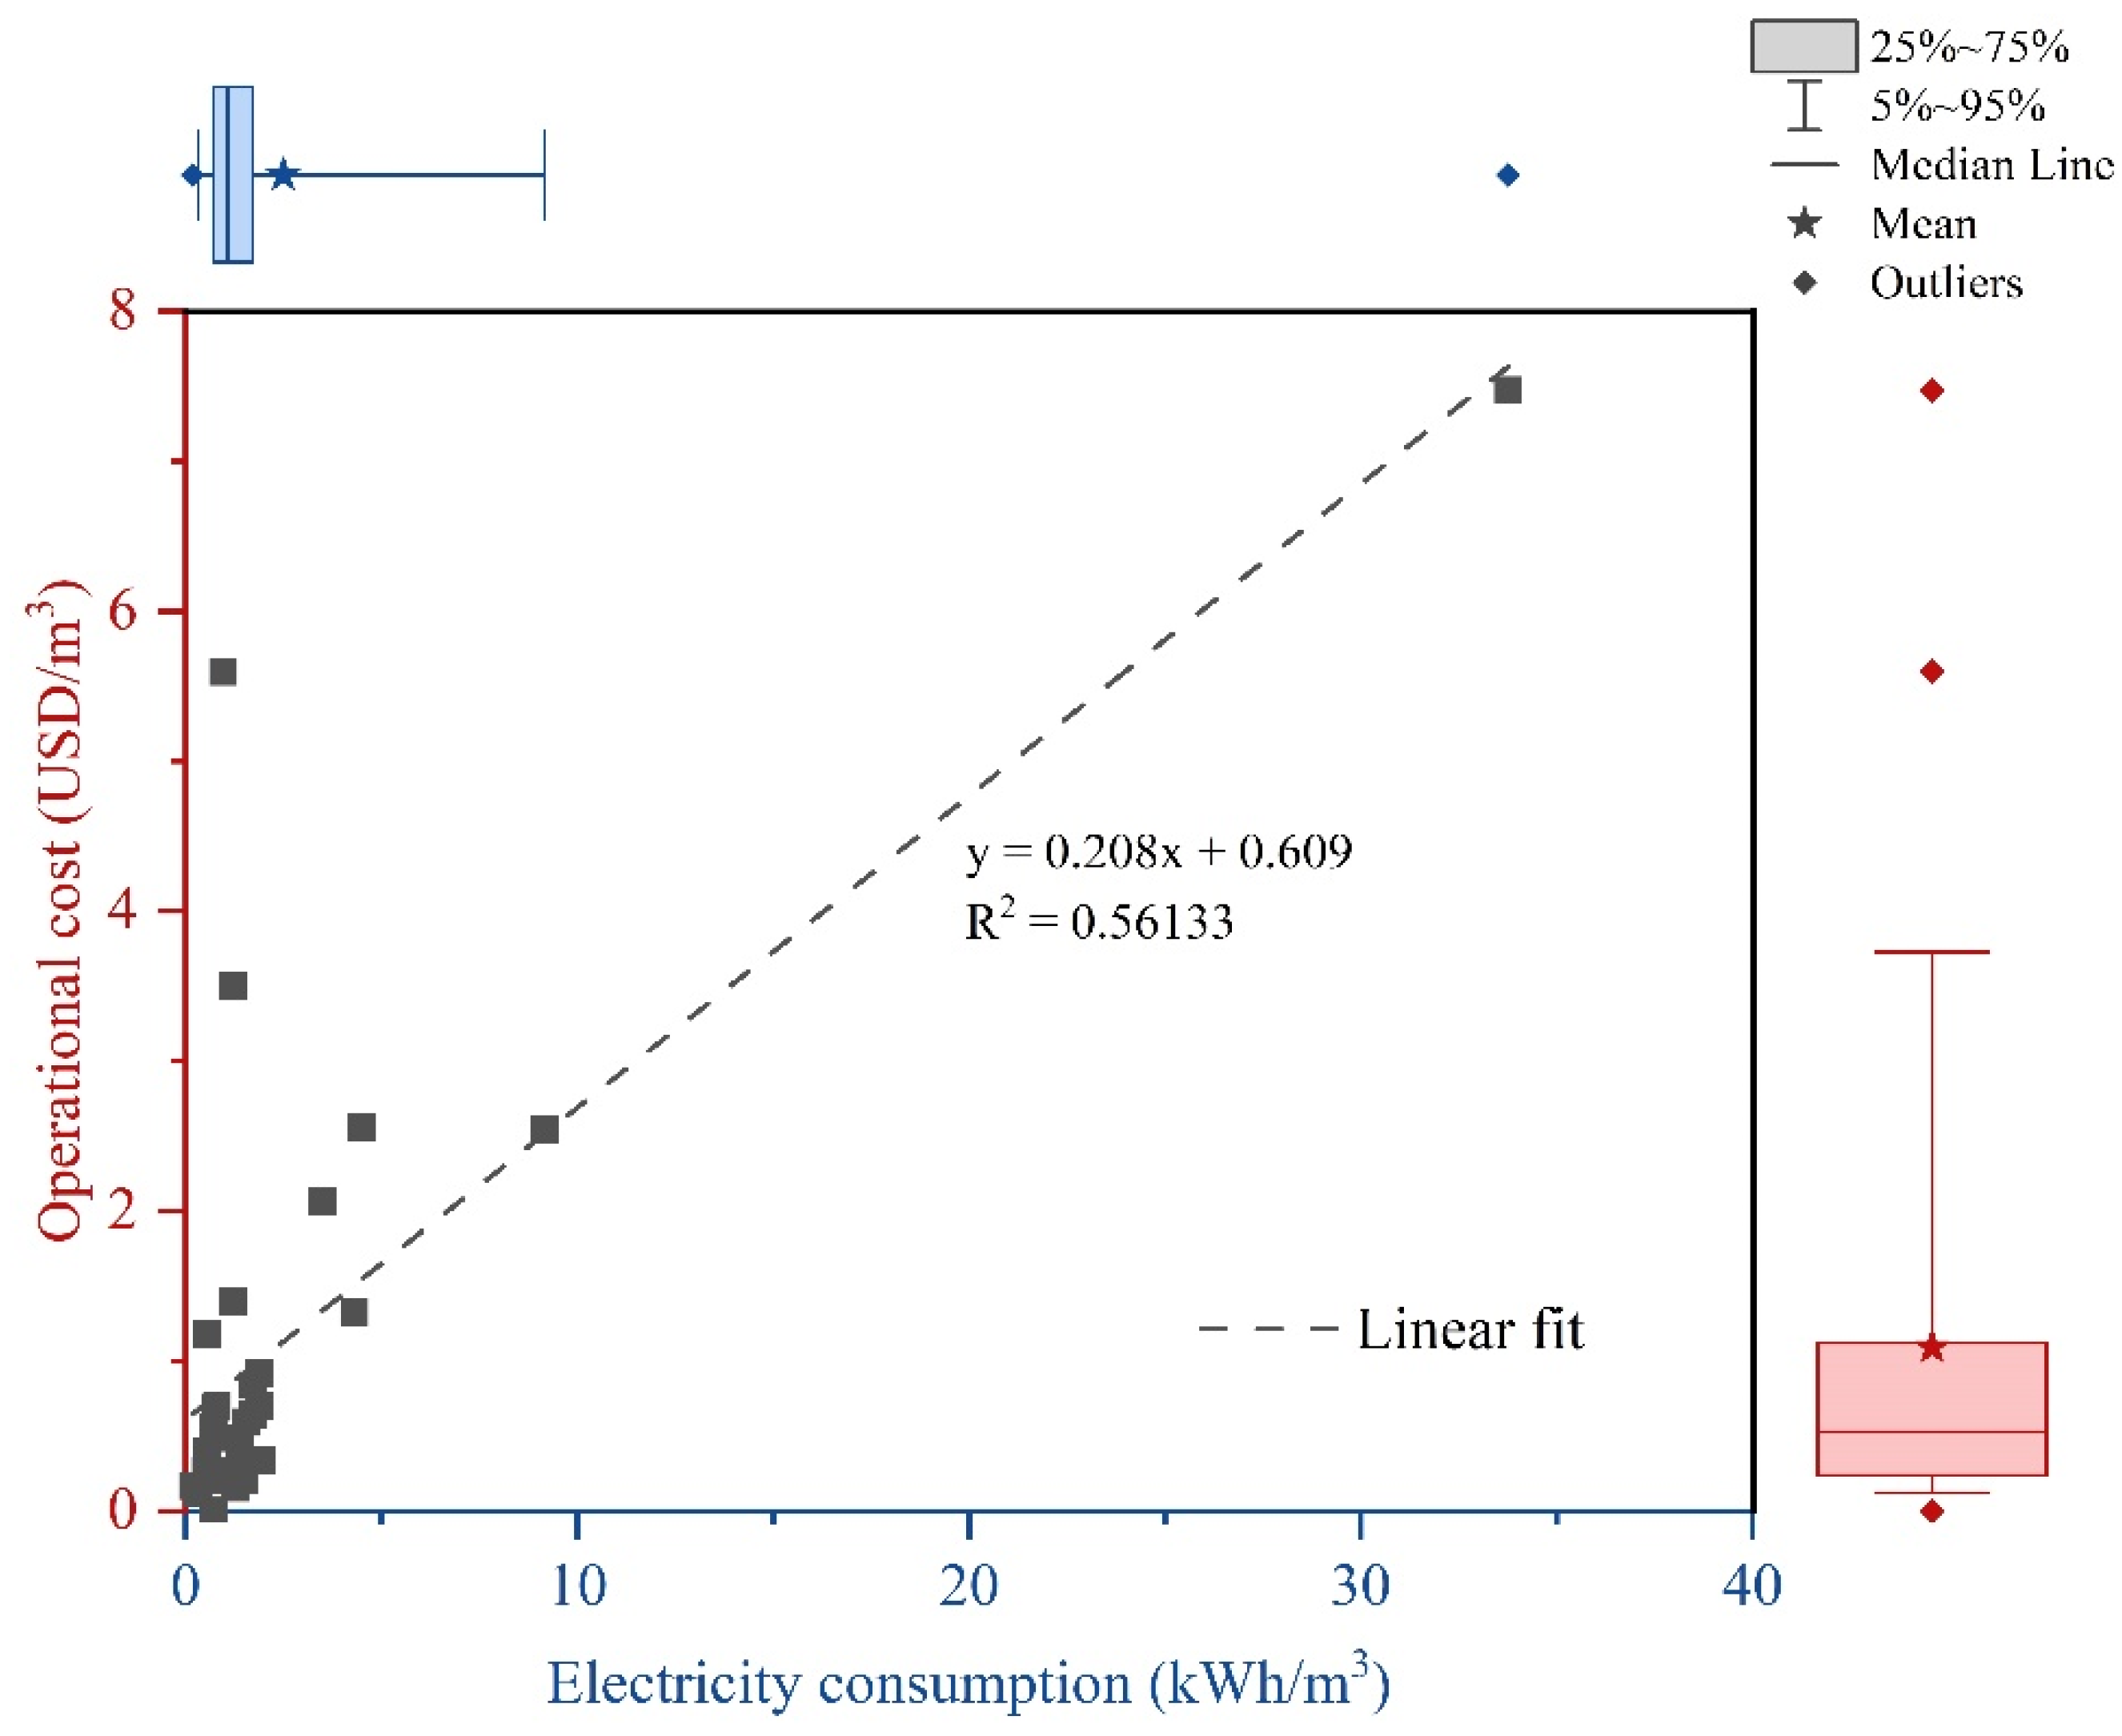
3.3. Energy Consumption and Operational Cost

The statistical results for energy consumption, operational costs and their correlation in the centralized industrial WWTPs in the Yellow River basin are presented in Figure 6. The energy consumption of the WWTPs primarily comprises electricity consumption and fuel energy consumption, with electricity consumption constituting the largest share. The carbon emissions resulting from the wastewater treatment process represent approximately 1~2% of China’s total carbon emissions [29]. A narrow distribution of electricity consumption is observed in Figure 6; the 25~75% range of energy consumption is 0.7~1.1 kWh/m3, while the average and median values are 1.1 and 2.5 kWh/m3, respectively. In 2020, the national median electricity consumption for municipal WWTPs was 0.36 kWh/m3, while the median electricity consumption for municipal WWTPs in major cities within the Yellow River basin varied from 0.26 to 1.11 kWh/m3, with approximately 66.8% of the WWTPs in the Yellow River basin exceeding the national median value [30]. The intricate composition of pollutants and the limited biodegradability of industrial wastewater necessitate the utilization of additional treatment units, particularly certain physicochemical technologies that consume more energy compared to biotreatment methods, in centralized industrial WWTPs. Consequently, it is understandable that their energy consumption surpasses that of municipal WWTPs. Moreover, the relatively low influent COD concentration also contributes to the high energy consumption to a certain extent. Nevertheless, the general operational energy consumption of industrial WWTPs in the Yellow River basin remains on the high side, indicating potential for optimization and enhancement. To reduce energy consumption, measures such as adopting energy-efficient technologies, optimizing treatment processes and investing in renewable energy sources can be implemented.
Electricity consumption not only stands out as a significant contributor to carbon emissions in WWTPs but also substantially contributes to the operational costs of these facilities. As shown in Figure 6, the 25~75% range of operational costs is 0.2~1.1 USD/m3, while the average and median values are 1.1 and 0.5 USD/m3, respectively. An apparent linear correlation between the operational cost and the electricity consumption was obtained, with R2 = 0.56133, further confirming that electricity consumption contributes significantly to operational costs. Thus, it is imperative to take effective measures such as improving the influent water quality and optimizing the treatment process to save energy and reduce the cost of the centralized industrial WWTPs in the Yellow River basin.

4. Conclusions

The scales of the centralized WWTPs of industrial parks in the Yellow River basin were generally small, mainly ranging from 1 × 10⁴ to 5 × 10⁴ m3/d, and the average hydraulic loading rate of the 63 WWTPs was 53.81%, surpassing the national average level. The hydraulic loading rate demonstrated a certain scale effect. However, there was a noticeable regional disparity in the development of wastewater treatment facilities, with slower progress in the construction of facilities in the upper and middle reaches. Both the treatment capacity and collection rate of wastewater require further enhancement. Aerobic biological treatment processes dominated in the Yellow River basin, with their usage accounting for 55.1% of the all plants. The predominant processes include the AAO, AO, oxidation ditch and MBR processes.
The influent pollutant concentrations of the centralized industrial WWTPs in the Yellow River basin displayed a positively skewed distribution overall. The substantial fluctuation in water quality indices, coupled with challenges such as poor biodegradability, insufficient carbon sources and imbalanced nitrogen-to-phosphorus ratios, warrants particular attention. Consequently, emphasis should be placed on controlling the influent water quality during forthcoming upgrades and renovations. Furthermore, the energy consumption of the centralized industrial WWTPs in the Yellow River basin exceeded the national median value. Optimizing the operation of these plants is important to enhance their operational stability and efficiency.
This study only conducted an overall analysis of the water quality characteristics of centralized WWTPs operating in major industrial parks in the Yellow River basin. Given the limitations in data acquisition, it is recommended that subsequent studies continue to enhance the analysis of industrial parks with different water treatment processes and various effluent discharge standard limits, thereby helping to improve the stability of effluent water quality from centralized industrial wastewater treatment facilities.

Author Contributions

Conceptualization, Y.W.; data curation, M.X.; formal analysis, Y.Y. (Yue Yuan) and M.X.; funding acquisition, H.W.; investigation, H.W. and Y.S.; methodology, H.X.; project administration, H.W.; resources, H.W.; software, Y.Y. (Yin Yu); supervision, H.X.; validation, M.X.; visualization, Y.Y. (Yue Yuan) and M.X.; writing—original draft, Y.W.; writing—review and editing, M.X. and Y.Y. (Yin Yu). All authors will be informed about each step of manuscript processing, including submission, revision, revision reminder, etc., via emails from our system or the assigned Assistant Editor. All authors have read and agreed to the published version of the manuscript.

Funding

This research was funded by the Joint Research Program for Ecological Conservation and High-Quality Development of the Yellow River Basin, China (No. 2022-YRUC-01-0405).

Data Availability Statement

The data are not publicly available due to confidentiality agreement.

Conflicts of Interest

The authors declare no conflicts of interest.

References

  1. Eliasson, J. The rising pressure of global water shortages. Nature 2015, 517, 6. [Google Scholar] [CrossRef]
  2. Zhang, Q.; Xu, C.Y.; Yang, T. Variability of water resource in the Yellow River basin of past 50 years, China. Water Resour. Manag. 2009, 23, 1157–1170. [Google Scholar] [CrossRef]
  3. Chen, Y.; Fu, B.; Zhao, Y.; Wang, K.; Zhao, M.M.; Ma, J.; Wu, J.; Xu, C.; Liu, W.; Wang, H. Sustainable development in the Yellow River Basin: Issues and strategies. J. Clean. Prod. 2020, 263, 121223. [Google Scholar] [CrossRef]
  4. Liu, J.; Zang, C.; Tian, S.; Liu, J.; Yang, H.; Jia, S.; You, L.; Liu, B.; Zhang, M. Water conservancy projects in China: Achievements, challenges and way forward. Glob. Environ. Chang. 2013, 23, 633–643. [Google Scholar] [CrossRef]
  5. Central Committee of the Communist Party of China and the State Council. Outline of Ecological Protection and High-Quality Development Plan for the Yellow River Basin (China State Council Publication No. ADM 30-1749). Available online: https://www.gov.cn/gongbao/content/2021/content_5647346.htm (accessed on 20 February 2024).
  6. Lu, D.; Sun, D. Development and management tasks of the Yellow River Basin: A preliminary understanding and suggestion. Acta Geogr. Sin. 2019, 74, 2431–2436. [Google Scholar]
  7. Hu, J.; Liu, Y.; Fang, J.; Jing, Y.; Liu, Y.; Liu, Y. Characterizing pollution-intensive industry transfers in China from 2007 to 2016 using land use data. J. Clean. Prod. 2019, 223, 424–435. [Google Scholar] [CrossRef]
  8. Yang, X.; Feng, Z.; Chen, Y. Evaluation and obstacle analysis of high-quality development in Yellow River Basin and Yangtze River Economic Belt, China. Humanit. Soc. Sci. Commun. 2023, 10, 757. [Google Scholar] [CrossRef]
  9. Chen, Y.; Zhu, M.; Lu, J.; Zhou, Q.; Ma, W. Evaluation of ecological city and analysis of obstacle factors under the background of high-quality development: Taking cities in the Yellow River Basin as examples. Ecol. Indic. 2020, 118, 106771. [Google Scholar] [CrossRef]
  10. Feng, Z.; Chen, Y.; Yang, X. Measurement of Spatio-Temporal Differences and Analysis of the Obstacles to High-Quality Development in the Yellow River Basin, China. Sustainability 2022, 14, 14179. [Google Scholar] [CrossRef]
  11. Wang, H.; Ma, T. Optimal water resource allocation considering virtual water trade in the Yellow River Basin. Sci. Rep. 2024, 14, 79. [Google Scholar] [CrossRef]
  12. Engelman, R.; LeRoy, P. Sustaining Water: Population and Future of Renewable Water Supplies; Population Action International: Washington, DC, USA, 1993; Volume 23, p. 296. [Google Scholar]
  13. Ministry of Water Resources of the People’s Republic of China. China Water Resource Bulletin. 2020. Available online: http://dsgl.mwr.gov.cn/dszs/202212/P020221228567515805249.pdf (accessed on 20 February 2024).
  14. Sun, J.; Wang, X.; Shahid, S.; Yin, Y.; Li, E. Spatiotemporal changes in water consumption structure of the Yellow River Basin, China. Phys. Chem. Earth 2022, 126, 103112. [Google Scholar] [CrossRef]
  15. Ministry of Ecology and Environment of the People’s Republic of China. China Ecological Environment Status Bulletin. 2022. Available online: https://www.mee.gov.cn/hjzl/sthjzk/zghjzkgb/202305/P020230529570623593284.pdf (accessed on 20 February 2024).
  16. Sakr, D.; Baas, L.; El-Haggar, S.; Huisingh, D. Critical success and limiting factors for eco-industrial parks: Global trends and Egyptian context. J. Clean. Prod. 2011, 19, 1158–1169. [Google Scholar] [CrossRef]
  17. National Development and Reform Commission, China. Audit Notice Catalogue of Chinese Development Zones. 2018. Available online: https://www.ndrc.gov.cn/fggz/lywzjw/zcfg/201803/t20180302_1047056.html (accessed on 20 February 2024).
  18. Chertow, M.R. Industrial symbiosis: Literature and taxonomy. Annu. Rev. Energy Environ. 2000, 25, 313–337. [Google Scholar] [CrossRef]
  19. Tian, J.; Liu, W.; Lai, B.; Li, X.; Chen, L. Study of the performance of eco-industrial park development in China. J. Clean. Prod. 2014, 64, 486–494. [Google Scholar] [CrossRef]
  20. Liu, J.; Liu, T.; Su, Y.; Wang, J.; Chen, M. Analysis on operation and water quality characteristics of industrial wastewater treatment plants in China. Water Wastewater Eng. 2021, 47, 92–96, 103. [Google Scholar]
  21. Kuok, K.K.; Chiu, P.C.; Rahman, M.R.; Bakri, M.K.B.; Chin, M.Y. Effectiveness of centralized wastewater treatment plant in removing emerging contaminants: A case study at Kuching, Malaysia. J. Water Resour. Prot. 2022, 14, 650–663. [Google Scholar] [CrossRef]
  22. Wang, H.; Qi, T.; Qiao, X.; Li, X.; Ding, S.; Liu, Y. Method for ensuring the safety and effectiveness of wastewater treatment under centralized treatment mode by using a petrochemical park as case study. J. Water Process Eng. 2023, 56, 104421. [Google Scholar] [CrossRef]
  23. Liu, H.; Wang, H.; Zhou, X.; Fan, J.; Liu, Y.; Yang, Y. A comprehensive index for evaluating and enhancing effective wastewater treatment in two industrial parks in China. J. Clean. Prod. 2019, 230, 854–861. [Google Scholar] [CrossRef]
  24. Zhao, W.; Wang, M.; Li, J.; Huang, Y.; Li, B.; Pan, C.; Li, X.; Peng, Y. Optimization of denitrifying phosphorus removal in a predenitrification anaerobic/anoxic/post-aeration + nitrification sequence batch reactor (pre-A2NSBR) system: Nitrate recycling, carbon/nitrogen ratio and carbon source type. Front. Environ. Sci. Eng. 2018, 12, 8. [Google Scholar] [CrossRef]
  25. Zhang, B.; Ning, D.; Yang, Y.; Van Nostrand, J.D.; Zhou, J.; Wen, X. Biodegradability of wastewater determines microbial assembly mechanisms in full-scale wastewater treatment plants. Water Res. 2020, 169, 115276. [Google Scholar] [CrossRef]
  26. Zhou, J.; Wang, Y.N.; Zhang, W.; Shi, B. Nutrient balance in aerobic biological treatment of tannery wastewater. J. Am. Leather Chem. Assoc. 2014, 109, 154–160. [Google Scholar]
  27. Ding, S.Z.; Bao, P.; Bo, W.; Zhang, Q.; Peng, Y.Z. Long-term stable simultaneous partial nitrification, anammox and denitrification (SNAD) process treating real domestic sewage using suspended activated sludge. Chem. Eng. J. 2018, 339, 180–188. [Google Scholar] [CrossRef]
  28. Zou, L.; Li, H.; Wang, S.; Zheng, K.; Wang, Y.; Du, G.; Li, J. Characteristic and correlation analysis of influent and energy consumption of wastewater treatment plants in Taihu Basin. Front. Environ. Sci. Eng. 2019, 13, 83. [Google Scholar] [CrossRef]
  29. Yan, P.; Shi, H.X.; Chen, Y.P.; Gao, X.; Fang, F.; Guo, J.S. Optimization of recovery and utilization pathway of chemical energy from wastewater pollutants by a net-zero energy wastewater treatment model. Renew. Sustain. Energy Rev. 2020, 133, 110160. [Google Scholar] [CrossRef]
  30. Xu, A.; Wu, Y.; Chen, Z.; Hao, S.; Hu, H. Analysis of the current situation of construction and operation of municipal wastewater treatment plants in the Yellow River basin. Water Wastewater Eng. 2022, 48, 27–36. [Google Scholar]
Figure 1. Map of geographical locations of 54 industrial parks in the Yellow River basin.
Water 16 00806 g001
Figure 2. Wastewater treatment status of centralized industrial WWTPs in the Yellow River basin.
Water 16 00806 g002
Figure 3. Wastewater influent quality of centralized industrial WWTPs: (a) in the Yellow River basin and (b) in the upper, middle and lower reaches.
Water 16 00806 g003
Figure 4. Ratios of water quality parameters of centralized industrial WWTPs in the Yellow River basin. (a) BOD/COD; (b) COD/TN; (c) BOD/TN; (d) BOD/TP; and (e) TN/TP.
Water 16 00806 g004
Figure 5. Relevance of influent water quality parameters: (a) BOD; (b) COD; (c) NH3-N; and (d) TN.
Water 16 00806 g005aWater 16 00806 g005b
Figure 6. Energy consumption, operational cost and their correlation in centralized industrial WWTPs in the Yellow River basin.
Water 16 00806 g006
Table 1. The number and treatment capacity of centralized industrial WWTPs in the Yellow River Basin.
Water Treatment Capacity
(104 m3/d)
Number
GansuNingxiaInner MongoliaShaanxiShanxiHenanShandong
<0.56040200
0.5~12100100
1~591265245
5~100111000
≥100010000
Table 2. Correlation and regression analysis of influent water quality parameters.
IndexCODNH3-NTNTP
BODY = 2.3079x + 20.544
R2 = 0.73118
y = 0.0435x + 24.028
R2 = 0.12457
y = 0.11587x + 30.322
R2 = 0.24157
y = 0.00472x + 2.7249
R2 = 0.05991
COD y = 0.02323x + 22.626
R2 = 0.1309
y = 0.02913x + 35.744
R2 = 0.10026
y = 0.00306x + 2.3627
R2 = 0.11159
NH3-N y = 1.0262x + 14.548
R2 = 0.426
y = 0.07964x + 1.0196
R2 = 0.26939
TN y = 0.04608x + 1.3470
R2 = 0.22071
Disclaimer/Publisher’s Note: The statements, opinions and data contained in all publications are solely those of the individual author(s) and contributor(s) and not of MDPI and/or the editor(s). MDPI and/or the editor(s) disclaim responsibility for any injury to people or property resulting from any ideas, methods, instructions or products referred to in the content.

