
Study on the Evolvement Trend Process of Hydrological Elements in Luanhe River Basin, China
1
Nanxun Innovation Institute, Zhejiang University of Water Resources and Electric Power, Hangzhou 310018, China
2
Ningbo Water Resources and Information Management Center, Ningbo 315800, China
3
Hydrological Center of Huzhou City, Huzhou 313000, China
4
Fushan Management Station, Shandong Province Water Transfer Project Operation and Maintenance Center, Yantai 265500, China
*
Author to whom correspondence should be addressed.
Water 2024, 16(8), 1169; https://doi.org/10.3390/w16081169
Submission received: 15 February 2024
/
Revised: 16 April 2024
/
Accepted: 17 April 2024
/
Published: 20 April 2024
Abstract
:Over the past 50 years, there have been significant changes in the runoff process in the Luanhe River basin, exacerbating the scarcity of water resources and their spatiotemporal variability. Therefore, conducting research on the characteristics, trends, and cycles of runoff changes in the Luanhe River basin is of great theoretical and practical significance. This study selected rainfall data from the hydrological stations in Weichang, Chengde, and Qinhuangdao in the Luanhe River basin, covering the period from 1985 to 2008, as well as runoff data from the Hanjiaying, Sandaohezi, and Chengde stations. Based on linear trend regression analysis, the Mann–Kendall rank correlation test, Spearman correlation test, Mann–Kendall method, and Mann–Whitney–Pettitt change point analysis method, this study analyzed the trends in water quantity changes and their change points in the Luanhe River basin. The results of the precipitation at the Weichang and Chengde stations show a non-significant rising trend, remaining relatively stable with slightly increases. Conversely, the precipitation of Qinhuangdao Station shows a decreasing trend over time, albeit non-significant. Considering the detailed diagnostic results from both the Mann–Kendall (M-K) and MWP methods, the change point for Weichang precipitation is identified as 2007, while for Chengde, it spans from 1999 to 2002, and for Qinhuangdao, it is around 1997. The trend of the runoff series of three stations shows a significant decreasing trend and strong significance, and the change point for the annual runoff at the Hanjiaying station and the Sandaohezi station is identified as 2006, and for the Chengde station, the primary change point is 2006, with a secondary change point around 2002. The findings of this research can provide scientific references for the rational development and utilization of regional water resources.
1. Introduction
Environmental change primarily impacts hydrological process by changing the hydrological driving factors and underlying surface conditions. Human activities exert the most direct influence on the hydrological characteristics of the basin [1,2]. Luanhe River is rich in water resources [3], which is one of the important water systems in the Haihe River Basin and one of the main water supply sources in North China. With the increasing impact of environmental change, the problem of water resources decay has become increasingly prominent. It is of great practical significance to study and analyze the evolution law and spatial distribution difference of hydrological characteristics in the Luanhe River Basin based on environmental change for water resources management, ecological environment protection, and comprehensive utilization of water resources in the Luanhe River Basin [4].
Periodicity is another characteristic of annual runoff. Andreo [5] observed periodicities of 5 and 2.5 years, which have been recorded in other areas of Europe. These multi-annual scale components can be explained by climatic variations or effects in connection with the North Atlantic Oscillation (NAO). Pekarova [6] stated that the temporal shift in the discharge extremes occurrence depended on the longitude and latitude. The time shift between Neva and Amur discharge time series is about four years, between Amur and St. Lawrence is about sixteen years, and between St. Lawrence and Neva is about nine years. The time shift between Congo and Amazon is about seven years.
In the Luanhe River Basin, Tang [7] analyzed the effects of human activities on runoff and found that vegetation cover rate had an inverse relationship with runoff amount and flood frequency. Li [8] studied the effects of water and soil conservation on runoff and sediment, and they stated that the natural runoff decreased 29.9% from 1996 to 2000 compared with 1991 to 1995 because of the decrease in precipitation, although the water and soil conservation effects were obvious. Fan [9] investigated the influence of climate change on the water resources by using the precipitation-runoff modeling system, and the results showed that the surface runoff, subsurface runoff, and groundwater are mostly affected by precipitation.
This study contributes to a comprehensive understanding of the evolution characteristics of hydrological factors in the Luanhe River Basin and can enhance the existing research on drought evolution in the Luanhe River Basin. Further exploration into the impact of various meteorological factors on runoff variation is necessary [10]. Moreover, there is potential for deeper investigation into the evolutionary patterns of hydrological elements in the Luanhe River Basin and the associated mechanisms and genesis. This research adopts a statistical analysis approach, analyzing trends and variation points with relevant theories, thereby surpassing the traditional model of studying evolution trends strictly from the perspective of hydrological physical mechanisms. The exploration of the evolutionary trends of hydrological elements in the Luanhe River provides insights into the spatial and temporal variations of runoff in the basin, facilitating hydrological forecasting for the future. This, in turn, aids in water resources planning and management and ecological environment protection and provides a foundation for water diversion projects. Understanding the changing runoff environment is fundamental for forecasting hydrological and water environment changes. Furthermore, this research offers valuable insights for the development of water conservancy projects and the utilization planning of land resources within the basin.
2. Materials and Methods
2.1. Study Area
The Luanhe River originates from the northern foothills of Bayan Gultu Mountain in the Zhangjiakou area of Hebei Province. Its upper reaches veer southeast through Duolun County in the Inner Mongolia Autonomous Region, and it is officially named the Luanhe River after receiving the tributary known as the Small Luanhe River. In the middle reaches, the river traverses the Yanshan mountains, and in the lower reaches, it forms a delta approximately 50 km wide, emptying into Bohai Bay. The Luanhe River has a total length of 888 km and a drainage area of 5.44 × 10⁴ km2. Its average annual runoff depth is 109 mm, and the average annual runoff volume is 59.3 × 10⁸ m3. The primary tributaries of the Luanhe River include the Yisun River, Wulihe River, Fuhe River, Sashi River, and Qinglong River. Situated in the northeastern part of the North China Plain, the basin’s geographical coordinates range from 115°34′ to 119°50′ E and from 39°02′ to 42°43′ N. The region falls within a temperate continental monsoon zone, characterized by cold, dry winters and hot, rainy summers. The average annual temperature in the basin is 7.6 °C, with an average annual precipitation of 520 mm. Precipitation increases from the coast towards the north due to topographical influences, and it exhibits a declining trend beyond the Great Wall. The climate is notable for its concentrated precipitation and frequent occurrence of heavy storms. The upstream area of the basin features plateau terrain around the Dama and Weichang station, characterized by undulating surfaces resembling waves and numerous wind erosion depressions. Moving downstream, the terrain transitions to the hilly areas of northern Hebei in the middle reaches, marked by deep valleys. In the lower reaches, the landscape consists of the piedmont plains of the Yanshan Mountains and the delta plains of the Luanhe River, both heavily impacted by human activities. To address the imbalance between water supply and demand in the Beijing-Tianjin region and support the water needs of economic growth centers such as Tangshan and Qinhuangdao, significant water conservancy projects were initiated. These include the construction of the Panjiakou and DaHeiTing large-scale water control projects in the late 1970s along the main stem of the Luanhe River. In the 1990s, the Qinglong River’s Taolinkou Reservoir was built, and diversion projects were gradually implemented, redirecting water from the Luanhe River to Tianjin, Tangshan, and the Qinlong River to aid Qinhuangdao. The intensity of water resources development and utilization has continued to increase in the region. Figure 1 is the detail Location of Luanhe River Basin.
2.2. Methods
This paper employs linear trend regression analysis, the Mann–Kendall rank correlation test, and the Spearman correlation test to analyze the trend of runoff time series [11], Additionally, the Mann–Whitney–Pettitt test and Mann–Kendall mutation test were utilized to investigate mutations within the runoff time series.
2.2.1. Linear Trend Regression Analysis
The linear trend identification method diagnoses the trend of the series by analyzing the linear trend change in series value over time. The change is characterized by a one-variable equation:
a: Regression constant; b: Regression coefficient; yi: Analysis variable ti: time index.
The least square estimation formula for regression coefficient b and constant a is as follows:
The correlation coefficient r is used for significance test, and when exceeds the significance level, it signifies the significant trend of hydrological series change over time.
2.2.2. Mann–Kendall Rank Correlation Test
The Mann–Kendall statistical test for trend is used to assess whether a set of data values is increasing over time or decreasing over time, and whether the trend in either direction is statistically significant. The Mann–Kendall test does NOT assess the magnitude of change.
Utilizing the Mann–Kendall (M-K) test method, the trend and stochastic variations of the time series are analyzed. Initially proposed by Mann and Kendall [12], the M-K method has been continuously refined [13] and is now recommended by the World Meteorological Organization for trend analysis of environmental data time series [14]. Due to its independence from specific distributional assumptions, this method has gained widespread application in trend analysis.
The statistical test ZC is defined to determine the trend and intensity of changes in the sequence based on its positive or negative values and their relationship with the critical values at a given confidence level. If the test quantity is positive, the series shows a rising trend. On the contrary, it shows a decreasing trend. If the test quantity exceeds the critical value, the change trend is considered significant [15]. The Kendall inclination β value is calculated to quantitatively measure the magnitude of the trend. Additionally, the M-K method can also be used for mutation testing on sequences. By examining the intersection points between the ascending UFk curve and the descending sequence UBk curve relative to the confidence lines, the approximate time of mutation in the sequence can be determined. In this study, a confidence level of α = 0.05 is adopted, with corresponding critical values of ±1.96 [16].
2.2.3. Spearman Correlation Test
In statistics, Spearman’s rank correlation coefficient or Spearman’s ρ, named after Charles Spearman [17] and often denoted by the Greek letter ρ(rho) or as rs, is a nonparametric measure of rank correlation (statistical dependence between the rankings of two variables). It assesses how well the relationship between two variables can be described using a monotonic function.
The Spearman correlation between two variables is equal to the Pearson correlation between the rank values of those two variables; while Pearson’s correlation assesses linear relationships, Spearman’s correlation assesses monotonic relationships (whether linear or not). If there are no repeated data values, a perfect Spearman correlation of +1 or −1 occurs when each of the variables is a perfect monotone function of the other.
Intuitively, the Spearman correlation between two variables will be high when observations have a similar (or identical for a correlation of 1) rank (i.e., relative position label of the observations within the variable: 1st, 2nd, 3rd, etc.) between the two variables, and low when observations have a dissimilar (or fully opposed for a correlation of −1) rank between the two variables.
Spearman’s coefficient is appropriate for both continuous and discrete ordinal variables [18]. Both Spearman’s ρ and Kendall’s τ can be formulated as special cases of a more general correlation coefficient.
Spearman rank correlation test analyzes the correlation between rank Rt of sequence xt (t = 1, 2…) and sequence t (t = 1, 2…). The correlation is characterized by the rank-order correlation coefficient r:
The greater the conformity between the rank Rt and the time sequence t, the larger the correlation coefficient r, indicating a more significant trend of xt is. The t-test is used to assess the rejection of the null hypothesis, and a statistic parameter T is constructed as follows:
where T follows a T-distribution with (n − 2) degrees of freedom. If , it exceeds the critical value, it indicates a significant trend in the sequence; otherwise, it suggests a non-significant trend or no intrinsic correlation between the variables. The correlation analysis in this study is conducted using SPSS 15.0 software to perform this test [19].
2.2.4. The Variation Point Analysis Method: Mann–Whitney–Pettitt Test
Decompose the test sequence into two samples x1, x2… And the xt, xt+1,…. Define Ut,T as the test statistic:
where T is the number of samples, 1 ≤ t ≤ T,
The probability P of Ut,T is:
If , Indicates that the variation point t is significant.
3. Results and Discussion
3.1. Evolution Characteristics of Precipitation
Based on the data of Weichang, Chengde, and Qinhuangdao meteorological stations from 1980 to 2008, the precipitation variation trend of the three sites was analyzed, respectively. Initially, a preliminary analysis is conducted using the linear trend regression method. Subsequently, further calculations and analyses are performed using the Mann–Kendall rank correlation test and the Spearman analysis method. The linear trend regression method is implemented using Excel 6.0.2 software, the Mann–Kendall rank correlation test is conducted using Matlab 2012b. software, and the Spearman analysis is carried out using SPSS 15.0 software.
3.1.1. Analysis of Precipitation Trend
- (1)
- Linear trend regression analysis
- (2)
- From the Figure 1, Figure 2, Figure 3 and Figure 4, it can be observed that the daily average precipitation at the Weichang and Chengde stations shows a slight increasing trend, albeit maintaining relative stability. Conversely, the precipitation of Qinhuangdao Station showed a slight decreasing trend. From the Figure, the trend of the three stations was not significant.
- (3)
- Mann–Kendall rank correlation test
Table 1 is the M-K rank correlation test results of precipitation.
- (4)
- Spearman’s test
The results of Spearman’s test (Table 2) are basically consistent with the above findings. Due to insignificance of the correlation between the variables, the null hypothesis was rejected, indicating failure to pass the 0.05 confidence test.
3.1.2. Identification of Precipitation Variation Points
- (1)
- M-K method
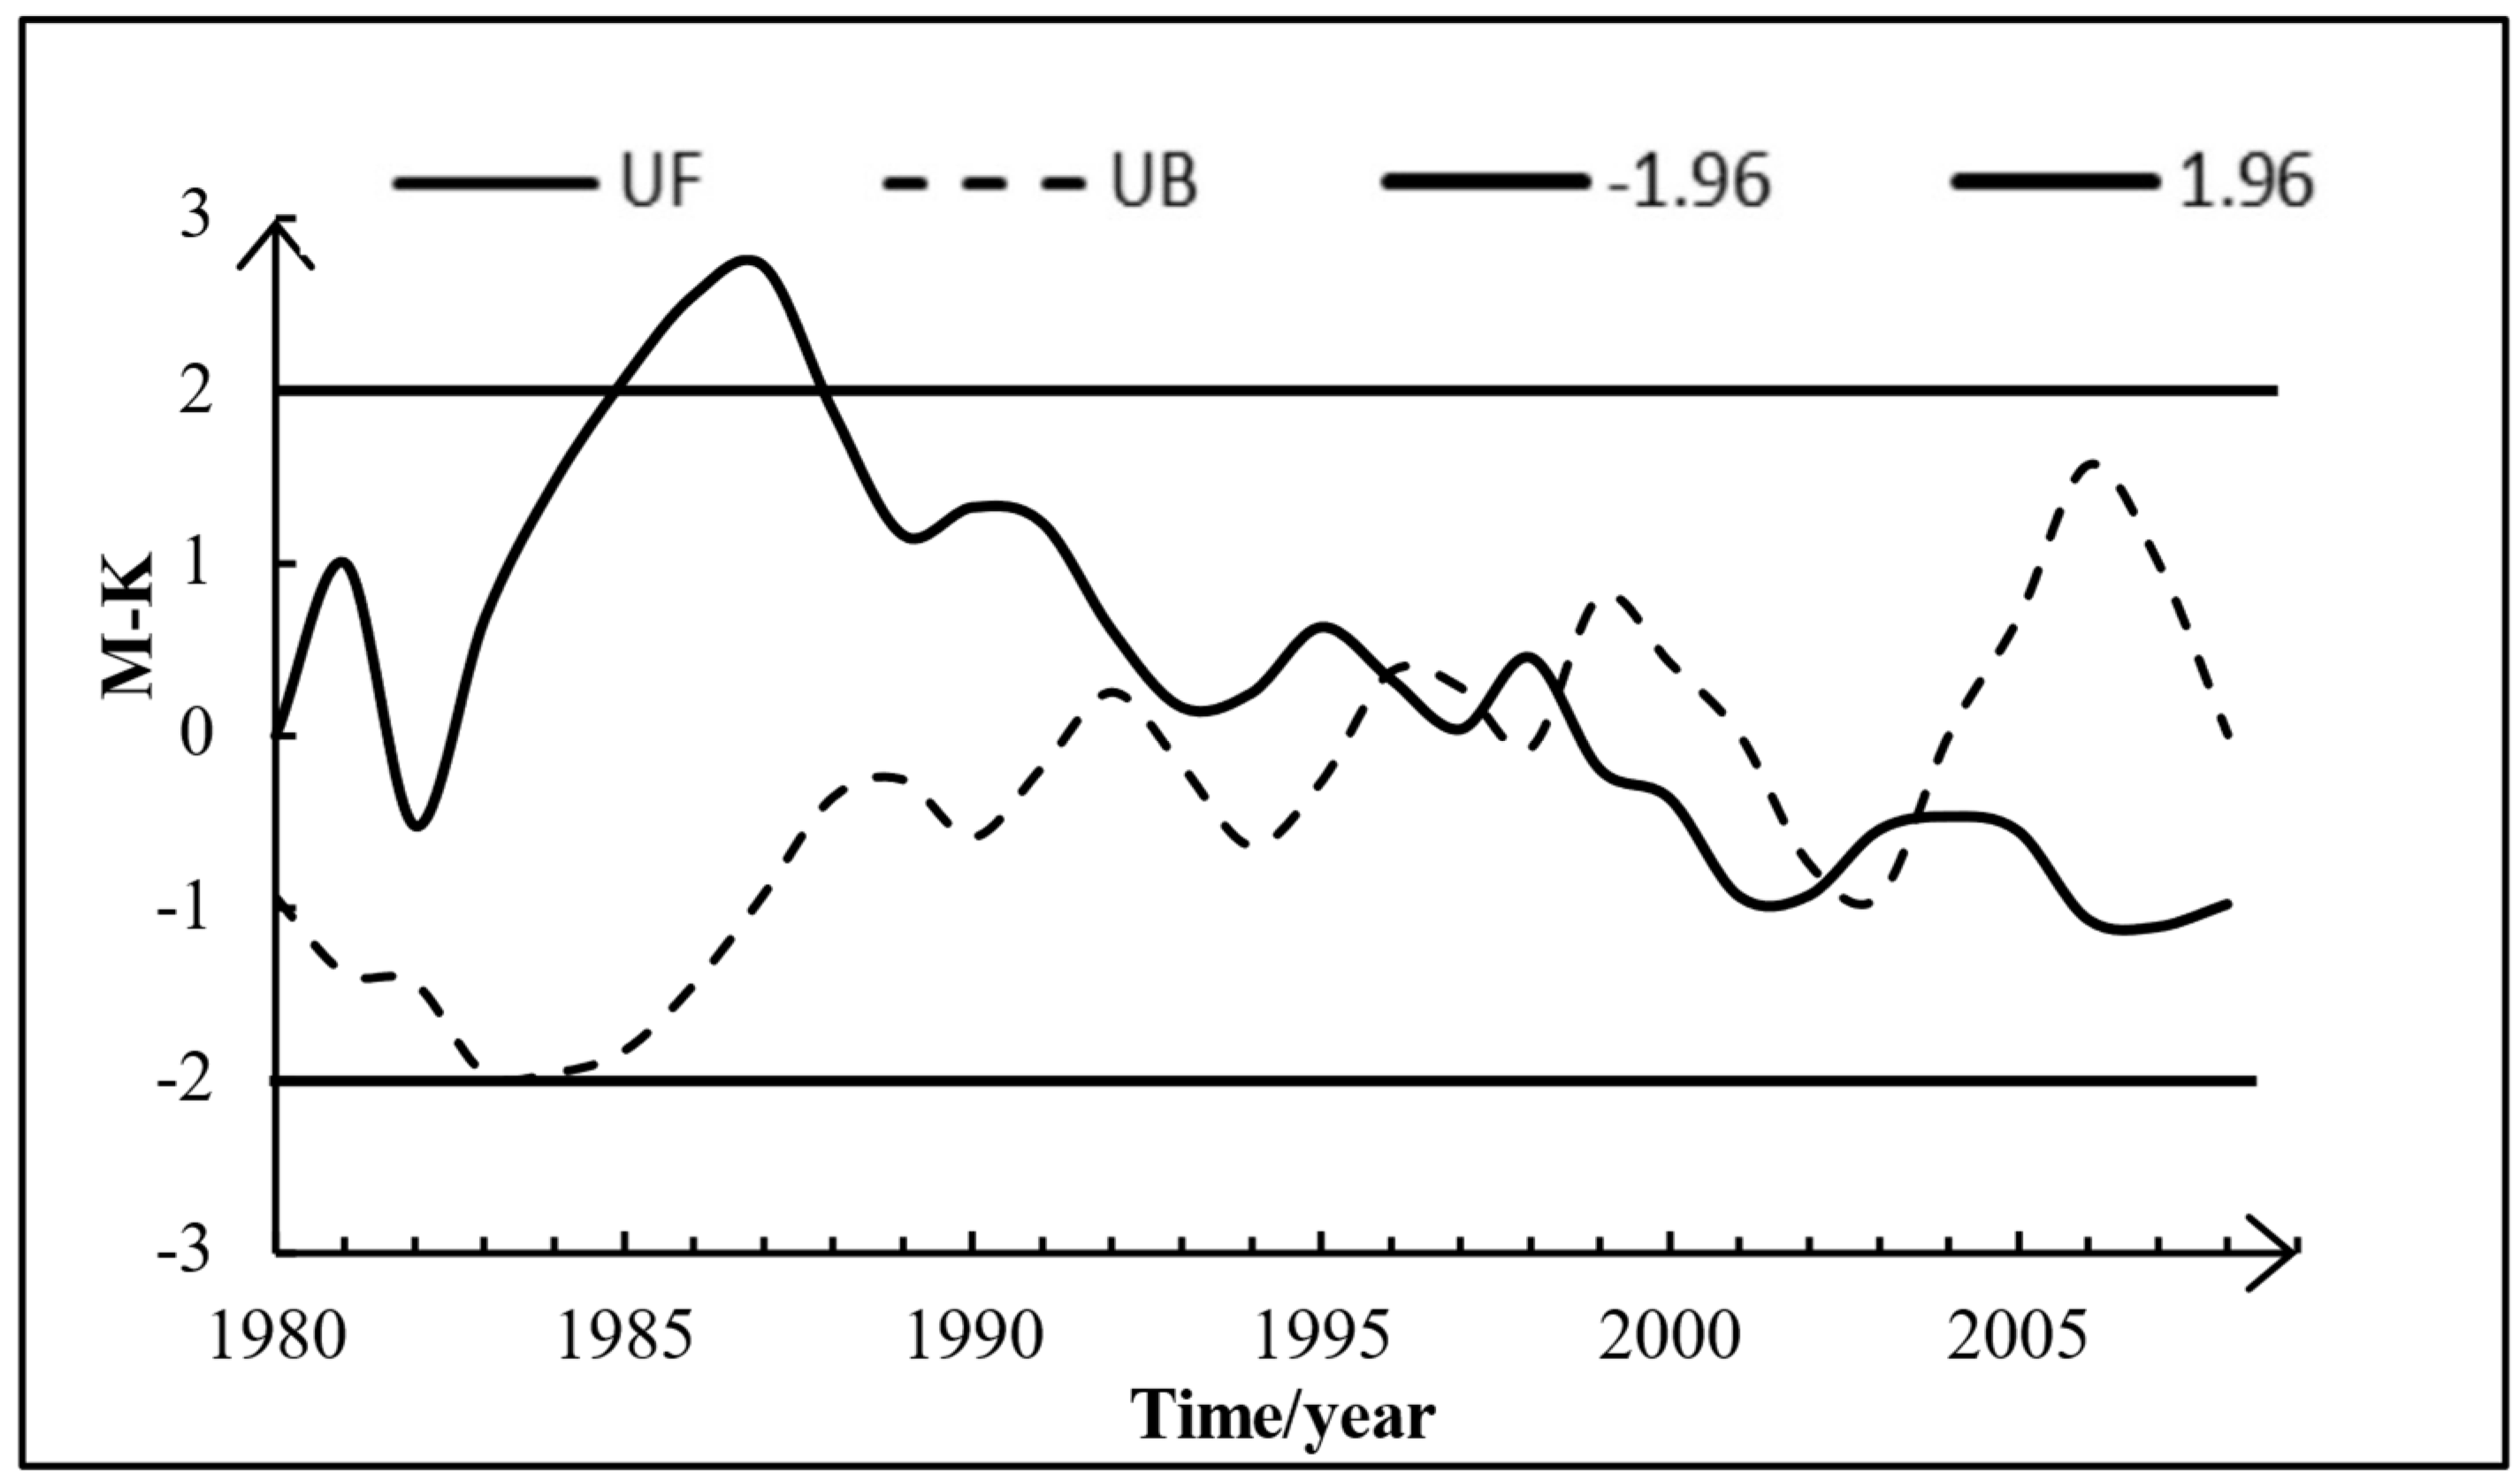
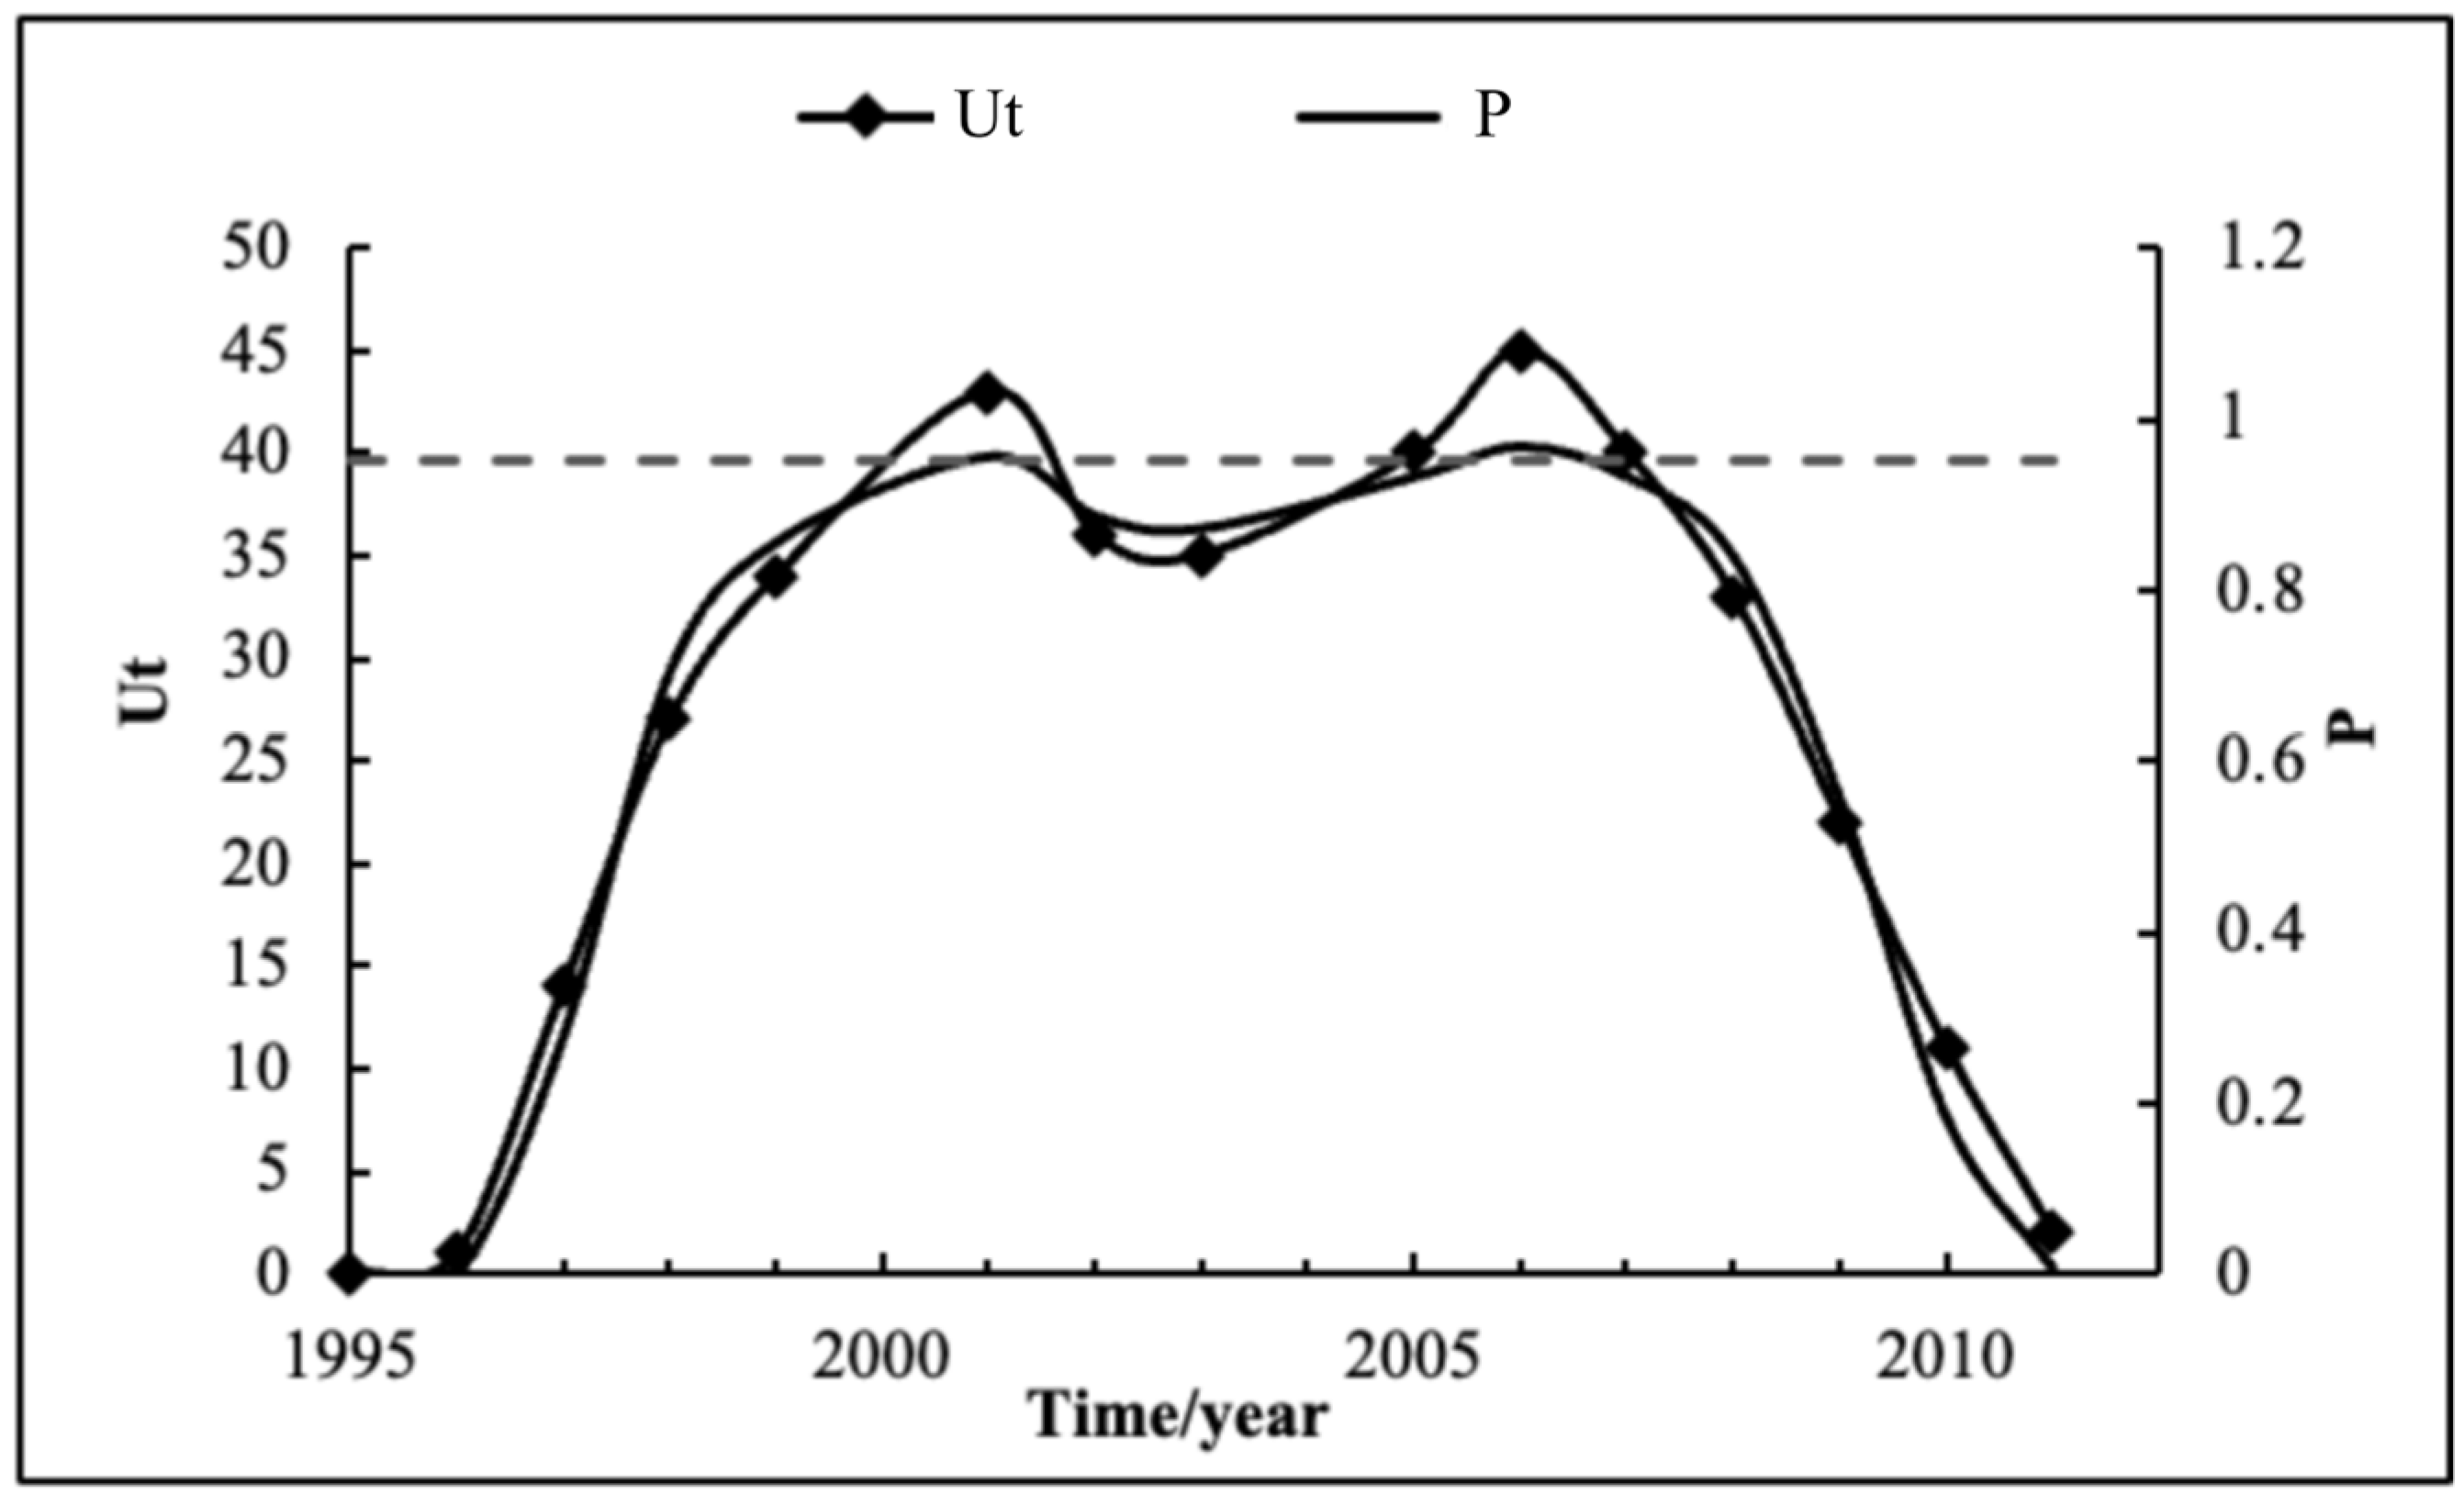
The UF curves mostly lie above zero, indicating a rising trend in precipitation at the Weichang station (Figure 5). In 2007, the UF curve intersects with the UB curve, and the intersection point falls within the confidence interval. Therefore, 2007 may be the year when precipitation began to vary. However, since 2007 is at the end of the data series, whether it is the point of variation should be further analyzed in combination with other methods.
The UF curve for the Chengde station (Figure 6) exhibits a wavy pattern, mostly situated above the M-K = 0 line, indicating a wavy rising trend in precipitation over time. Within the critical range, there are three intersection points between the UF curve and UB curve, occurring in 2000, 2002, and 2003, respectively.
The precipitation in Qinhuangdao Station (Figure 7) showed a decreasing trend and broke the critical upper limit in 1985, so the precipitation in Qinhuangdao Station showed a significant rising trend in 1985. Within the critical range, there are four intersection points between the UF and UB curves, occurring in 1996, 1997, 1999, and 2002, respectively.
- (2)
- MWP method
The p-values for both Weichang (Figure 8) and Qinhuangdao (Figure 9) stations did not exceed 0.95, Therefore, the Mann–Whitney–Pettitt (MWP) test did not identify any significant change points. For the Chengde station, (Figure 10) the p value in 1999 was close to 0.95, suggesting 1999 as a potential change point for the precipitation series at the Chengde station.
Combining the results of the three trend analysis methods, the precipitation at the Weichang and Chengde stations shows a non-significant rising trend, remaining relatively stable with slight increases. Conversely, the precipitation of Qinhuangdao Station shows a decreasing trend over time, albeit non-significant, the details is showing at Table 3. Considering the detailed diagnostic results from both the Mann–Kendall (M-K) and MWP methods, the change point for Weichang precipitation is identified as 2007, while for Chengde, it spans from 1999 to 2002, and for Qinhuangdao, it is around 1997 (Table 4).
3.2. Analysis of Runoff Variation Characteristics
Based on the discharge data of Hanjiaying, Sandaohezi, and Chengde hydrological stations from 1995 to 2012, the runoff trends of the three locations were analyzed, respectively. Initially, a preliminary analysis was conducted using the linear trend regression method. Subsequently, further calculations and analyses were performed using the Mann–Kendall rank correlation test and the Spearman analysis method. The linear trend regression method was implemented using Excel software, the Mann–Kendall rank correlation test was conducted using Matlab software, and the Spearman analysis was carried out using SPSS software.
3.2.1. Analysis of Runoff Trend Change
From the Figure (Figure 11, Figure 12 and Figure 13), it can be observed that the regression coefficients for annual runoff at the three hydrological stations are all negative, indicating that the annual runoff series presents a decreasing trend, and the decreasing trend is significant.
Matlab is used as the analysis tool to analyze the annual runoff trend of the three hydrological stations by M-K rank correlation test method. In this study, the confidence level α is 0.05, and the corresponding critical value is 1.96. The results are shown in the following Table 5:
Using SPSS as the analysis tool, the Spearman correlation test was conducted to determine the significance of the correlation coefficient between the variables. Based on the sample length, the critical value Z for the Spearman rank correlation coefficient was obtained from the table. When |r| > Z, the null hypothesis is rejected, indicating a significant Spearman rank correlation. A positive r value indicates a positive correlation between the variable, while a negative value indicates a negative correlation. When the significant coefficient S < 0.05, it indicates that the trend is significant based on the confidence test. The specific results are shown in the Table 6 below:
3.2.2. Identification of Runoff Variation Points
- (1)
- The mutation point test results of M-K analysis are shown in the figure below:
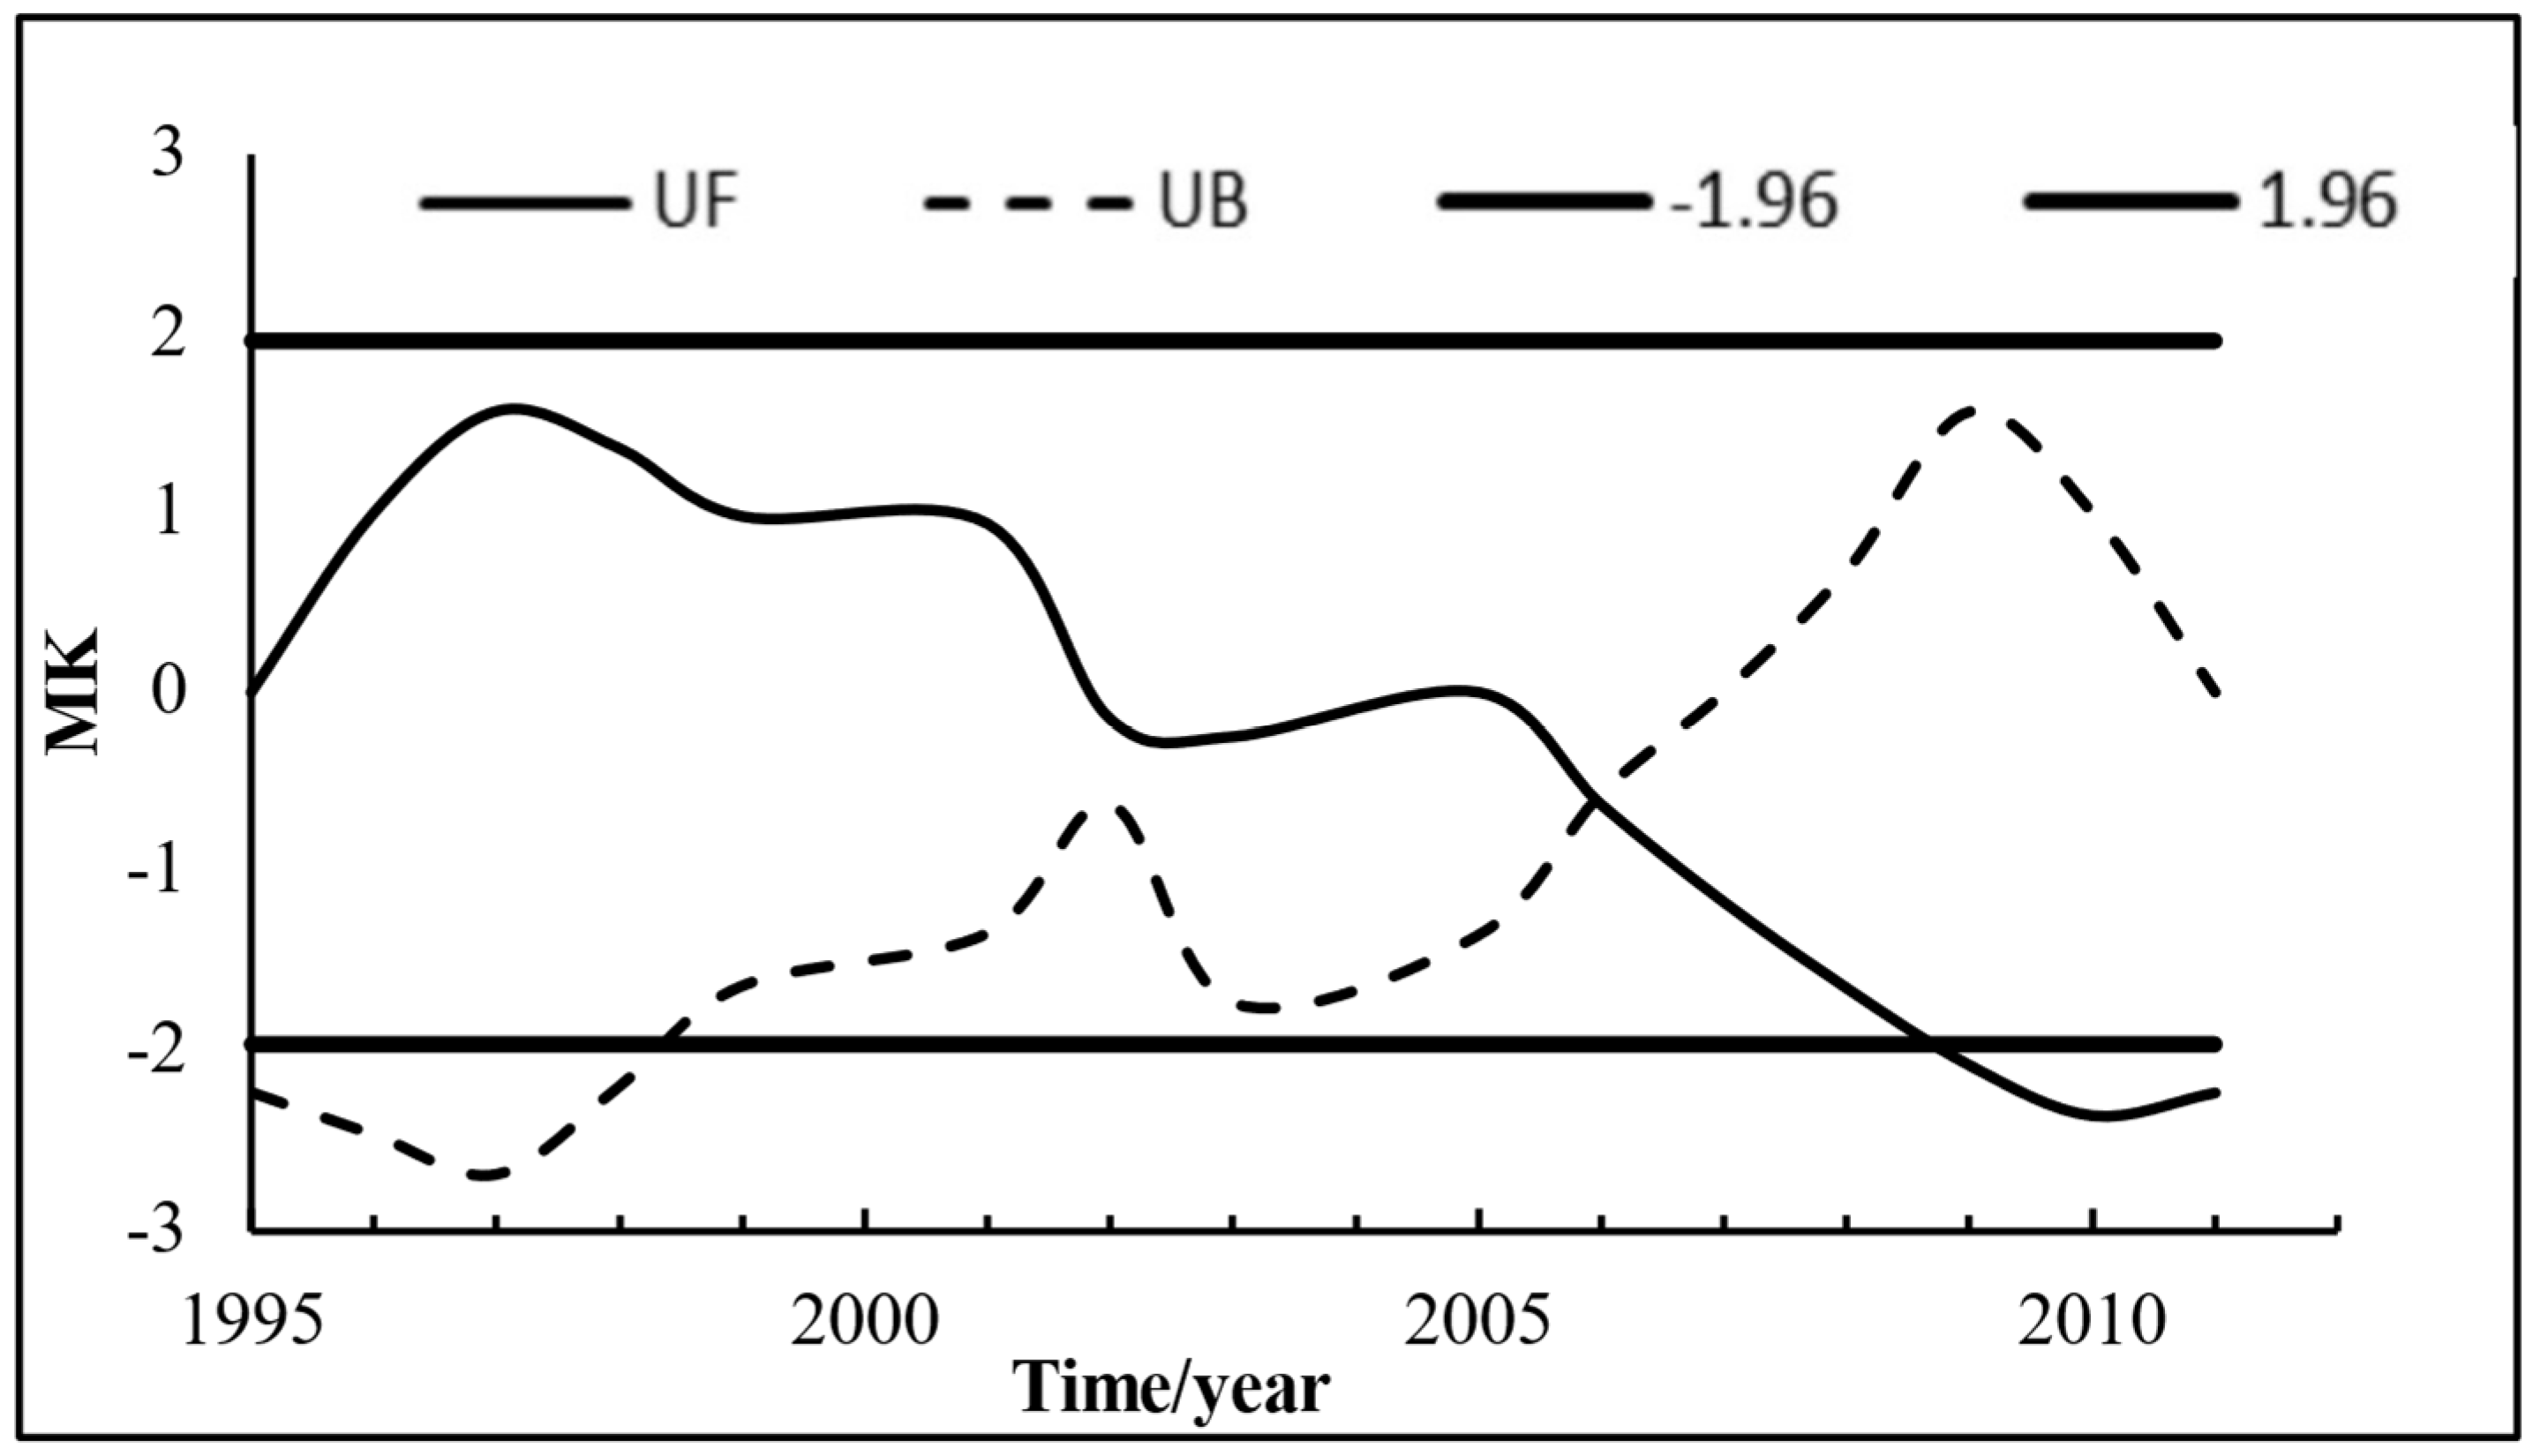
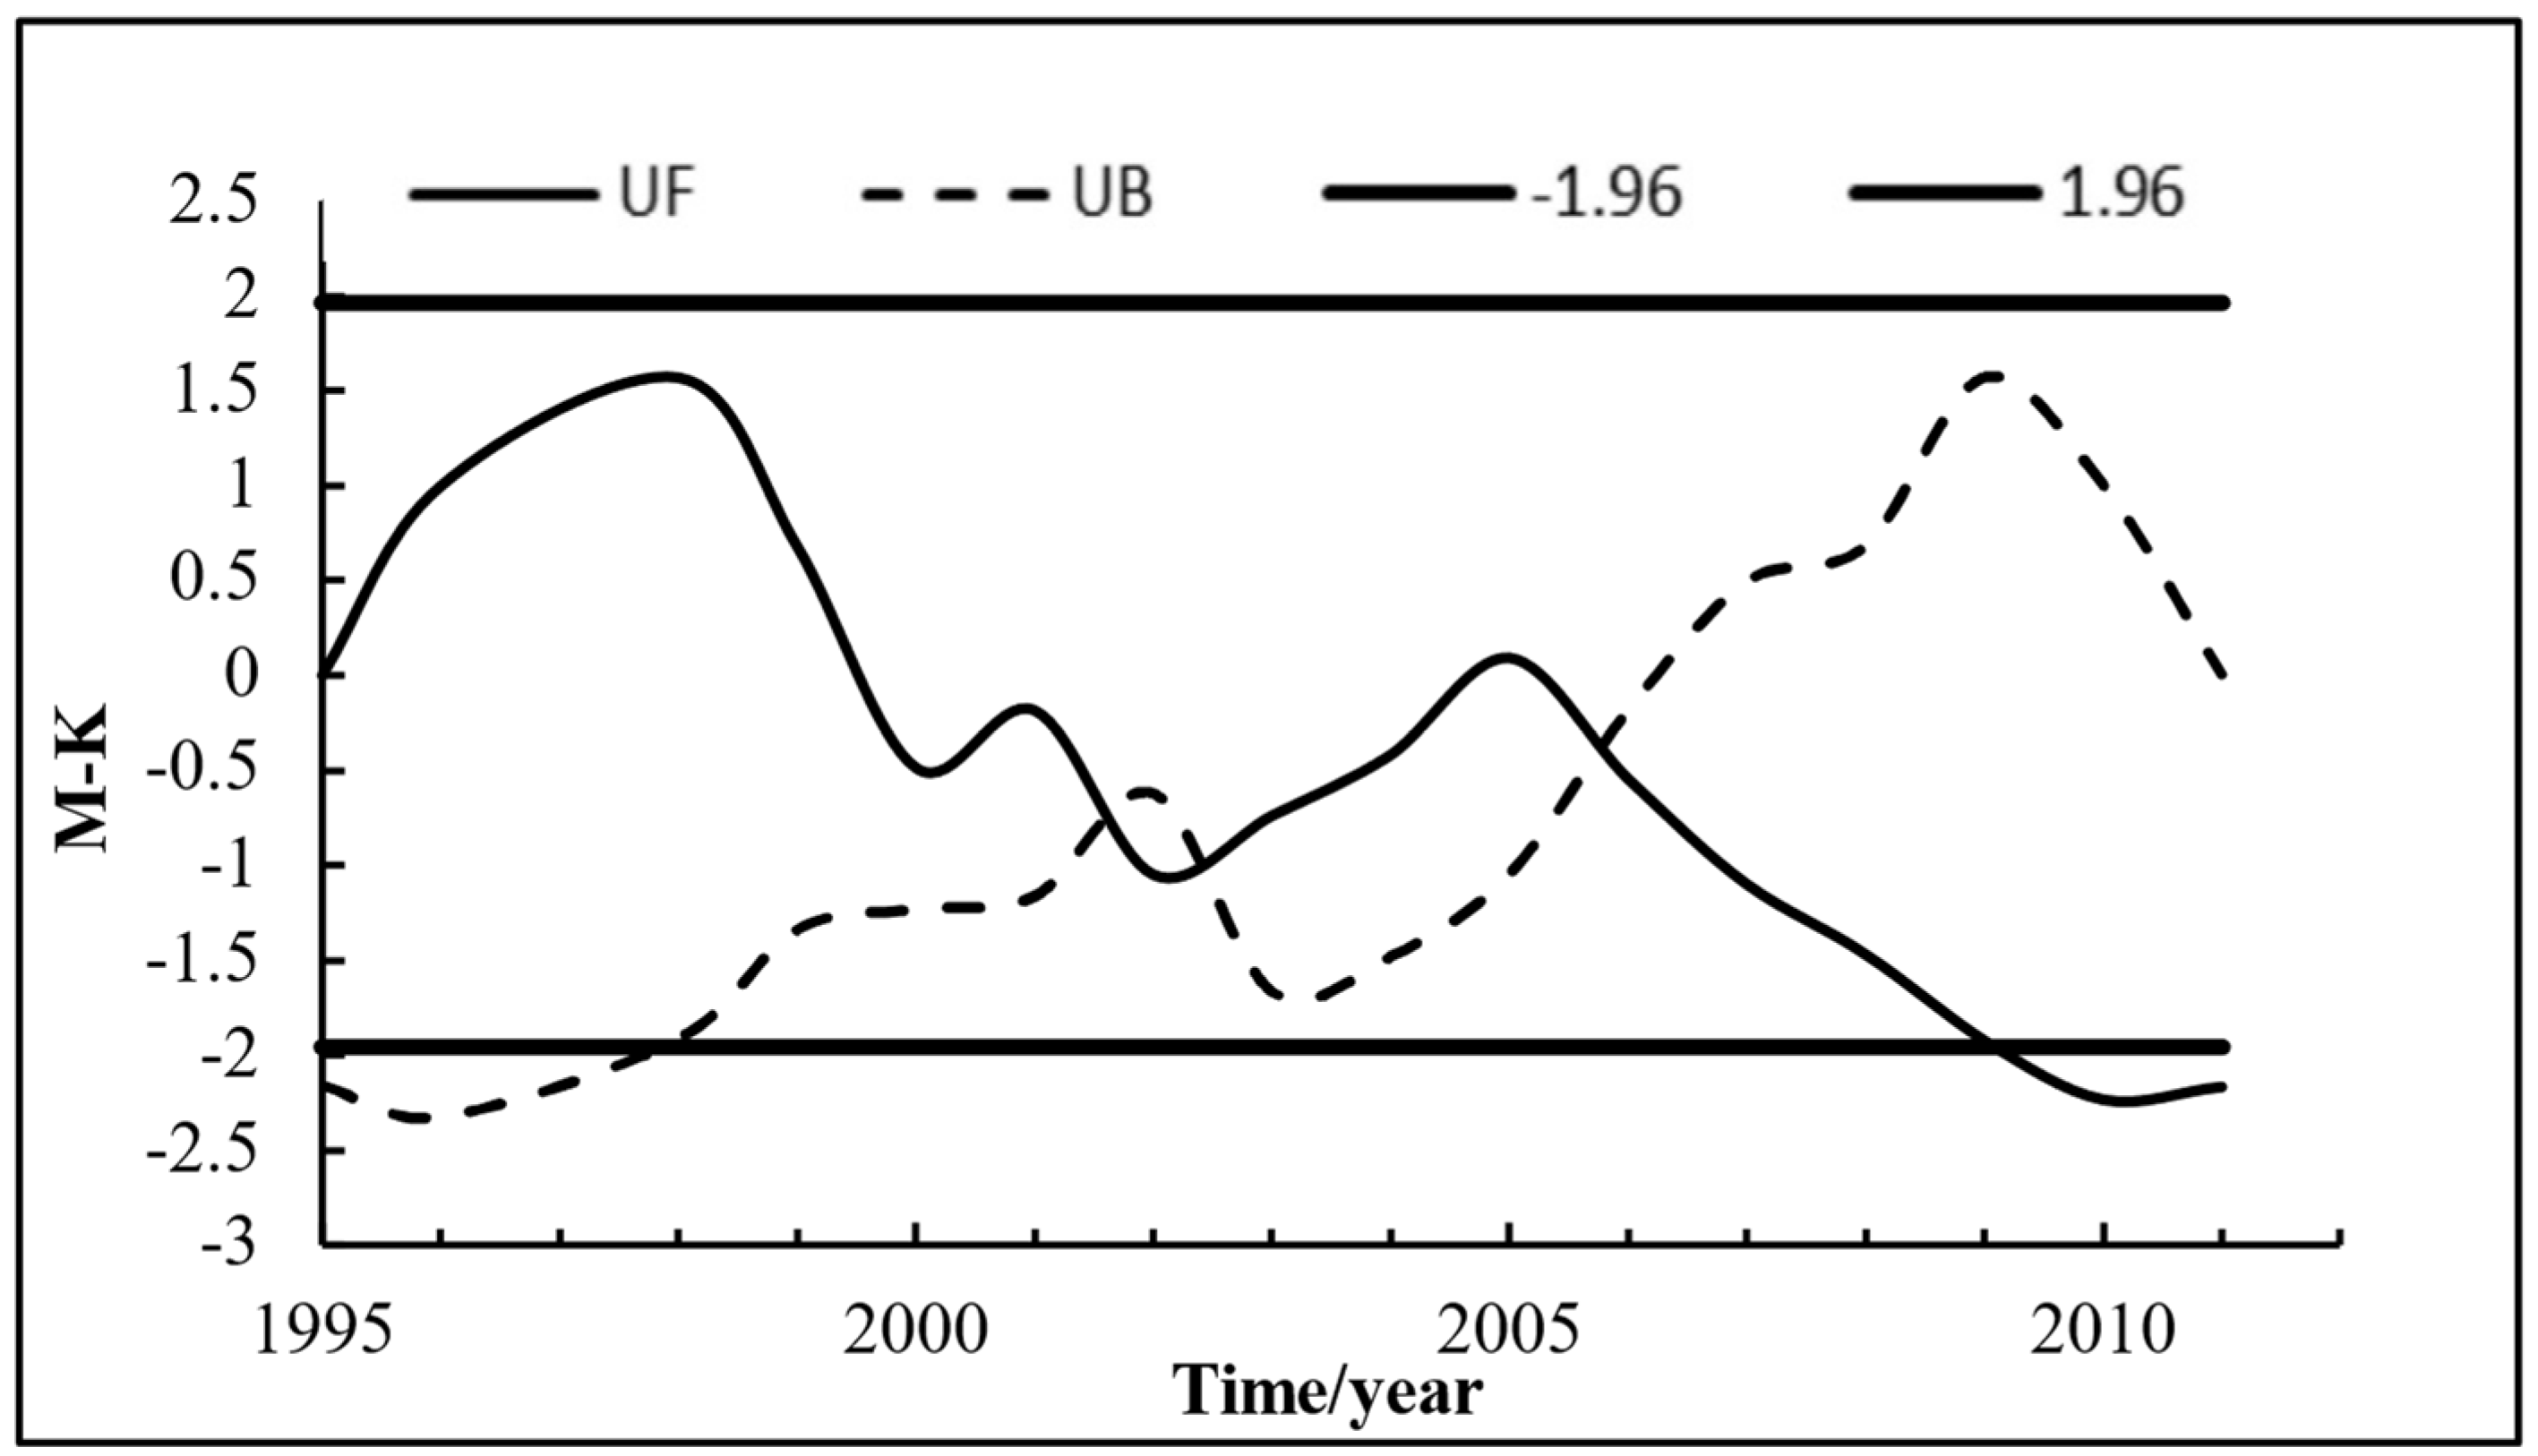
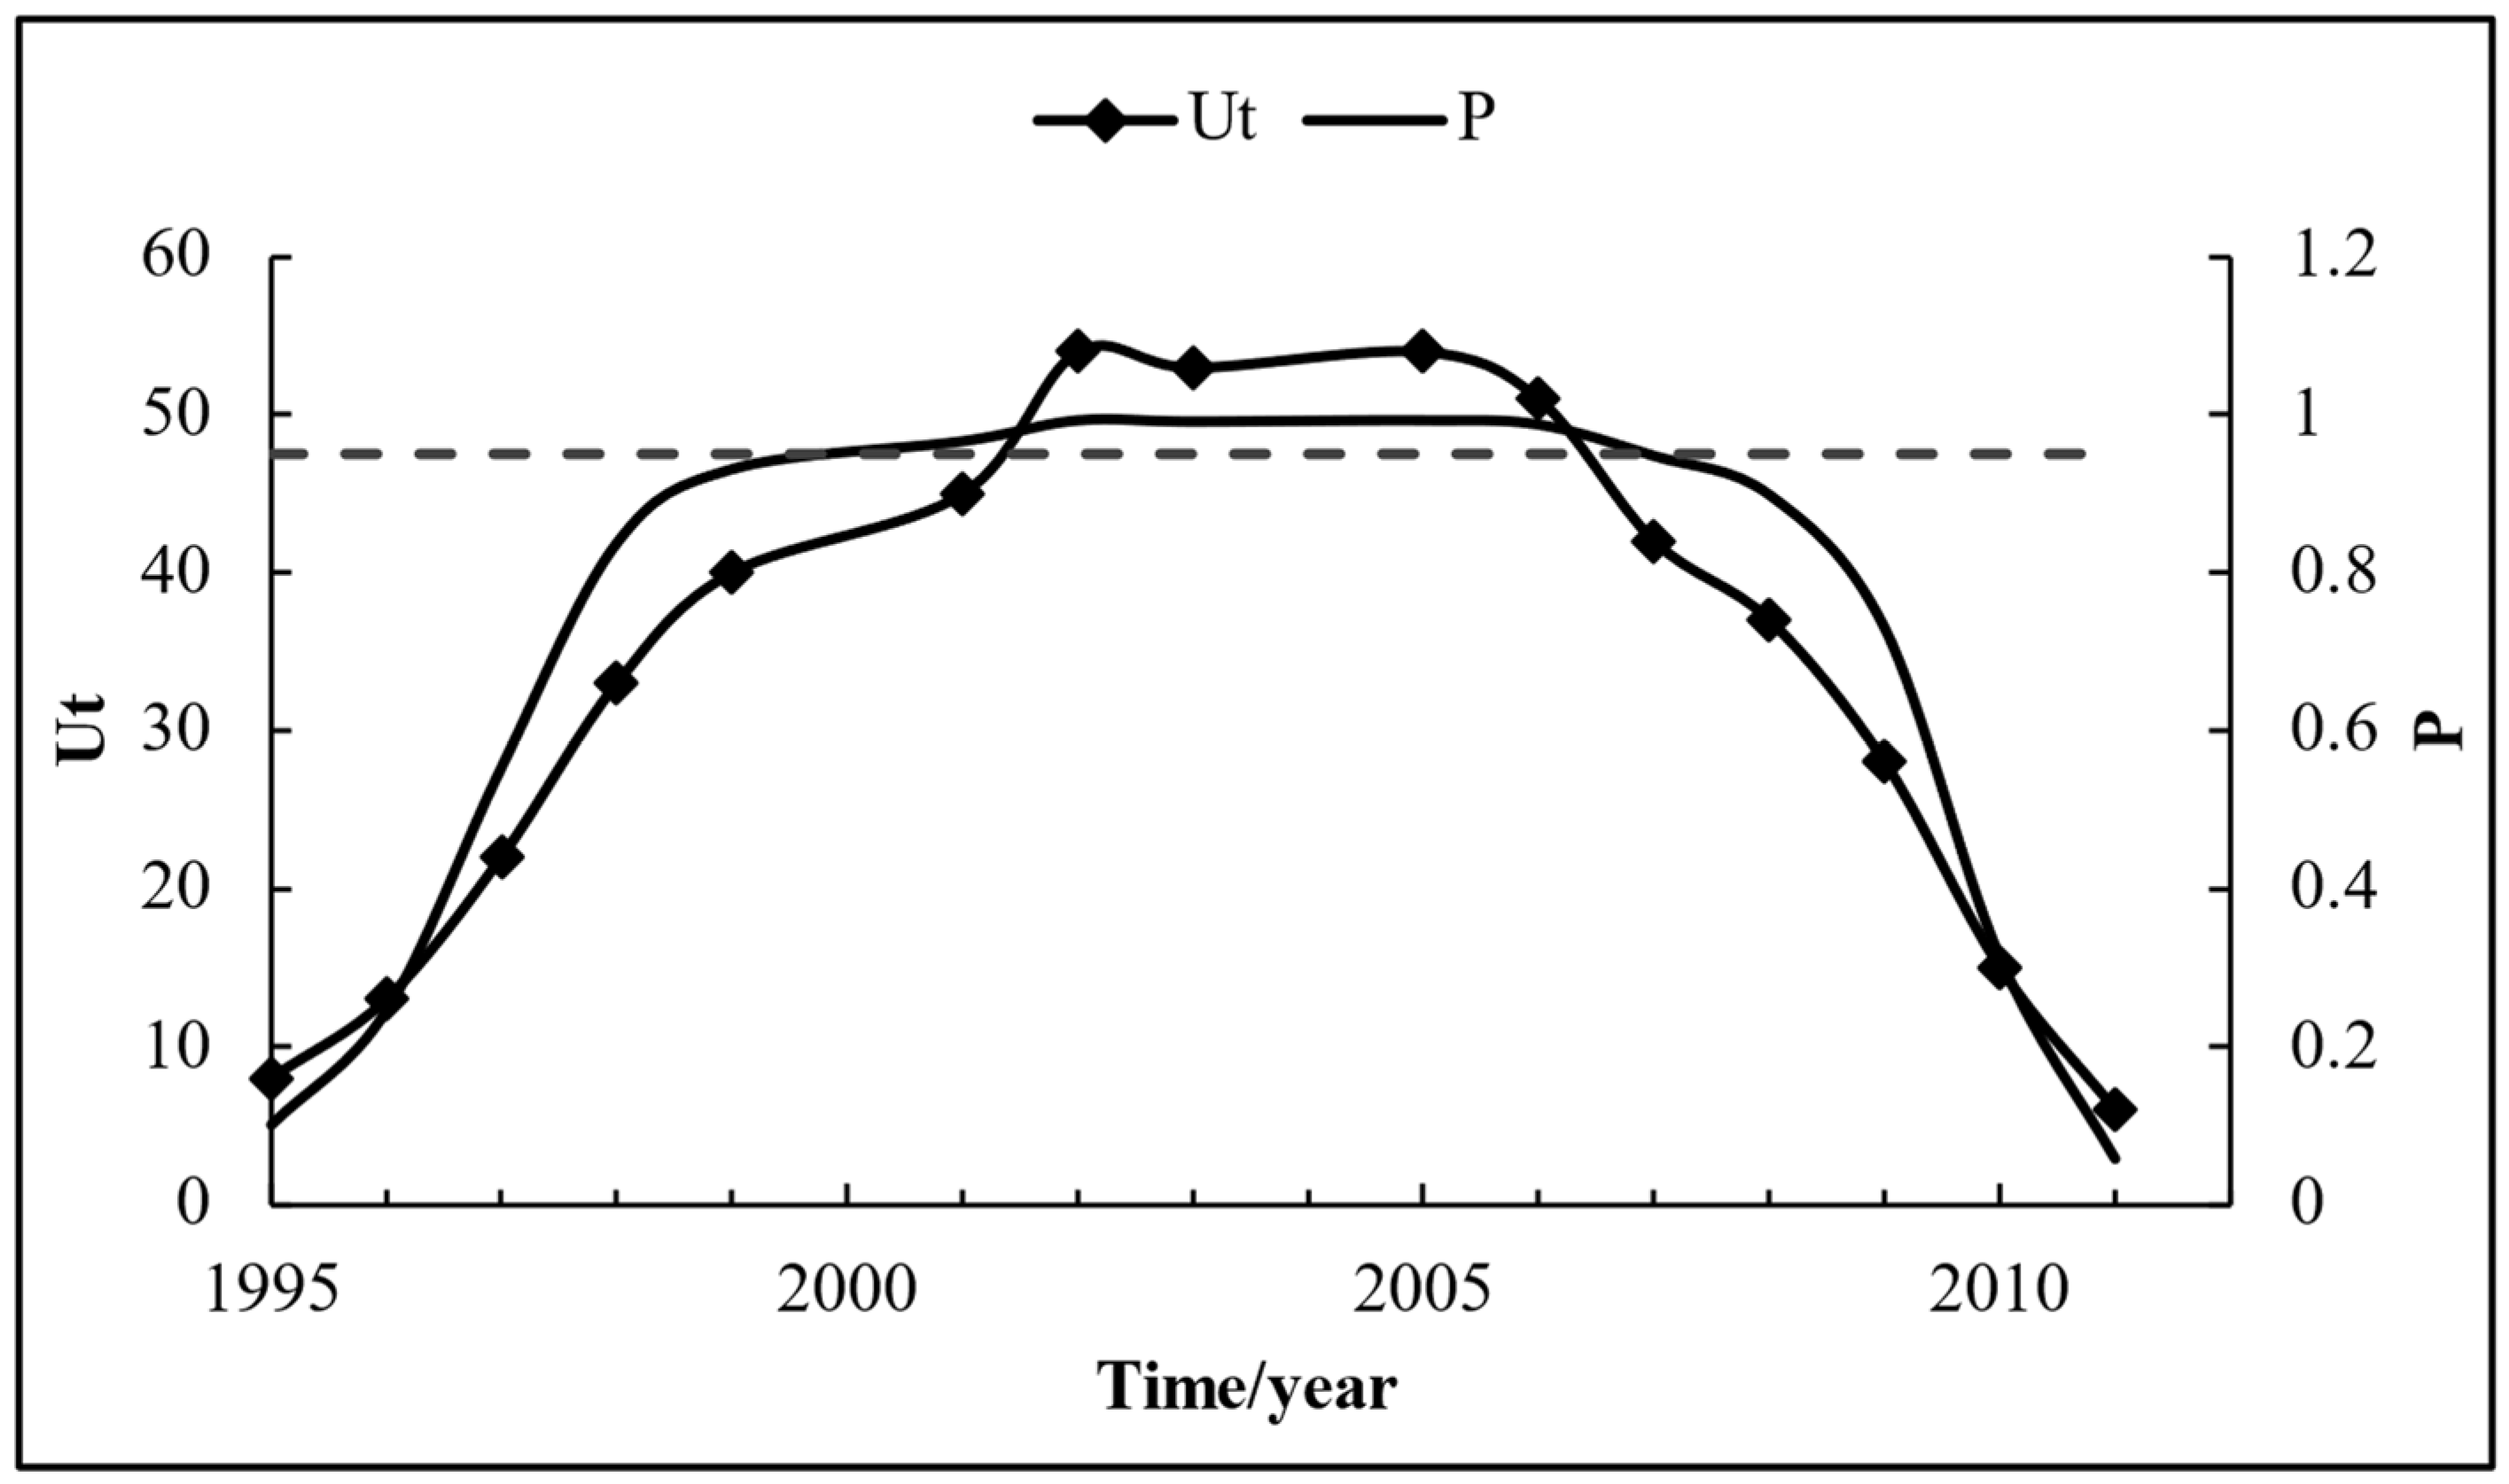
From the Figure 14, it can be observed that the UF curves of Hanjiaying station mostly lies below 0, indicating an overall decreasing trend in runoff. In 2009, the UF curve crosses the critical lower limit, indicating a significant decreasing trend in 2009. In 2006, the UF and UB curves intersect, and the intersection point falls within the critical range, suggesting that 2006 may be considered as the beginning of the change point.
From the Figure 15, it is evident that the UF curve for the Sandaohezi station is mostly below 0, indicating a wavy decreasing trend in annual runoff at Sandaohezi. In 2009, the UF curve crosses the lower confidence limit, indicating that the runoff showed a significant decreasing trend in 2009. Within the critical range, there are three intersection points in 2002, 2003, and 2006, respectively, which are considered as three potential change points. Additionally, in 1998, the UF curve is close to the confidence upper limit, while the UB curve crosses the confidence lower limit, suggesting that 1998 is also a potential change year.
From the Figure 16, it is evident that the UF curve for the Sandaohezi station is mostly below 0, indicating a wavy decreasing trend in annual runoff at Sandaohezi. In 2007, the UF curve crosses the confidence lower limit, indicating a significant decrease in runoff in 2007. Within the critical range, there are three intersection points in 2002, 2003, and 2006, respectively, which are considered as three potential change points.
- (2)
- MWP test
P(t) = 1 − α = 0.95. When P > P(t), it indicates that the change point is significant. From the Figure 17, we can see that the P value for the year of 2001 is 0.95 and the p value for the year of 2006 is 0.966, both exceeding 0.95. Therefore, the years 2003 and 2006 are considered as the years when the runoff of Hanjiaying station began to significantly change.
The p value of Sandaohezi station (Figure 18) in 2006 reached 0.97, so 2006 was the most likely change point for Sandaohezi station.
For the Chengde station (Figure 19), the p value for the years 2001 to 2006 all exceed 0.95, indicating a relatively wide potential range for the change point. Therefore, it is necessary to combine other methods and physical causes for further analysis. The trend of the runoff series is relatively clear, with all three stations showing a significant decreasing trend and strong significance. The detail is showing at Table 7. Combining the results from the three methods, the change point for the annual runoff at the Hanjiaying station is identified as 2006, for the Sandaohezi station it is also 2006, and for the Chengde station, the primary change point is 2006, with a secondary change point around 2002 (Table 8). Overall, the results for the evolution of the natural runoff of the Luanhe River are in agreement with results in the literature on the long-term evolution of the runoff volume in the Luanhe River Basin [3].
4. Conclusions
In this paper, the trend and variation points of the precipitation series of Weichang, Chengde, and Qinhuangdao meteorological stations are analyzed, and the trend and variation points of the runoff series of Hanjiaying, Sandaohezi, and Chengde hydrological stations are analyzed. We can draw the following conclusions from the study results.
- (1)
- Combining the results of the three trend analysis methods, the precipitation at the Weichang and Chengde stations shows a non-significant risinging trend, remaining relatively stable with slightly increases. Conversely, the precipitation of Qinhuangdao Station shows a decreasing trend over time, albeit non-significant. Considering the detailed diagnostic results from both the Mann–Kendall (M-K) and MWP methods, the change point for Weichang precipitation is identified as 2007, while for Chengde, it spans from 1999 to 2002, and for Qinhuangdao, it is around 1997.
- (2)
- The trend of the runoff series is relatively clear, with all three stations showing a significant decreasing trend and strong significance. Combining the results from the three methods, the change point for the annual runoff at the Hanjiaying station is identified as 2006, for the Sandaohezi station it is also 2006, and for the Chengde station, the primary change point is 2006, with a secondary change point around 2002.
In the analysis, trends emerge consistently and clearly across various parameters, presenting numerous potential points of variation. Thus, a specific timeframe is designated as the period for potential variation identification. Employing three distinct methods for trend analysis and identifying variation points for each hydrological element enhances the comparability of outcomes and bolsters the precision of conclusions drawn.
Author Contributions
C.S. analyzed and interpreted the data and was a major contributor in writing the manuscript. F.Z., Y.W., C.Y., F.W. and X.Z. performed the calculation of the model. All authors have read and agreed to the published version of the manuscript.
Funding
This research was supported by project No. LZJWY22D010003 of the Joint Funds of the Zhejiang Provincial Natural Science Foundation of China under Grant, project No. FZJZSYS21010 of the Open Research Fund of the Key Laboratory of Hydraulic Disaster Prevention and Mitigation of Zhejiang Province and supported by the project No.RC2022020681 of the Nanxun Scholars Program for Young Scholars of ZJWEU. The first author is also grateful for receiving funding from the China Scholarship Council, whose file No. is 202208330313.
Data Availability Statement
The original contributions presented in this study are included in the article; further inquiries can be directed to the corresponding author.
Conflicts of Interest
The authors declare no conflicts of interest.
References
- Douglas, E.M.; Vogel, R.M.; Kroll, C.N. Trends in floods and low flows in the United States: Impact of spatial correlation. J. Hydrol. 2000, 240, 90–105. [Google Scholar] [CrossRef]
- Intergovernmental Panel on Climate Change. Fifth Assessment Report: Repod of IPCC; IPCC: Stockholm, Sweden, 2013. [Google Scholar]
- Li, J.; Feng, P. Runoff variations in the Luanhe River Basin during 1956–2002. J. Geogr. Sci. 2007, 17, 339–350. [Google Scholar] [CrossRef]
- Shan, C.; Guo, H.; Dong, Z.; Liu, L.; Lu, D.; Hu, J.; Feng, Y. Study on the river habitat quality in Luanhe based on the eco-hydrodynamic model. Ecol. Indic. 2022, 142, 109262. [Google Scholar] [CrossRef]
- Andreo, B.; Jiménez, P.; Durán, J.J.; Carrasco, F.; Vadillo, I.; Mangin, A. Climatic and hydrological variations during the last 117–166 years in the south of the Iberian Peninsula, from spectral and correlation analyses and continuous wavelet analyses. J. Hydrol. 2006, 324, 24–39. [Google Scholar] [CrossRef]
- Pekarova, P.; Pekar, J. Long-term discharge prediction for the Turnu Severin station (the Danube) using a linear autoregressive model. Hydrol. Process. Int. J. 2006, 20, 1217–1228. [Google Scholar] [CrossRef]
- Yigong, T. Human action influence on the runoff in Luanhe river basin. J. Shanxi Norm. Univ. 1995, 2, 125–126. Available online: https://kns.cnki.net/kcms2/article/abstract?v=IILC1c-FiAHzuOY15H11LXr3Bxn5_bHBpv8jfhUFwo56x_9DZJj0OaJGVNuxISLC2X4bWlJVy8biRrAwEa4ypwjkY_kewh8hTDmt6POoWyq-EoSDID5bA6Y3wtT0xCMp6mntSjWZO8U=&uniplatform=NZKPT&language=CHS (accessed on 1 November 2023). (In Chinese).
- Li, H.; Song, X.; Zhou, Y. Effects of water and soil conservation on runoff and sediment in Luanhe river basin (2). Haihe Water Resour. 2002, 2, 23–25. [Google Scholar]
- Fan, G.; Lu, S.; Cheng, G. Simulation of influence of climate change on water resources over Luanhe river valley using a hydrological model (II): Simulated result analyses. Plateau Meteorol. 2001, 20, 302–310. [Google Scholar]
- Zhai, R.; Tao, F. Contributions of climate change and human activities to runoff change in seven typical catchments across China. Sci. Total Environ. 2017, 605, 219–229. [Google Scholar] [CrossRef] [PubMed]
- Shen, L.; Dou, M.; Xia, R.; Li, G.; Yang, B. Effects of hydrological change on the risk of riverine algal blooms: Case study in the mid-downstream of the Han River in China. Environ. Sci. Pollut. Res. 2021, 28, 19851–19865. [Google Scholar] [CrossRef] [PubMed]
- Taylor, J.M. Kendall’s and Spearman’s correlation coefficients in the presence of a blocking variable. Biometrics 1987, 43, 409–416. [Google Scholar] [CrossRef] [PubMed]
- Yue, S.; Pilon, P.; Cavadias, G. Power of the Mann–Kendall and Spearman’s rho tests for detecting monotonic trends in hydrological series. J. Hydrol. 2002, 259, 254–271. [Google Scholar] [CrossRef]
- Hamed, K.H.; Rao, A.R. A modified Mann-Kendall trend test for autocorrelated data. J. Hydrol. 1998, 204, 182–196. [Google Scholar] [CrossRef]
- Ingri, J.; Widerlund, A.; Land, M. Geochemistry of major elements in a pristine boreal river system; hydrological compartments and flow paths. Aquat. Geochem. 2005, 11, 57–88. [Google Scholar] [CrossRef]
- Argiriou, A.A.; Li, Z.; Armaos, V.; Mamara, A.; Shi, Y.; Yan, Z. Homogenised monthly and daily temperature and precipitation time series in China and Greece since 1960. Adv. Atmos. Sci. 2023, 40, 1326–1336. [Google Scholar] [CrossRef]
- Spearman, C. The Proof and Measurement of Association between Two Things; American Psychological Association: Washington, DC, USA, 1961. [Google Scholar]
- Lehman, A. JMP for Basic Univariate and Multivariate Statistics: A Step-by-Step Guide; SAS Institute Inc.: Cary, NC, USA, 2005. [Google Scholar]
- Zhang, X.; Liu, Y.; Zhu, Y.; Ma, Q.; Philippe, G.; Qu, Y.; Yin, H. Probabilistic analysis on the influences of heatwaves during the onset of flash droughts over China. Hydrol. Res. 2023, 54, 869–884. [Google Scholar] [CrossRef]
Figure 1.
Location of Luanhe River Basin.
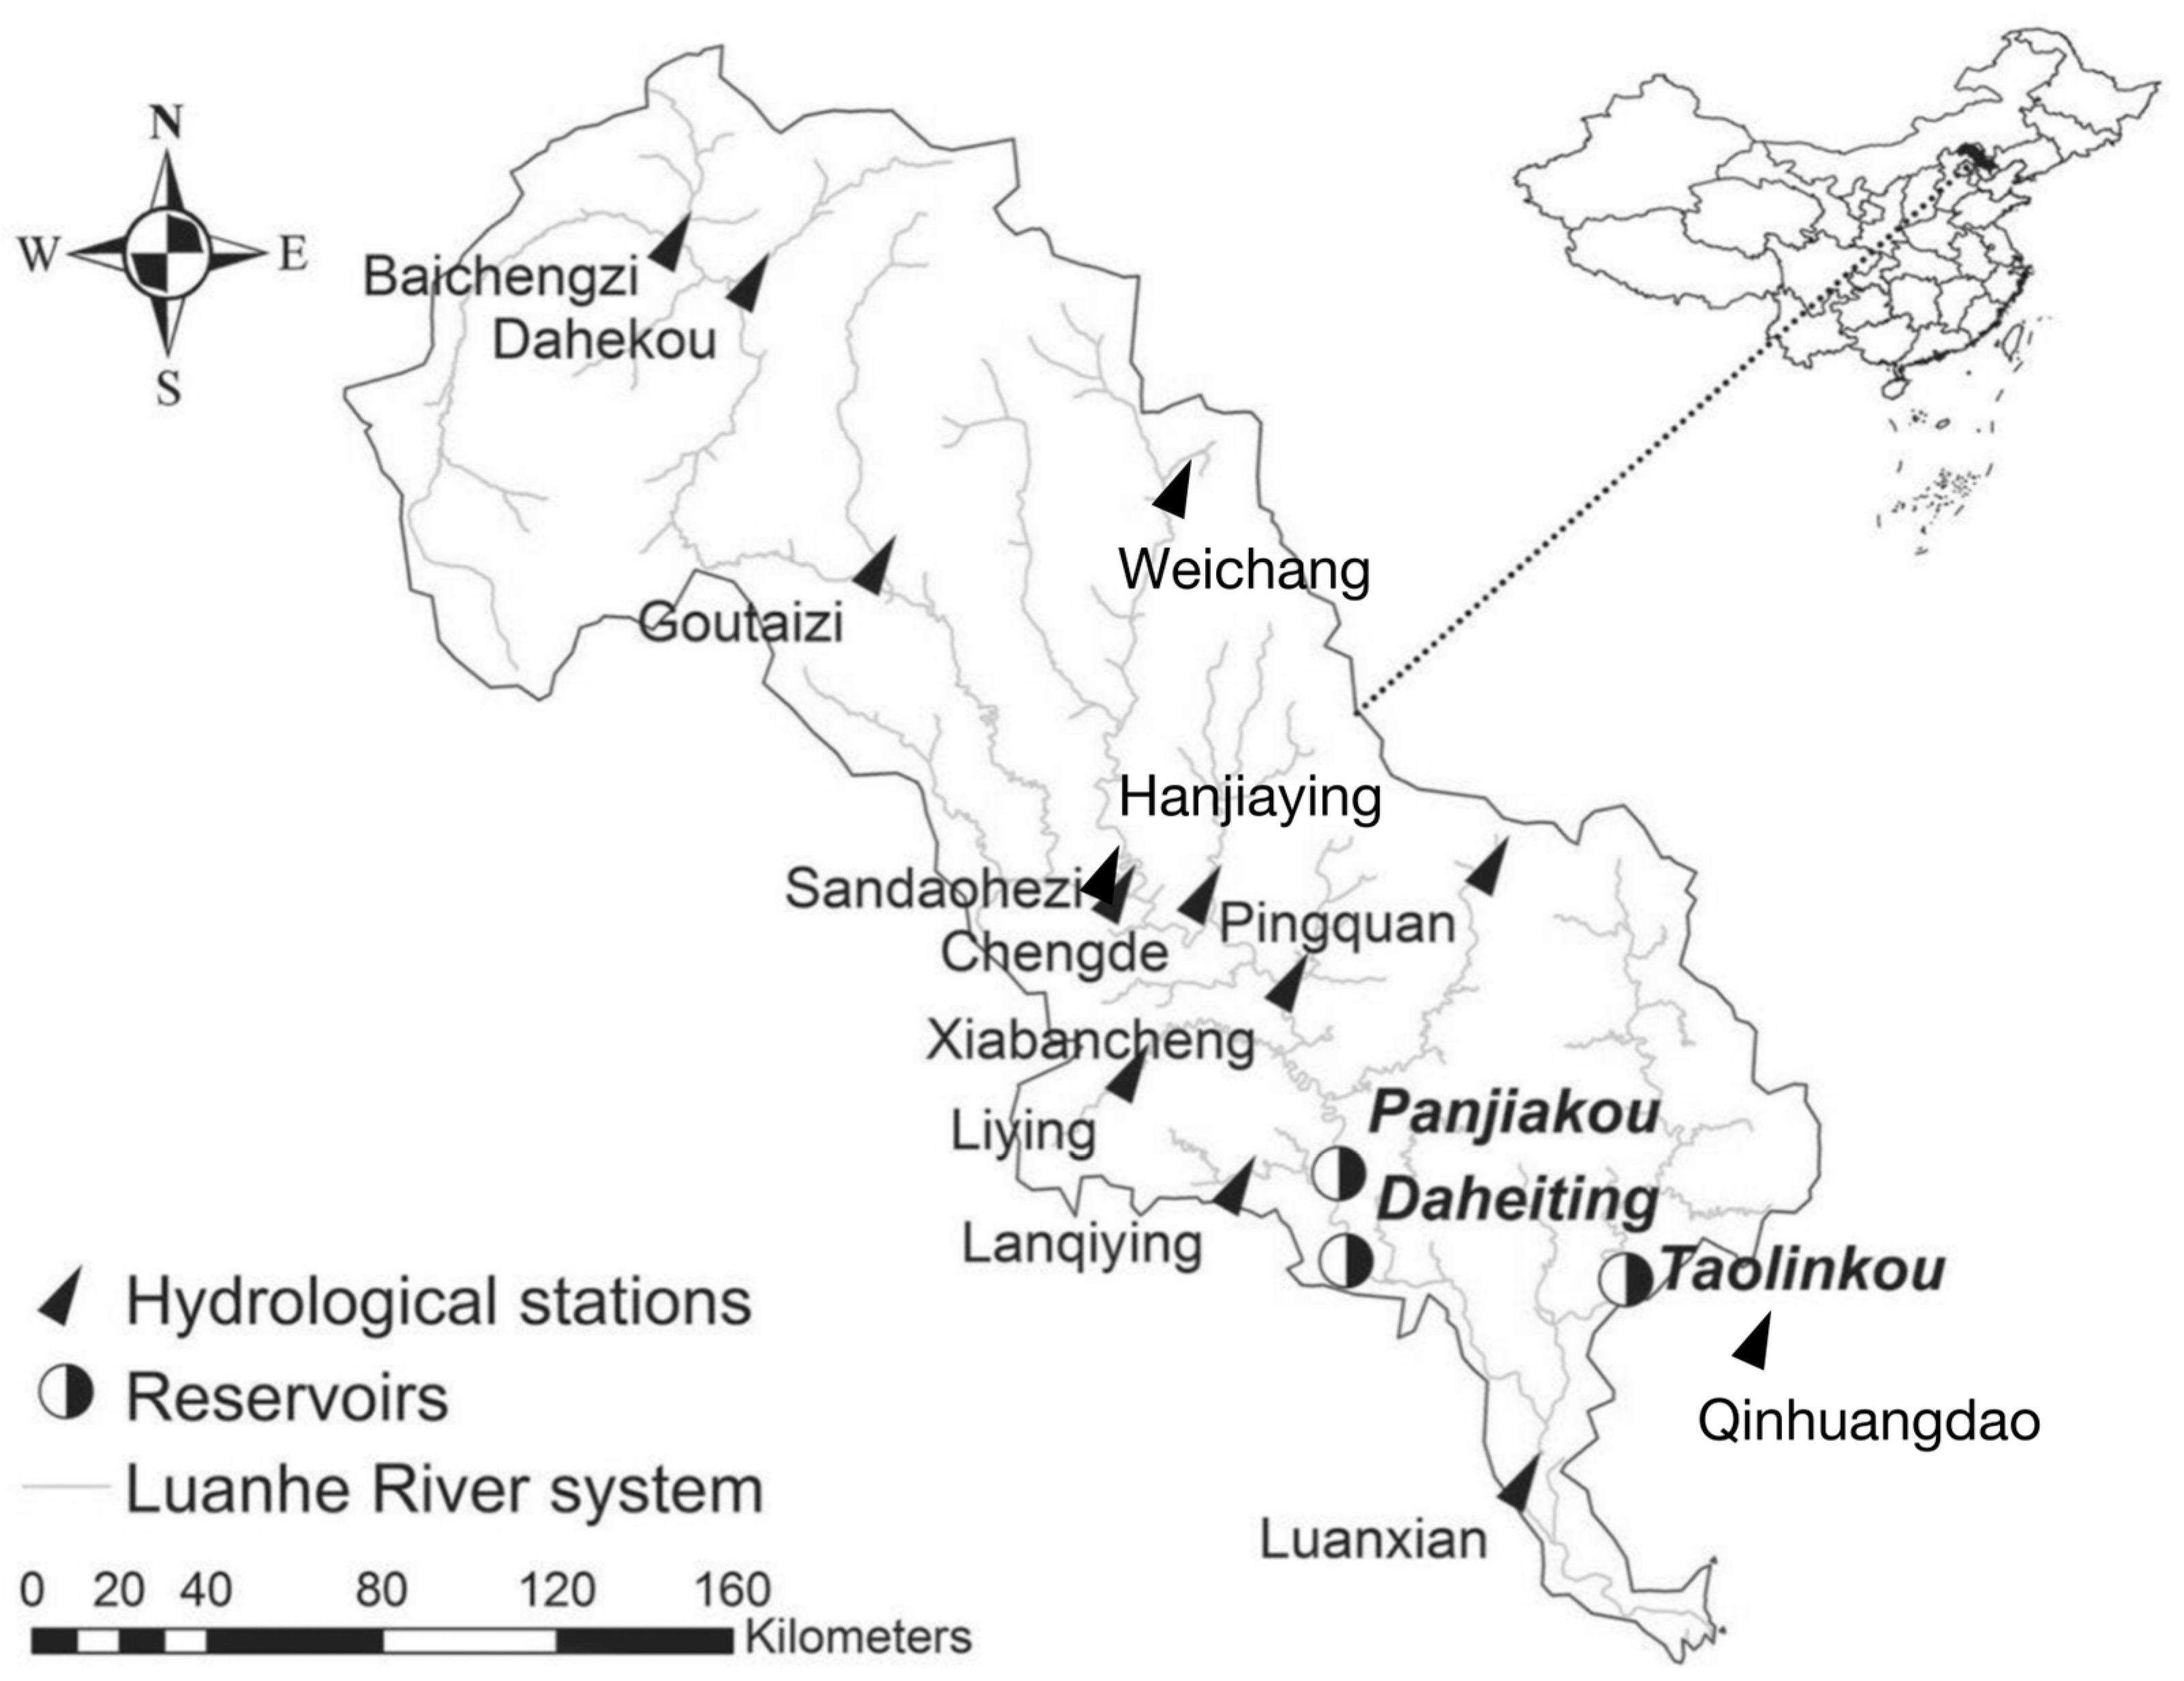
Figure 2.
Trend analysis of precipitation at Weichang station.
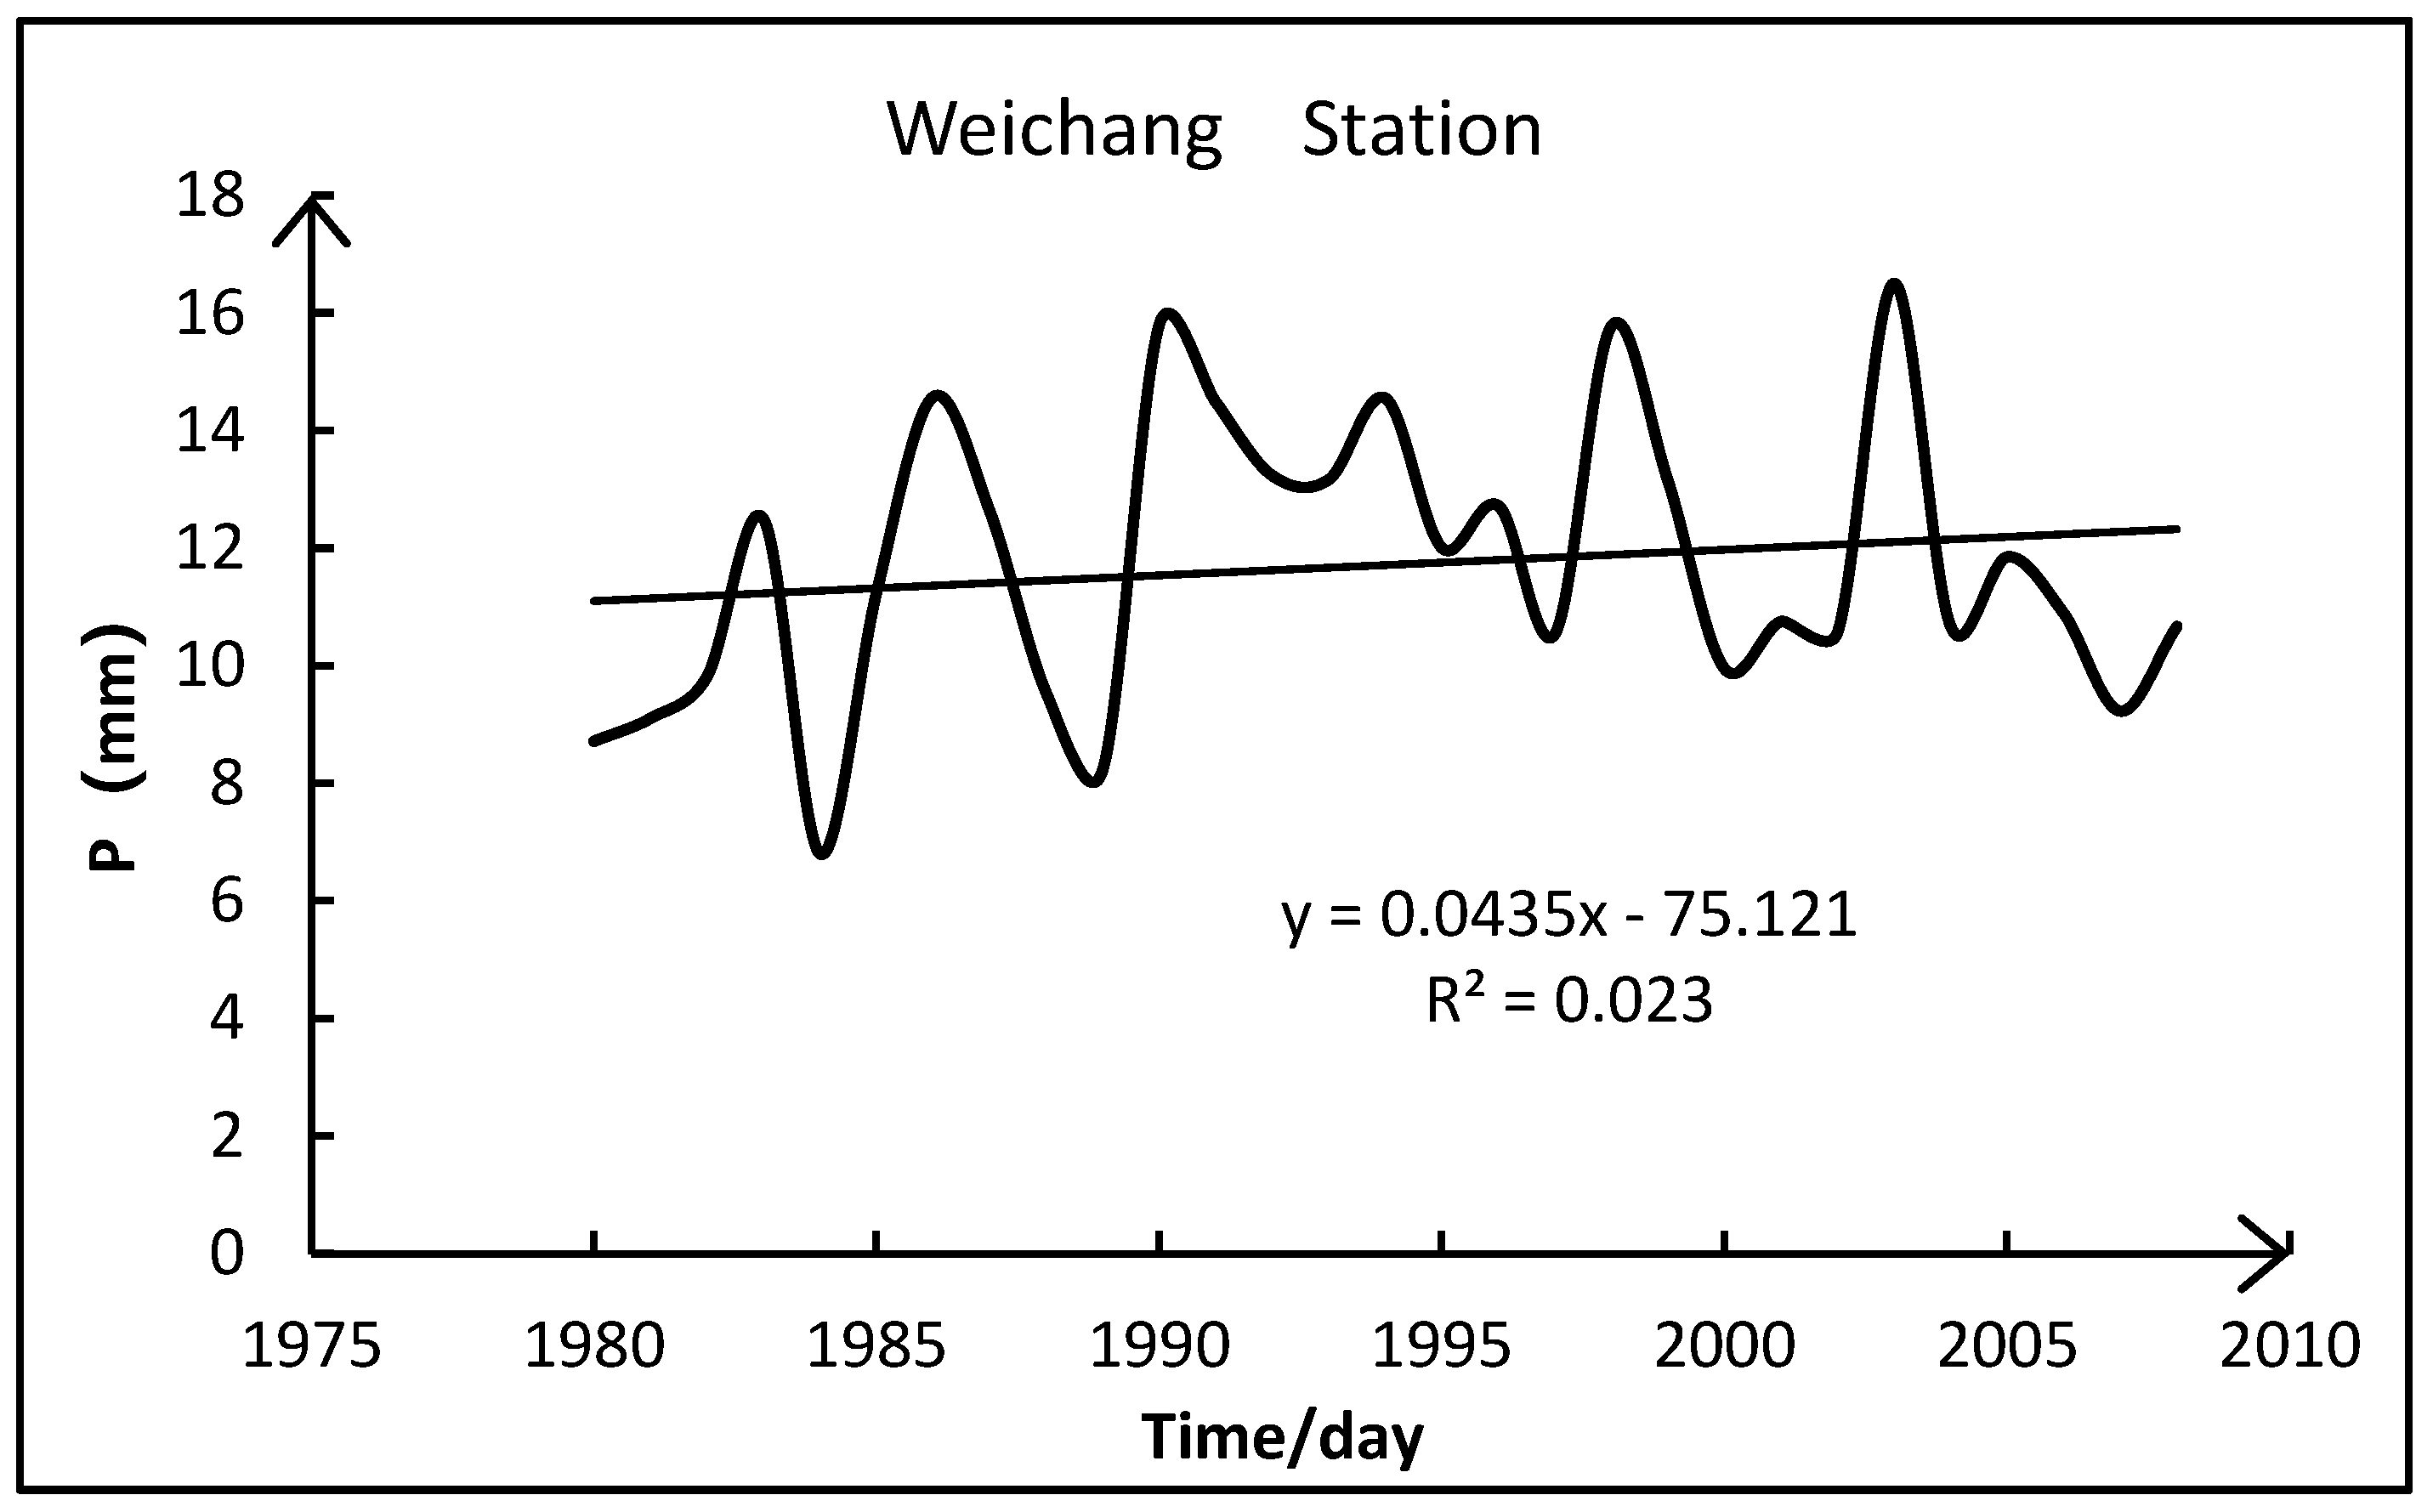
Figure 3.
Trend analysis of precipitation at Chengde Station.
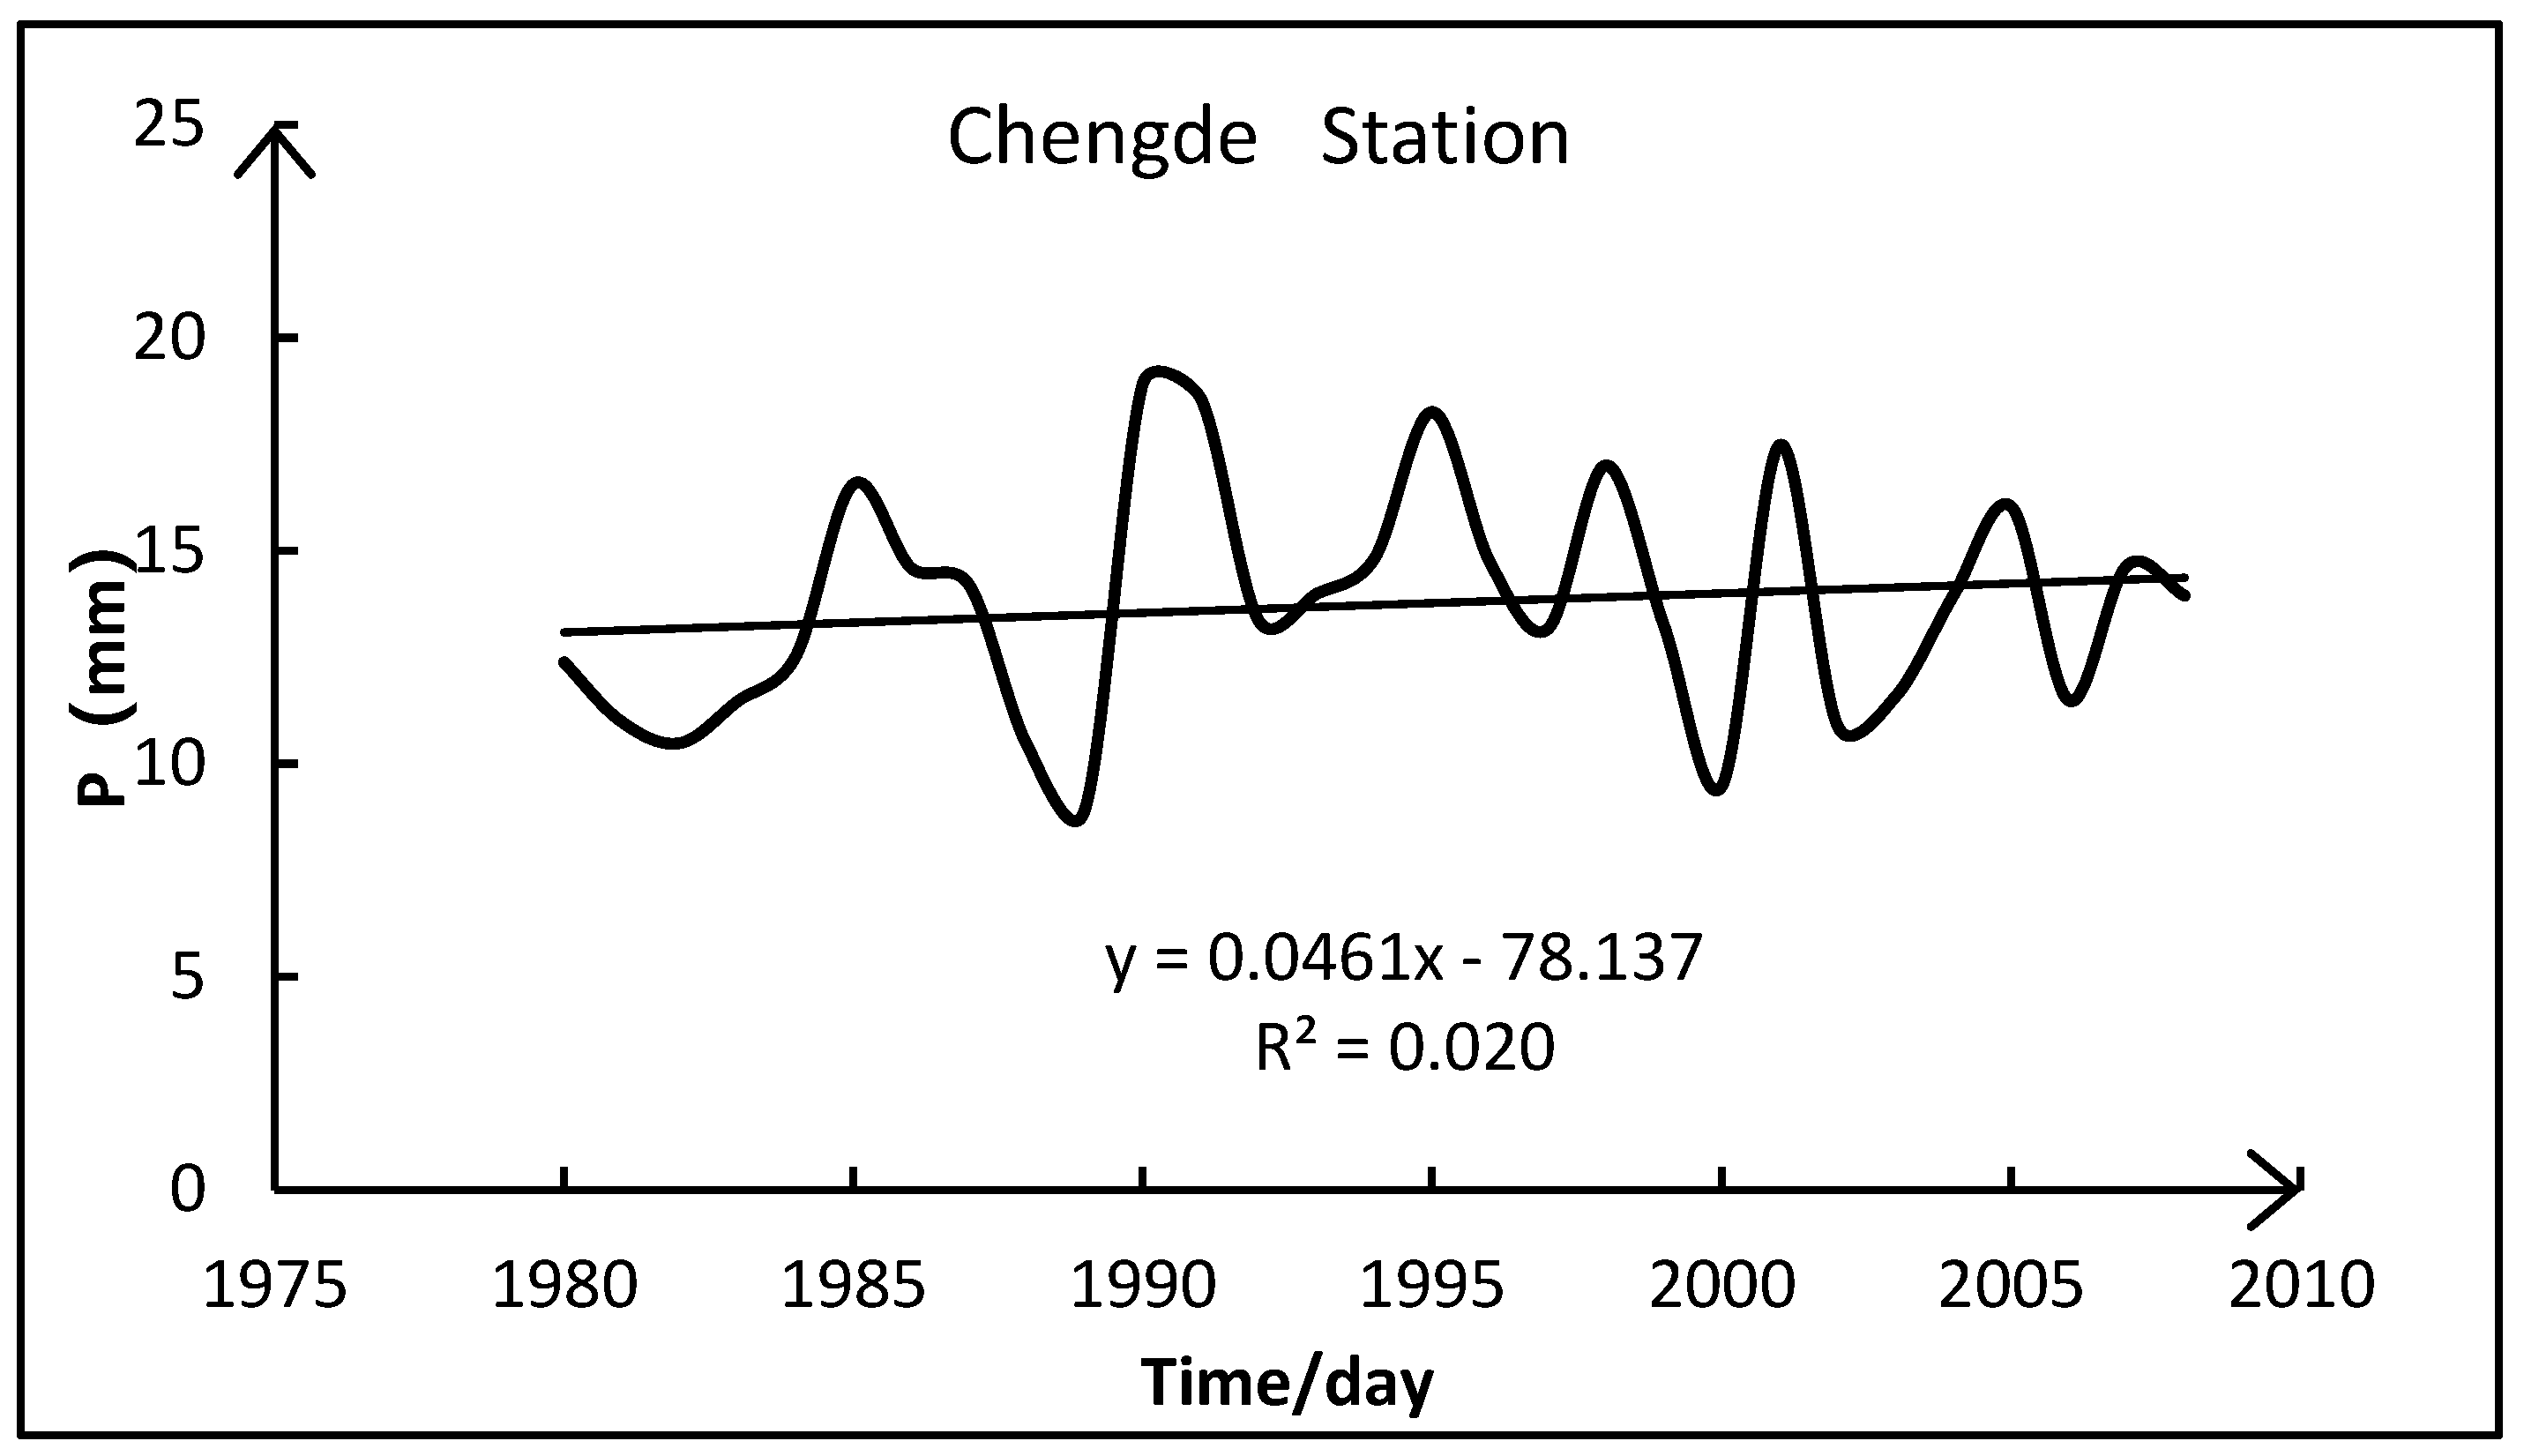
Figure 4.
Trend analysis of precipitation at Qinhuangdao Station.
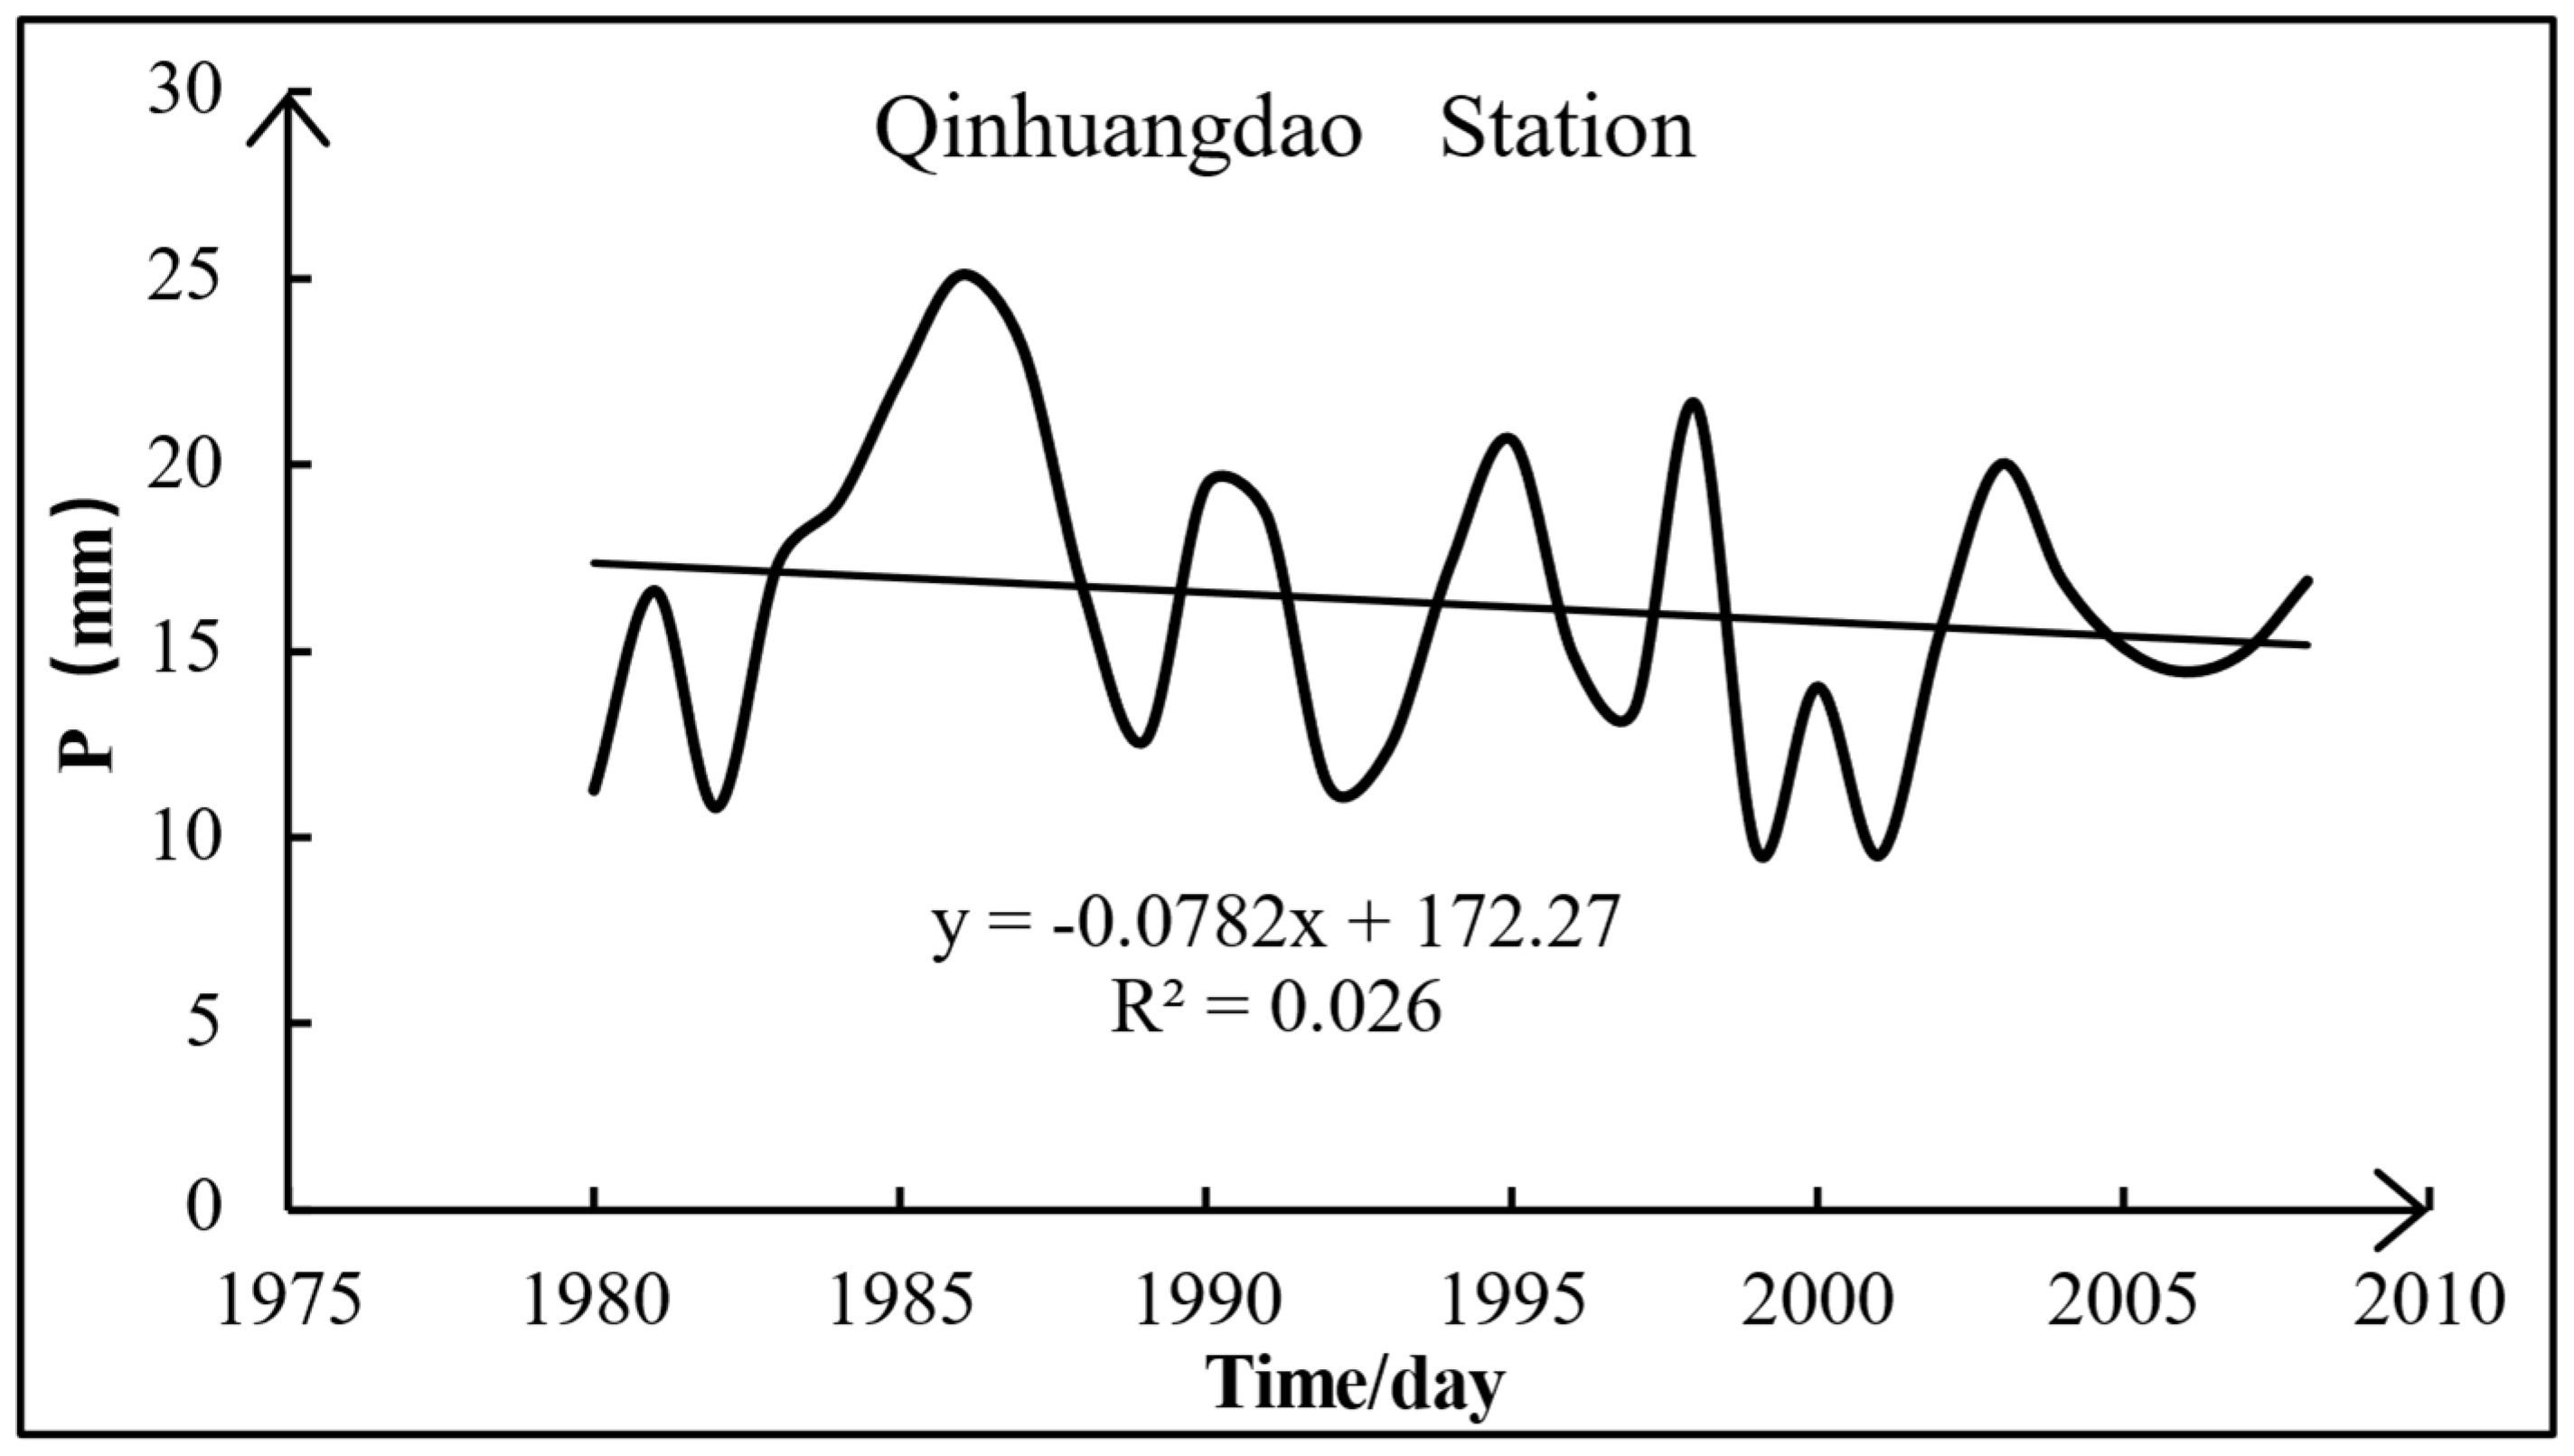
Figure 5.
M-K analysis for the annual precipitation at Weichang station.
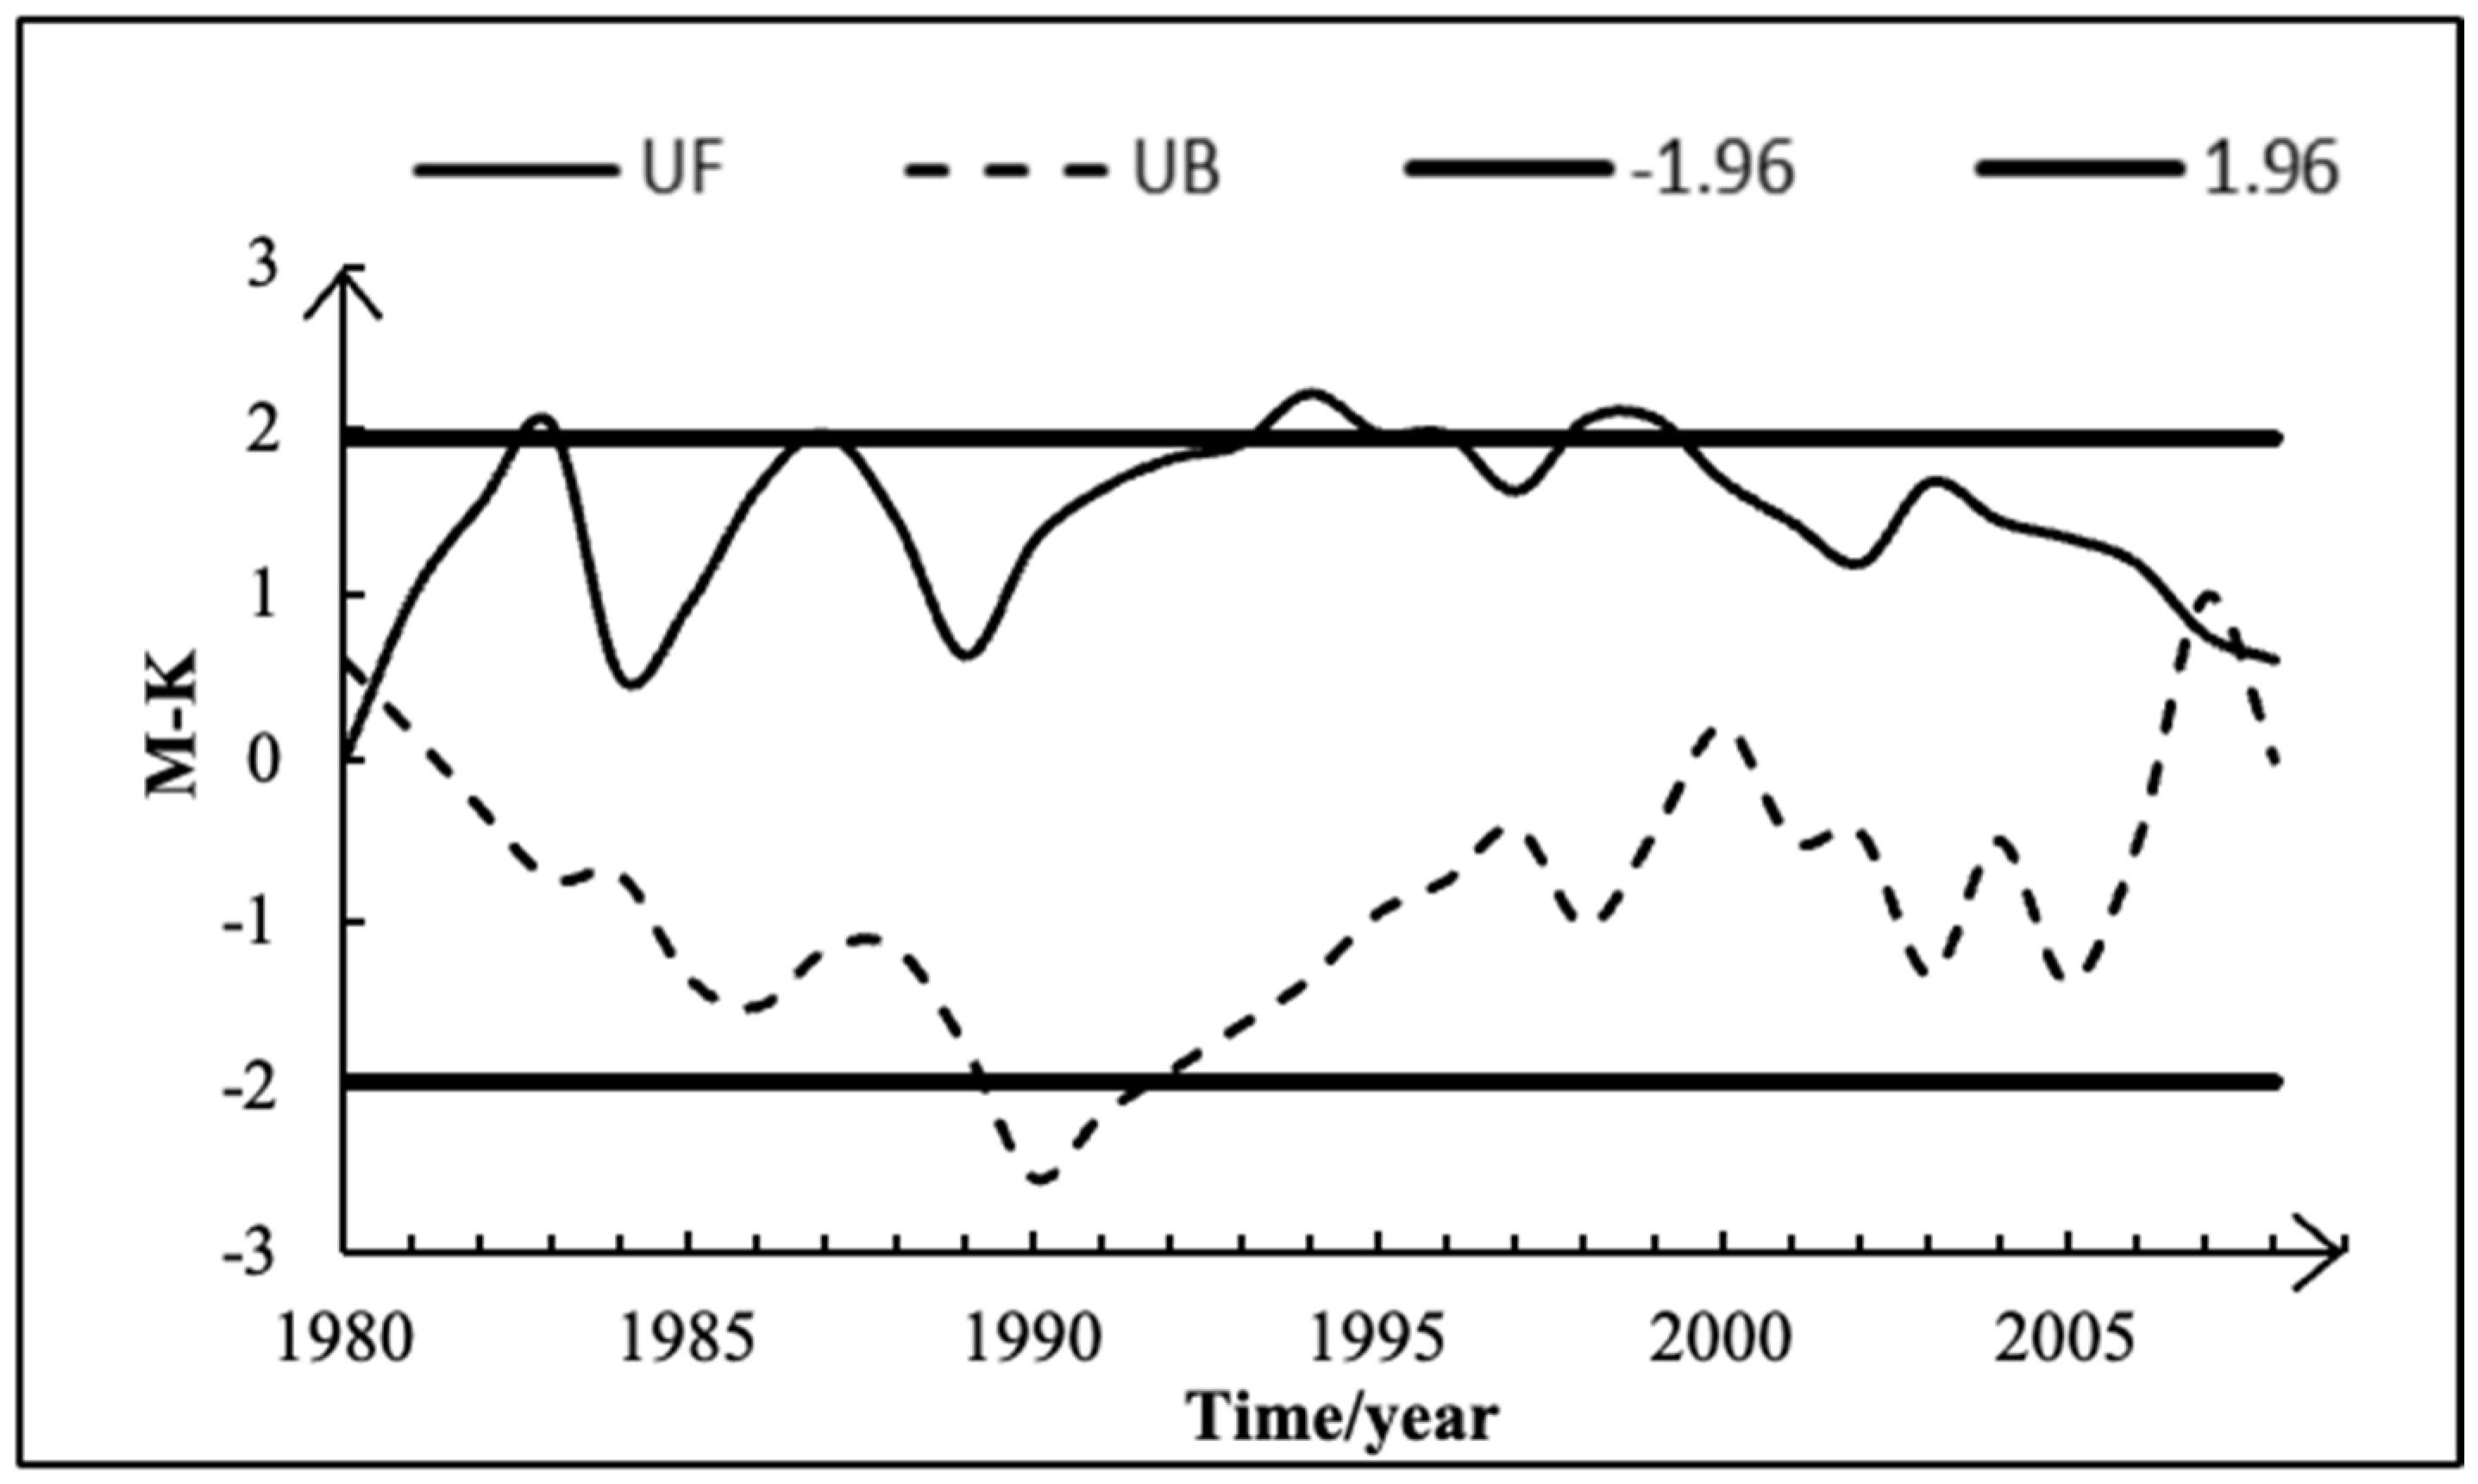
Figure 6.
M-K analysis for the annual precipitation at Chengde Station.
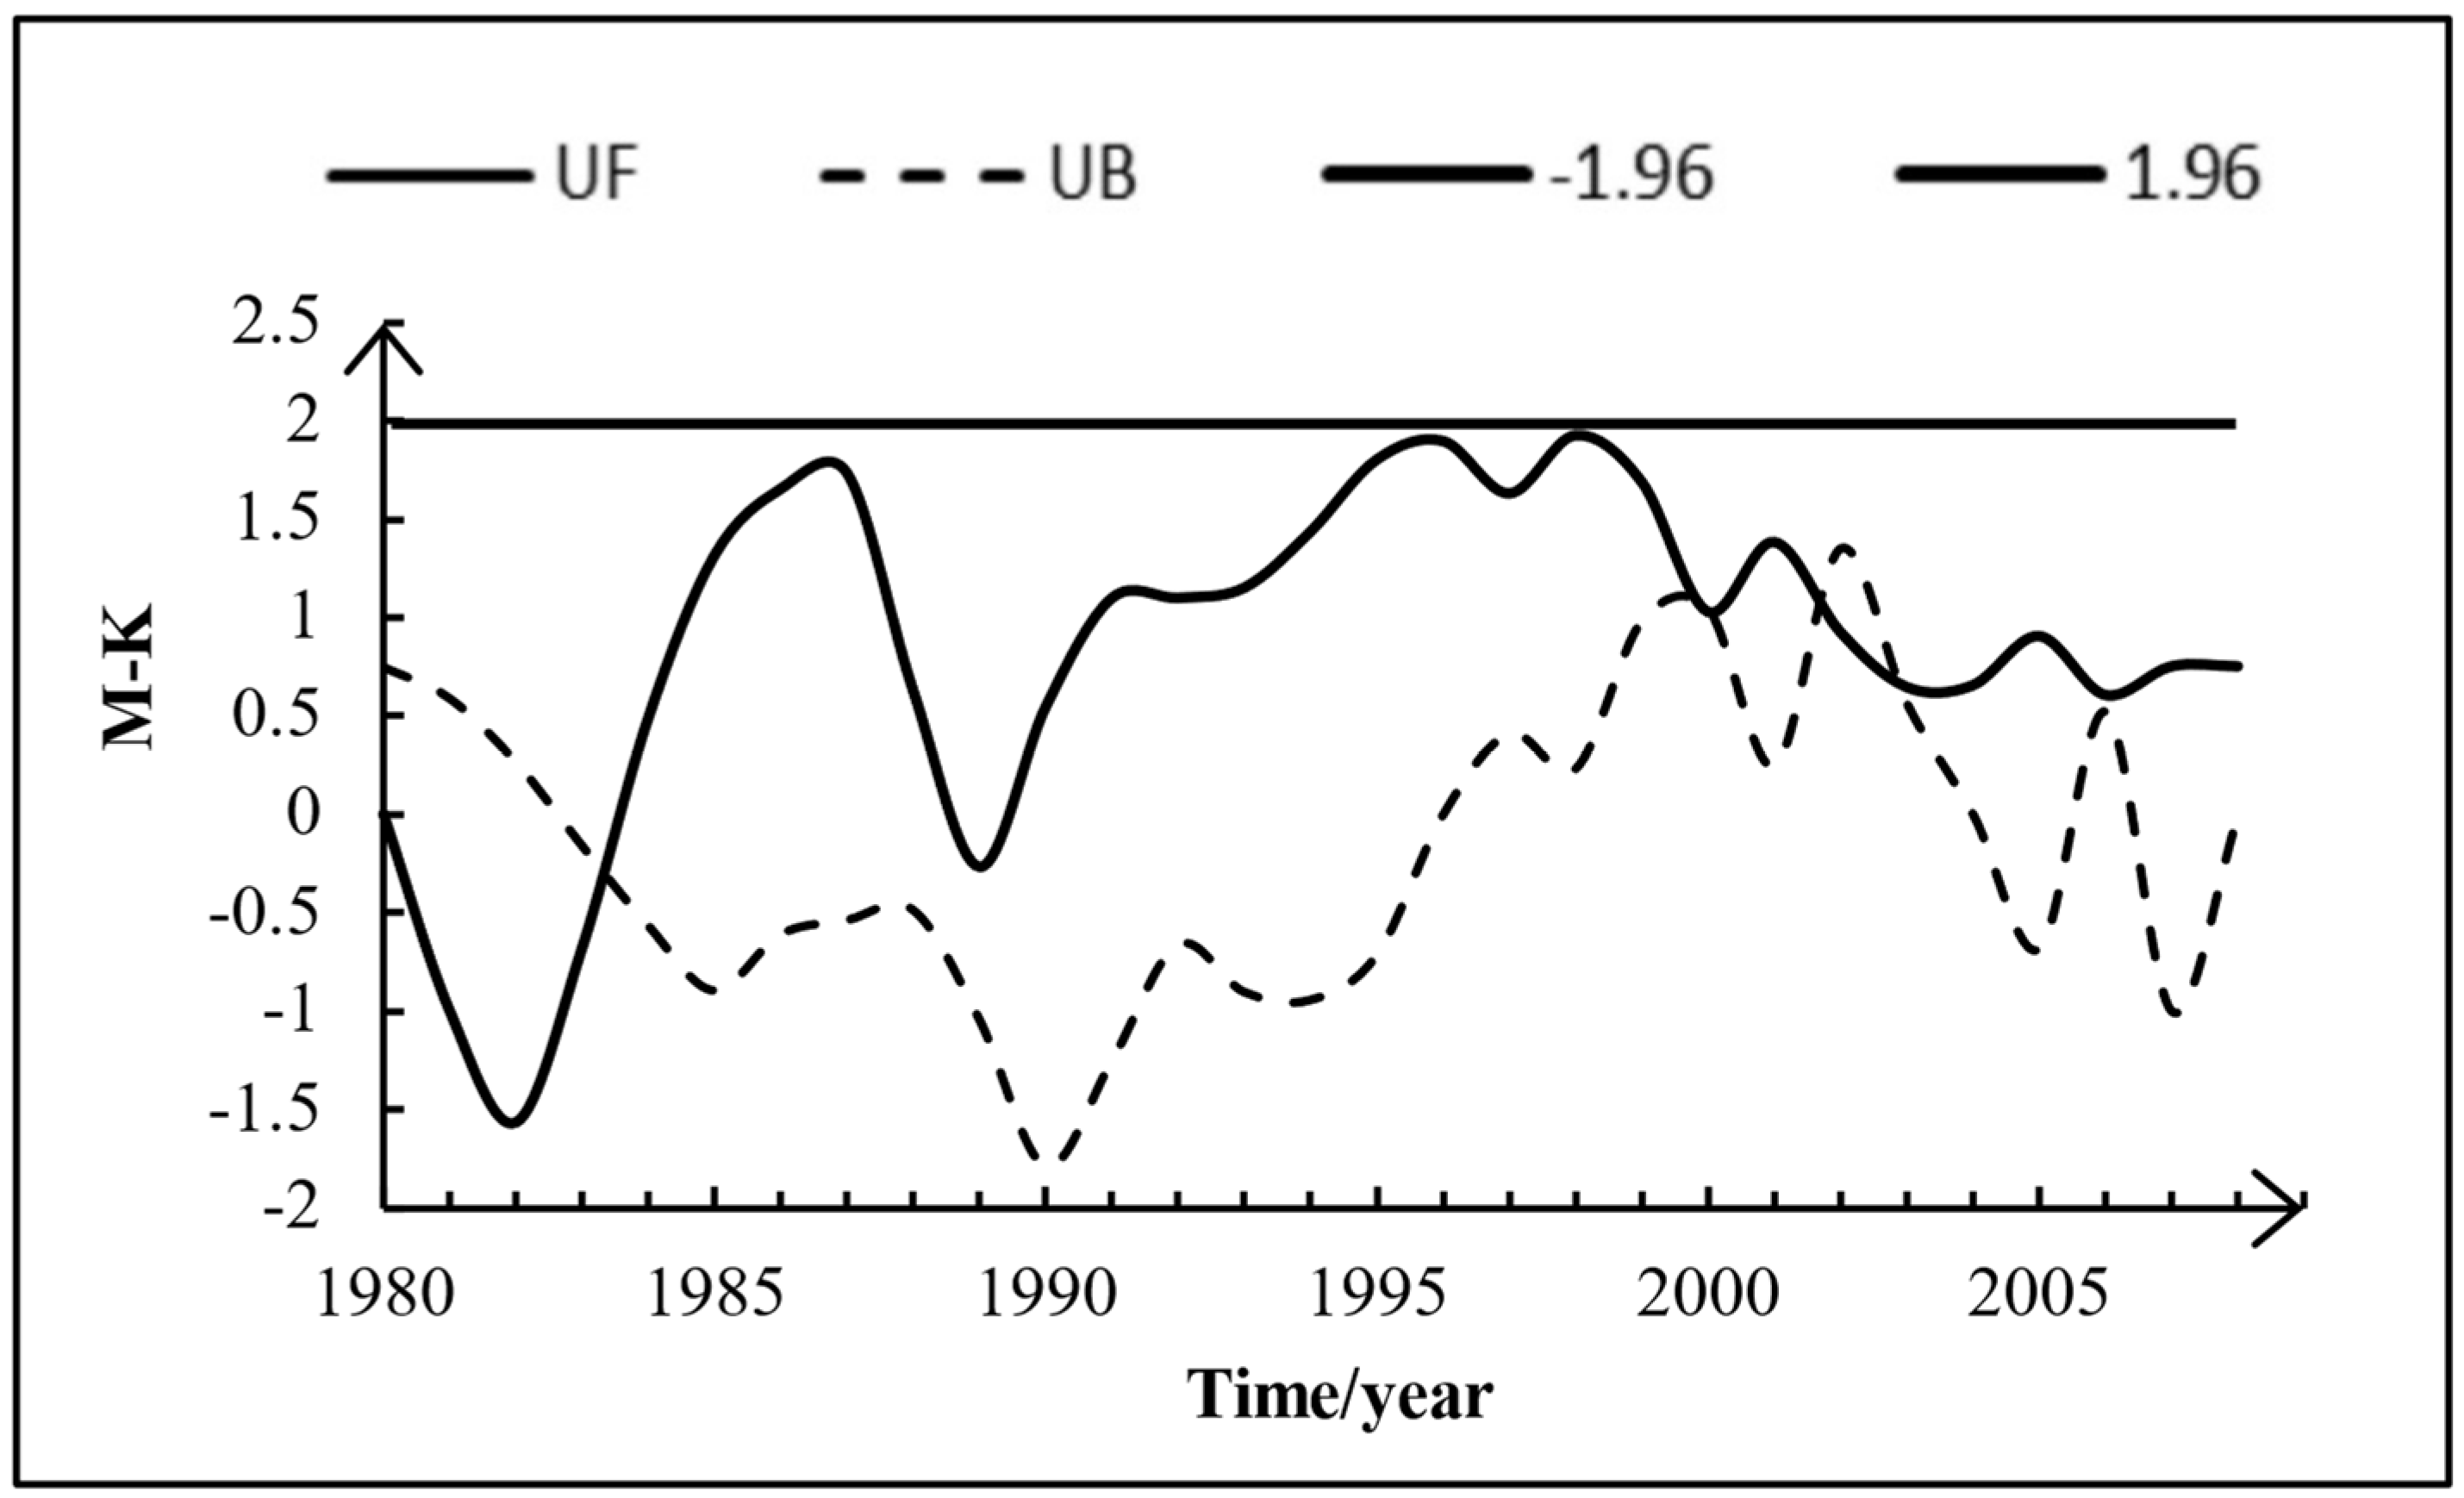
Figure 7.
M-K analysis for the annual precipitation at Qinhuangdao Station.

Figure 8.
MWP method analysis for the annual precipitation at Weichang station.

Figure 9.
MWP method analysis for the annual precipitation at Qinhuangdao Station.

Figure 10.
MWP method analysis for the annual precipitation at Chengde station.
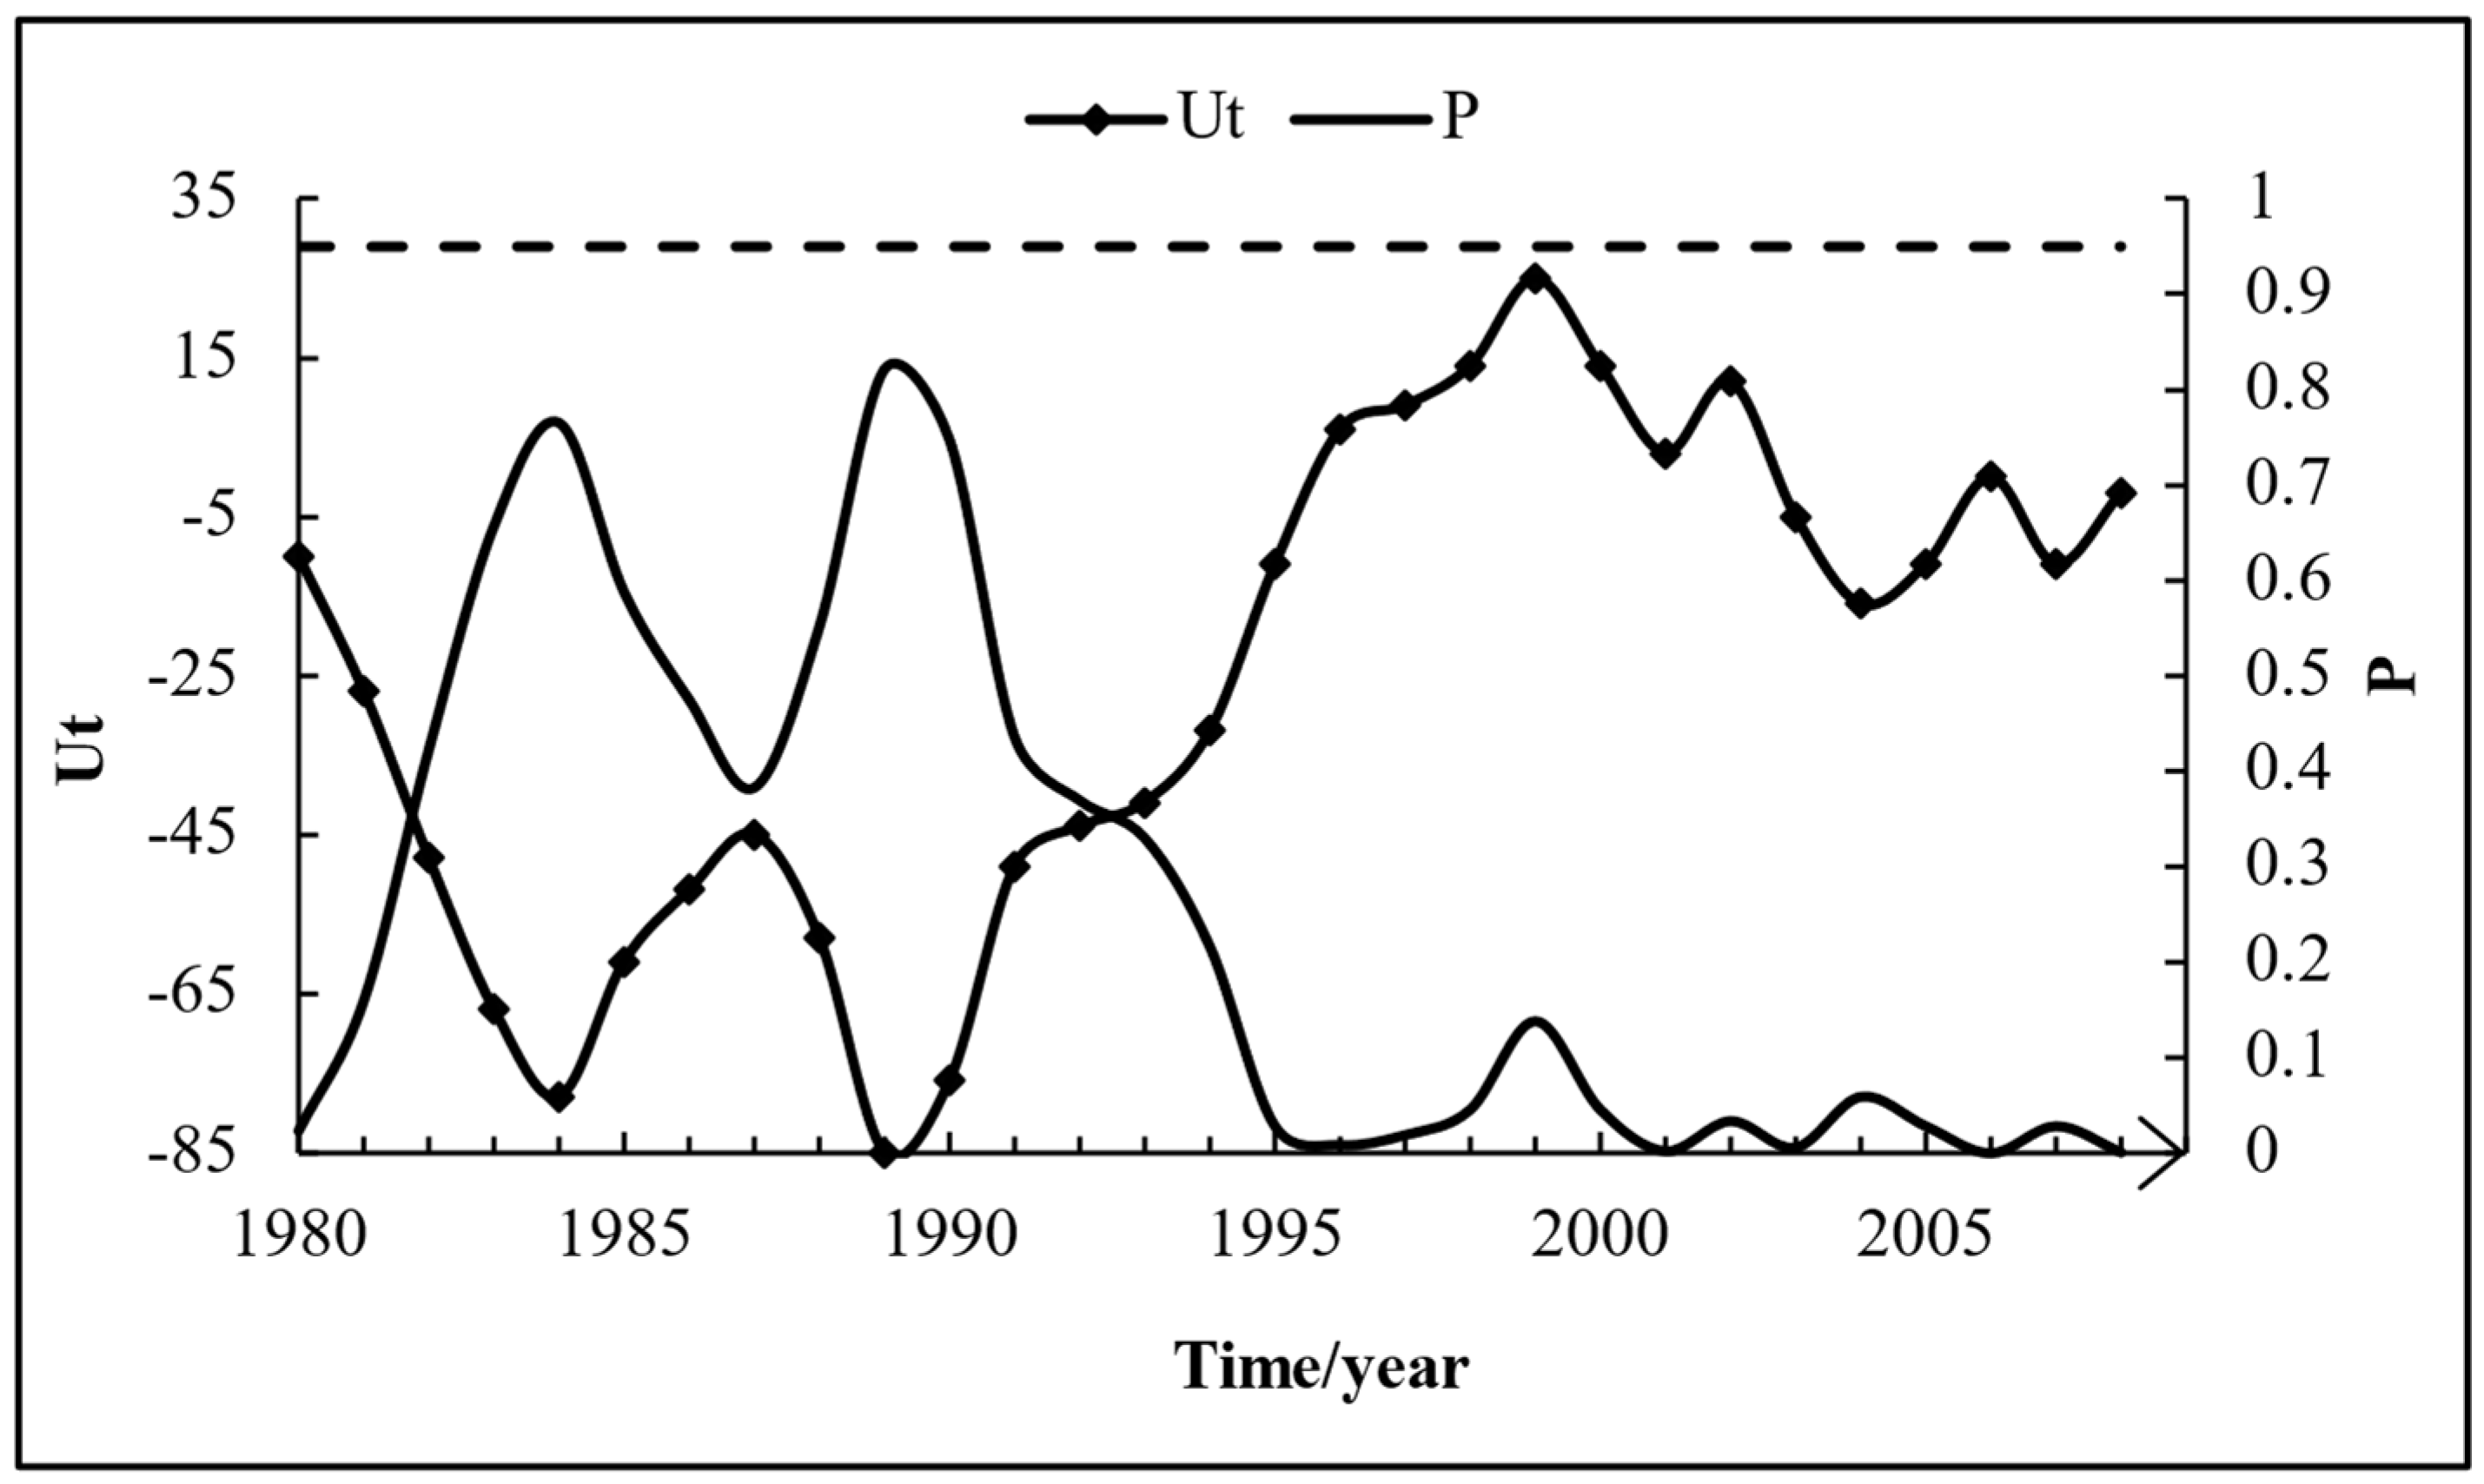
Figure 11.
Trend analysis of runoff at Hanjiaying Station.
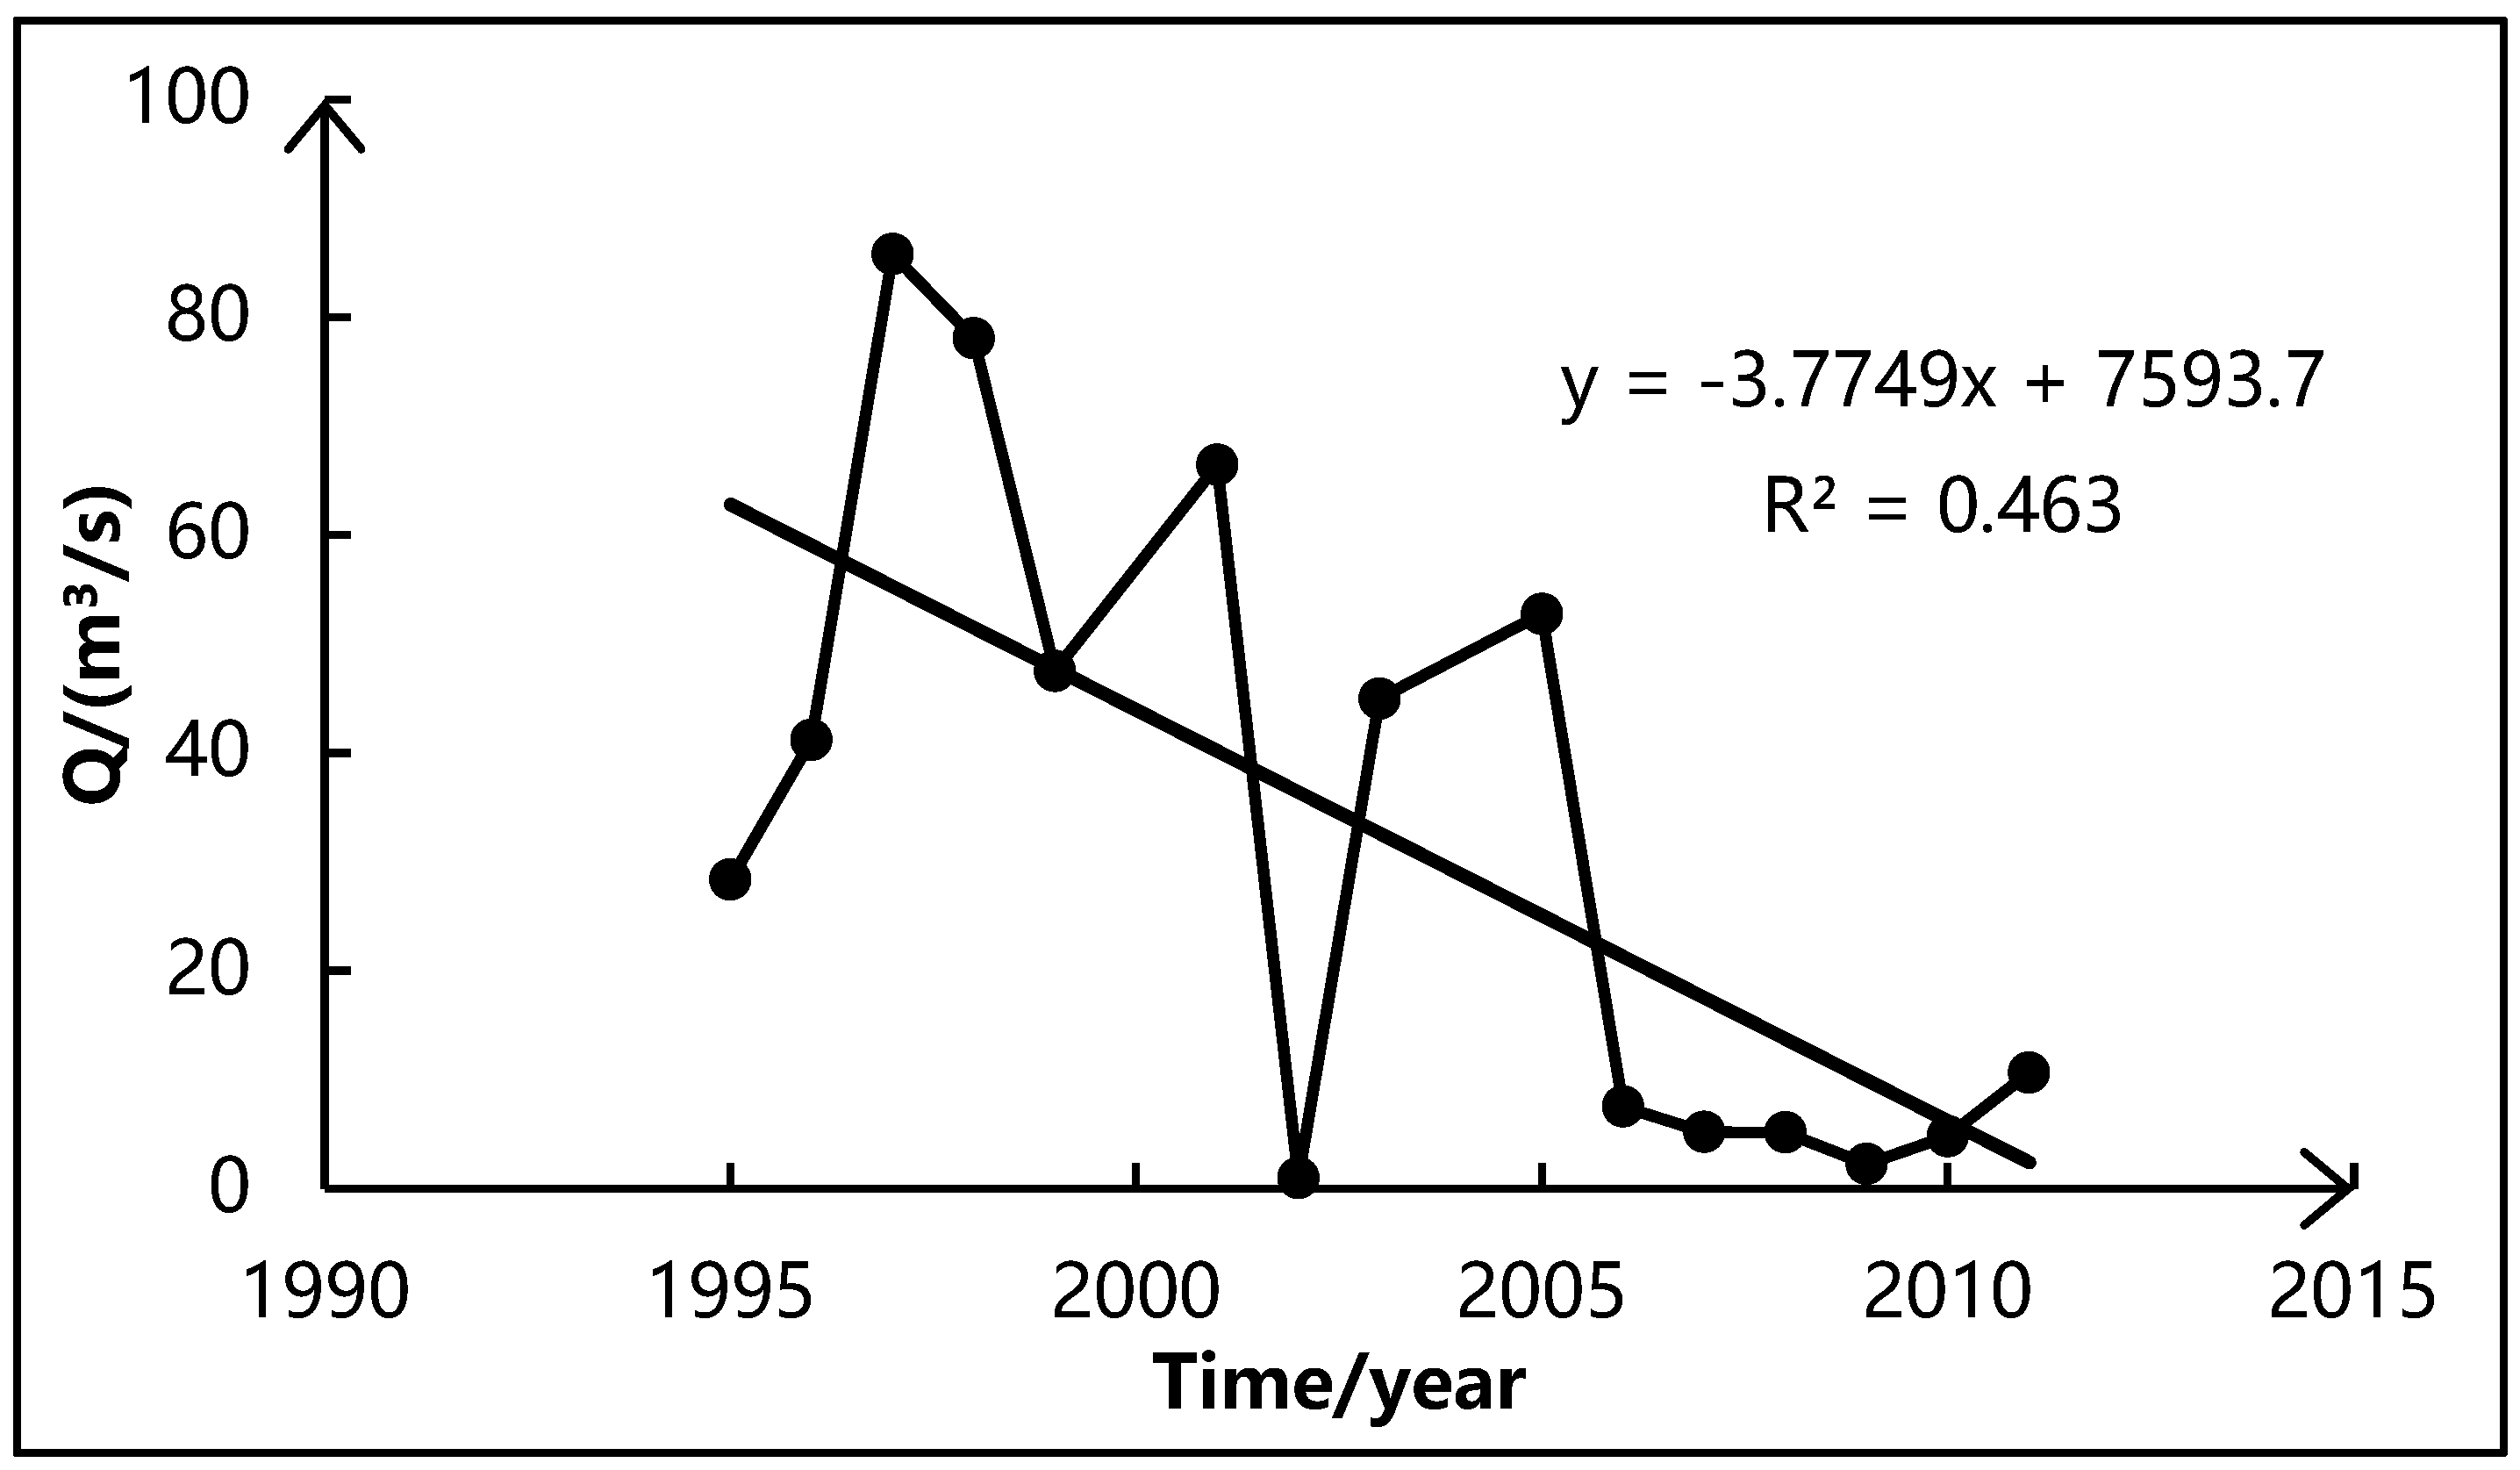
Figure 12.
Trend analysis of runoff at Sandaohezi Station.

Figure 13.
Trend analysis of runoff at Chengde Station.
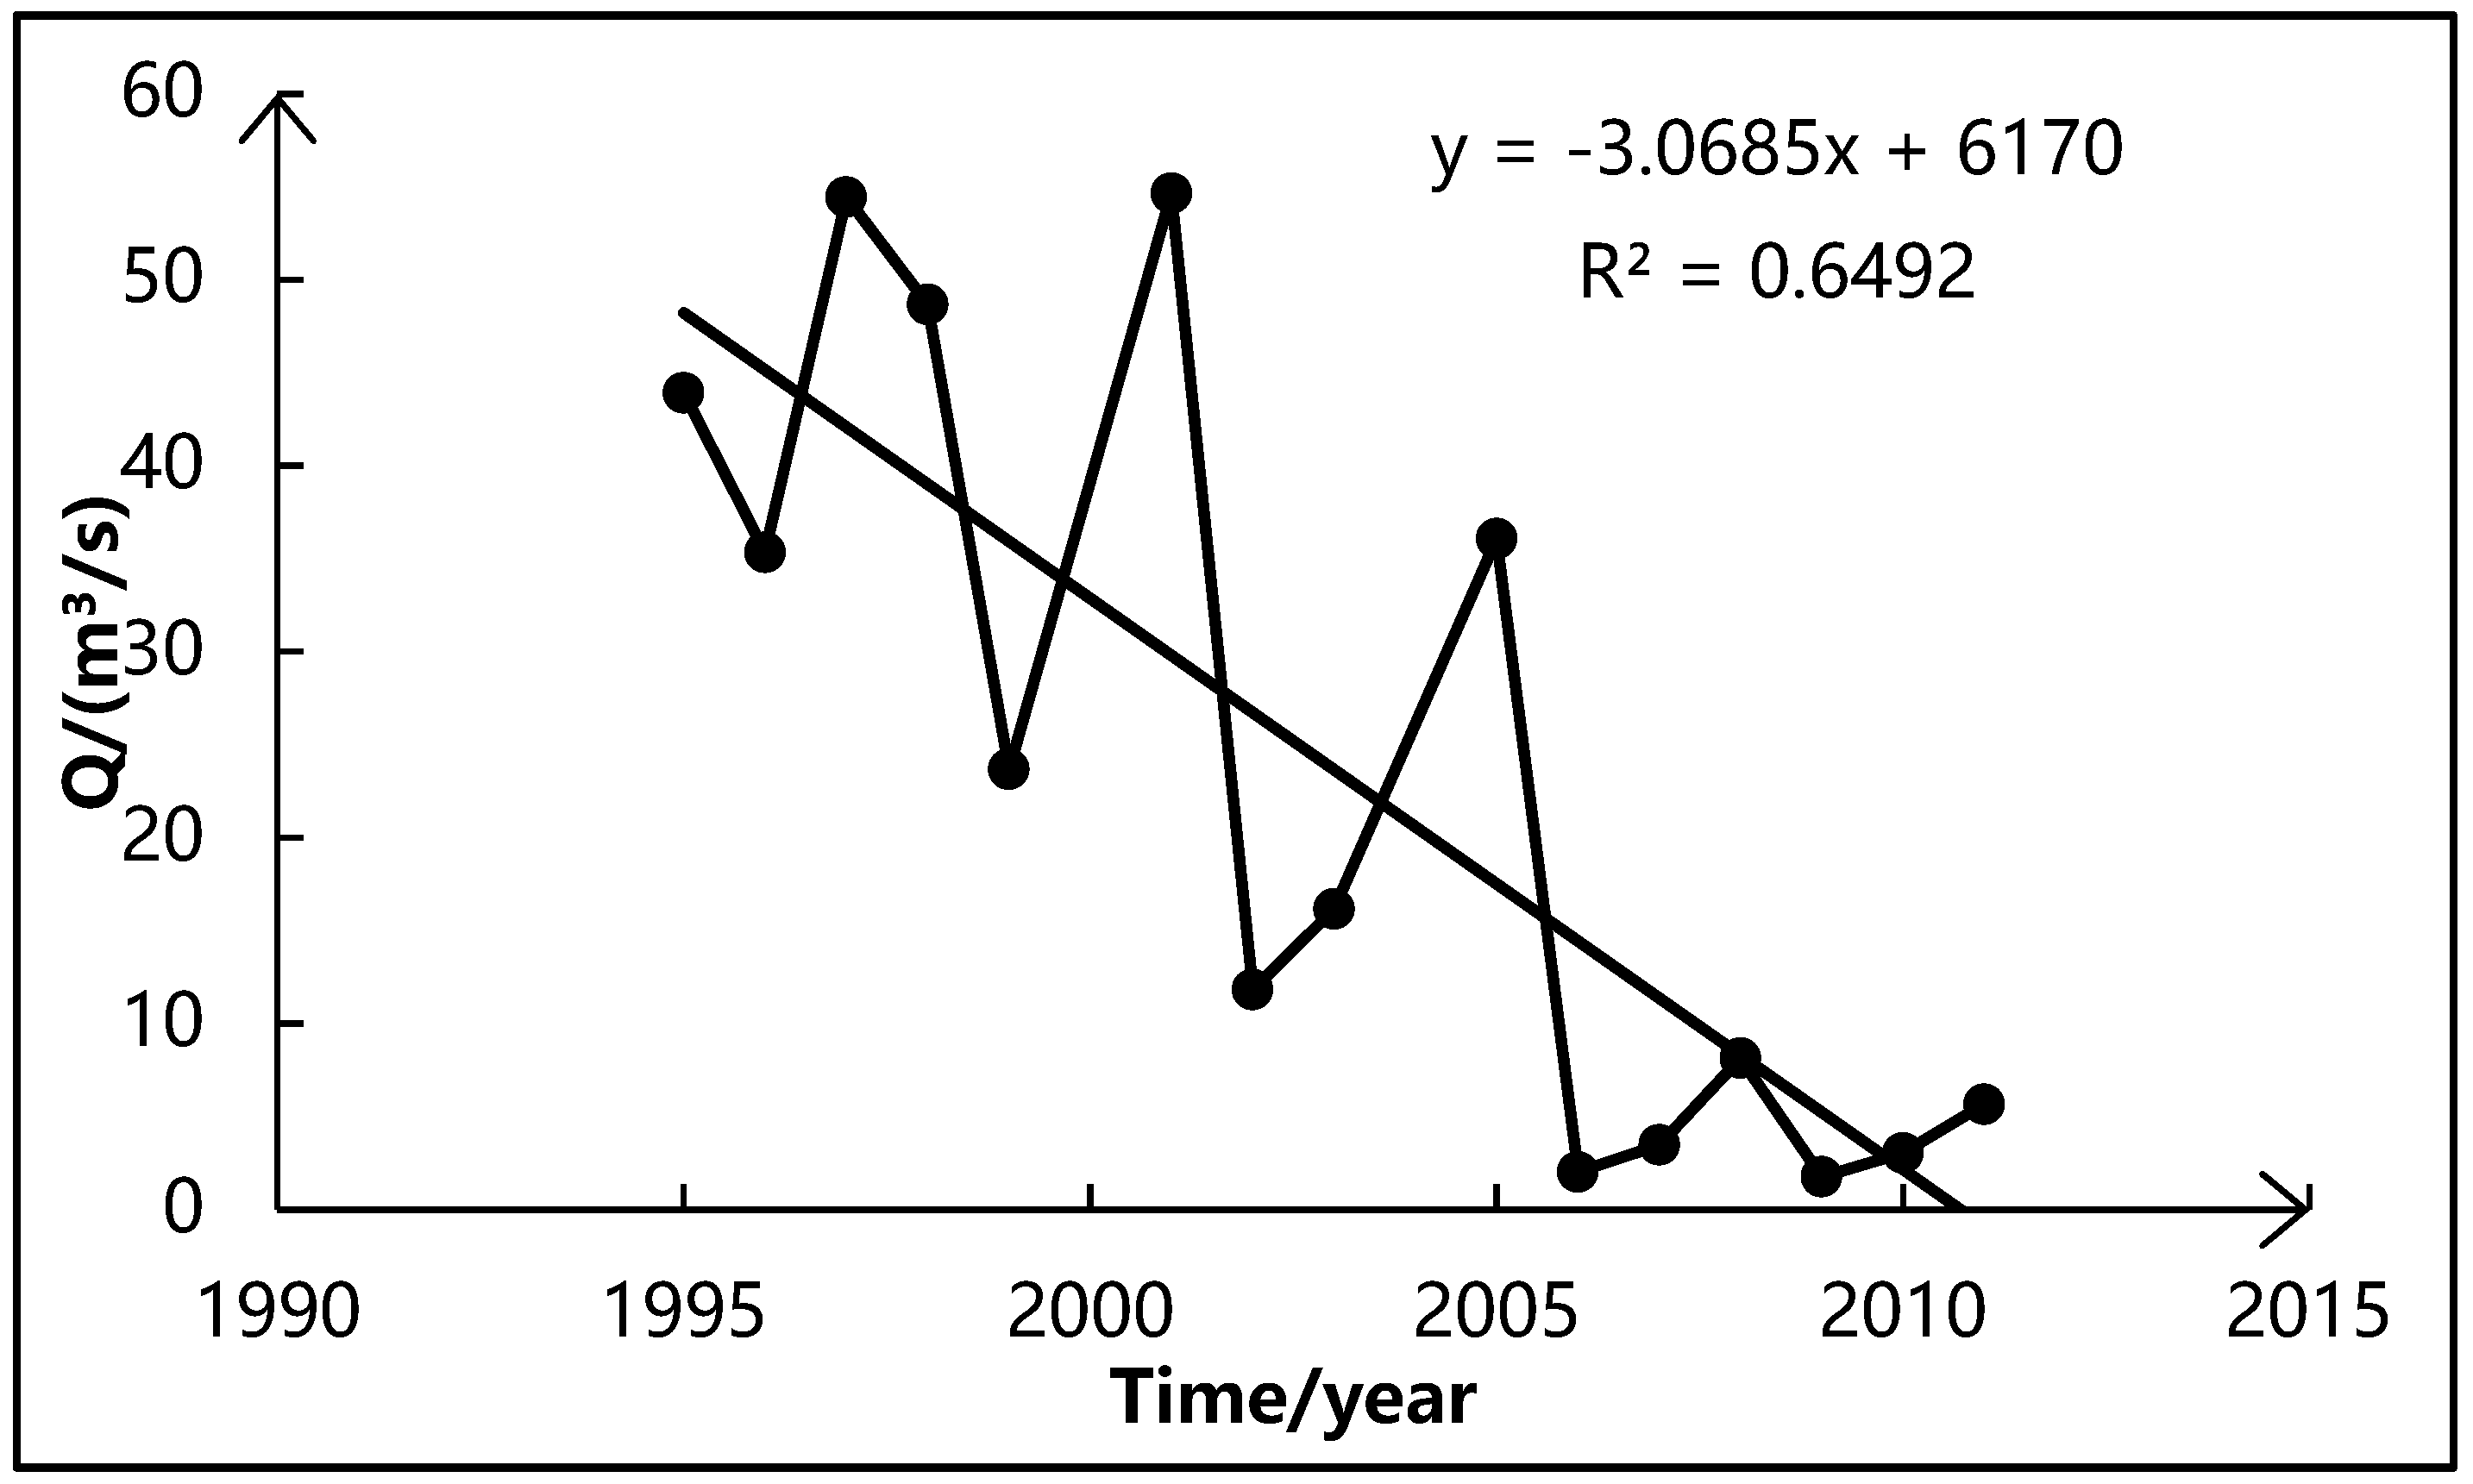
Figure 14.
M-K analysis for the runoff at Hanjiaying Station.

Figure 15.
M-K analysis for the runoff at Sandaohezi station.

Figure 16.
M-K analysis for the runoff at Chengde Station.

Figure 17.
MWP method analysis for runoff at Han Jiaying station.

Figure 18.
MWP method analysis for runoff Sandaohezi station.

Figure 19.
MWP method analysis for runoff at Chengde Station.


Table 1.
M-K rank correlation test results of precipitation.
| Station | Statistical Quantity of Test U | Significance Level α | Threshold Uα/2 | Determination Result | Tendency |
|---|---|---|---|---|---|
| Weichang Station | 0.58 | 0.05 | 1.96 | |U| < Uα/2 | Insignificantly increasing |
| Chengde Station | 0.73 | 0.05 | 1.96 | |U| < Uα/2 | Insignificantly increasing |
| Qinhuangdao Station | −0.94 | 0.05 | 1.96 | |U| < Uα/2 | Insignificantly decreasing |
Table 2.
Spearman test results of precipitation.
| Station | r | S | Z | Determination Result | Tendency |
|---|---|---|---|---|---|
| Weichang Station | 0.15 | 0.438 | 0.368 | |r| < Z, S > 0.05 | Accept the null hypothesis |
| Chengde Station | −0.174 | 0.367 | 0.368 | |r| < Z, S > 0.05 | Accept the null hypothesis |
| Qinhuangdao Station | −0.138 | 0.0001 | 0.471 | |r| < Z, S > 0.05 | Accept the null hypothesis |
Table 3.
The results of precipitation trend analysis.
| Method | Weichang Station | Chengde Station | Qinhuangdao Station |
|---|---|---|---|
| Linear trend regression analysis | non-significant increasing | non-significant increasing | non-significant decreasing |
| M-K method | non-significant increasing | non-significant increasing | non-significant decreasing |
| Spearman method | accept the null hypothesis | accept the null hypothesis | accept the null hypothesis |
Table 4.
Identification results of precipitation variation points.
| Method | Weichang Station | Chengde Station | Qinhuangdao Station |
|---|---|---|---|
| M-K method | 2007 | 2000, 2002, 2003 | 1996, 1997, 1999 |
| MWP method | — | 1999 | — |
Table 5.
Statistical table of M-K rank correlation test results of annual runoff.
| Station | U | α | Uα/2 | Determination Result | Tendency |
|---|---|---|---|---|---|
| Hanjiaying Station | −2.18 | 0.05 | 1.96 | |U| > Uα/2 | Significantly decreasing |
| Sandaohezi Station | −2.12 | 0.05 | 1.96 | |U| > Uα/2 | Significantly decreasing |
| Chengde Station | −2.87 | 0.05 | 1.96 | |U| > Uα/2 | Significantly decreasing |
Table 6.
Spearman correlation test results of runoff.
| Station | r | S | Z | Determination Result | Tendency |
|---|---|---|---|---|---|
| Hanjiaying Station | −0.604 | 0.017 | 0.521 | |r| > Z, S < 0.05 | Significantly decreasing |
| Sandaohezi | −0.6 | 0.014 | 0.503 | |r| > Z, S < 0.05 | Significantly decreasing |
| Chengde Station | −0.789 | 0.0001 | 0.521 | |r| > Z, S < 0.05 | Unusual Significantly decreasing |
Table 7.
Research results of runoff trend.
| Method | Hanjiaying Station | Sandaohezi Station | Chengde Station |
|---|---|---|---|
| Linear trend regression analysis | Significantly decreasing | Significantly decreasing | Significantly decreasing |
| M-K method | Significantly decreasing | Significantly decreasing | Significantly decreasing |
| Spearman method | Significantly decreasing | Significantly decreasing | Significantly decreasing |
Table 8.
Recognition results of runoff changing points.
| Method | Hanjiaying Station | Sandaohezi Station | Chengde Station |
|---|---|---|---|
| M-K method | 2006 | 2002, 2003, 2006 | 2002, 2003, 2006 |
| MWP method | 2003, 2006 | 2006 | 2001~2006 |
Disclaimer/Publisher’s Note: The statements, opinions and data contained in all publications are solely those of the individual author(s) and contributor(s) and not of MDPI and/or the editor(s). MDPI and/or the editor(s) disclaim responsibility for any injury to people or property resulting from any ideas, methods, instructions or products referred to in the content. |
© 2024 by the authors. Licensee MDPI, Basel, Switzerland. This article is an open access article distributed under the terms and conditions of the Creative Commons Attribution (CC BY) license (https://creativecommons.org/licenses/by/4.0/).
Share and Cite
MDPI and ACS Style
Shan, C.; Zhao, F.; Wang, Y.; Yang, C.; Wei, F.; Zhou, X. Study on the Evolvement Trend Process of Hydrological Elements in Luanhe River Basin, China. Water 2024, 16, 1169. https://doi.org/10.3390/w16081169
AMA Style
Shan C, Zhao F, Wang Y, Yang C, Wei F, Zhou X. Study on the Evolvement Trend Process of Hydrological Elements in Luanhe River Basin, China. Water. 2024; 16(8):1169. https://doi.org/10.3390/w16081169
Chicago/Turabian StyleShan, Chengju, Fuwei Zhao, Yuejing Wang, Chenggang Yang, Fusen Wei, and Xueyang Zhou. 2024. "Study on the Evolvement Trend Process of Hydrological Elements in Luanhe River Basin, China" Water 16, no. 8: 1169. https://doi.org/10.3390/w16081169
Note that from the first issue of 2016, this journal uses article numbers instead of page numbers. See further details here.