Article

Spatio-Temporal Variations in Nitrate Sources and Transformations in the Midstream of the Yellow River Determined Based on Nitrate Isotopes and Hydrochemical Compositions

1
College of Environmental and Municipal Engineering, North China University of Water Resources and Electric Power, Zhengzhou 450045, China
2
Yellow River Institute of Hydraulic Research, Zhengzhou 450003, China
3
Key Laboratory of Lower Yellow River Channel and Estuary Regulation, MWR, Zhengzhou 450003, China
*
Author to whom correspondence should be addressed.
Water 2024, 16(8), 1173; https://doi.org/10.3390/w16081173
Submission received: 23 March 2024 / Revised: 12 April 2024 / Accepted: 18 April 2024 / Published: 20 April 2024

Abstract

:
Nitrate pollution is a major environmental problem threatening rivers, and nitrogen and oxygen isotopes have proved to be an effective means of analyzing the sources and transformations of nitrate in rivers. However, a low monitoring frequency cannot accurately reflect the changes in nitrate. In this study, the sources and transformations of nitrate in the middle reaches of the Yellow River and its tributaries during the dry season and the wet season were analyzed based on water quality parameters and nitrate isotopes. Stable isotope analysis conducted using the R (SIAR) model was used to estimate the proportions of different nitrate sources. The results showed that the main nitrate sources in the main stream were soil nitrogen (40.95–45.83%) and domestic sewage and manure (30.93–32.60%), respectively, with little variation between the dry season and wet season because of the large flow of the Yellow River. During the dry season, the nitrate sources of the two tributaries were mainly domestic sewage and manure (45.23–47.40%), followed by soil nitrogen (31.35–34.00%). However, the primary nitrate source of T2 (Qin River) became soil nitrogen (40.05%) during the wet season, a phenomenon that was mainly caused by the significant increase in river discharge and in soil erosion in the basin. During the wet season, the concentrations of total nitrogen (TN) and nitrate (NO3) significantly decreased in the main stream and tributaries, and nitrification and denitrification processes occurred in both the main stream and tributaries of the Yellow River. In addition, the T2 tributary (Qin River) was also significantly affected by mixed dilution. High-frequency sampling can reflect the isotopic information of nitrate in the river more comprehensively, which helps us to understand the conversion process of nitrate more accurately.

1. Introduction

Due to the influence of industrial and agricultural activities, the concentration of nitrogen pollutants in rivers has increased, significantly impacting river ecological environments and human health [1]. The sources of nitrogen pollutants are complex, and this is related to the population distribution and land use type of a basin. The content of nitrogen pollutants in rivers is also related to nitrogen transformation processes [2]. Therefore, it is of great significance to study the source and transformation rules of nitrogen pollutants for the formulation of effective prevention and control programs for nitrogen pollutants.
Nitrate is the main form of nitrogen in rivers, generally accounting for over 80% of the total nitrogen in rivers [3]. The dual isotope (δ15N-NO3 and δ18O-NO3) technique has been shown to be an effective method for analyzing the sources of nitrate [4,5,6,7,8]. Studies have shown that NO3 in water mainly comes from domestic sewage, animal manure, synthetic fertilizers, soil organic nitrogen, and atmospheric precipitation. Nitrate from different sources has different isotopic characteristics: the δ15N and δ18O range from 4–25‰ and −5–10‰ for domestic sewage and manure, −6–6‰ and 17–25‰ for synthetic fertilizers, 0–8‰ and −10–15‰ for soil organic nitrogen, and −13–13‰ and 23–75‰ for atmospheric deposition. [2,9,10]. In order to quantitatively analyze nitrate sources, stable isotope analysis in R (SIAR) conducted according to the Bayesian isotopic mixing model [11] has been successfully applied in the study of several rivers [12,13,14,15]. Compared with traditional methods, SIAR has superior accuracy and has proved to be an effective analysis method [16].
The isotopic characteristics of nitrate are not only affected by its sources but also the biological transformation processes of nitrogen. Assimilation, nitrification, and denitrification processes all cause isotope fractionation, and 14N and 16O are more easily utilized, thus enriching 15N and 18O in the residues. Therefore, based on the isotopic characteristics, nitrogen transformation processes can also be identified [5,17,18,19]. However, nitrogen and oxygen isotopes’ characteristics are also affected by land use, hydrological conditions, human activities, and other factors and change with time and space. Nitrate sources and the mixing of river water can sometimes mask the isotopic evidence of denitrification in a river [20,21,22], and sampling frequency is considered another factor that increases the uncertainties in determining transformations [15,23]. Recently, combined methods consisting of using dual isotopes of nitrate together with hydro-chemical compositions (e.g., NO3/Cl) [24,25] have proved to be helpful for identifying nitrate transformation and sources.
The Yellow River is the second-largest river in China. It is affected by the natural environment, population, and economic factors, and the sources of nitrogen pollutants in the upper and middle-lower reaches of the Yellow River are different. Yue et al. [3] found that nitrate in the upper reaches of the Yellow River mainly came from soil organic nitrogen, while in the middle-lower reaches, the presence of nitrate was influenced by soil nitrogen, domestic sewage, chemical fertilizer, and other sources, which were mainly related to the inflow of tributaries. Liu et al. [21] found that nitrates in the upper reaches of the Yellow River mainly came from domestic sewage and animal manure, while in the middle-lower reaches, the contributions of domestic sewage, animal manure, and fertilizers were comparable. The difference in the conclusions arrived at by Yue [3] and Liu [21] is mainly due to the fact that the sampling times were different, resulting in different characteristics of nitrogen and oxygen isotopes. In addition, a small number of samples also increased the uncertainty of the isotope analysis results [16]. The Zhengzhou section of the Yellow River is part of the middle reaches of the Yellow River. It is located in a densely populated area with a high land utilization rate and has two tributaries, the Yiluo River and the Qin River. Studying the sources and transformations of nitrogen pollutants in this area has significant value for the protection of the Yellow River. To ensure the accuracy of the results, in this study, we adopted the method of multiple sampling analysis. Based on the hydrochemical characteristics of the main stream and tributaries of the Yellow River during the wet season and dry season, as well as the δ15N-NO3 and δ18O-NO3 isotope values, the sources and transformation pathways of nitrate in the middle reaches of the Yellow River were analyzed. The contributions of different nitrate sources were estimated using the SIAR model.

2. Materials and Methods
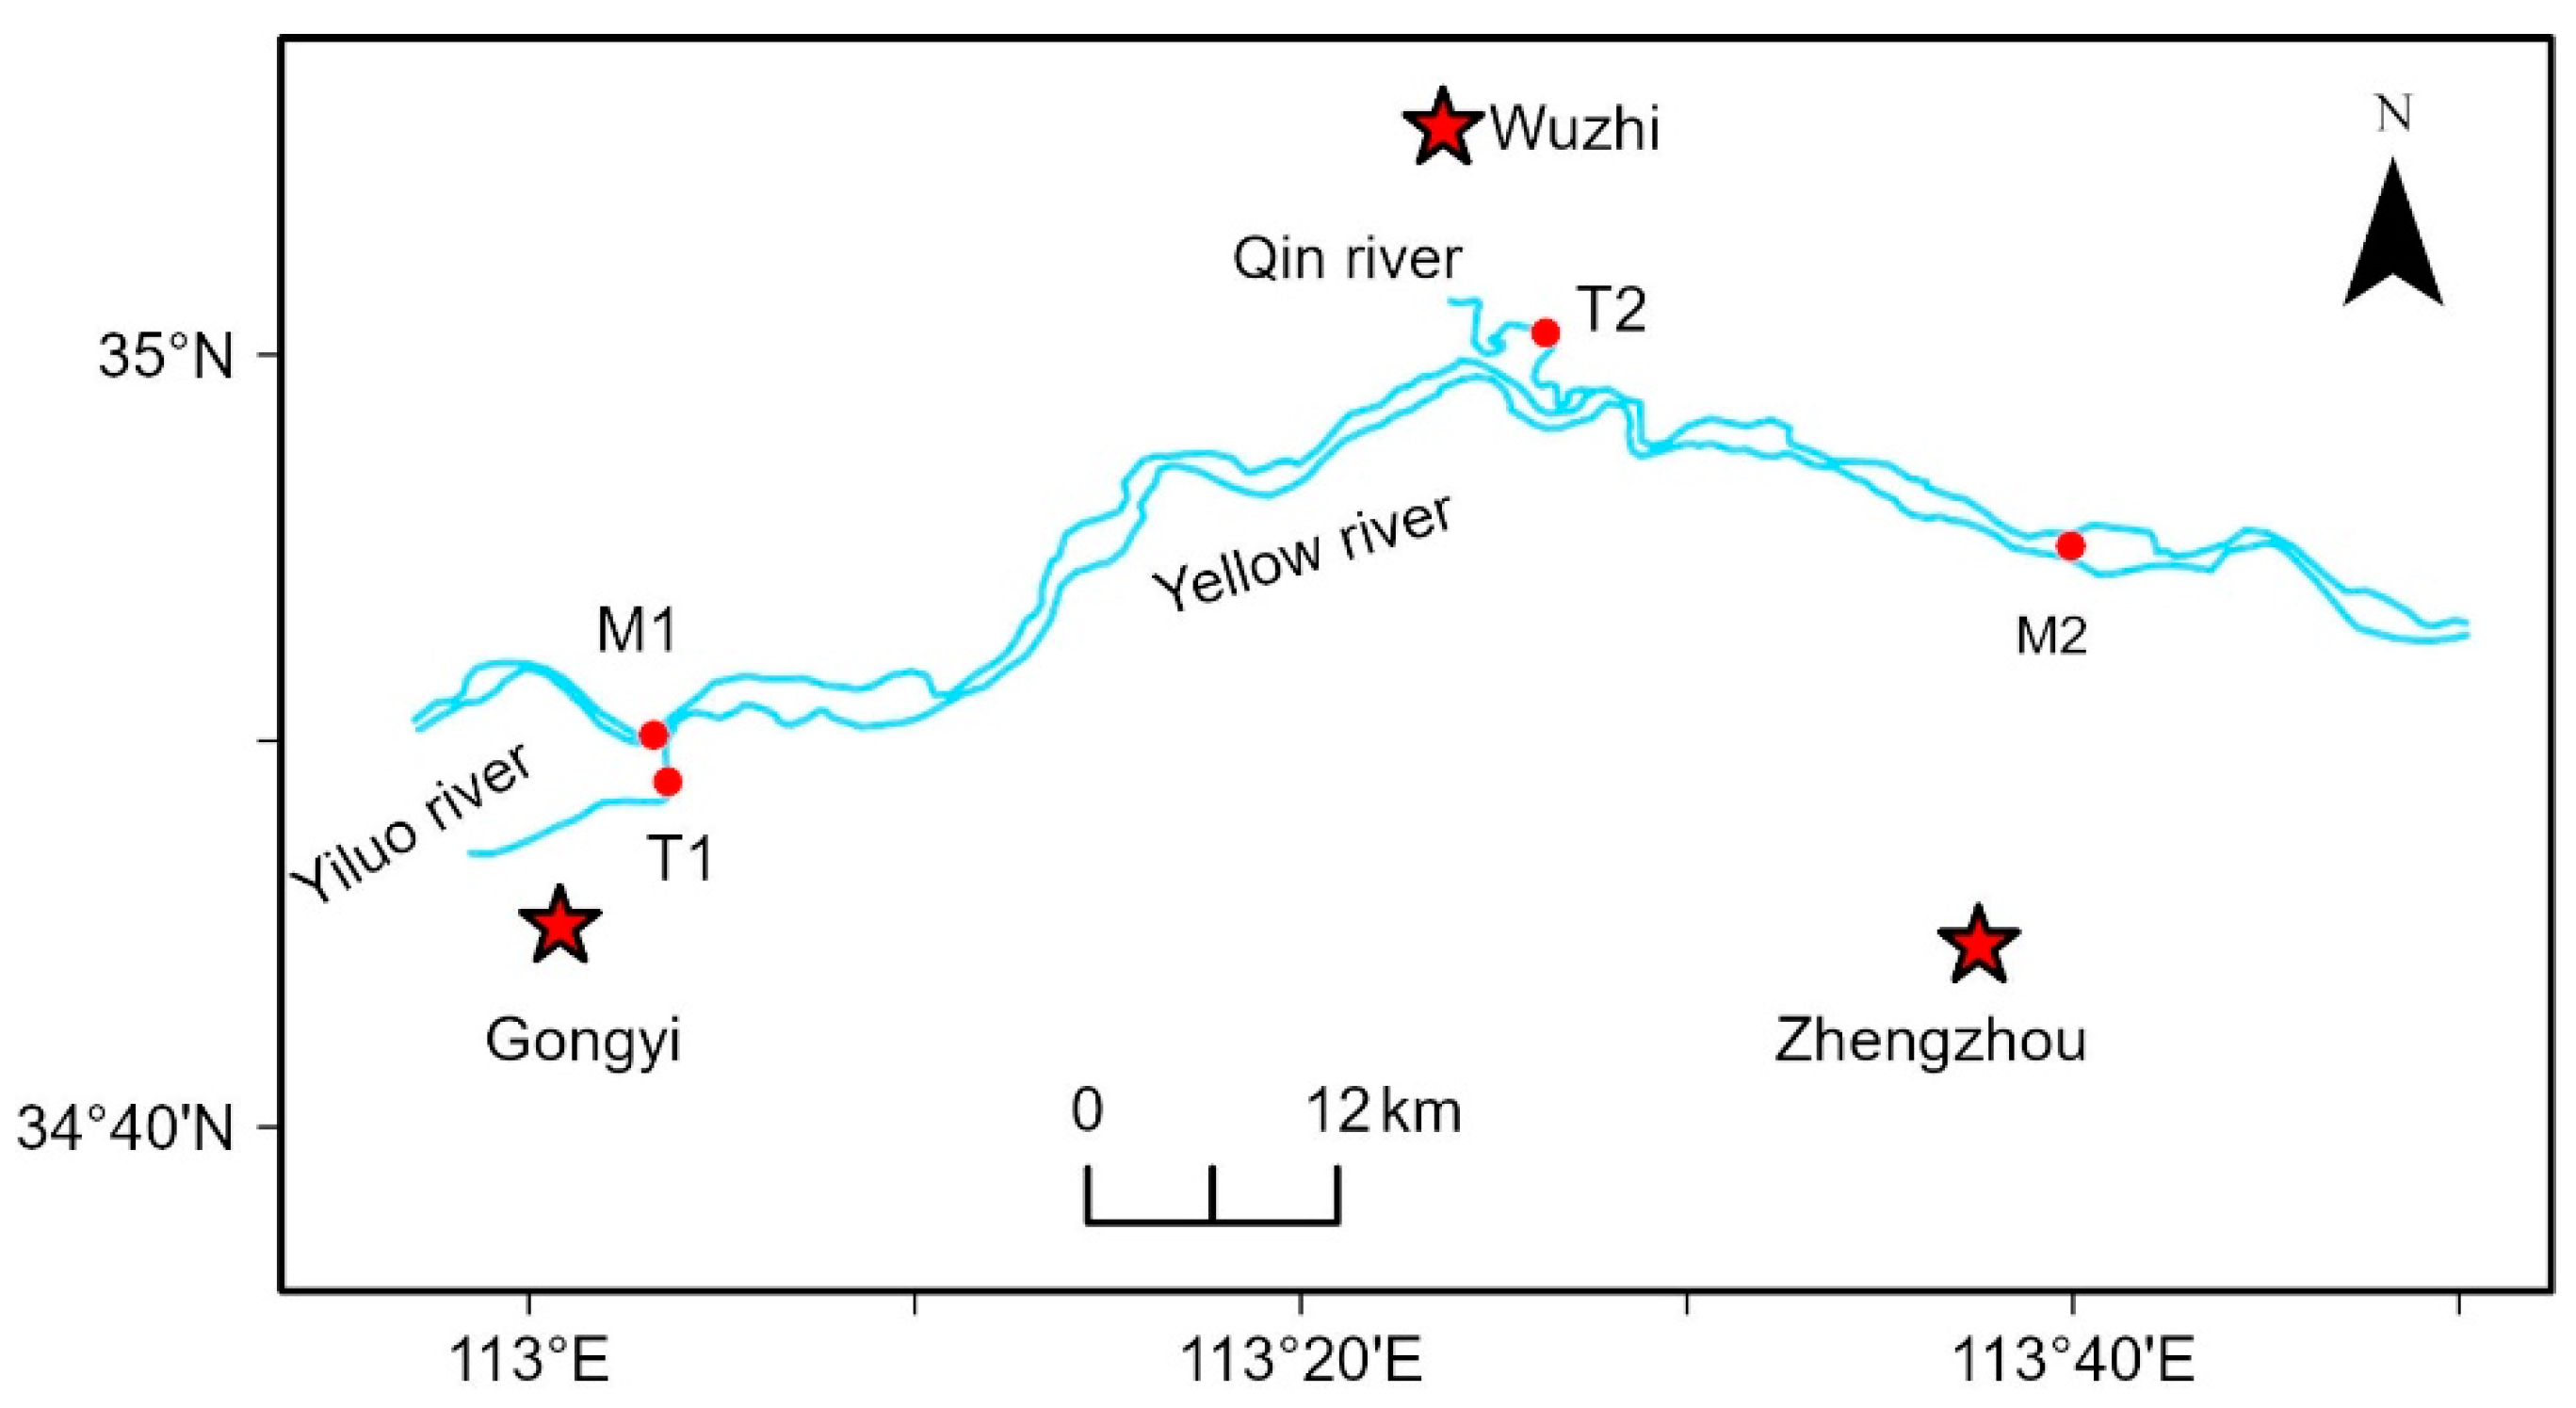
2.1. Study Area

The Yellow River, located at 32°10′–41°50′ N and 95°530′–119°10′ E, with a total length of 5464 km and a basin area of 7.95 × 10⁵ km2, is the second-largest river in China, providing irrigation and drinking water for 140 million people. The upper reaches of the Yellow River are dominated by grasslands, mainly used for animal husbandry, and the middle and lower reaches are dominated by agricultural and forestry land, which are greatly affected by human activities. The study area is located in the middle reaches of the Yellow River, which is in a warm temperate continental monsoon climate. The annual average rainfall in this region is 542.2 mm, occurring mainly from June to September. The distributions of farmland and cities in this area are relatively dense, and human activities are frequent. Urea and ammonia fertilizer are the main fertilizers applied to farmland, and the fertilization periods are generally from February to March and from June to July. From 2018 to 2022, the average annual runoff of the Yellow River was 44.488 billion cubic meters, that of the Yiluo River was 2.29 billion cubic meters, and that of the Qin River was 0.937 billion cubic meters.

2.2. Sample Collection and Analysis Methods

There were four sections (Figure 1), namely, the M1 (34°50′29″ W, 113°3′17″ E) and M2 (34°55′1″ W, 113°40′5″ E) sections in the main stream of the Yellow River; the T1 (34°48′55″ W, 113°3′37″ E) section, where the Yiluo River enters the Yellow River; and T2 (35°0′44″ W, 113°25′41″ E) section, where the Qin River enters the Yellow River.
During the dry season (2 January 2021, 31 March 2021, 5 December 2021, 23 February 2022, and 20 March 2022) and the wet season (4 July 2021 (due to extreme rainfall in the study area, no continuous sampling was conducted), 12 June 2022, 11 July 2022, 20 August 2022, and 17 September 2022), water samples were collected five times using a water sampler (TC-Y, Fushun, China) at a depth of 0.2 m below the water surface. In addition, surface sediment samples were collected using a grab-type sediment sampler (XY-TC1001, Qingdao, China) at the M1 and M2 sections of the Yellow River (2 January 2021, 20 March 2022, and 4 July 2021, 17 September 2022).
Dissolved oxygen (DO), temperature, and pH values were measured on-site using a portable water quality analyzer (YSI ProQuatro, Ohio, USA). The water samples were stored away from light at 4 °C and transported back to the laboratory within 12 h. Some of the samples were filtered using a 0.22 μm membrane for the measurement of δ15N-NO3 and δ18O-NO3, and the rest were refrigerated at 4 °C for water quality analysis. δ15N-NO3 and δ18O-NO3 levels were determined using denitrifying bacteria methods [26]. Total nitrogen (TN) was determined via alkaline potassium persulfate digestion and UV spectrophotometryNH4+_N content was determined using Nessler’s reagent spectrophotometry, and NO3-N and NO2N levels were determined using spectrophotometry [27]. Chloride ions were measured using an ion chromatograph (DIONEX ICS-1000,California, USA), while chemical oxygen demand (CODcr) and suspended substance (SS) levels were measured using the standard method [27].

2.3. SIAR Program Based on Bayesian Isotope Mixing Model

Recently, SIAR was successfully used to estimate the contribution of different nitrate sources [11]. SIAR can be expressed as follows in Equations (1)–(4) [11].
X i j = k = 1 K P k S j k + C j k + ε j k
S j k ~ N μ j k , ω j k 2
C j k ~ N λ j k , τ j k 2
ε j k ~ N 0 , σ j k 2
where Xij represents the isotope value of j (for 15N and 18O) in water sample i (i = 1, 2, 3…, N); Pk is the proportion of source k calculated using the SIAR model; Sjk indicates the isotope values j of source k (k = 1, 2, 3…, K), which is normally decided by the mean μjk and standard deviation ωjk; Cjk is the isotopic fractionation factor of source k of isotope j, generally expressed as mean λjk and standard deviation τjk; and εij is the residual error denoting the remaining unquantified variation between the mixtures, which is normally distributed with a mean of 0 and standard deviation σj [28]. In this study, four potential sources of nitrate were identified; the mean values of nitrate isotopes (μjk) and associated standard deviations (ωjk) were acquired from other studies [14].

2.4. The Source of the Referenced Data

The data on the monthly average flow and the concentrations of TN and NH4+ -N in sections M2, T1, and T2 from 2020 to 2022 came from the bulletins of the Yellow River Conservancy Commission of the Ministry of Water Resources and the Ministry of Ecology and Environment of the People’s Republic of China, respectively.

3. Results

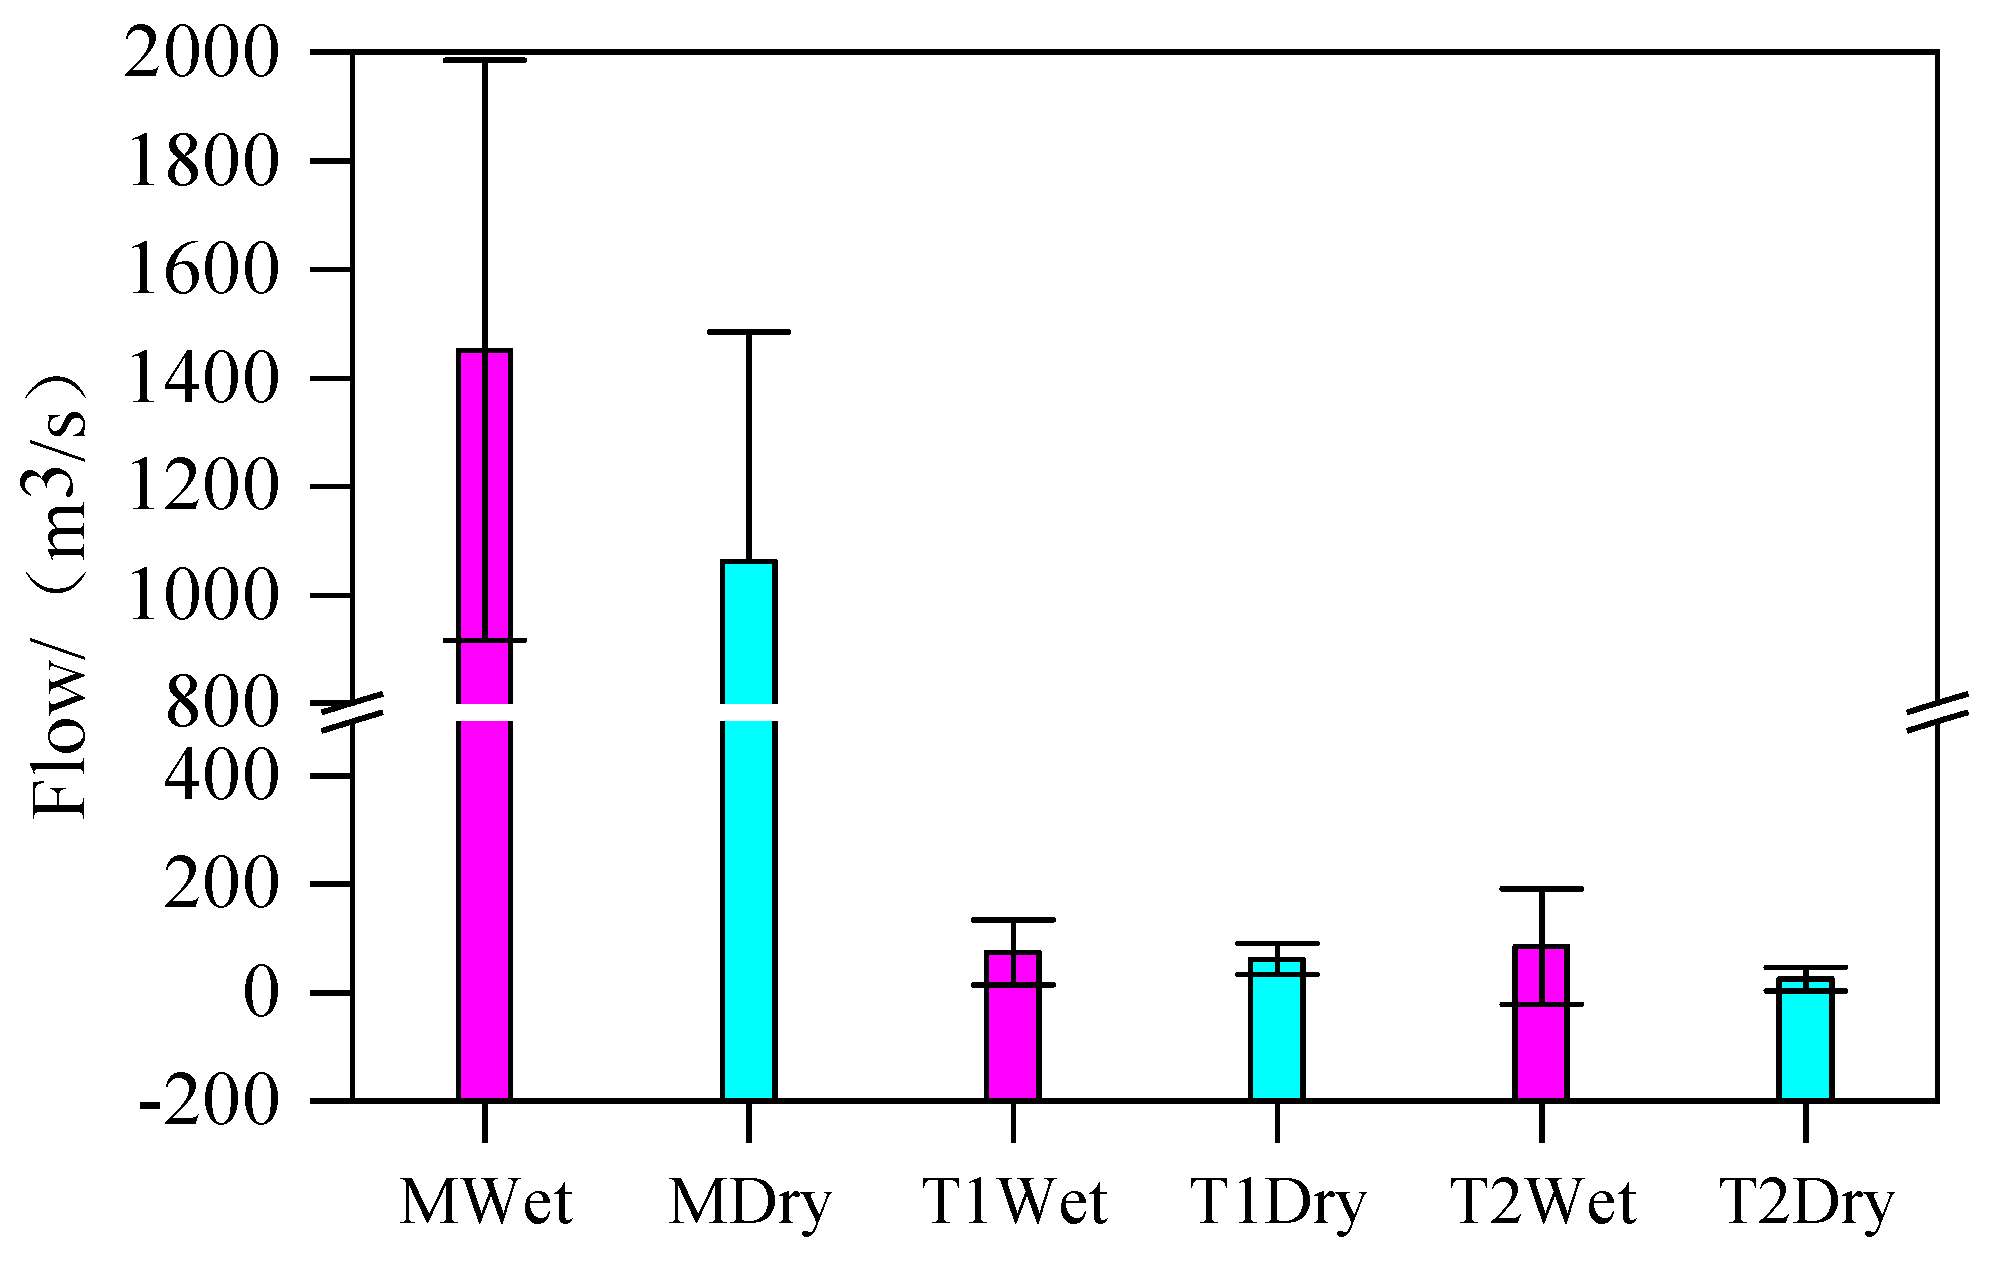
3.1. Temporal and Spatial Variations of Hydrochemical Parameters

Temperature, DO, and pH are important physicochemical parameters governing the selfpurification capacity of a river. As shown in Table 1, the temperature of each section in the study area ranged from 3.80 °C to 13.30 °C during the dry season, while the pH ranged from 7.60 to 8.60, and the DO content ranged from 7.60 mg L−1 to 16.40 mg L−1; during the wet season, the temperature ranged from 22.70 °C to 30.10 °C, the pH ranged from 7.70 to 8.70, and the DO content ranged from 6.70 mg L−1 to 12.50 mg L−1. The pH was weakly alkaline, with little variation over time. However, the DO content in the dry season was higher than that in wet season, mainly due to the lower temperature during the dry season [29].
During the dry season, the ρ(NH4+) values of M1, M2, T1, and T2 were 0.15 ± 0.07 mg L−1, 0.16 ± 0.05 mg L−1, 0.67 ± 0.10 mg L−1, and 0.16 ± 0.05 mg L−1, respectively, while the ρ(NO3) values were 3.21 ± 0.43 mg L−1, 3.34 ± 0.42 mg L−1, 4.78 ± 0.83 mg L−1, and 4.41 ± 0.28 mg L−1, respectively, and the ρ(TN) values were 3.87 ± 0.52 mg L−1, 4.04 ± 0.58 mg L−1, 6.16 ± 0.82 mg L−1, and 5.48 ± 0.67 mg L−1, respectively. The average values of TN and NO3 in each section were significantly higher than those in the wet season. During the wet season, the non-point source pollution load caused by surface runoff increased, but the concentration of nitrogen pollutants decreased significantly, and the concentrations of TN and NO3 decreased by 27.55–52.44% and 29.02–57.74%, respectively. A correlation analysis of river discharge and TN and NH4+ concentrations from 2020 to 2022 was carried out. The results are shown in Table 2. The correlation coefficient between the TN and NH4+ concentrations and discharge was very small, indicating that the dilution effect caused by the increase in river discharge in the wet season was not the main reason for the decrease in nitrogen pollutant concentrations, and the CODcr in the wet season was close to that in the dry season; however, the water temperature in the wet season was higher, and this higher temperature was conducive to the metabolic activities of microorganisms. Therefore, the decrease in TN concentration was mainly induced by biological transformation processes.
Spatial analysis showed that the concentrations of nitrogen pollutants in the two tributaries were higher than those in the main stream in both the dry and wet seasons, indicating that the sources of pollutants in the tributaries and the main stream were different, which may also be related to the fact that the high concentration of SS in the main stream was more conducive to the biological transformation of nitrogen pollutants [30,31]. Table 1 showed that the ρ(SS) in the main stream was 571.55–2369.22 mg L−1, while the ρ(SS) in the two tributaries was 43.28–113.04 mg L−1, and the ρ(SS) in the main stream was higher than that in the tributaries. Studies have shown that suspended sediments can provide greater adhesion area for microorganisms, strengthening the nitrification and denitrification of nitrogen in water, resulting in a 25–120% increase in nitrogen loss [30,31].
During the dry season, the ρ (Cl) values of M1 and M2 were 111.61 ± 3.53 mg L−1 and 113.20 ± 4.81 mg L−1, respectively, while the ρ (Cl) values of T1 and T2 were approximately 73.24 ± 3.27 mg L−1 and 66.64 ± 6.55 mg L−1, which were slightly higher than those during the wet season. Cl is widely distributed in the natural environment, with relatively high concentrations in feces and domestic sewage [32]. The ρ (Cl) in rivers was relatively stable, and it was not affected by changes in physical, chemical, or biological factors; it was only affected by the mixing effect caused by flow changes [33,34]. As shown in Figure 2, the flow of the main stream and tributaries of the Yellow River increased in the wet season, and Cl was diluted, resulting in lower ρ (Cl) than that in the dry season.

3.2. Spatial and Temporal Variations in δ15N-NO3 and δ18O-NO3

As can be seen from Table 3, during the dry season, the δ15N values of M1 and M2 were 8.78‰ ± 0.48‰ and 9.39‰ ± 0.63‰, respectively; the δ18O values were 2.11‰ ± 0.32‰ and 2.90‰ ± 0.77‰; and the δ15N and δ18O values of T1 were 13.77‰ ± 0.57‰ and 5.91‰ ± 0.39‰, respectively, and those of T2 were 13.14‰ ± 0.80‰ and 4.92‰ ± 0.73‰, respectively. During the wet season, the δ15N values of M1 and M2 were 8.52‰ ± 0.08‰ and 8.75‰ ± 0.20‰, respectively; the δ18O values were 1.42‰ ± 0.88‰ and 2.13‰ ± 1.45‰, respectively; and the δ15N and δ18O values of T1 were 12.20‰ ± 1.48‰ and 5.70‰ ± 0.16‰, respectively, and those of T2 were 11.05‰ ± 0.76‰ and 3.49‰ ± 0.84‰, respectively. It can be seen that the δ15N-NO3 and δ18O-NO3 values of the tributaries were higher than those of the main stream, and the δ15N and δ18O values of both the main stream and tributaries were higher in the dry season than in the wet season. The δ15N-NO3 and δ18O-NO3 values were not only influenced by the sources and contribution rate of nitrate but also by the transformation of nitrogen [17,18,19]. The δ15N-NO3 and δ18O-NO3 values of the main stream and tributaries of the Yellow River showed different characteristics in different periods, indicating that there were different nitrate sources and transformation processes.

4. Discussion

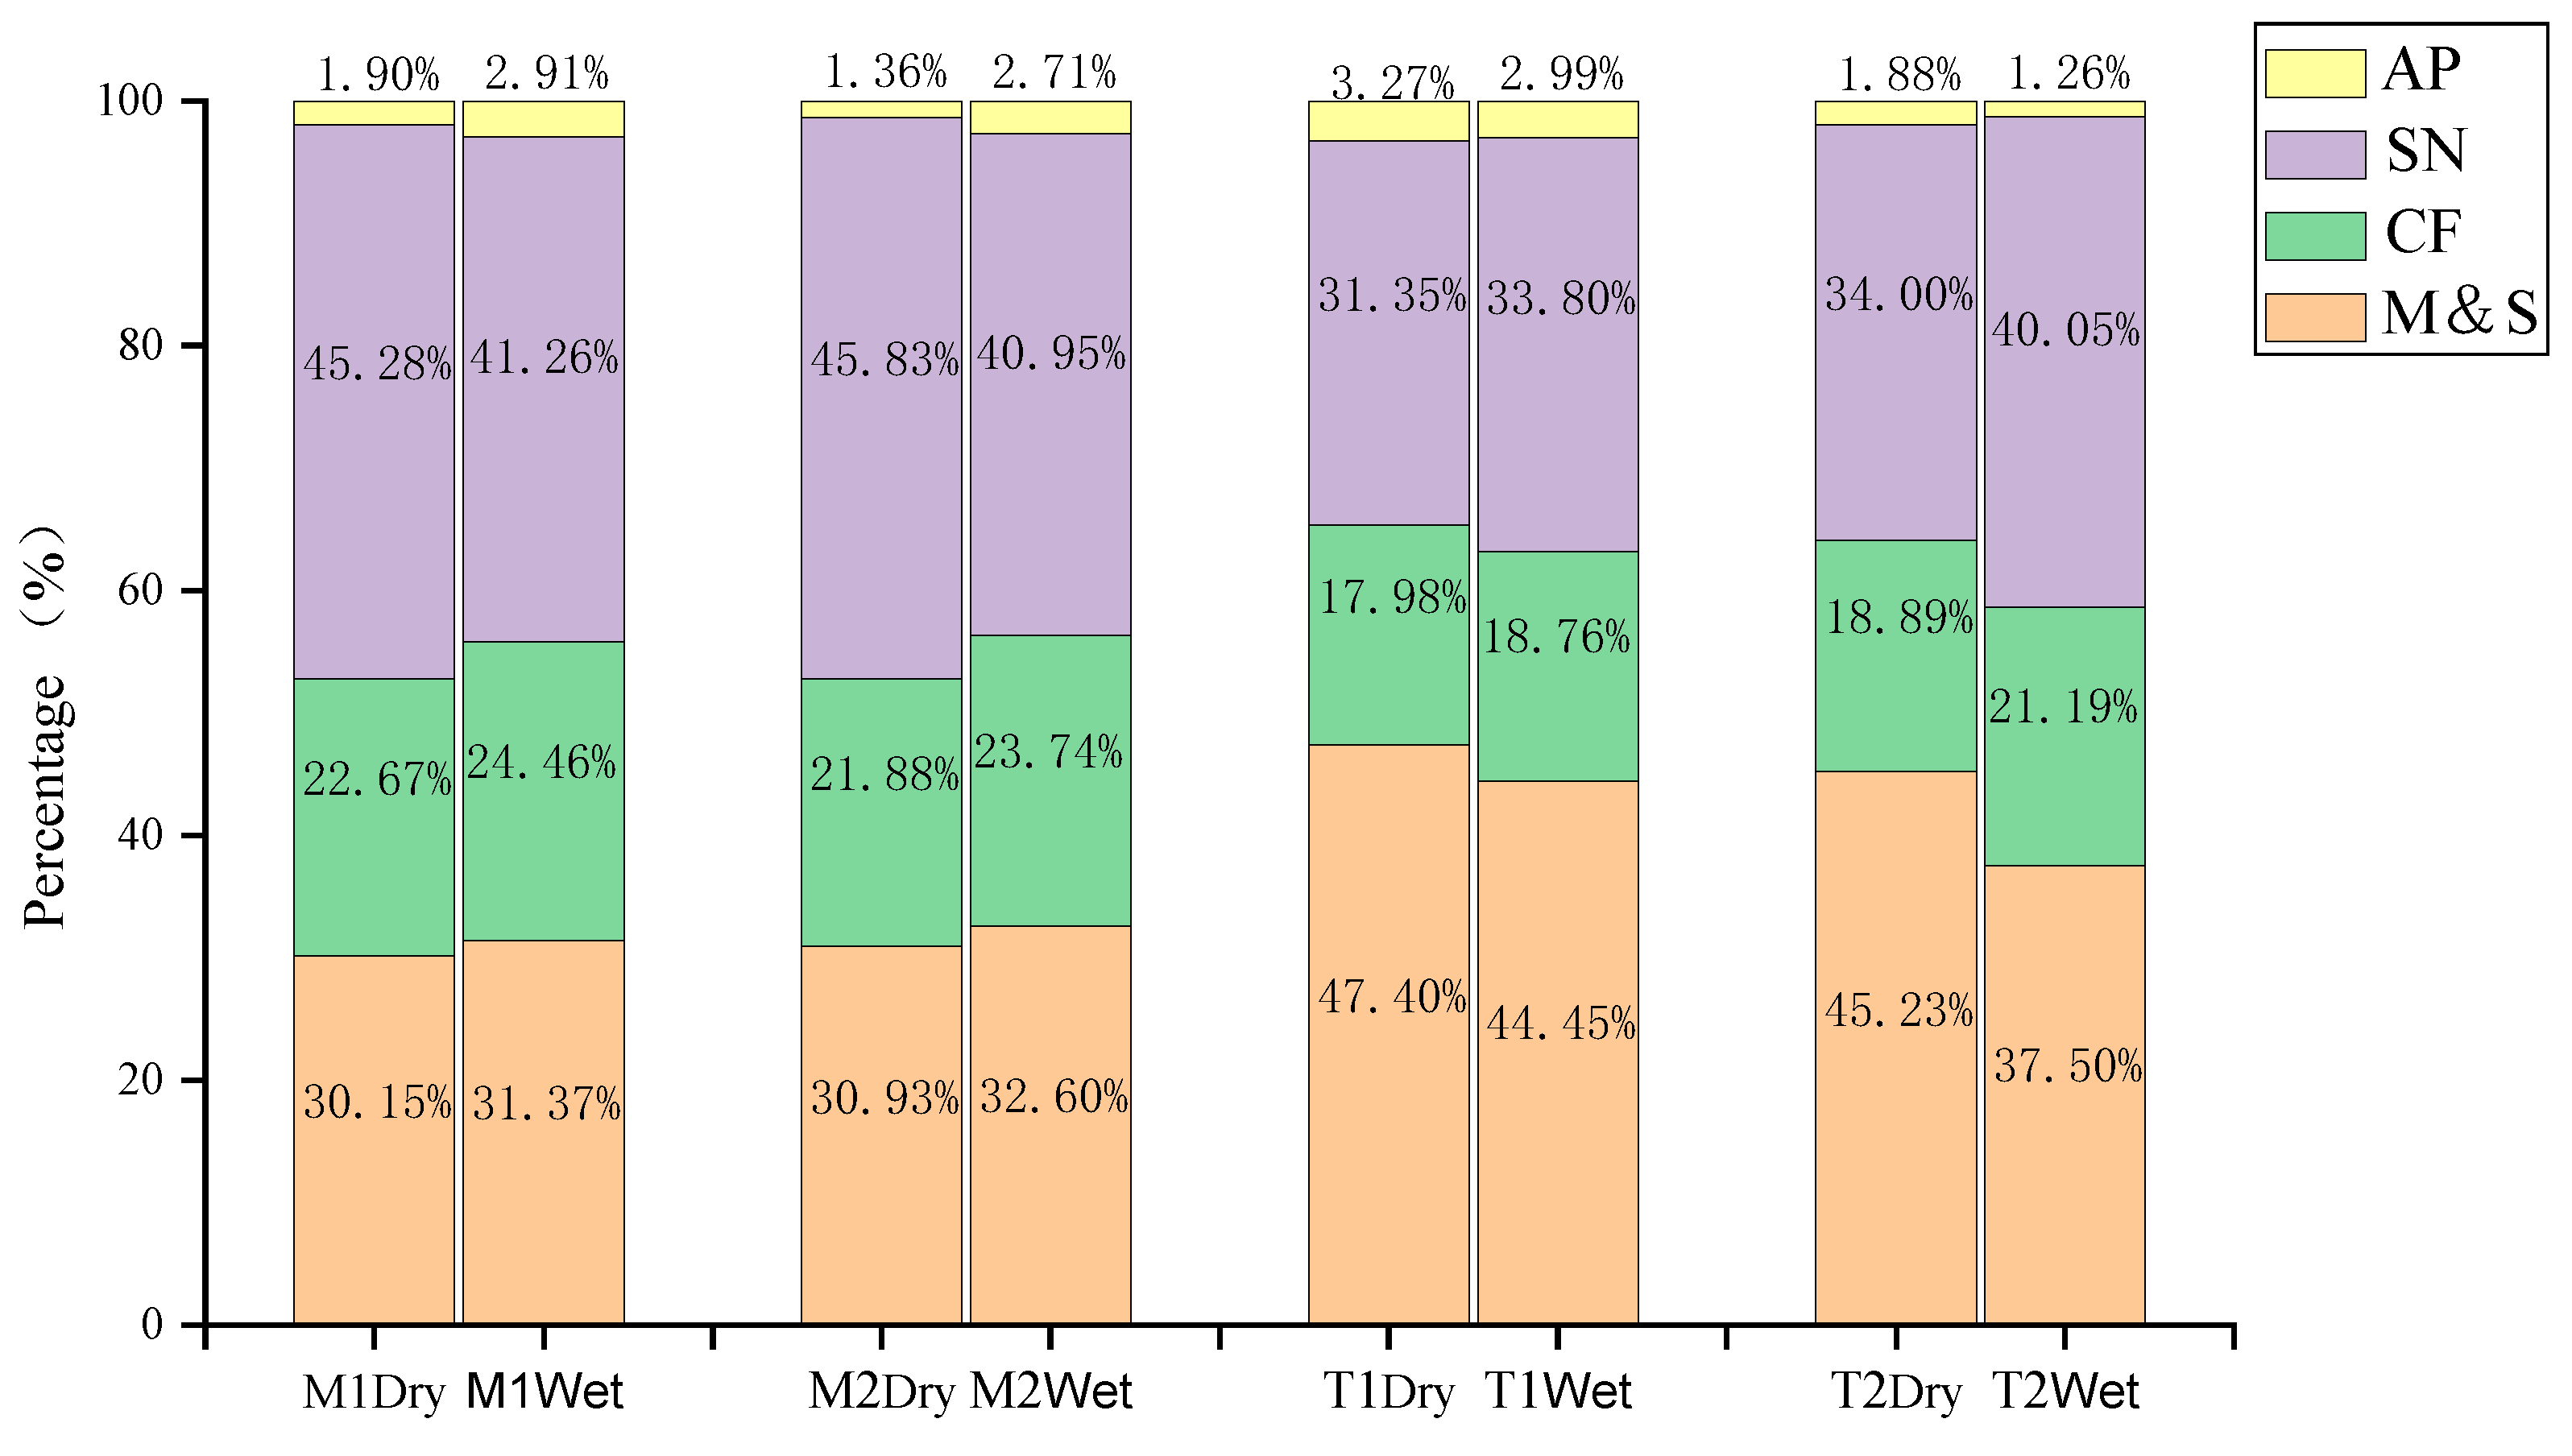
4.1. Analysis of the Sources of Nitrate

The δ15N-NO3 of the main stream in the study area ranged from 8.22‰ to 10.10‰, and the δ18O-NO3 ranged from −0.14‰ to 4.25‰; these values are mainly located in the characteristic range of domestic sewage and manure and close to the characteristic range of soil nitrogen. The δ15N-NO3 of the tributaries ranged from 9.91‰ to 14.82‰, and the δ18O-NO3 ranged from 2.91‰ to 6.54‰, and these values are mainly located in the characteristic range of domestic sewage and manure (Figure 3). The higher temperature in the wet season was conducive to the nitrification and denitrification processes of microorganisms, and these biological transformation processes increase the δ18O-NO3, which was confirmed by Yue’s [3] study on the Yellow River. However, in this study, the δ18O-NO3 in the wet season was lower than that in the dry season, and Li [35] also found the same result, which may have been precipitated by the increase in the loss of ammonia fertilizers and soil organic nitrogen during the wet season, and the influence of nitrate sources on δ18O-NO3 exceeded the influence of nitrate transformations.
The SIAR model was used to estimate the contribution rate of nitrate from different sources in four sections, as shown in Figure 4. It can be seen that the main nitrate source of the main stream was soil nitrogen, accounting for 40.95–45.83%, followed by domestic sewage and manure, accounting for 30.15–32.60% and fertilizer, accounting for 21.88–24.46%; the contribution of atmospheric deposition was small, amounting to only 1.36–2.91%. Affected by the inflow of two tributaries, the contribution rate of domestic sewage and manure in the M2 section was slightly higher than that in the M1 section. However, due to the large discharge of the Yellow River, the pollution contribution of the two tributaries for the main stream was small, and the nitrate in the main stream came from the migration of pollution in the upper stream.
The main nitrate sources of the two tributaries during the dry season were domestic sewage and manure, accounting for 45.23–47.40%, followed by soil nitrogen, accounting for 31.35–34%, and fertilizer and atmospheric deposition, accounting for 17.98–18.89% and 1.88–3.27%, respectively. During the wet season, the primary nitrate source of T1 was still domestic sewage and manure, but for T2, it became soil nitrogen, accounting for 40.05%, and the proportion of domestic sewage and manure was reduced to 37.50%, mainly due to the fact that the discharge of T2 was significantly increased, resulting in increased soil erosion in the basin.

4.2. Analysis of the Transformation Pathways of Nitrogen Pollutants

The biological transformation processes of nitrogen, such as nitrification, assimilation, and denitrification, can all lead to isotopic enrichment and change. In the nitrification process, two-thirds of the O in the produced nitrate comes from H2O, while one-third comes from O2 in the atmosphere. Studies have shown that the δ18O-NO3 value generated during the nitrification process is −10–10‰ [2]. In this study, the δ18O of the main stream ranged from 1.86‰ to 3.55‰, while that of the tributaries ranged from 4.25‰ to 6.54‰. Meanwhile, the higher temperature in the wet season resulted in lower concentrations of ammonia nitrogen compared to those in the dry season, indicating that the nitrification process was the main nitrogen conversion process in the river, which is consistent with the research results reported by Yue [3].
The denitrification process reduced the concentration of NO3, while δ15N and δ18O enriched in NO3, and there was an obvious linear relationship between δ15N and δ18O, with the δ15N/δ18O ratio typically ranging from 1.3 to 2.1 [25,33,36]. During the wet season, the nitrate concentrations in the four sections were significantly lower than those in the dry season (Table 1), and the δ15N/δ18O of some samples in T1 and T2 ranged from 1.3 to 2.1 (Figure 3), but the δ15N/δ18O values in the main stream were not within the typical range of denitrification, indicating that denitrification occurred in the tributaries during the wet season. Qin’s [37] research showed that the δ15N and δ18O of the Qin River were mainly affected by the mixing and nitrification processes, and there was no obvious denitrification effect. Our research results are different, mainly because in the actual environment, affected by various factors, the isotope information on denitrification may be obscured [20,21,22], while the sampling time employed by Qin was only once in August, which could not fully reflect the isotope characteristics.
Due to the conservative chemical properties of Cl, the molar ratio of NO3/Cl can usually be used as an auxiliary indicator to judge the sources and transformations of nitrate. ρ(Cl) did not change, while the NO3/Cl ratio changed significantly, indicating that denitrification may have occurred in the river. In contrast, if the NO3/Cl ratio remained constant but the ρ(Cl) concentration changed, this would indicate that mixing processes occurred in the river [38].
According to Figure 5, compared with the dry season, the change in ρ(Cl) in the main stream was not obvious during the wet season, but the ρ(Cl) in tributaries was decreased, and the NO3/Cl ratios in both the main stream and tributary T1 were also decreased, possibly due to denitrification processes reducing the NO3 concentration. There was little change in the NO3/Cl ratio in tributary T2, indicating that T2 was more affected by mixing processes [36], which is also the reason why denitrification information in tributary T2 was easily obscured.
Further analysis of surface sediments of the main stream revealed that most of the δ15N-NO318O-NO3 values were between 1.3 and 2.1 (Figure 3), confirming denitrification occurred in the main stream, mainly in the surface sediment region. According to research, nitrate in the water of small rivers is more likely to interact with bed sediments compared with large rivers, so denitrification is more likely to occur in small rivers [39]. However, in large rivers, factors such as changes in discharge or small changes in isotope ratios would have a greater uncertain impact on the interpretation of isotope results [20]. The isotope information on the main stream in this study did not indicate a denitrification process, and this result was also confirmed. Therefore, increasing the sampling frequency and incorporating other methods for comprehensive analysis can accurately reflect the transformations of nitrogen in river, especially regarding the denitrification process.

5. Conclusions

In this study, combined with water quality parameters and nitrogen and oxygen isotope values monitored several times, the sources and transformation processes of nitrate in the middle reaches of the Yellow River and its tributaries during the dry season and wet season were analyzed, and the proportions of each nitrate source were estimated using the SIAR model. Under the influence of pollution migration in the upper reaches, the main nitrate sources in the main stream of the Yellow River were soil nitrogen (40.95–45.83%) and domestic sewage and manure (30.93–32.60%), respectively, with little variation between the dry season and wet season. During the dry season, the nitrate sources of the two tributaries were mainly domestic sewage and manure (45.23–47.40%), followed by soil nitrogen (31.35–34.00%). However, the primary nitrate source of T2 (Qin River) became soil nitrogen (40.05%) during the wet season, mainly because of the significant increase in river discharge and the increase in soil erosion in the basin. Therefore, reducing domestic sewage discharge and controlling soil nitrogen loss are the key measures for improving the water quality of the Yellow River.
During the wet season, the concentrations of TN and NO3 significantly decreased and nitrification and denitrification processes occurred in both the main stream and tributaries of the Yellow River. In addition, the T2 tributary (Qin River) was also significantly affected by mixed dilution. High-frequency sampling can reflect the isotopic information on nitrate in the river more comprehensively, contributing to a more accurate understanding of the conversion process of nitrate.

Author Contributions

Conceptualization, C.S. and R.Z.; methodology, X.X.; software, Y.S.; validation, C.S. and Y.S.; formal analysis, X.X.; investigation, C.S., Y.S., R.Z. and X.X.; resources, Y.S.; data curation, R.Z.; writing—original draft preparation, C.S. and Y.S.; writing—review and editing, C.S. and Y.S.; visualization, X.X. and J.L.; supervision, X.X. and J.L.; project administration, X.X. and J.L. All authors have read and agreed to the published version of the manuscript.

Funding

This research was funded by the Opening Project of Key Laboratory of Lower Yellow River Channel and Estuary Regulation, MWR (HHNS202004).

Data Availability Statement

Date are contained within the article.

Conflicts of Interest

The funders had no role in the design of this study.

References

  1. Hameed, A.; Nazir, S.; Rehman, J.U.; Ahmad, N.; Hussain, A.; Alam, I.; Nazir, A.; Tahir, M. Assessment of health hazards related to contaminations of fluorides, nitrates, and nitrites in drinking water of Vehari, Punjab, Pakistan. Hum. Ecol. Risk Assess. Int. J. 2020, 27, 1509–1522. [Google Scholar] [CrossRef]
  2. Zhang, X.; Zhang, Y.; Shi, P.; Bi, Z.; Shan, Z.; Ren, L. The deep challenge of nitrate pollution in river water of China. Sci. Total Environ. 2021, 770, 144674. [Google Scholar] [CrossRef] [PubMed]
  3. Yue, F.; Li, S.; Liu, C.; Zhao, Z.; Ding, H. Tracing nitrate sources with dual isotopes and long term monitoring of nitrogen species in the Yellow River, China. Sci. Rep. 2017, 7, 8537. [Google Scholar] [CrossRef] [PubMed]
  4. Carrey, R.; Ballesté, E.; Blanch, A.R.; Lucena, F.; Pons, P.; López, J.M.; Rull, M.; Solà, J.; Micola, N.; Fraile, J.; et al. Combining multi-isotopic and molecular source tracking methods to identify nitrate pollution sources in surface and groundwater. Water Research 2021, 188, 116537. [Google Scholar] [CrossRef] [PubMed]
  5. Kasem, A.M.; Xu, Z.; Jiang, H.; Liu, W.; Zhang, J.; Nosair, A.M. Nitrate Source and Transformation in Groundwater under Urban and Agricultural Arid Environment in the Southeastern Nile Delta, Egypt. Water 2023, 16, 22. [Google Scholar] [CrossRef]
  6. Yin, C.; Yang, H.; Wang, J.; Guo, J.; Tang, X.; Chen, J. Combined use of stable nitrogen and oxygen isotopes to constrain the nitrate sources in a karst lake. Agric. Ecosyst. Environ. 2020, 303, 107089. [Google Scholar] [CrossRef]
  7. Zhao, Y.; Dang, J.; Wang, F. Sources of Nitrogen Pollution in Upstream of Fenhe River Reservoir Based on the Nitrogen and Oxygen Stable Isotope. J. Chem. 2020, 2020, 1–8. [Google Scholar] [CrossRef]
  8. Guo, W.; Luo, L.; Zhang, Z.; Zheng, N.; Xiao, H.; Xiao, H. The use of stable oxygen and nitrogen isotopic signatures to reveal variations in the nitrate formation pathways and sources in different seasons and regions in China. Environ. Res. 2021, 201, 111537. [Google Scholar] [CrossRef]
  9. Xue, D.; Botte, J.; De Baets, B.; Accoe, F.; Nestler, A.; Taylor, P.; Van Cleemput, O.; Berglund, M.; Boeckx, P. Present limitations and future prospects of stable isotope methods for nitrate source identification in surface and groundwater. Water Res. 2009, 43, 1159–1170. [Google Scholar] [CrossRef]
  10. Xia, X.; Zhang, S.; Li, S.; Zhang, L.; Wang, G.; Zhang, L.; Wang, J.; Li, Z. The cycle of nitrogen in river systems: Sources, transformation, and flux. Environ. Sci. Process. Impacts 2018, 20, 863–891. [Google Scholar] [CrossRef]
  11. Xue, D.; De Baets, B.; Van Cleemput, O.; Hennessy, C.; Berglund, M.; Boeckx, P. Use of a Bayesian isotope mixing model to estimate proportional contributions of multiple nitrate sources in surface water. Environ. Pollut. 2012, 161, 43–49. [Google Scholar] [CrossRef] [PubMed]
  12. Zhang, J.; Cao, M.; Jin, M.; Huang, X.; Zhang, Z.; Kang, F. Identifying the source and transformation of riverine nitrates in a karst watershed, North China: Comprehensive use of major ions, multiple isotopes and a Bayesian model. J. Contam. Hydrol. 2022, 246, 103957. [Google Scholar] [CrossRef] [PubMed]
  13. Xing, M.; Liu, W. Using dual isotopes to identify sources and transformations of nitrogen in water catchments with different land uses, Loess Plateau of China. Environ. Sci. Pollut. Res. 2015, 23, 388–401. [Google Scholar] [CrossRef] [PubMed]
  14. Zhang, Y.; Shi, P.; Li, F.; Wei, A.; Song, J.; Ma, J. Quantification of nitrate sources and fates in rivers in an irrigated agricultural area using environmental isotopes and a Bayesian isotope mixing model. Chemosphere 2018, 208, 493–501. [Google Scholar] [CrossRef] [PubMed]
  15. Li, C.; Li, S.; Yue, F.; Liu, J.; Zhong, J.; Yan, Z.; Zhang, R.; Wang, Z.; Xu, S. Identification of sources and transformations of nitrate in the Xijiang River using nitrate isotopes and Bayesian model. Sci. Total Environ. 2019, 646, 801–810. [Google Scholar] [CrossRef] [PubMed]
  16. Liu, X.; Han, G.; Zeng, J.; Liu, J.; Li, X.; Boeckx, P. The effects of clean energy production and urbanization on sources and transformation processes of nitrate in a subtropical river system: Insights from the dual isotopes of nitrate and Bayesian model. J. Clean. Prod. 2021, 325, 129317. [Google Scholar] [CrossRef]
  17. Chen, W.; Zhang, X.; Wu, N.; Yuan, C.; Liu, Y.; Yang, Y.; Chen, Z.; Dahlgren, R.A.; Zhang, M.; Ji, X. Sources and transformations of riverine nitrogen across a coastal-plain river network of eastern China: New insights from multiple stable isotopes. Sci. Total Environ. 2024, 924, 171671. [Google Scholar] [CrossRef] [PubMed]
  18. Fadhullah, W.; Yaccob, N.S.; Syakir, M.I.; Muhammad, S.A.; Yue, F.; Li, S. Nitrate sources and processes in the surface water of a tropical reservoir by stable isotopes and mixing model. Sci. Total Environ. 2020, 700, 134517. [Google Scholar] [CrossRef] [PubMed]
  19. Hu, Y.; Jin, Z.; Hu, Q.; Hu, J.; Ni, C.; Li, F. Using stable isotopes to identify nitrogen transformations and estimate denitrification in a semi-constructed wetland. Sci. Total Environ. 2020, 720, 137628. [Google Scholar] [CrossRef]
  20. Battaglin, W.A.; Kendall, C.; Chang, C.C.Y.; Silva, S.R.; Campbell, D.H. Chemical and isotopic evidence of nitrogen transformation in the Mississippi River, 1997–1998. Hydrol. Process. 2001, 15, 1285–1300. [Google Scholar] [CrossRef]
  21. Liu, T.; Wang, F.; Michalski, G.; Xia, X.; Liu, S. Using 15N, 17O, and 18O To Determine Nitrate Sources in the Yellow River, China. Environ. Sci. Technol. 2013, 47, 13412–13421. [Google Scholar] [CrossRef] [PubMed]
  22. Dong, Y.; Yang, J.; Zhao, X.; Yang, S.; Mulder, J.; Dörsch, P.; Zhang, G. Nitrate runoff loss and source apportionment in a typical subtropical agricultural watershed. Environ. Sci. Pollut. Res. 2021, 29, 20186–20199. [Google Scholar] [CrossRef] [PubMed]
  23. Wu, Y.; Jiang, X.; Yao, Y.; Kang, X.; Niu, Y.; Wang, K. Effect of rainfall–runoff process on sources and transformation of nitrate at the urban catchment scale. Urban Clim. 2024, 53, 101805. [Google Scholar] [CrossRef]
  24. Wu, Y.; Ju, H.; Jiang, H.; Zhang, G.; Qi, P.; Li, Z. Identifying nitrate sources and transformations in an agricultural watershed in Northeast China: Insights from multiple isotopes. J. Environ. Manag. 2023, 340, 118023. [Google Scholar] [CrossRef]
  25. Sui, Y.; Ou, Y.; Yan, B.; Rousseau, A.N.; Fang, Y.; Geng, R.; Wang, L.; Ye, N. A dual isotopic framework for identifying nitrate sources in surface runoff in a small agricultural watershed, northeast China. J. Clean. Prod. 2020, 246, 119074. [Google Scholar] [CrossRef]
  26. Weigand, M.A.; Foriel, J.; Barnett, B.; Oleynik, S.; Sigman, D.M. Updates to instrumentation and protocols for isotopic analysis of nitrate by the denitrifier method. Rapid Commun. Mass Spectrom. 2016, 30, 1365–1383. [Google Scholar] [CrossRef] [PubMed]
  27. Fu, Q.; Zhang, W.P. Practical Handbook of Environmental Monitoring Standards (Book 1): Water Monitoring Methods; China Environmental Sciences Press: Beijing, China, 2013. [Google Scholar]
  28. Cui, J.; Zhou, F.; Gao, M.; Zhang, L.; Zhang, L.; Du, K.; Leng, Q.; Zhang, Y.; He, D.; Yang, F.; et al. A comparison of various approaches used in source apportionments for precipitation nitrogen in a mountain region of southwest China. Environ. Pollut. 2018, 241, 810–820. [Google Scholar] [CrossRef] [PubMed]
  29. Salmasi, F.; Abraham, J.; Salmasi, A. Effect of stepped spillways on increasing dissolved oxygen in water, an experimental study. J. Environ. Manag. 2021, 299, 113600. [Google Scholar] [CrossRef]
  30. Xia, X.; Liu, T.; Yang, Z.; Michalski, G.; Liu, S.; Jia, Z.; Zhang, S. Enhanced nitrogen loss from rivers through coupled nitrification-denitrification caused by suspended sediment. Total Environ. 2017, 579, 47–59. [Google Scholar] [CrossRef]
  31. Liu, T.; Xia, X.; Liu, S.; Mou, X.; Qiu, Y. Acceleration of denitrification in turbid rivers due to denitrification occurring on suspended sediment in oxic waters. Environ. Sci. Technol. 2013, 47, 4053–4061. [Google Scholar] [CrossRef]
  32. Li, Y.; Guo, L.; Shi, T.; Gavin, S.; Zhao, H. Salinity of animal manure and potential risk of secondary soil salinization through successive manure application. Sci. Total Environ. 2007, 383, 106–114. [Google Scholar]
  33. Liu, C.; Li, S.; Lang, Y. Using δ15N and δ18O Values To Identify Nitrate Sources in Karst Ground Water, Guiyang, Southwest China. Environ. Sci. Technol. 2006, 40, 6928–6933. [Google Scholar] [CrossRef] [PubMed]
  34. Widory, D.; Petelet, G.; Negrel, P.; Ladouche, B. Tracking the sources of nitrate in groundwater using coupled nitrogen and boron isotopes a synthesis. Environ. Sci. Technol. 2005, 39, 539–548. [Google Scholar] [CrossRef] [PubMed]
  35. Li, Y.; Yang, Z.; Yin, X.; Sun, W. Identification of nitrate sources and the fate of nitrate in downstream areas: A case study in the Taizi River Basin. Environ. Sci. 2018, 39, 1076–1084. [Google Scholar]
  36. Zhang, Y.; Shi, P.; Song, J.; Li, Q. Application of Nitrogen and Oxygen Isotopes for Source and Fate Identification of Nitrate Pollution in Surface Water: A Review. Appl. Sci. 2018, 9, 18. [Google Scholar] [CrossRef]
  37. Qin, Y.; Zhang, D.; Wang, F. Using nitrogen and oxygen isotopes to access sources and transformations of nitrogen in the Qinhe Basin, North China. Environ. Sci. Pollut. Res. 2018, 26, 738–748. [Google Scholar] [CrossRef]
  38. Chen, Z.; Yu, L.; Liu, W.; Lam, M.; Liu, G.; Yin, X. Nitrogen and oxygen isotopic compositions of water-soluble nitrate in Taihu Lake water system, China: Implication for nitrate sources and biogeochemical process. Environ. Earth Sci. 2013, 71, 217–223. [Google Scholar] [CrossRef]
  39. Alexander, R.B.; Smith, R.A.; Schwarz, G.E. Effect of stream channel size on the delivery of nitrogen to the Gulf of Mexico. Nature 2000, 403, 758–761. [Google Scholar] [CrossRef]
Figure 1. Sampling point layout of the middle reaches of the Yellow River basin.
Water 16 01173 g001
Figure 2. Comparison of river flow in different periods.
Water 16 01173 g002
Figure 3. Relationship between δ15N and δ18O values during the different sampling periods. AF indicates atmospheric deposition of nitrogen; SN indicates soil nitrogen; M&S indicate manures and sewage.
Water 16 01173 g003
Figure 4. Seasonal and spatial contributions of nitrate sources estimated via SIAR. CF indicates chemical nitrogen fertilizer.
Water 16 01173 g004
Figure 5. The relationship between Cl concentration and NO3/Cl. (a) The mainstream of the Yellow River; (b) the Yiluo River (T1); (c) the Qin River (T2).
Water 16 01173 g005
Table 1. The statistical results regarding hydrochemical characteristics (Unit: mg L−1, except for pH and temperature).
LocationTimeStatisticpHTDOCODcrNH4+NO3TNClSS
M1Dry seasonMax8.4012.1013.2016.120.223.874.57116.131439.65
Min7.903.8010.0010.300.042.693.23107.11571.55
Mean8.268.2211.3612.490.153.213.87111.611040.81
SD0.223.441.342.330.070.430.523.53349.17
Wet seasonMax8.1029.908.4015.100.222.963.62118.782369.22
Min7.7022.706.9011.800.031.441.93102.331372.26
Mean7.9025.707.7213.820.092.192.67109.281861.44
SD0.152.880.571.270.080.660.738.34422.26
M2Dry seasonMax8.6012.3012.8017.340.213.744.67118.171198.87
Min7.804.209.6010.500.092.653.17106.34632.09
Mean8.328.5810.7612.790.163.344.04113.20907.01
SD0.303.451.322.680.050.420.584.81261.99
Wet seasonMax8.1030.108.2014.900.343.063.80116.871839.16
Min7.7022.806.7011.800.021.371.88104.231089.23
Mean7.9025.867.3613.570.142.332.89109.521462.57
SD0.153.010.671.310.120.710.795.98314.45
T1Dry seasonMax8.3013.1016.4031.300.796.127.4279.0460.11
Min7.604.008.9010.900.523.985.4671.0043.28
Mean8.049.1411.8015.770.674.786.1673.2451.23
SD0.264.012.948.780.100.830.823.276.31
Wet seasonMax8.4029.2012.5024.300.773.384.4660.4474.15
Min7.9025.507.7012.600.101.311.4652.0857.11
Mean8.1828.189.4618.600.572.022.9356.3765.20
SD0.211.522.135.350.270.821.083.106.83
T2Dry seasonMax8.6013.3014.609.230.214.816.2177.0070.92
Min8.104.107.608.210.114.024.4861.0048.16
Mean8.359.1610.668.650.164.415.4866.6456.64
SD0.183.982.530.460.050.280.676.558.84
Wet seasonMax8.7028.609.2011.600.214.024.7055.70113.04
Min7.9025.807.208.150.051.551.6541.2763.54
Mean8.5127.308.2410.390.163.133.9749.8192.95
SD0.310.990.731.410.070.941.305.3219.48
Note: NO2 was not detected.
Table 2. Correlation coefficients of pollutant concentration and river flow.
LocationCorrelation Coefficient
NH4+-NTN
M2−0.06−0.19
T1−0.02−0.15
T20.060.07
Table 3. δ15N-NO3 and δ18O-NO3 in overlying water (Unit: ‰).
LocationStatisticδ15N-NO3δ18O-NO3δ15N-NO3δ18O-NO3
Dry SeasonWet Season
M1Max9.452.678.601.95
Min8.221.868.43−0.14
Mean8.782.118.521.42
SD0.480.320.080.88
M2Max10.103.559.054.25
Min8.671.868.580.21
Mean9.392.908.752.13
SD0.630.770.201.45
T1Max14.756.5414.825.91
Min13.305.5411.245.47
Mean13.775.9112.205.70
SD0.570.391.480.16
T2Max13.836.1611.964.98
Min11.984.259.912.91
Mean13.144.9211.053.49
SD0.800.730.760.84
Disclaimer/Publisher’s Note: The statements, opinions and data contained in all publications are solely those of the individual author(s) and contributor(s) and not of MDPI and/or the editor(s). MDPI and/or the editor(s) disclaim responsibility for any injury to people or property resulting from any ideas, methods, instructions or products referred to in the content.

