
Capillary Imbibition Laws of Fresh–Brackish Waters in Sandstone

1
College of Architecture and Civil Engineering, Xi’an University of Science and Technology, Xi’an 710054, China
2
National Key Laboratory of Green Long-Life Road Engineering in Extreme Environment, CCCC First Highway Consultants Co., Ltd., Xi’an 710000, China
3
College of Geology and Environment, Xi’an University of Science and Technology, Xi’an 710054, China
*
Author to whom correspondence should be addressed.
Water 2024, 16(8), 1180; https://doi.org/10.3390/w16081180
Submission received: 21 March 2024
/
Revised: 15 April 2024
/
Accepted: 17 April 2024
/
Published: 20 April 2024
(This article belongs to the Special Issue Thermo-Hydro-Mechanical Coupling in Fractured Porous Media)
Abstract
:Understanding the capillary imbibition laws of brackish water in rocks is necessary to reveal the mechanism of fluid, salt, and ion transport. In this study, we investigated the capillary imbibition laws of a Na2SO4 solution of different concentrations in sandstone by measuring the parameters of water absorption mass, water migration front height, nuclear magnetic resonance (NMR) T2 spectra, and stratified moisture distribution. The results indicate the following: (1) With an increase in the salt solution concentration, the water absorption rate of samples increases, specifically manifested in an increase in the rate of absorption mass and a rising rate of the absorption front. (2) With an increase in the salt solution concentration, the total NMR signals in samples measured at the end of water absorption decreases; that is, the total amount of water absorption decreases. (3) When the solution concentration exceeds 0.50 g/L, variations in the NMR signal of samples and the absorbed water mass over time are not synchronic and are even opposite at some stages. Based on the capillary dynamic theories of liquid, the influence of salts on solution properties and the modification of the pore structure by crystallization are considered when discussing the underlying mechanism of capillary imbibition in sandstone. By calculating the physical properties such as the density, viscosity, surface tension, and contact angle of solutions with different concentrations, the imbibition process does not exhibit any significant variation with the difference in the properties of the liquid. The equivalent capillary radii of the samples at varying salt concentrations are obtained by fitting the capillary dynamics curves with the theoretically calculated values. The equivalent capillary radii of samples in higher salt concentrations are larger, i.e., the difference in capillary imbibition laws introduced by the salt concentration should be attributed to modifications to the pore structure caused by salt crystallization.
1. Introduction
Capillary imbibition is a common phenomenon observed in natural materials (such as rock, soil, and wood) and engineering materials (including concrete, mortar, and fiber). It plays a crucial role in various geomorphic processes, such as the weathering of rocks [1,2,3] and the formation of soil vadose zones [4,5], and it contributes significantly to ecological and environmental issues like heavy metal ion migration [6,7] and salt accumulation [8,9,10]. Sedimentary rocks are widely distributed on the Earth’s surface, with sandstone being one of the most prevalent types. Sandstone not only forms various rock landforms but also serves as a commonly used building material. The degradation of sandstone properties is primarily attributed to various physical and chemical weathering processes; the underlying premise is that water and brackish water infiltrate the rock through capillary imbibition. Investigating the laws governing capillary imbibition in sandstone, particularly involving brackish water, is essential for understanding the mechanisms underlying water transport, salinity diffusion, and ion migration.
The imbibition law of an ideal fluid in cylindrical capillaries has been extensively investigated. The concept of capillary dynamics dates back to a century ago. Based on the Young–Laplace equation and Poiseuille flow profile, the Lucas–Washburn (L-W) equation [11,12] has been widely employed for studying the imbibition process of a single tube capillary with a constant cross-section. However, in the capillary imbibition process in porous media, the capillary shape is not limited to a uniform cross-section, and the capillary network becomes relatively complex. A multitude of studies have amended the limitations of the L-W equation through adjustments in curvature [13], the resistance of viscous layers [14], the slippage of solid particles [15], and various non-circular capillaries [16]. The above studies annotated the problems related to capillary statics and dynamic processes at multiple levels. The proposal put forward by Lundblad and Bergman [17] suggests that the intricate impacts of capillary geometric features can be counterbalanced through the adoption of an effective radius. From a mechanical perspective, the L-W equation neglects gravity and inertia when analyzing the rising height of samples during water imbibition processes. By analyzing forces involved in liquid rising within capillary tubes, internal flow within capillary tubes is divided into three stages: the inertial rise stage, the viscous–inertial stage, and the viscous stage. Based on this premise, several scholars have created formulas for calculating the height of capillary rise at various stages [18].
The classical theory of capillary dynamics provides a comprehensive explanation and predicts the capillary imbibition exhibited by ideal fluids in regular capillary tubes. However, the capillary imbibition laws in natural or artificial porous materials, such as rock and concrete, are more complex due to their heterogeneous pore structure, complicated components and variable environment [19]. The liquid involved in capillary imbibition is certainly not ideal fluid; some of its properties, for instance, density, viscosity, wettability and ionic concentration, have a strong influence on the imbibition process. This study aims to investigate the imbibition laws of brackish water in porous rocks by addressing the influence of solution concentration.
In capillary imbibition, the solute is also transported upwards through a solution, and salt transport through a capillary is widely observed in nature. During the capillary imbibition of brackish water, crystallization generates a rock surface through evaporation [20]. Importantly, salt crystallization was initially discovered by Lavalle [21] and later investigated by Becker and Day [22]. An equation for calculating crystallization pressure was initially proposed by Correns and Steinborn [23] and later investigated by Everett [24]. At present, Everett’s equation is the preferred choice in existing calculations. It was revealed that salt crystallization was influenced by the rock’s pore structure, environmental factors, and salt type [25]. Several studies have demonstrated that Na2SO4 is one of the key salts involved in the weathering of rocks [26]; crystallization significantly alters the pore structure, resulting not only in rock degradation but also influencing subsequent imbibition processes. Some researchers [27] have measured the water absorption mass, resistivity, and water absorption front height during capillary imbibition to investigate brackish water migration. These scholars [28] combined long-term weathering effects from high-concentration solutions with drying and wetting cycle experiments to create a law of rock degradation and weathering. However, the influence of salinity on the imbibition process has received less attention in previous studies [29].
The primary objectives of this study are to reveal the capillary imbibition law of brackish water with varying concentrations in sandstone and explore the impact of the solution concentration during capillary imbibition. Capillary imbibition tests were adopted using solutions of Na2SO4 with varying concentrations. The water imbibition mass, water imbibition front height, nuclear magnetic resonance (NMR) T2 spectra, and stratified moisture distribution were measured to observe the solution migration inside and on the surface of sandstone. Based on essential theories of capillary solution migration, the influence of the salt solution concentration on the capillary imbibition process in sandstone was analyzed.
2. Methodology
2.1. Sample Preparation
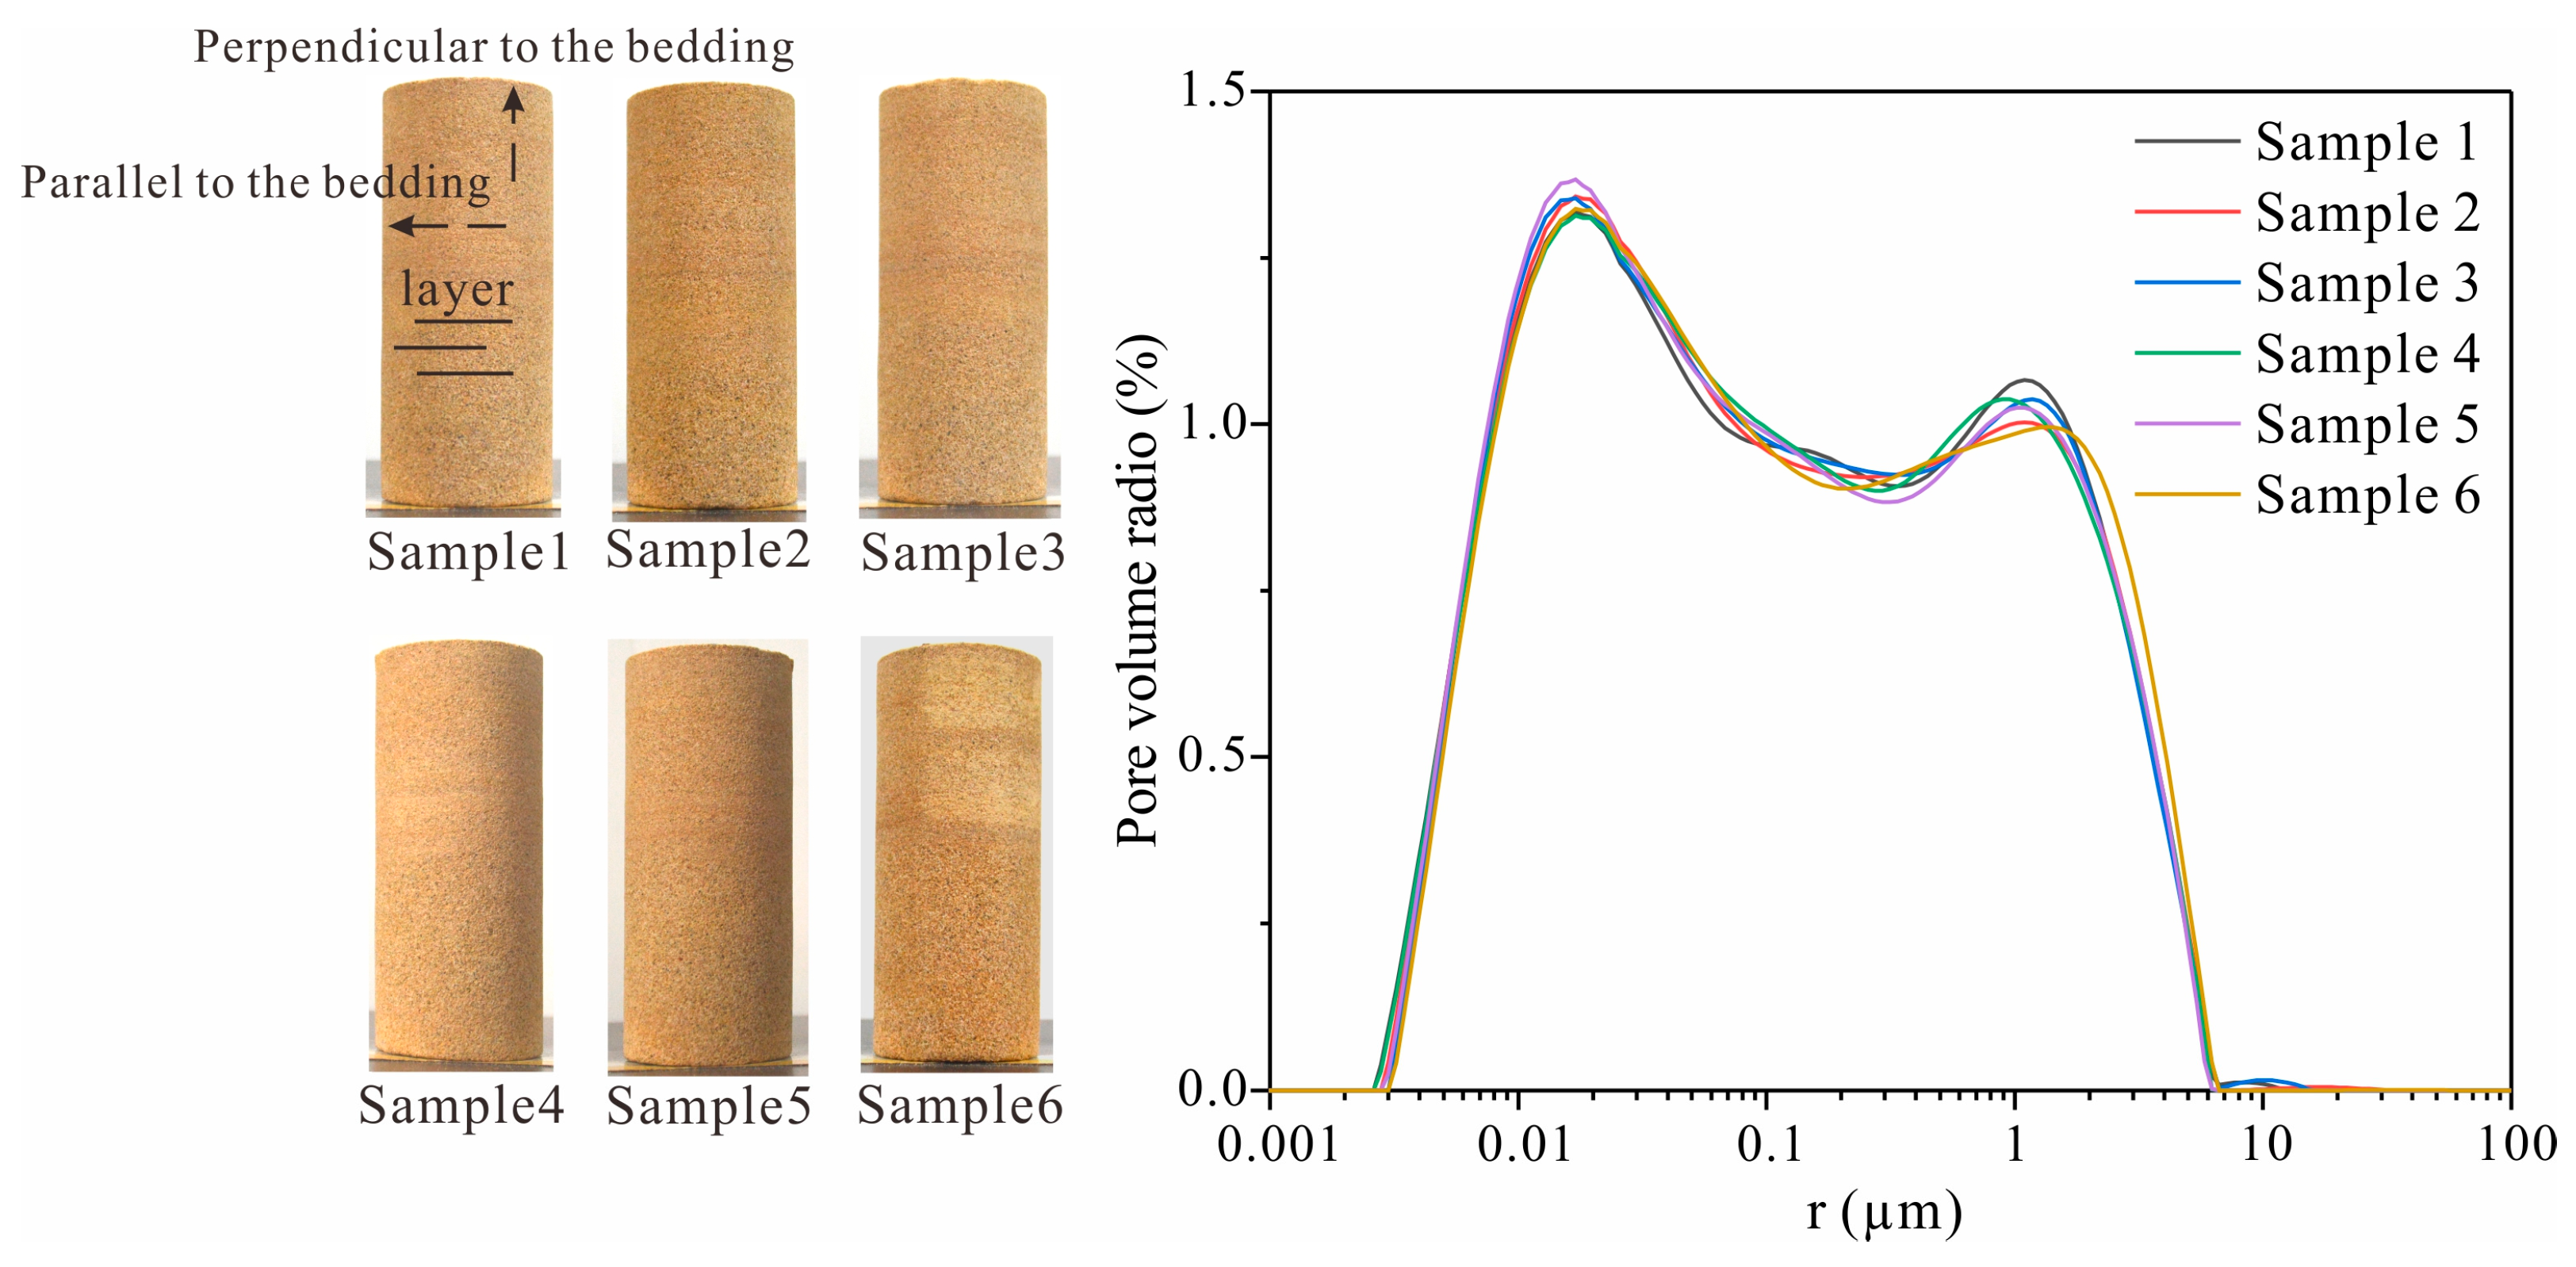
In this study, six sandstones were selected, each exhibiting bedding planes perpendicular to the axis of the cylindrical core. The sample dimensions were 50 mm (diameter) × 120 mm (height) (Figure 1). The P-wave velocity and porosity of each sample are presented in Table 1. Additionally, the pore size distribution curve was determined by testing the NMR T2 spectra of the sample (Figure 1). Na2SO4 solutions with concentrations ranging from 0 g/L to 10.00 g/L were prepared for capillary water imbibition tests.
2.2. Experimental Design
The samples were placed in the oven for 24 h (105 °C), and then the mass of the sample was measured. The drying sample was subjected to capillary water imbibition testing by placing it on top of a permeable stone and adding brackish water with varying concentrations to the Petri dish until no obvious moisture remained on the surface of the permeable stone. The Petri dish was then covered with an inverted beaker.
- (1)
- Water imbibition mass and height of the water imbibition front measurements
Water imbibition mass is defined as the difference between the imbibition mass at a certain moment and the initial mass. The water imbibition front is defined as the boundary between the drying and wetting zones is the imbibition front during capillary imbibition process. The duration of water imbibition was measured when the sample came into contact with a permeable stone. Within the first 5 min, the mass and height of the sample were measured and photographed. As the sample’s water imbibition rate slowed, the interval for its water imbibition process increased to 10–30 min. In the later stages of the test, the interval extended to 60 min to 2 h until the imbibition mass remained stable. The height of the capillary water imbibition front was measured through four lines drawn on top of the sample, and then their average value was calculated under different intervals.
- (2)
- NMR T2 spectra and stratified moisture distribution measurements
The duration of water imbibition was measured when the sample came into contact with a permeable stone. Initially, the T2 spectra and stratified moisture distribution were measured after 5 min of water imbibition. As the rate of water imbibition decreased, the interval for T2 spectra and stratified moisture distribution test was extended to 10–30 min. In later stages, the interval further increased from 60 min to 2 h. A MacroMR12-150H-I nuclear magnetic resonance microstructure analysis and imaging system was used for testing the T2 spectra and stratified moisture distribution. The stratified moisture distribution is a testing method that accurately represents the spatial variation in water content along the vertical axis of the sample. The stratified moisture distribution and its corresponding figures are presented in Section 4.2.
2.3. Test Theory of Nuclear Magnetic Resonance (NMR)
- (1)
- Measurement of T2 spectra
The distribution of water during capillary water imbibition was tested using NMR. The hydrogen protons randomly distribute within the pore water of rocks and generate a magnetization vector that aligns with the magnetic field direction of the permanent magnet field. Subsequently, these magnetized protons undergo flipping from a new equilibrium position due to the alternating electromagnetic field. Upon removal of the alternating magnetic field, the protons revert to their initial states of equilibrium; the above processes are referred to as relaxation [30]. The transverse relaxation times of water demonstrate variations with different pore sizes. Matteson [31] and Jia [32] divided water into three types, namely bound water, capillary water, and bulk water, based on transverse relaxation times of 3 ms and 33 ms.
- (2)
- Measurement of the stratified moisture distribution
Stratified moisture distribution can offer a more precise indication of the spatial distribution of water content within rocks, similar to the T2 spectra test theory. The perpendicular gradient magnetic field Gy is applied in conjunction with the original static magnetic field B0 to the sample, resulting in an increase in the NMR signal amplitude at each position along the y-axis. Assuming a magnetic field strength of BA at height A in the sample, a one-dimensional linear gradient magnetic field is applied to excite H protons at height A for magnetic resonance. By measuring the relaxation time, we can determine the pore water content in section A. The echo signals collected from the sample are then subject to a one-dimensional Fourier transform for analysis; with a simple conversion, a signal amplitude corresponding to their respective water contents is obtained for varying layers within the sample [33].
3. Observation of Capillary Imbibition
3.1. The Variation in Water Imbibition Mass and Sorptivity S
- (1)
- Water imbibition mass
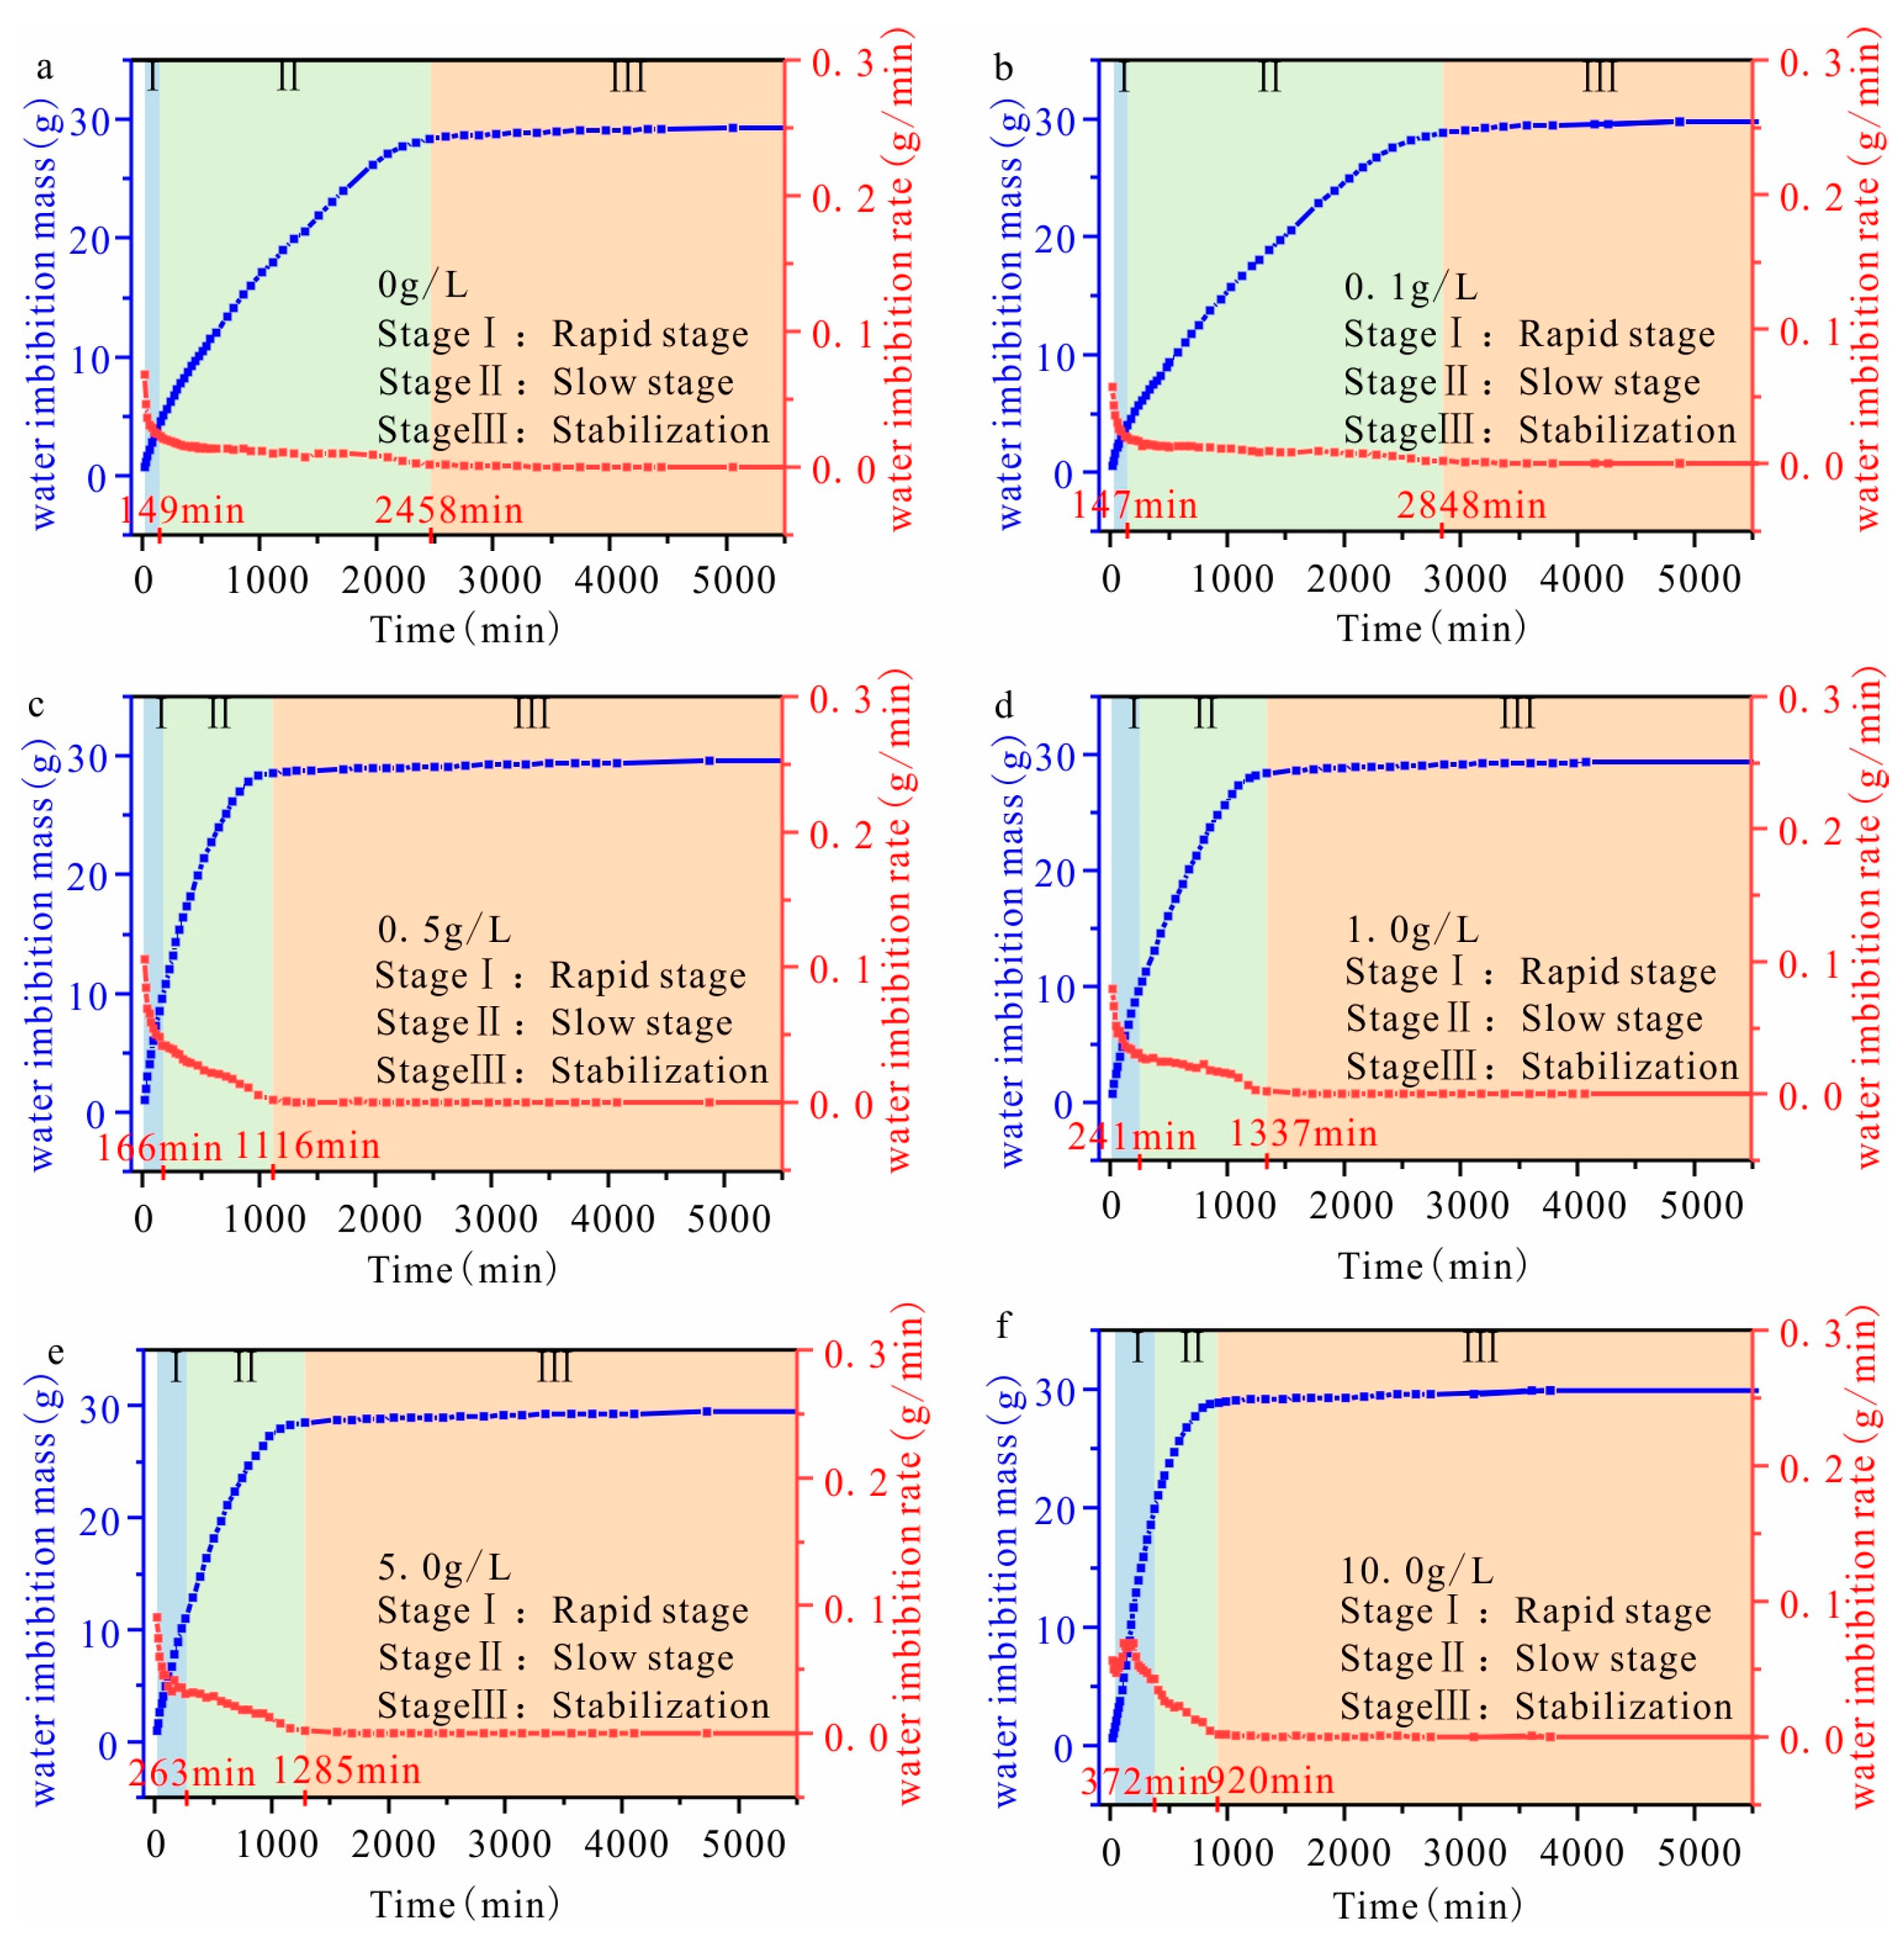
Figure 2 shows that as the imbibition time increases, the imbibition mass increases, with minimal variation observed at the later stages. Additionally, an increase in solution concentration leads to a decrease in the stable duration of imbibition mass. The water imbibition rate is defined as the variation in the imbibition mass over time, and it demonstrates an inverse relationship with the imbibition time. However, the imbibition rate is directly proportional to the solution concentration increase. In capillary imbibition, the initial stage shows an increasing rate of imbibition, while later stages demonstrate a stable rate. The capillary imbibition process of sandstone samples at varying solution concentrations shows a similar trend, characterized by three stages: rapid increase, slow increase, and stabilization, and these stages are determined by the variation in the water imbibition rate. The impact of the solution concentration is manifested in variations when measuring the water imbibition mass, water imbibition rate, and duration among samples at each stage (Figure 2). The porosity of the six samples is similar, and they display a perpendicular bedding structure. Moreover, there is minimal variation in the total water imbibition mass of each sample. The impact of the solution concentration is primarily manifested in the stages of rapid and slow increase.
The duration of the “rapid increase” stage increases with varying solution concentrations, as demonstrated in Table 2. In particular, when the solution concentration reaches 1.00 g/L, there is a significant extension with the duration of this stage. The water imbibition mass during the “rapid increase” stage is proportional to the increase in the solution concentration. Moreover, there is a corresponding increase in the water imbibition rate at this stage. The duration of the “slow increase” stage decreases as the solution concentration increases, resulting in a corresponding decline in the water imbibition mass during this stage. The aqueous solution imbibition rate at this stage is higher than that of the brackish water solution, while there is no significant variation in the imbibition rate of the latter.
- (2)
- Sorptivity S
The mass of capillary water imbibition has been shown to exhibit a linear correlation with the square root of time until reaching stabilization in numerous experimental studies. The slope of this linear relationship, referred to as the sorptivity S, has served as a standard for evaluating the capillary water absorption capacity [34]. The sorptivity S is the ratio of the water imbibition mass per unit area to the imbibition time:
where i is the cumulative water imbibition mass at various intervals, and k is a constant. Figure 3 shows the attainment of sorptivity S.
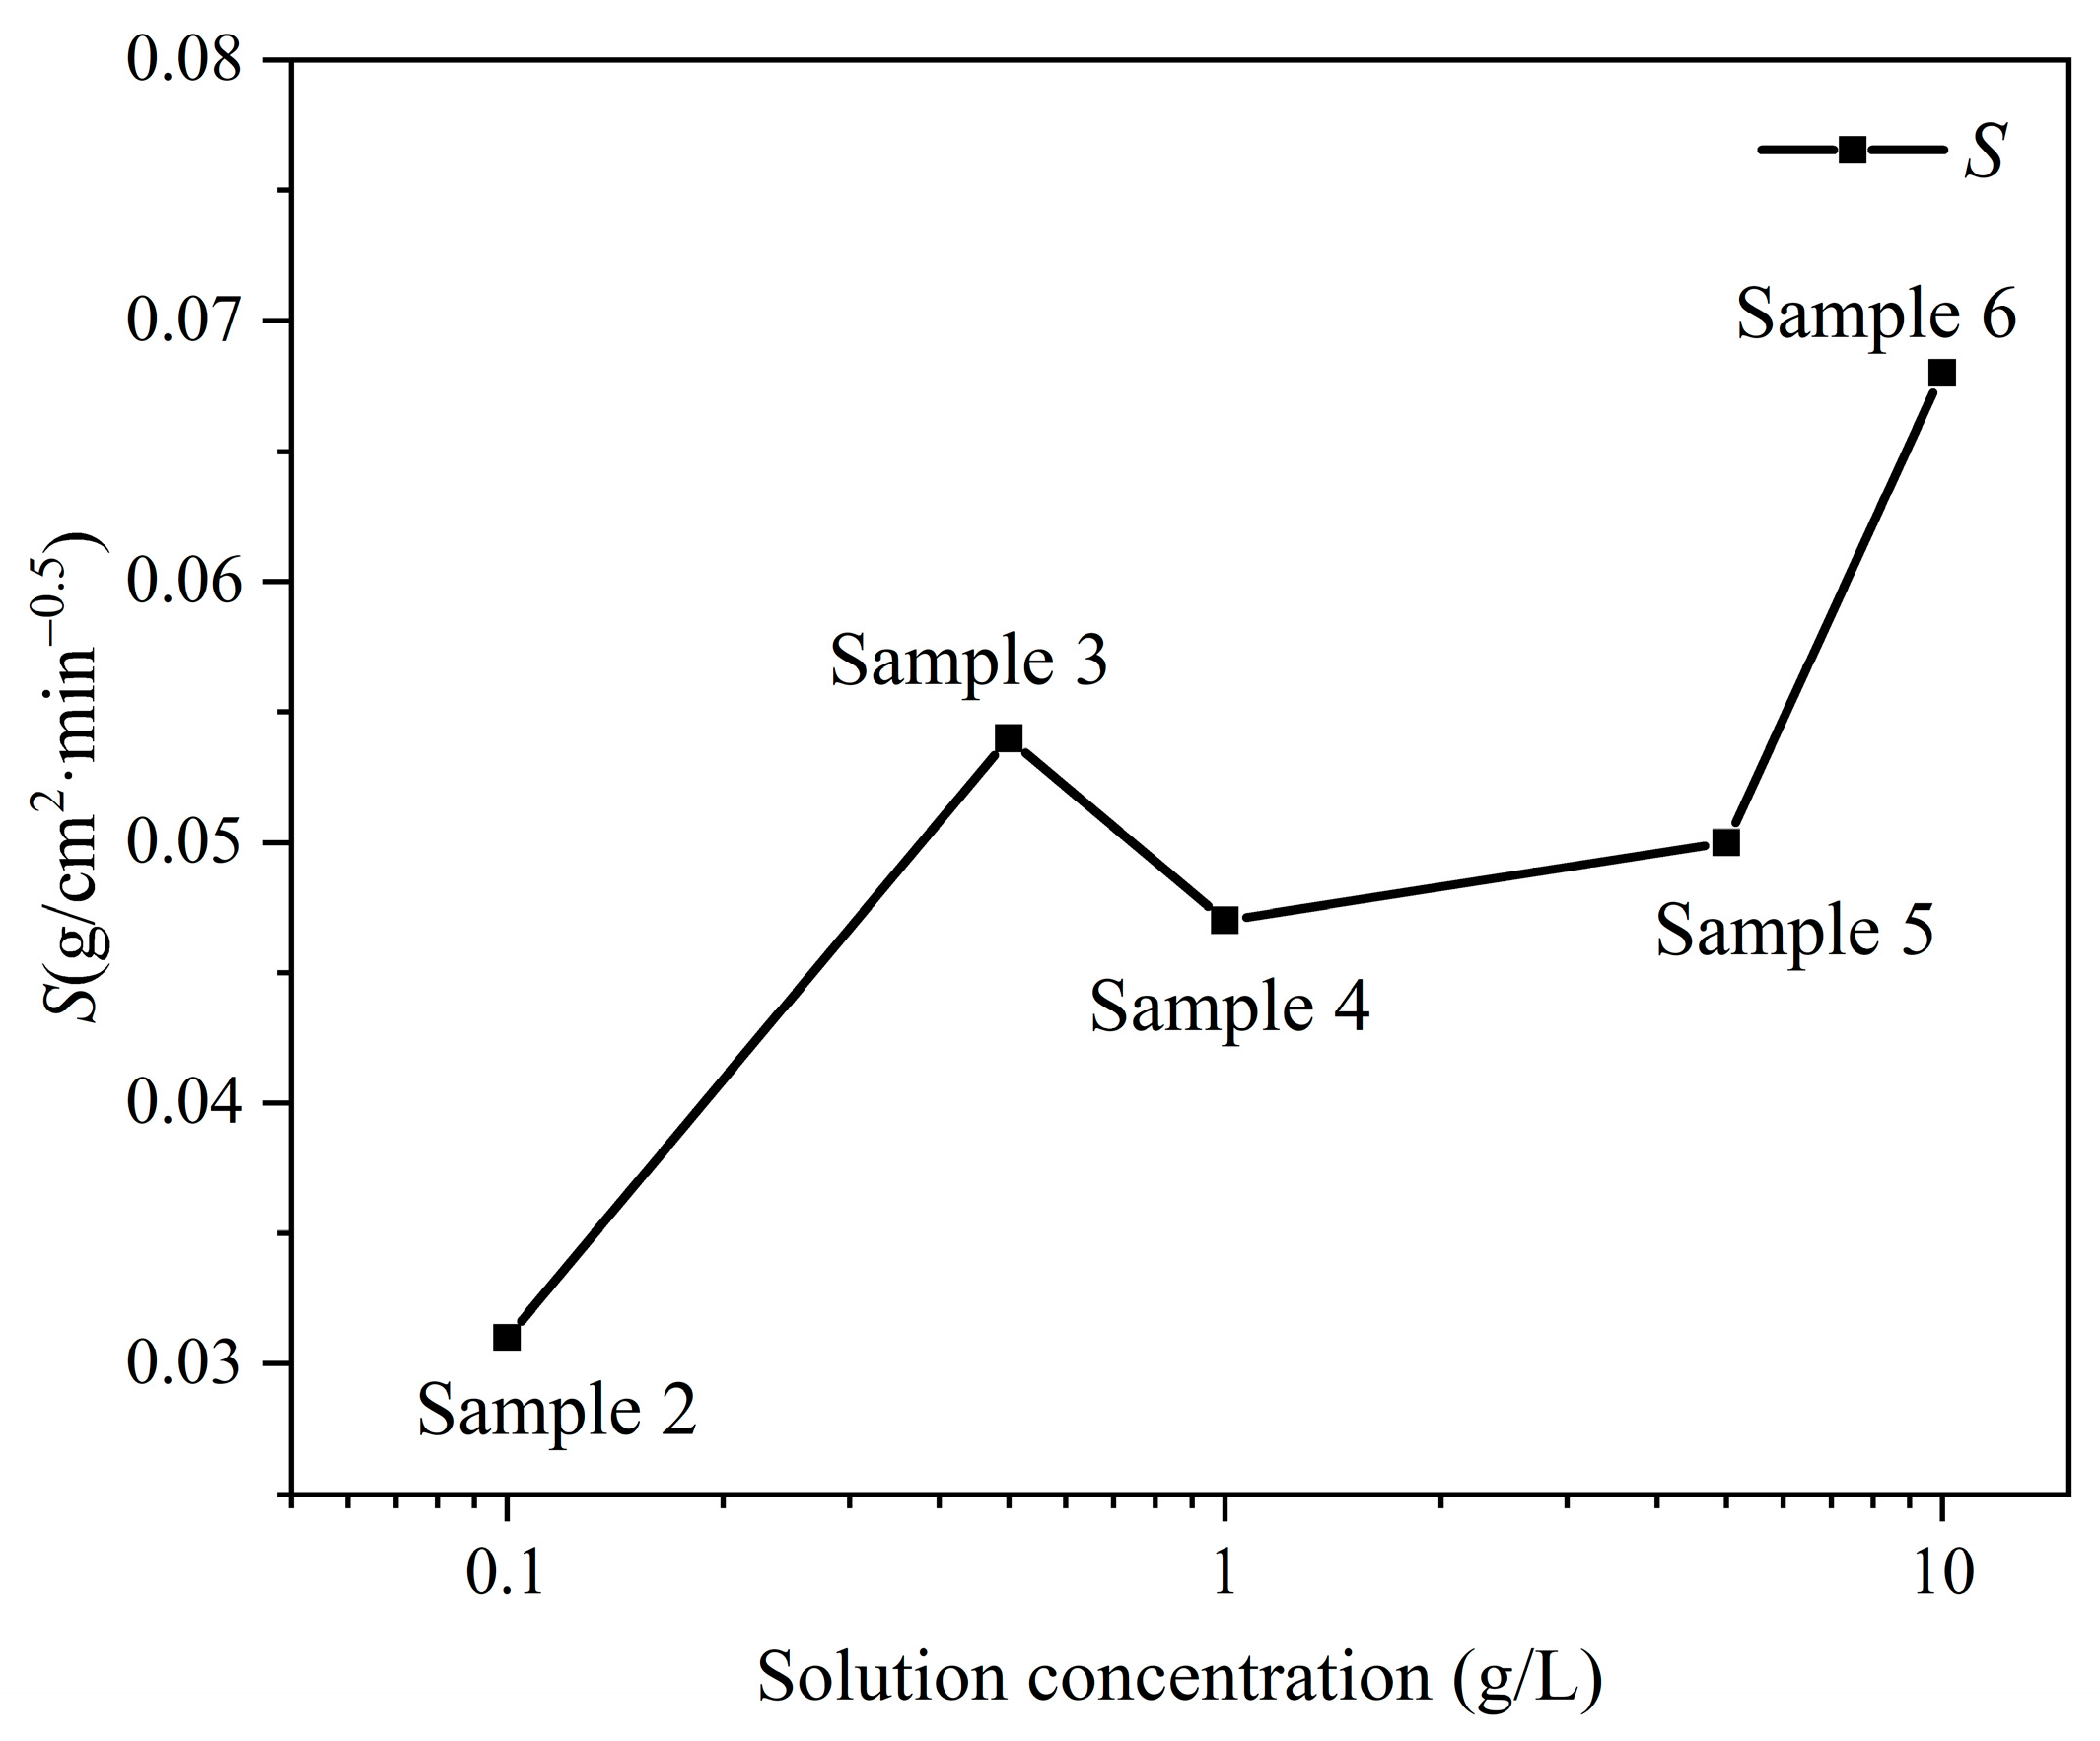
The sample’s sorptivity consistently increases with the solution concentration (Figure 4). The sorptivity of sample 3, at a concentration of 0.5 g/L, only slightly declines compared to that of sample 6, which has the highest solution concentration.
The sorptivity can be categorized into three types [35]: S > 0.039 g/cm2min0.5, where the sample is highly absorbent; S ranging from 0.0065 to 0.039 g/cm2min0.5, where the sample is moderately absorbent; and S < 0.0065 g/cm2min0.5, where the sample is slightly absorbent. The sorptivity of samples with varying concentrations can be categorized into varying types of water imbibition. The sorptivity of the samples with concentrations of 0 g/L (sample 1) and 0.1 g/L (sample 2) are 0.032 g/cm2min0.5 and 0.031 g/cm2min0.5, respectively, which are classified as moderately absorbent; the sorptivity of the samples with concentrations of 0.5 g/L, 1.0 g/L, 5.0 g/L, and 10.0 g/L (samples 3, 4, 5, and 6) is above 0.0065 g/cm2min0.5, classifying them as highly absorbent.
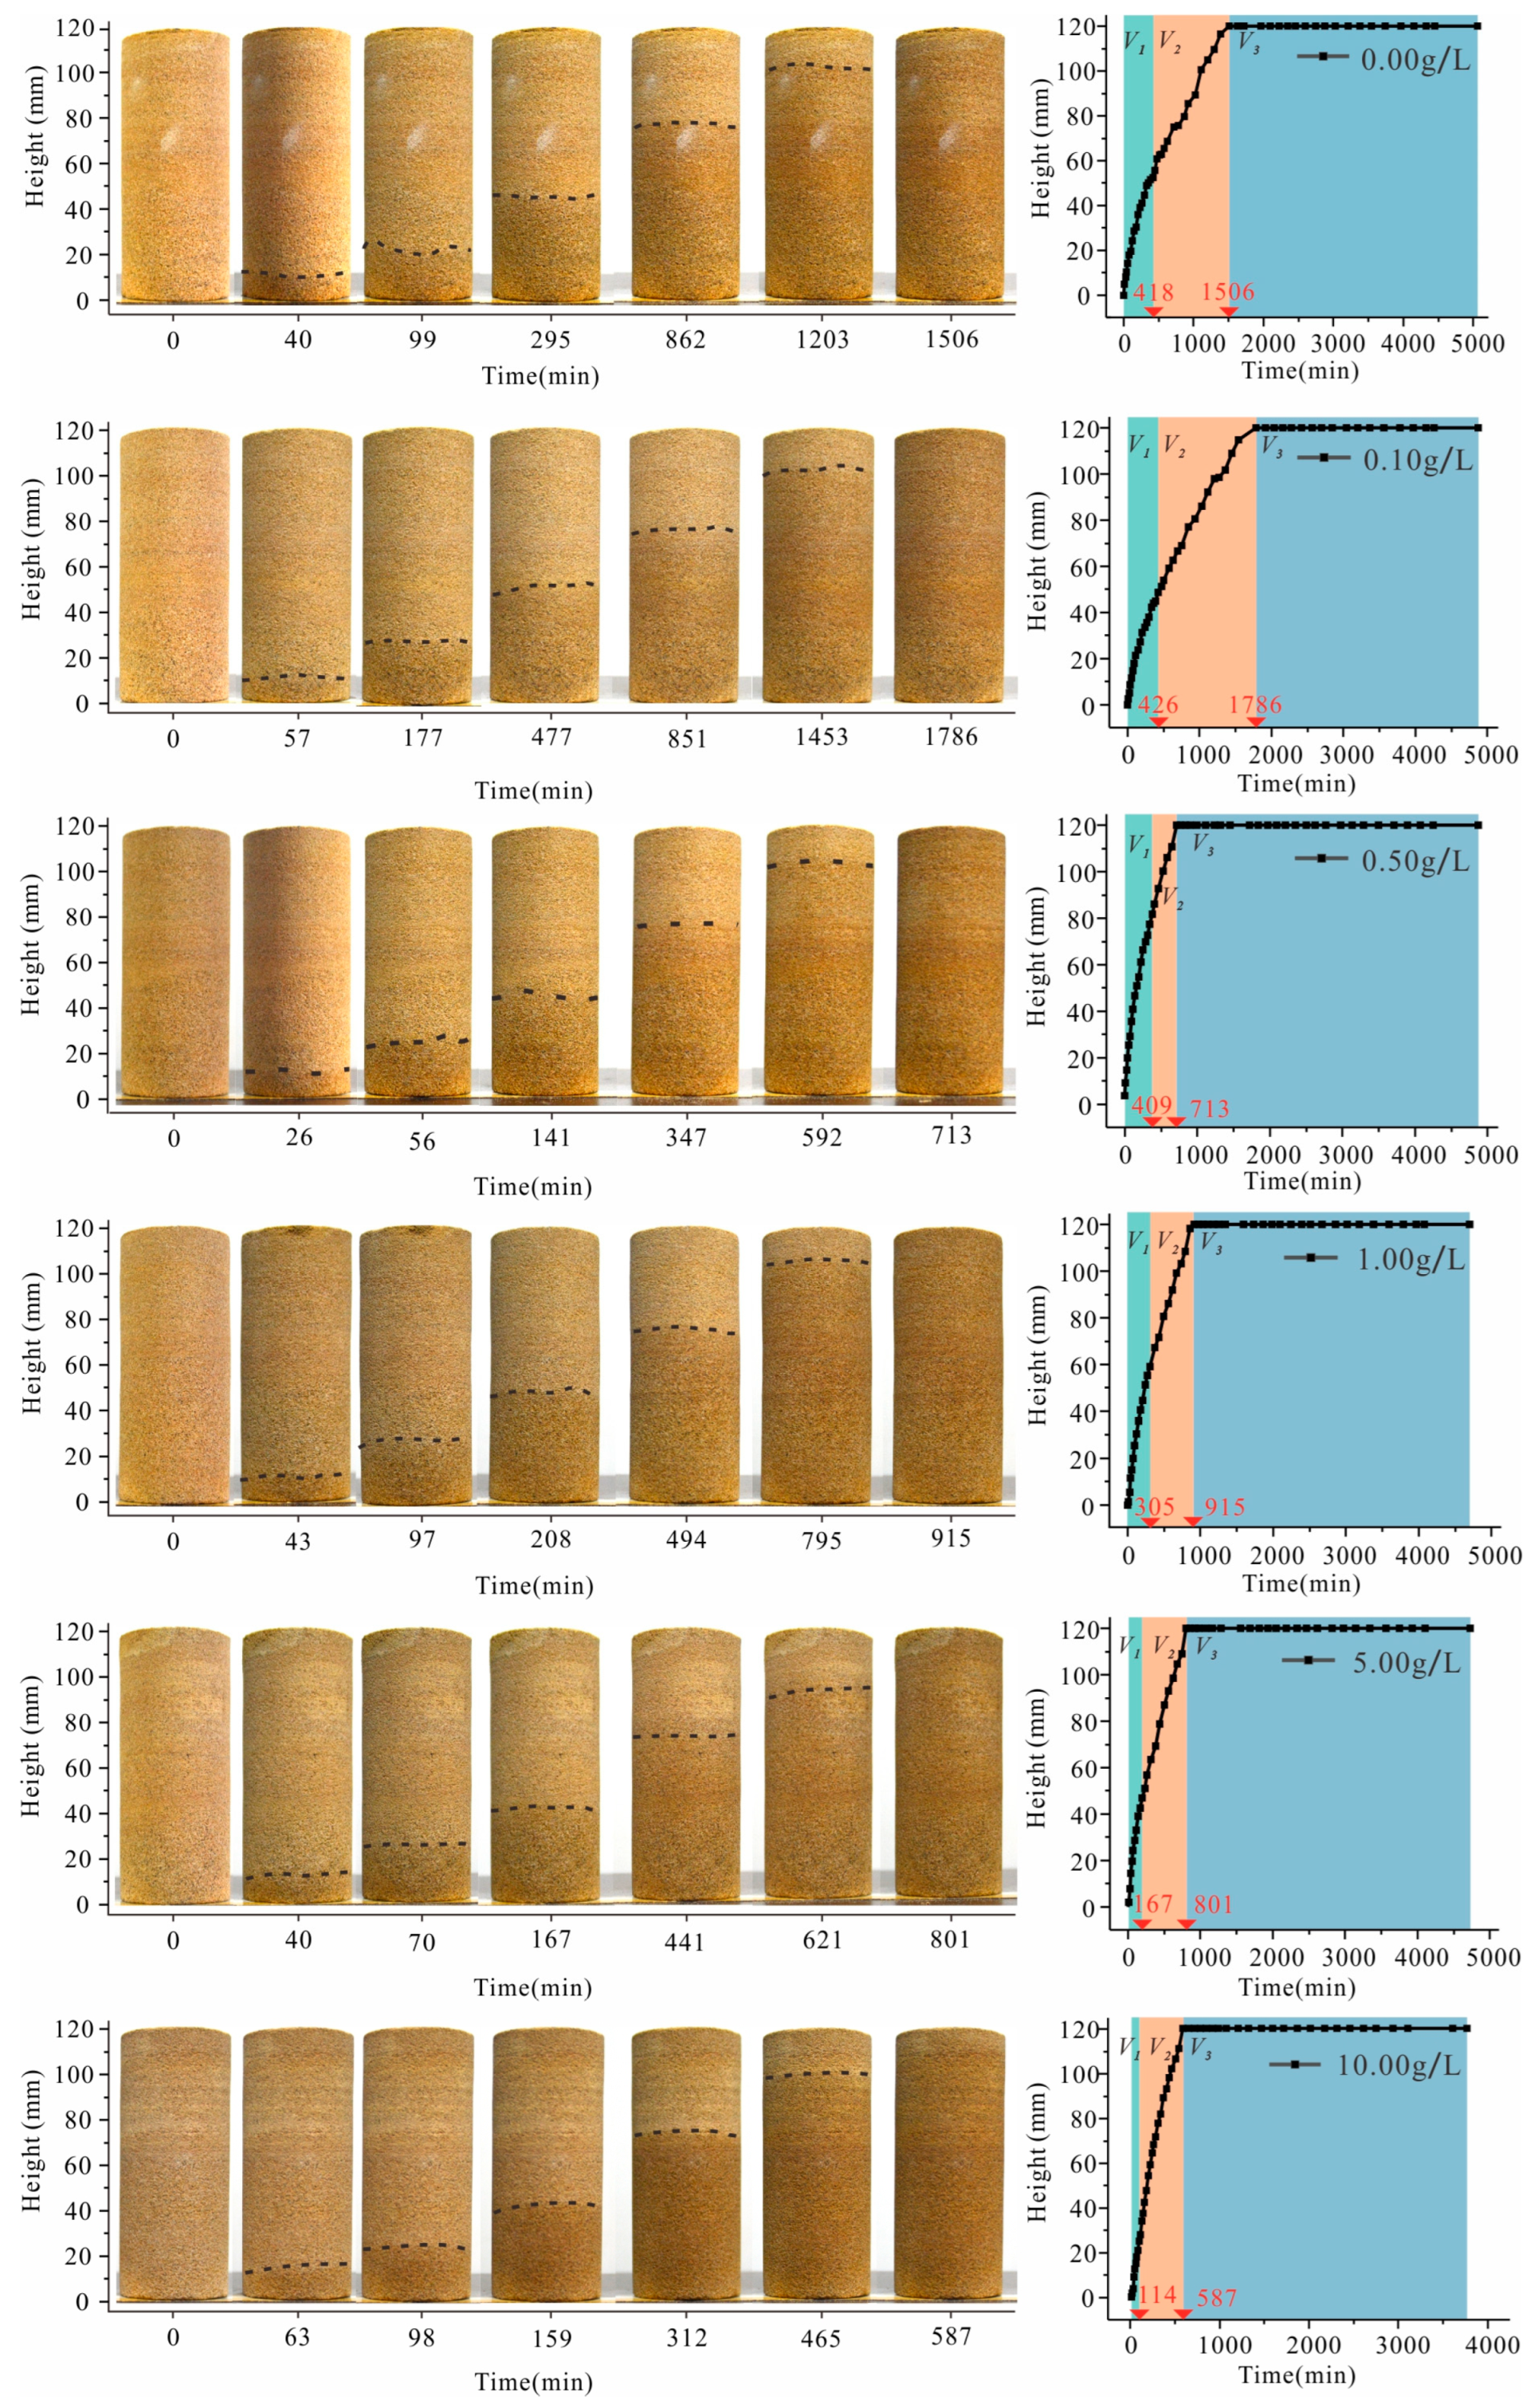
3.2. Variation in the Height of the Imbibition Front
The impact of the solution concentration on the variation in the water imbibition front height is clearly demonstrated in Figure 5. In general, except for samples with a concentration of 0.50 g/L, the duration for the water imbibition front height to reach its maximum gradually decreases as the solution concentration increases. The height of the capillary imbibition front of the sample initially exhibits a rapid rise, followed by a decrease in the rate of rise until it eventually reaches the top of the sample. Therefore, the variation in the height of the capillary imbibition front over time can be categorized into three distinct stages: rapid rise (V1), slow rise (V2), and stabilization (V3). We can define the variation in the height of the imbibition front with time as the water imbibition front rise rate. The slope of the fitted front height versus the time curve is calculated as the front rise rate at a certain stage. The results of the front rise rate for the fast-rise and slow-rise stages are shown in Figure 6.
The rate of the imbibition front rise increases with an increase in the solution concentration during stages V1 and V2 (Figure 6). Specifically, during V1 and V2, the rate of the imbibition front rise at a concentration of 10.0 g/L (sample 6) is approximately three times higher than that at 0 g/L (sample 1).
In this section, we investigate the capillary imbibition process of salt solutions with varying concentrations by monitoring parameter variations during water imbibition. The test findings reveal that increasing the salt concentration does not significantly impact the total water imbibition mass; however, it leads to sorptivity increases, and the time taken to reach the top of samples decreases. The water imbibition mass and height of the water imbibition front during capillary imbibition can be classified into three stages; among these stages, the variation in the salt solution concentration has a more pronounced impact on the “rapid absorbing” and “slow absorbing” stages. The water imbibition rate is influenced by the distribution of pore sizes, liquid properties, and environmental factors. The pore size distribution of the samples does not exhibit significant differences (Figure 1). However, the water imbibition process of the brackish water involves the migration of the solution through interconnected capillary tubes within the sample, ultimately reaching the top. During the water imbibition process, both the upper surface and lateral sides of the sample serve as evaporative fronts, resulting in partial evaporation of the solution. The water imbibition rate negatively correlates with the duration of water imbibition. On the contrary, as the concentration of the solution increases, there is a corresponding increase in the rate of water imbibition. This phenomenon can be attributed to the migration of brackish water toward the sample surface, resulting in crystallization generated at a specific distance from the surface of the sample and subsequent clogs in the solution’s migration pathway.
4. Observation of Capillary Imbibition Using NMR
4.1. Variation in T2 Spectra
- (1)
- Variation in T2 spectra
The T2 spectra of sandstone demonstrate a positive correlation with the pore water content, while the shape of the T2 spectra reflects the distribution of various types of pore water. Figure 7 shows the T2 spectra at different times.
The signal amplitude of all samples increases during the water absorption process, ultimately reaching a stable level at the end. The signal amplitude increase is most pronounced in the leftmost peak of the T2 spectra across all samples. However, variations in salt solution concentration also result in differences in the T2 spectra among the samples. The primary manifestations are twofold: On the one hand, with an increase in the solution concentration, there is a gradual decline in the signal amplitude during water imbibition, accompanied by a decrease in the total T2 spectra area (Figure 8a). On the other hand, upon comparing the relaxation time with varying concentrations, an increase in solution concentration leads to progressive inward shifts of both left and right boundaries within the T2 spectra.
- (2)
- Variations in pore water
To clarify the migration processes of pore water, the T2 spectra classify pore water into bound water, capillary water, and bulk water at 3 ms and 33 ms. The variations in the signal amplitude of bound water, capillary water, and bulk water are illustrated in Figure 8b–d. The pore water signal amplitude obtained by the T2 spectra corresponds to the pore water content in sandstone. Furthermore, Table 3 displays the signal amplitude durations of the three types of pore water during the rapid-rising stage.
The signal amplitude of bound water of all samples demonstrated a similar trend, initially increasing followed by decreasing. Moreover, as the solution concentration increases, the time required for the bound water signal amplitude to reach its peak gradually decreases (Table 3), and the subsequent decline after reaching the peak becomes more pronounced (Figure 8b). The signal amplitude of capillary water of all samples demonstrates a similar trend, with an initial rise followed by subsequent stabilization (Figure 8c). As the solution concentration increases, there is a decline in the duration needed for the capillary water signal to be stabilized (Table 3). The variations in bulk water in each sample demonstrate various trends. The samples with a low salt concentration (≤0.1 g/L) display an “S”-shaped trend, with the rapid-rising stage in the middle, while the other samples exhibit a biphasic trend, characterized by an initial rapid increase followed by a subsequent deceleration in the rate of increase(Figure 8d). The data presented in Table 3 demonstrates that, for all samples, the rapid-rising stage of the signal amplitude for bound water finishes first, followed by capillary water and, ultimately, bulk water. The faster upward migration rate of bound water is primarily attributed to the evaporation of water vapor above the water imbibition front and subsequently condenses in the upper pores. The redistribution of pore water during the capillary imbibition can be inferred from the decrease in the bound water signal and the increase in the bulk water signal in the later stages.
- (3)
- Comparison between the NMR signal amplitude and water imbibition mass
The variations in the T2 spectra and water imbibition mass of each sample during the rapid- and slow-absorbing stages over time are presented in Figure 9. The results indicate that when the solution concentration is low (≤0.5 g/L), there is a consistent relationship between the variations in signal amplitude and water imbibition mass over time, with both stabilizing at similar times. However, when the solution concentration exceeds 0.50 g/L, desynchronization occurs between these two parameters, and it becomes increasingly significant as the solution concentration increases. The signal amplitude of the sample, at a salt concentration of 10.00 g/L, demonstrates an obvious decline after reaching the maximum, while the water imbibition mass continued to increase. The decrease in the signal amplitude strictly corresponds to a reduction in water content, while the water imbibition mass obtained by testing increases. This apparent paradox suggests that the improvement in the water imbibition mass is likely attributed to increased salt content, while moisture loss leads to crystallization.
4.2. Variation in Stratified Moisture Distribution during Capillary Imbibition
The stratified moisture distribution curve illustrates the process of water migration along the axis direction of the cylindrical core of the samples. The evolution of the stratified moisture distribution curve corresponds closely to that of the water imbibition front height, demonstrating two distinct stages: (1) Water migration. The water migration stage primarily involves vertical water movement, leading to increases in signal amplitude along the vertical axis. (2) Redistribution. During the redistribution stage, water migration is finalized within the primary capillary channels, and water predominantly migrates into slightly connected or disconnected pores. In this stage, there is no alteration in the stratified water content curve along the vertical axis; however, there is an overall increase in its signal amplitude (Figure 10). The varying solution concentration results in differences in the duration of both water migration and redistribution stages for each sample.
5. Discussion
Based on the above capillary imbibition test, the following phenomena were demonstrated: (1) The solution concentration indicated a significant impact on the water imbibition rate in sandstone. The variations in water imbibition mass, sorptivity, and height of water imbibition front are presented in Figure 2, Figure 3, Figure 4, Figure 5 and Figure 6; the above parameters indicate a positive correlation between a higher solution concentration and water imbibition rate. (2) The total signal amplitude of sandstone decreases as the solution concentration increases (Figure 8). (3) When the solution concentration exceeds 0.5 g/L, the NMR signal amplitude of the sample does not exhibit synchronized variations with the water imbibition mass; in some cases, it even demonstrates an inverse trend (Figure 9). The above phenomena demonstrate that the participation of the solution significantly alters the capillary imbibition process. There are two potential factors contributing to the variations: firstly, the presence of salinity alters the liquid properties, and secondly, the imbibition process of brackish water modifies the pore structure of sandstone. The mechanism of influence of a varying solution concentration on the capillary imbibition process of sandstone is analyzed based on the theory of capillary dynamics.
- (1)
- The imbibition model of a single-tube cylindrical capillary
The capillary imbibition model has been adopted in studies to precisely fit the imbibition process. Jia [36] adopted the capillary imbibition model to match the variation in the capillary imbibition front while disregarding inertia and gravity effects. The Fries model [18] adopted the invisible solution t(z) of the L-W equation to optimize the L-W equation and developed a capillary imbibition model that involves gravity and inertia effects. However, as Figure 11a shows, the results of the Fries model demonstrate significant deviation from the tested values of water imbibition front height; consequently, it can be inferred that the Fries model inadequately matches the practical variations in the water imbibition front height. Therefore, in this study, we adopted the capillary imbibition model proposed by Zhmud [37] to investigate the mechanism of influence of the capillary imbibition process with varying solution concentrations. Figure 11b illustrates the results obtained using the Zhmud capillary imbibition model.
The Newtonian kinetic equation for an incompressible viscous liquid in a long cylindrical capillary with radius r can be formulated as follows:
where is the density, kg/m3; is the viscosity, Pa·s; is the surface tension, N/m; is the liquid wetting angle, °; is the rise height of capillary water, m; is the capillary radius, μm; and is the acceleration of gravity, m/s2.
When the capillary is assumed to be a Poiseuille flow profile, the liquid within the capillary obtains a stable height determined by the equilibrium between gravity and the capillary force:
The L-W equation elucidates a stable process of capillary water imbibition involving the influences of gravity and viscous forces as follows:
When the imbibition time is sufficiently long and the capillary migration front height approaches the stable height , the L-W equation can be expressed as follows [18]:
The solution of in this case can be formulated as
In cases where the deviation between the capillary water rise height and the stable height is negligible, , the linear solution for can be formulated as
The coefficient preceding the exponent should be adjusted to ensure that , and the proposed expression for by Zhmud is as follows:
The z-t curve for various diameters was calculated using Formula (8), representing the variation in the water imbibition front height over time.
- (2)
- Impact of varying solution concentrations on the solution’s properties
The capillary imbibition process is primarily influenced by the liquid properties, as demonstrated in Formula (7), including density, viscosity, surface tension, and contact angle. The impact of the solution’s concentration on these parameters is analyzed individually.
The correlation between the solution density and solution concentration can be expressed as
where C is the solution concentration, mol/L, and M is the solute mass, mol/kg. The density of the Na2SO4 solution can be determined via calculation at varying concentrations.
The relationship between the viscosity and solution concentration is elucidated by the aqueous solution viscosity model [38]:
where is the viscosity, Pa·s; is the mass fraction of water, %; and ~ are dimensionless empirical constants. Laliberte obtains the viscosity of Na2SO4 at varying concentrations at 22 °C.
The surface tension of the solution is determined using the hanging ring method with varying Na2SO4 solution concentrations at 22 °C [39].
The contact angle of the solution can be determined through the surface tension, as established by Sghaier [40]:
where and are the liquid surface tension and contact angle of aqueous solution, respectively, and is the surface tension with varying solution concentrations. The contact angle of the aqueous solution was measured to be 33° [41].
Based on the theoretical formulas and test data above, the density, viscosity, surface tension, and contact angle at varying solution concentrations are presented in Table 4. The minimal impact of the salt concentration on liquid properties demonstrates that the primary factor contributing to significant variations in imbibition should be attributed to the modification of sandstone’s pore structure during brackish water imbibition.
- (3)
- The modification of sandstone’s pore structure during the brackish water imbibition process
Solution migrates from the bottom upwards within its pores during capillary imbibition in sandstone. To illustrate the modification of the pore structure in the brackish water imbibition process, the complex network of pores is considered equivalent to a capillary with an equal imbibition rate. A series of z-t curves was calculated by inputting the parameters from Table 4 into Formula (8) while varying the radius r of the capillary tube. These resulting z-t curves were then compared with test data in Figure 5 to determine the equivalent radius req of the samples with varying solution concentrations (Figure 11b). The results illustrate that the equivalent radius of the sample increases with the solution concentration.
The derivation of Formula (8) with respect to time establishes a correlation between the water imbibition front rising rate and the capillary radius r0 [35]:
During capillary imbibition, the water content decreases while evaporation occurs on the sample surface; meanwhile, the crystallization generation results in poor connectivity in the sample surface, called pore clogging. The increase in the equivalent radius of the sample can be attributed to crystallization clogging the surface pores during brackish water imbibition. The sandstone has a distinctive bedding structure, with significantly higher porosity connectivity observed in the parallel bedding direction compared to the perpendicular bedding direction. The schematic diagrams of varying bedding planes of sandstone are shown in Figure 1. Consequently, the capillary imbibition process in the perpendicular to bedding direction can be summarized as “initial migration within intra-layer followed by subsequent migration between inter-layer” [36]. Capillary imbibition in sandstone involves simultaneous moisture imbibition and migration within the sandstone, as well as evaporation and loss on its surface. The water evaporation through the sides results in crystallization within the pores, with the pores gradually clogging from its exterior to its interior. The decline in available pore space for solution filling leads to a shortened intra-layer migration of solution parallel to the bedding, ultimately resulting in an accelerated rate of water imbibition.
Corresponding to the experimental results in Figure 8, as the solution concentration increases, there is an increase in solution saturation, and a higher solution concentration leads to greater crystallization of Na2SO4 and accelerates the pore-clogging phenomenon, resulting in noticeable water loss in the sample and a shorter T2 spectra relaxation time. As Figure 9 shows, the NMR signal amplitude of the sample does not demonstrate synchronization with the water imbibition mass over time, and it even demonstrates a reverse trend at certain stages (e.g., for the 10.00 g/L sample). This phenomenon indicates that higher solution concentrations lead to an increase in crystallization within the surface pores of the sample, thereby resulting in a rise in the water imbibition mass. With the increase in the solution concentration, there is an illusion of an increase in the “water imbibition mass”, which is the total absorption mass of both “moisture” and “crystallization” that is increasing in essence. This is due to the clogging of pore space by crystallization, resulting in decreased water content and increased solution concentration.
6. Conclusions
The present study used a capillary imbibition process, including Na2SO4 solutions with varying concentrations, to observe the solution migration process in sandstone, testing parameters such as the water imbibition mass, water imbibition front height, NMR T2 spectra, and stratified moisture distribution. The impact of the salt solution concentration was explicated based on the theory of capillary imbibition. The primary findings are below:
- (1)
- The solution concentration alters the rate of water imbibition during capillary imbibition. An increase in solution concentration leads to an enhancement in the rate of water imbibition mass, sorptivity, and the rate at which the height of the imbibition front rises.
- (2)
- The total water absorption of sandstone decreases with increasing solution concentration. The total signal amplitude of the T2 spectra decreases with increasing solution concentration, and the boundary on both sides of the relaxation time gradually shifts toward the center.
- (3)
- When the solution concentration exceeds 0.50 g/L, the NMR signal amplitude of the sample does not exhibit synchronized variations with the water imbibition mass over time. It may even demonstrate an inverse trend at certain stages. For instance, the signal amplitude of the sample with a concentration of 10.00 g/L exhibits a subsequent decline after reaching its maximum. At the same time, the mass continues to improve as the water imbibition time increases.
- (4)
- The solution concentration significantly influences the water imbibition process of sandstone for two potential reasons: Firstly, the presence of salinity alters the liquid properties. The calculation shows that variations in solution properties at varying concentrations do not significantly impact the water absorption rate. Furthermore, the imbibition process of brackish water modifies the pore structures of sandstone. In the water imbibition process of a sample perpendicular to the bedding plane, the surface of the sample is regarded as the evaporation front, which leads to the generation of crystallization close to the sample surface. As a result, crystallization clogs the parallel water migration pathway along the bedding surface, which decreases the water migration time and increases the water imbibition rate. The law that the equivalent capillary radius is higher in the sample with a higher solution concentration was demonstrated by comparing the classical capillary dynamics model and test results.
Author Contributions
Conceptualization, H.J.; methodology, H.J. and X.Y.; validation, X.Y. and Y.W.; formal analysis, H.J.; investigation, X.Y., Y.W. and Q.S.; resources, H.J.; data curation, L.T.; writing—original draft preparation, X.Y.; writing—review and editing, H.J. and Q.S.; visualization, X.Y.; supervision, L.T.; project administration, L.T.; funding acquisition, H.J. All authors have read and agreed to the published version of the manuscript.
Funding
This work was supported by the China Transportation and Construction Applied Basic Research Project (grant No. 2021-ZJKJ-PTJS02), Open Fund of State Key Laboratory of Road Engineering Safety and Health in Cold and High-Altitude Regions (grant No. YGY2021KFKT02), and the Major Project of Inner Mongolia Science and Technology, China (grant No. 2021ZD0034).
Data Availability Statement
The datasets generated during and/or analyzed during the current study are available from the corresponding author upon reasonable request.
Acknowledgments
Special thanks are extended to the editors and three anonymous reviewers.
Conflicts of Interest
The author Hailiang Jia and Yao Wei were employed by the CCCC First Highway Consultants Co., Ltd. All authors declare that the research was conducted in the absence of any commercial or financial relationships that could be construed as a potential conflict of interest.
References
- Nishiyama, N.; Yokoyama, T.; Takeuchi, S. Size distributions of pore water and entrapped air during drying infiltra-tion processes of sandstone characterized by water expulsion porosimetry. Water Resour. Res. 2012, 48, W09556. [Google Scholar] [CrossRef]
- Jiang, Q.; Deng, H.; Li, J.; Luo, Z.; Assefa, E.; Fang, J.; Xiao, Y. The degradation effect and mechanism by water-rock interaction in the layered sandstone in the Three Gorges reservoir area. Arab. J. Geosci. 2019, 12, 722. [Google Scholar] [CrossRef]
- Shi, Q.; Cui, S.; Wang, S.; Mi, Y.; Sun, Q.; Wang, S.; Yu, J. Experiment study on CO2 adsorption performance of thermal treated coal: Inspiration for CO2 storage after underground coal thermal treatment. Energy 2022, 254, 124392. [Google Scholar] [CrossRef]
- Šimůnek, J.; Jarvis, N.J.; Van Genuchten, M.T.; Gärdenäs, A. Review and comparison of models for describing non-equilibrium and preferential flow and transport in the vadose zone. J. Hydrol. 2003, 272, 14–35. [Google Scholar] [CrossRef]
- Kong, J.; Xin, P.; Hua, G.F.; Luo, Z.Y.; Shen, C.J.; Chen, D.; Li, L. Effects of vadose zone on groundwater table fluctuations in unconfined aquifers. J. Hydrol. 2015, 528, 397–407. [Google Scholar] [CrossRef]
- Zaitsev, G.A.; Dubrovina, O.A.; Shainurov, R.I. Iron and manganese migration in “soil–plant” system in Scots pine stands in conditions of contamination by the steel plant’s emissions. Sci. Rep. 2020, 10, 11025. [Google Scholar] [CrossRef] [PubMed]
- Huang, B.; Yuan, Z.; Li, D.; Zheng, M.; Nie, X.; Liao, Y. Effects of soil particle size on the adsorption, distribution, and migration behaviors of heavy metal (loid) s in soil: A review. Environ. Sci. Process. Impacts 2020, 22, 1596–1615. [Google Scholar] [CrossRef]
- Siver, P.A.; Canavan, R.W.; Field, C.K.; Marsicano, L.J.; Lott, A. Historical Changes in Connecticut Lakes over a 55-Year Perio; American Society of Agronomy, Crop Science Society of America, and Soil Science Society of America: Madison, WI, USA, 1996. [Google Scholar] [CrossRef]
- Yin, X.; Feng, Q.; Zheng, X.; Zhu, M.; Wu, X.; Guo, Y.; Wu, M.; Li, Y. Spatio-temporal dynamics and eco-hydrological controls of water and salt migration within and among different land uses in an oasis-desert system. Sci. Total Environ. 2021, 772, 145572. [Google Scholar] [CrossRef] [PubMed]
- Cunningham, M.A.; Snyder, E.; Yonkin, D.; Ross, M.; Elsen, T. Accumulation of deicing salts in soils in an urban environmen. Urban Ecosyst. 2008, 11, 17–31. [Google Scholar] [CrossRef]
- Lucas, R. Ueber das Zeitgesetz des kapillaren Aufstiegs von Flüssigkeite. Kolloid-Zeitschrift 1918, 23, 15–22. [Google Scholar] [CrossRef]
- Washburn, E.W. The dynamics of capillary flow. Phys. Rev. 1921, 17, 273. [Google Scholar] [CrossRef]
- Benavente, D.; Lock, P.; Ángeles García Del Cura, M.; Ordóñez, S. Predicting the capillary imbibition of porous rocks from microstructure. Transp. Porous Media 2002, 49, 59–76. [Google Scholar] [CrossRef]
- Shen, A.; Xu, Y.; Liu, Y.; Cai, B.; Liang, S.; Wang, F. A model for capillary rise in micro-tube restrained by a sticky layer. Results Phys. 2018, 9, 86–90. [Google Scholar] [CrossRef]
- Wang, P.; Zhang, Q.; Wang, M.; Yin, B.; Hou, D.; Zhang, Y. Atomistic insights into cesium chloride solution transport through the ultra-confined calcium–silicate–hydrate channel. Phys. Chem. Chem. Phys. 2019, 21, 11892–11902. [Google Scholar] [CrossRef] [PubMed]
- Kim, E.; Whitesides, G.M. Imbibition and flow of wetting liquids in noncircular capillaries. J. Phys. Chem. B 1997, 101, 855–863. [Google Scholar] [CrossRef]
- Lundblad, A.; Bergman, B. Determination of contact angle in porous molten-carbonate fuel-cell electrodes. J. Electrochem. Soc. 1997, 144, 984–987. [Google Scholar] [CrossRef]
- Fries, N.; Dreyer, M. An analytic solution of capillary rise restrained by gravity. J. Colloid Interface Sci. 2008, 320, 259–263. [Google Scholar] [CrossRef] [PubMed]
- Zhang, Y.; Zhang, Y.; Huang, J. Experimental study on capillary water absorption of sandstones from different grotto heritage sites in China. Herit. Sci. 2022, 10, 25. [Google Scholar] [CrossRef]
- Scherer, G.W. Stress from crystallization of salt. Cem. Concr. Res. 2004, 34, 1613–1624. [Google Scholar] [CrossRef]
- Lavalle, J. Recherches sur la formation lente des cristaux à la température ordinair. Compte Rend. Acad. Sci. 1853, 36, 493–495. [Google Scholar]
- Becker, G.F.; Day, A.L. The Linear Force of Growing Crystals. Proc. Wash. Acad. Sci. 1905, 7, 283–288. [Google Scholar] [CrossRef]
- Correns, C.W.; Steinborn, W. Experimente zur Messung und Erklärung der sogenannten Kristallisationskraf. Z. Krist.-Cryst. Mater. 1939, 101, 117–133. [Google Scholar] [CrossRef]
- Everett, D.H. The thermodynamics of frost damage to porous solids. Trans. Faraday Soc. 1961, 57, 1541–1551. [Google Scholar] [CrossRef]
- Lubelli, B.; Cnudde, V.; Diaz-Goncalves, T.; Franzoni, E.; van Hees, R.P.; Ioannou, I.; Menendez, B.; Nunes, C.; Siedel, H.; Stefanidou, M.; et al. Towards a more effective and reliable salt crystallization test for porous building materials: State of the art. Mater. Struct. 2018, 51, 1–21. [Google Scholar] [CrossRef]
- Steiger, M.; Asmussen, S. Crystallization of sodium sulfate phases in porous materials: The phase diagram Na2SO4–H2O and the generation of stress. Geochim. Cosmochim. Acta 2008, 72, 4291–4306. [Google Scholar] [CrossRef]
- Yang, H.; Chen, C.; Zhao, G.; Zhou, J. Electrical resistivity analysis for the internal capillary water migration mechanism of porous stone. Acta Geophys. 2024, 72, 213–231. [Google Scholar] [CrossRef]
- Çelik, M.Y.; Sert, M. An assessment of capillary water absorption changes related to the different salt solutions and their concentrations ratios in the Döğer tuff (Afyonkarahisar-Turkey) used as building stone of cultural heritages. J. Build. Eng. 2021, 35, 102102. [Google Scholar] [CrossRef]
- Al-Naddaf, M. Quantifying the influence of halite and sylvite crystallization on capillary water absorption coefficient of sandstone. J. Am. Inst. Conserv. 2011, 50, 1–13. [Google Scholar] [CrossRef]
- Wang, T.; Jia, H.; Sun, Q.; Tan, X.; Tang, L. Effects of thawing-induced softening on fracture behaviors of frozen rock. J. Rock Mech. Geotech. Eng. 2024, 16, 979–989. [Google Scholar] [CrossRef]
- Matteson, A.; Tomanic, J.P.; Herron, M.M.; Allen, D.F.; Kenyon, W.E. NMR relaxation of clay/brine mixtures. SPE Reserv. Eval. Eng. 2000, 3, 408–413. [Google Scholar] [CrossRef]
- Jia, H.; Ding, S.; Wang, Y.; Zi, F.; Sun, Q.; Yang, G. An NMR-based investigation of pore water freezing process in sandstone. Cold Reg. Sci. Technol. 2019, 168, 102893. [Google Scholar] [CrossRef]
- Jia, H.; Ding, S.; Zi, F.; Dong, Y.; Shen, Y. Evolution in sandstone pore structures with freeze-thaw cycling and interpretation of damage mechanisms in saturated porous rocks. Catena 2020, 195, 104915. [Google Scholar] [CrossRef]
- Christopher, H.; Thomas, K.T. Water movement in porous building materials-VII. The sorptivity of mortar. Build. Environ. 1986, 21, 113–118. [Google Scholar] [CrossRef]
- Siegesmund, S.; Dürrast, H. Physical and Mechanical Properties of Rocks. In Stone in Architecture: Properties, Durability; Springer: Berlin/Heidelberg, Germany, 2014; pp. 97–224. [Google Scholar]
- Jia, H.; Dong, B.; Wu, D.; Shi, Q.; Wei, Y. Capillary Imbibition in Layered Sandston. Water 2023, 15, 737. [Google Scholar] [CrossRef]
- Zhmud, B.V.; Tiberg, F.; Hallstensson, K. Dynamics of capillary rise. J. Colloid Interface Sci. 2000, 228, 263–269. [Google Scholar] [CrossRef] [PubMed]
- Laliberte, M. Model for calculating the viscosity of aqueous solutions. J. Chem. Eng. Data 2007, 52, 321–335. [Google Scholar] [CrossRef]
- Ge, Y.; Chang, C.; Yang, W.; Zhang, B.; Yuan, J.; Yu, J. Effect of inorganic salts on surface tension of solutions and properties of concrete. Concrete 2007, 6, 7–9. [Google Scholar]
- Sghaier, N.; Prat, M.; Nasrallah, S.B. On the influence of sodium chloride concentration on equilibrium contact angle. Chem. Eng. J. 2006, 122, 47–53. [Google Scholar] [CrossRef]
- Englert, A.H.; Rodrigues, R.T.; Rubio, J. Dissolved air flotation (DAF) of fine quartz particles using an amine as collector. Int. J. Miner. Process. 2009, 90, 27–34. [Google Scholar] [CrossRef]
Figure 1.
Samples and pore size distribution.

Figure 2.
The variation in the water imbibition mass and water absorption rate with different concentrations ((a) sample with a solution concentration of 0.00 g/L; (b) sample with a solution concentration of 0.10 g/L; (c) sample with solution concentration of 0.50 g/L; (d) sample with solution concentration of 1.00 g/L; (e) sample with a solution concentration of 5.00 g/L; (f) sample with a solution concentration of 10.00 g/L; the bule line refers to the water imbibition mass; the red line refers to the rate of water imbibition).

Figure 3.
The i- graph with various solution concentrations. ((a) sample with a solution concentration of 0.00 g/L; (b) sample with a solution concentration of 0.10 g/L; (c) sample with solution concentration of 0.50 g/L; (d) sample with solution concentration of 1.00 g/L; (e) sample with a solution concentration of 5.00 g/L; (f) sample with a solution concentration of 10.00 g/L).

Figure 4.
The sorptivity S with various solution concentrations.

Figure 5.
Water imbibition fronts with various solution concentrations (the left is the variation of water imbibition front at different times on sample surface, the black line refers to the position of the imbibition front; the right is the height of imbibition front over imbibition time).
Figure 5.
Water imbibition fronts with various solution concentrations (the left is the variation of water imbibition front at different times on sample surface, the black line refers to the position of the imbibition front; the right is the height of imbibition front over imbibition time).

Figure 6.
Variation in the water imbibition front rise rate with various solution concentrations.

Figure 7.
T2 spectra with various solution concentrations ((a) sample with a solution concentration of 0.00 g/L; (b) sample with a solution concentration of 0.10 g/L; (c) sample with a solution concentration of 0.50 g/L; (d) sample with a solution concentration of 1.00 g/L; (e) sample with a solution concentration of 5.00 g/L; and (f) sample with a solution concentration of 10.00 g/L).

Figure 8.
The total signal with various solution concentrations and three types of pore water signal amplitudes ((a) the total signal of the T2 spectra; (b) the signal amplitude of bound water with the imbibition time; (c) the signal amplitude of capillary water with the imbibition time; (d) the signal amplitude of bulk water with the imbibition time).

Figure 9.
NMR signal amplitude and water imbibition mass of samples with various solution concentrations over time (the black line refers to the water imbibition mass; the red line refers to the T2 signal amplitude).
Figure 9.
NMR signal amplitude and water imbibition mass of samples with various solution concentrations over time (the black line refers to the water imbibition mass; the red line refers to the T2 signal amplitude).

Figure 10.
Stratified moisture distribution curve with various solution concentrations ((a) sample with a solution concentration of 0.00 g/L; (b) sample with a solution concentration of 0.10 g/L; (c) sample with a solution concentration of 0.50 g/L; (d) sample with a solution concentration of 1.00 g/L; (e) sample with a solution concentration of 5.00 g/L; and (f) sample with a solution concentration of 10.00 g/L).

Figure 11.
Water imbibition front height and equivalent radius with various solution concentrations ((a) calculation result of the Fries capillary imbibition model, and (b) calculation result of the Zhmud capillary imbibition model. The solid line indicates the tested value of the height of the water imbibition front, and the dotted line indicates the calculated value of the equivalent radius).


Table 1.
Parameters of the sample.
| Sample | Solution Concentration (g/L) | Porosity (%) | P-Wave Velocity (km·s−1) |
|---|---|---|---|
| 1 | 0.00 | 19.40 | 2.09 |
| 2 | 0.10 | 19.41 | 2.08 |
| 3 | 0.50 | 19.45 | 2.06 |
| 4 | 1.00 | 19.38 | 2.03 |
| 5 | 5.00 | 19.11 | 2.04 |
| 6 | 10.00 | 19.47 | 2.06 |
Table 2.
Water imbibition time and mass of samples at each stage with varying solution concentrations.
Table 2.
Water imbibition time and mass of samples at each stage with varying solution concentrations.
| Solution Concentration (g/L) | Parameter | Stage I | Stage II |
|---|---|---|---|
| 0.00 g/L | T (min) | 149 | 2458 |
| M (g) | 4.51 | 23.81 | |
| R (g/min) | 0.035 | 0.40 | |
| 0.10 g/L | T (min) | 147 | 2848 |
| M (g) | 4.04 | 24.77 | |
| R (g/min) | 0.26 | 0.011 | |
| 0.50 g/L | T (min) | 166 | 1116 |
| M (g) | 9.53 | 19.04 | |
| R (g/min) | 0.065 | 0.025 | |
| 1.00 g/L | T (min) | 241 | 1337 |
| M (g) | 9.6 | 18.82 | |
| R (g/min) | 0.045 | 0.018 | |
| 5.00 g/L | T (min) | 263 | 1285 |
| M (g) | 11.03 | 21.78 | |
| R (g/min) | 0.048 | 0.019 | |
| 10.00 g/L | T (min) | 372 | 920 |
| M (g) | 19.92 | 25.16 | |
| R (g/min) | 0.056 | 0.019 |
Note: T = water imbibition time; M = water imbibition mass within each stage; R = the increase in the water imbibition mass per unit time = M/T.
Table 3.
The duration of the rapid-rising stage of different types of pore water.
| Solution Concentration (g/L) | Bound Water | Capillary Water | Bulk Water |
|---|---|---|---|
| 0 g/L | 1506 min | 2342 min | 2876 min |
| 0.1 g/L | 1904 min | 2696 min | 3048 min |
| 0.5 g/L | 713 min | 996 min | 1116 min |
| 1.0 g/L | 915 min | 1072 min | 1594 min |
| 5.0 g/L | 801 min | 1162 min | 1285 min |
| 10.0 g/L | 506 min | 506 min | 546 min |
Table 4.
Parameters at various solution concentrations.
| Solution Concentrations (g/L) | Density (kg/m3) | Viscosity (Pa·s) | Surface Tension (N/m) | Contact Angle (°) |
|---|---|---|---|---|
| 0.00 | 1000.00 | 9.55 × 10⁻⁴ | 7.16 × 10⁻² | 33.00 |
| 0.10 | 1000.07 | 9.56 × 10⁻⁴ | 7.16 × 10⁻² | 33.00 |
| 0.50 | 1000.35 | 9.57 × 10⁻⁴ | 7.16 × 10⁻² | 33.01 |
| 1.00 | 1000.70 | 9.58 × 10⁻⁴ | 7.16 × 10⁻² | 33.01 |
| 5.00 | 1003.50 | 9.70 × 10⁻⁴ | 7.16 × 10⁻² | 33.07 |
| 10.00 | 1007.00 | 9.84 × 10⁻⁴ | 7.17 × 10⁻² | 33.13 |
Disclaimer/Publisher’s Note: The statements, opinions and data contained in all publications are solely those of the individual author(s) and contributor(s) and not of MDPI and/or the editor(s). MDPI and/or the editor(s) disclaim responsibility for any injury to people or property resulting from any ideas, methods, instructions or products referred to in the content. |
© 2024 by the authors. Licensee MDPI, Basel, Switzerland. This article is an open access article distributed under the terms and conditions of the Creative Commons Attribution (CC BY) license (https://creativecommons.org/licenses/by/4.0/).
Share and Cite
MDPI and ACS Style
Jia, H.; Yang, X.; Wei, Y.; Sun, Q.; Tang, L. Capillary Imbibition Laws of Fresh–Brackish Waters in Sandstone. Water 2024, 16, 1180. https://doi.org/10.3390/w16081180
AMA Style
Jia H, Yang X, Wei Y, Sun Q, Tang L. Capillary Imbibition Laws of Fresh–Brackish Waters in Sandstone. Water. 2024; 16(8):1180. https://doi.org/10.3390/w16081180
Chicago/Turabian StyleJia, Hailiang, Xiaoyu Yang, Yao Wei, Qiang Sun, and Liyun Tang. 2024. "Capillary Imbibition Laws of Fresh–Brackish Waters in Sandstone" Water 16, no. 8: 1180. https://doi.org/10.3390/w16081180
Note that from the first issue of 2016, this journal uses article numbers instead of page numbers. See further details here.