Article

Water Footprint Assessment and Virtual Water Trade in the Globally Most Water-Stressed Country, Qatar

Department of Biological and Environmental Sciences, College of Arts and Sciences, Qatar University, Doha P.O. Box 2713, Qatar
*
Author to whom correspondence should be addressed.
Water 2024, 16(8), 1185; https://doi.org/10.3390/w16081185
Submission received: 11 January 2024 / Revised: 8 April 2024 / Accepted: 9 April 2024 / Published: 22 April 2024

Abstract

:
Qatar is a severely water-stressed country. Despite Qatar’s aridity and its lack of freshwater resources, its per capita water consumption is one of the highest in the world, and it is expected to increase in the coming decades. Therefore, understanding water consumption and use through space and time becomes paramount. By employing water footprint assessment (WF) and analysis of virtual water trade (VWT), this research comprehensively examines Qatar’s water consumption patterns both domestically and internationally on a sectorial level (agricultural, industrial and urban sectors) between 2010 and 2021. The findings show that, internally, the urban sector contributed the most to the WF, followed by the industrial and the agricultural sectors with an annual average WF of 3250, 1650, and 50 million m3/y, respectively. Although Qatar exports large amounts of VW (1450 million m3/y), its VW imports (7530 million m3/y) are very high, reflecting the country’s agricultural demand, making Qatar a net VW importing country. Qatar exhibits a national WF of consumption of 11,900 million m3/y, with a water dependency index of 56% and a self-sufficiency index of 44%. Additionally, Qatar has a significant water export fraction of 20%, while only 3% of its water consumption relies on its natural resources. This study pinpoints sectors and areas where WFs can be reduced; the outcomes serve as a foundation for strategic planning, enabling Qatar to make informed decisions to optimize its water resources, enhance water use efficiency, and secure a sustainable water future in the face of escalating water stress. This study’s methodology and findings not only pave the way for more efficient water resource management in Qatar, but also offer a replicable framework for other arid and semi-arid countries to assess and optimize their water footprint and virtual water trade, contributing significantly to global efforts in sustainable water use.

1. Introduction

Water scarcity poses a serious threat to human security. An estimated 4 billion people, comprising roughly two-thirds of the world’s population, struggle with severe water scarcity for at least one month of the year [1]. Currently, 2.3 billion people reside in water-stressed regions; by 2050, that number is projected to rise to 5 billion, or nearly 52% of the global population [2,3]. Water crisis has been consistently listed as one of the five major global risks for the past few years, and it is predicted to become the single greatest global risk in the near future [4,5]. Over-consumption and over-abstraction have overloaded the global water resources. In addition, climate change exacerbates the stress on global water supplies; sea level rise threatens coastal infrastructure and aquifers, while the rising temperatures decreases soil moisture and disturbs rainfall patterns. Studies indicate that water-insecure regions are more vulnerable to the effects of climate change compared to other areas [6,7,8].
Regionally, Gulf Cooperation Council (GCC) countries are located in the driest area of the world. Due to population growth, unplanned agricultural expansion, rapid urbanization, and the rising living standards, water consumption has substantially increased over the past few decades [9]. The GCC lacks renewable freshwater resources. Groundwater is the main source of freshwater and with the increasing water demand, groundwater levels have significantly decreased and its quality has degraded. Therefore, GCC countries are heavily investing in the production of nonconventional water resources such as seawater desalination and treated wastewater [9,10]. In 2019, the World Resources Institute (WRI) ranked Qatar as the world’s most water-stressed country [11]. Qatar is an arid dryland with high evaporation rates and limited natural water resources. It is characterized by the absence of permanent rivers, minute annual rainfall, and a few groundwater aquifers which comprise the main source of natural water. Over the last decades, groundwater levels and quality have substantially decreased and deteriorated due to extensive pumping for farm irrigation practices [12,13]. Seawater desalination meets 50% of the water supply demand of Qatar, while groundwater and recycled wastewater meet the remaining 36% and 14%, respectively [14]. Household water supply relies completely on desalinated water; this overreliance can put Qatar in jeopardy if any disruption occurs in the desalination process (e.g., oil spills, algal blooms, etc.) Furthermore, desalination has negative environmental impacts, particularly its large energy footprint and its detriment to marine ecosystems [14,15].
Despite Qatar’s aridity, per capita water consumption is one of the highest in the world corresponding to 430 L/day, and it is expected to increase in the coming decades [14]. This is enabled by the abundance of large reserves for oil and natural gas, making Qatar one of the richest countries in the globe which allows for the country to maintain food security through international trade [16]. However, since the 2017 blockade has been imposed on Qatar by neighboring countries, national food production bloomed noticeably: food production went from 10.7% in 2016 to 11.5% in 2017. From 2017 onward, production for perishable products such as vegetables and milk nearly tripled and self-sufficiency increased drastically in a number of food products, namely dairy and poultry, where self-sufficiency exceeded 100% [17]. Today, agriculture accounts for one-third of the water consumed in Qatar whereas its contribution to the GDP remains at 0.1%. Such a massive allocation of the stressed water resources bringing minor economic outcome signifies the unsustainability of the water, food, and energy sectors in Qatar. It has been recently highlighted that the problem of water scarcity—globally and in Qatar—is primarily one of resource misallocation rather than a matter of physical scarcity [15]. Therefore, an understanding of water consumption on a national and sectorial level is crucial for sustainable water use.
The water footprint (WF), unlike traditional water indicators which report gross water abstraction and withdrawal, is multidimensional. It is an indicator of both volumetric water use and pollution through space and time [18]. The WF concept was first established by Prof. Arjen Hoekstra in 2002 [19]. WF is classified into three main types: green (rainwater consumption), blue (surface and groundwater consumption) and grey WF (water required to dilute pollutants). Estimation of the WF covers the full production cycle from supply chain to end user; therefore, it accounts for both direct and indirect water use [19,20]. Sectors differ in their water footprint. Generally, agriculture is the largest contributor to the WF—it accounts for 86% of the water footprint of humanity; however, the WF is spatially sensitive [19]. The national WF accounts for the WF within a nation (from different sectors, agricultural, industrial and urban) and the WF of national consumption. National consumption WF incorporates the trade of water flows embedded in products from one region to another; this is termed the virtual water trade (VWT) [19,21]. The virtual water (VW) concept explains that water scares regions can import water-consumptive products rather than producing them locally to better manage the limited water resources [21]. It is estimated that the global annual WF average between 1996 and 2005 was 9087 giga cubic meters per year (Gm3/y), while VWT in agricultural and industrial products was 2320 Gm3/y [22]. Industrialized nations show a per-capita WF range between 1250 and 2850 m3/y, while developing nations show a more variable range of 550–3800 m3/y WF per capita [22]. National WF assessment of the MENA region and specifically the Arabian gulf are limited; however, the average national WF between 1997 and 2001 for Saudi Arabia was 25.9 Gm3/y, that for Kuwait was 2.2 Gm3/y, and that for Qatar 0.6 Gm3/y [23]. A study assessing the VWT of agricultural products in Qatar between 1988 and 2015 showed that Qatar is a net VW importing country of food products, with an average virtual water flow of 1350 Mm3/y [8].
Previous studies indicate that analyzing WF is a very important step that has a good impact on water management and policy decisions [24]. For water-insecure countries, developing effective water management policies might be a specific aspect of maintaining political stability in the future [7]. In order to find alternative ways in saving domestic water and preventing water insecurity, GCC countries are pursuing rigorous policies. Moreover, the Qatar government is looking for new ways for water conservation to manage water production, distribution, consumption, and reuse by developing the Water Policy Act [8]. The purpose of this study is to estimate the water footprint on a sectoral level and the virtual water of imports and exports in Qatar between 2010 and 2021 in order to understand the contribution of different actors to Qatar water consumption. This study aims to pinpoint sectors and areas where WFs can be reduced. The outcomes would serve as a foundation for strategic planning, enabling Qatar to make informed decisions to optimize its water resources, enhance water use efficiency, and secure a sustainable water future in the face of escalating water stress.

2. Materials and Methods
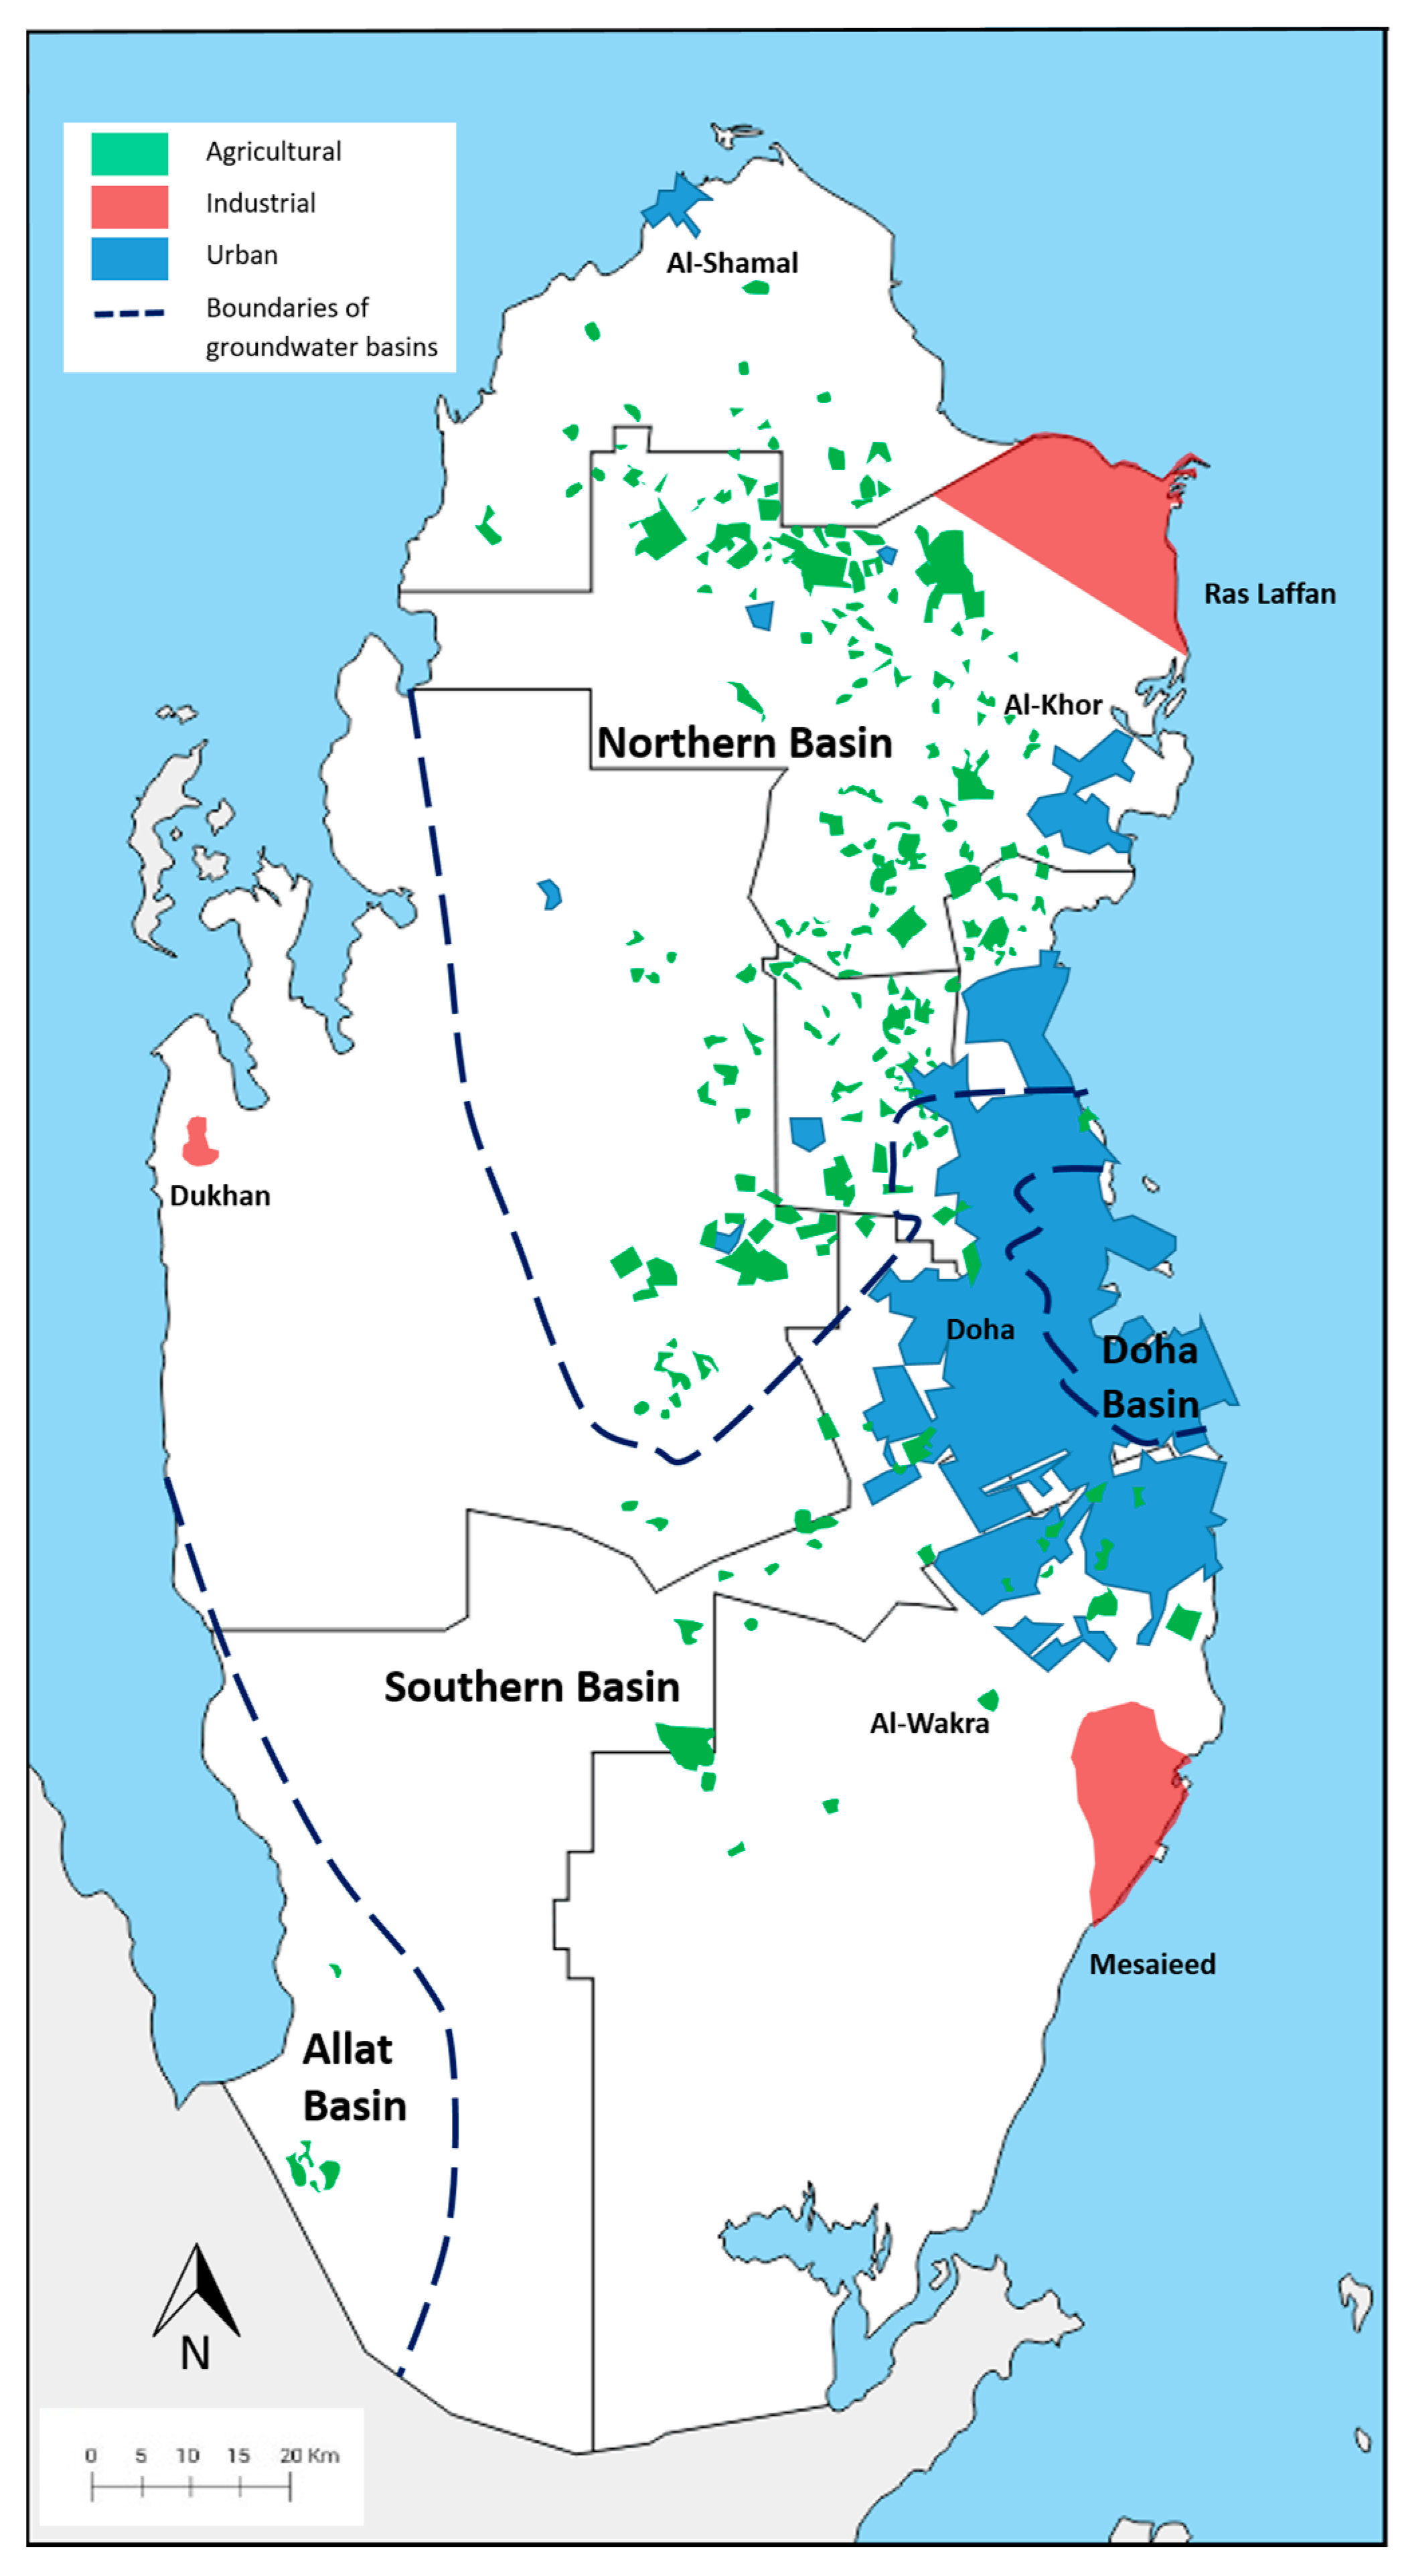
2.1. Study Area

Qatar is a small peninsular country in the Arabian Gulf. It covers an area of 11,000 square km and it has a population of 2.93 million. It is considered one of the richest economies in the world (mainly oil and gas) with a GDP of USD 179.57 billion [25,26]. Qatar is characterized as a desert with very low rainfall and high temperatures. Rainfall in Qatar is considered highly variable and unpredictable with and an average of 80 mm annually, while temperature can rise above 40 °C in the summer [25]. Qatar is also characterized by high evaporation rates, high relative humidity, very strong winds, and absence of permanent rivers [25]. The main source of total water production is seawater desalination (63%) followed by groundwater (23%) and reuse of treated sewage effluent (TSE). The total water production was equal to 1084 million m3 in 2019 [27,28]. Qatar relies heavily on desalinated water; it is the primary source for drinking water [29]. There are currently 12 water desalination plants operating in Qatar, with a daily total capacity of 500 million of Imperial Gallons per day (MIGD). Umm Al Houl, Ras Qertas, Ras Laffan-b, and Ras Abu Fantas plants make up half of seawater desalination capacity of the country. The main technologies used for desalination in Qatar are multi-stage flash distillation (MSF) and reverse osmosis (RO) [30]. Groundwater is the main natural water resource in Qatar; the primary groundwater aquifers are the Rus aquifer and the Umm er Rhaduma aquifer [25]. Groundwater abstraction reaches 250.8 million m3/y, which unfortunately has led to depletion of aquifers, low groundwater levels, and increased salinity. However, groundwater abstraction has remained the same since 2005 [28]. The majority of groundwater abstraction is used in agriculture approximately 230 million m3/y or 92% of the total water abstracted. Currently, the primary source of the national groundwater reserve is artificial recharge of groundwater aquifers through TSE injection, recharge wells, and artificial recharge from irrigation [28]. As a result of development of the wastewater treatment design and technologies in Qatar, TSE production has increased drastically in the last decade. Almost two-thirds of the waste was reused for agriculture and landscaping, with the remainder allocated to lagoons and aquifers and a very small percentage being discharged into the sea [31].
The governmental Qatar General Electricity and Water Corporation known as KAHRAMAA operates and maintains the only electricity and water network in Qatar. KAHRAMAA coordinates with Qatar Energy (QE) (previously known as Qatar Petroleum) and Independent Power and Water Providers (IPWP) to manage the water supply chain. QE provides natural gas as fuel for the water desalination plants managed by the IPWPs. IPWPs provide desalination services and KAHRAMAA delivers water to consumers [27]. KAHRAMAA is supervised by the Ministry of Energy and Industry. The Permanent Water Resources Committee (PWRC) is responsible for the water management and development in Qatar. The committee consists of the minister of state for energy affairs, the minister of municipal and environmental affairs, the head of the Planning and Statistics Authority, the chairman of the Public Works Authority (Ashghal), and the chairman of KAHRAMAA, among others [32]. Figure 1 describes a map of the major agricultural, urban, and industrial activities in Qatar.

2.2. WF Accounting

The WF of the national consumption ( W F C o n s , m3/y) is calculated as the WF within a geographically delineated area/nation ( W F A r e a , m3/y) plus the VW import ( V W I , m3/y) minus the VW export ( V W E , m3/y) [19].
W F C o n s = W F A r e a + V W I V W E

2.2.1. WF within a Nation

W F A r e a is calculated as the summation of all processes within a delineated area as shown below:
W F A r e a = A W F + U W F + I W F
where AWF refers to the agricultural WF (m3/y). UWF refers to the urban WF (m3/y) and IWF refers to the industrial WF (m3/y).

Agricultural WF

The agricultural WF (AWF) is the combined WF of growing crop and livestock (m3/y) [19].
A W F = W F C r o p + W F L i v e s t o c k
  • Crop WF
To calculate the crop WF following Hoeskstra et al. (2011) [19,35], crops were categorized into three groups based on production systems and quantity (information obtained from Food Security Department, Ministry of Municipality and Environment). The WF was estimated for crops that accounted for at least 80% of production per category and was later extrapolated to estimate the corresponding 100%. The first category is cereals and fodder, which only includes fodder as it accounted for 99% of all production. The second category is open field fruits and vegetables, which includes tomatoes, dates, pumpkins, marrows, eggplant and sugar-melons. The last category is greenhouse fruits and vegetables, which contains tomatoes and cucumber.
To calculate the total production WF of growing crops ( W F C r o p , m 3 / y ) ,   W F C r o p ( m 3 / t o n ) was multiplied by the annual production (ton/y) which was obtained from the Qatari Planning and Statistics Authority from 2010 to 2020 [36].
W F C r o p   ( m 3 / y ) = W F C r o p   ( m 3 / t o n ) × production   ( ton / y )
The WF for growing a crop ( W F C r o p ) is equal to the summation of the green WF ( W F G r e e n , m3/ton), the blue WF ( W F B l u e , m3/ton), and the grey WF ( W F G r e y , m3/ton) of growing a crop. The grey WF was deemed negligible from the calculation of WF of crops due to the nature of open field farming.
W F C r o p = W F G r e e n + W F B l u e + W F g r e y
The green WF of growing a crop ( W F p r o c , g r e e n , m3/ton) was calculated by dividing the green crop water use ( C W U g r e e n , m3/ton) over the yield of the crop ( Y , ton/ha), while the blue WF of growing a crop was the blue crop water use ( C W U b l u e , m3/ton) divided by the crop yield ( Y , ton/ha). The yield was obtained from the Qatari Planning and Statistics Authority from 2010 to 2021 [36].
W F p r o c , g r e e n = C W U g r e e n Y
W F p r o c , b l u e = C W U b l u e Y
The green crop water use ( C W U b l u e , m3/ha) accounts for the amount of rainwater a crop uses, while the blue crop water use ( C W U b l u e , m3/ha) is the amount of irrigation water use by the crop; sources include groundwater and desalinated surface water. Both values are calculated by accumulation of daily evapotranspiration, green ( E T g r e e n , mm/day) and blue ( E T b l u e , mm/day) over the complete growing period ( l g p , d a y s ). Both equations are multiplied by a factor of 10 in order to convert water depth (mm) to water volume (m3/ha).
C W U g r e e n = 10 × d = 1 l g p E T g r e e n
C W U b l u e = 10 × d = 1 l g p E T b l u e
CROPWAT Model
In this study, the crop water requirement method also known as the CWR method was used to calculate evapotranspiration using the CROPWAT model [37]. The CROPWAT model is a decision support program advanced by the Food and Agriculture Organization of the United Nations (FAO), Rome, Italy [38].
The CWR method requires climate, rainfall, and crop data. Climate and rainfall data were obtained from the Qatar Meteorological Department for the past 15 years (2007–2021) for 2 weather stations (Doha and Al Ruwais) in the north and northeast of Qatar where most farms are located. The data obtained were monthly mean data of minimum and maximum temperature (°C), relative humidity (%), monthly rainfall (mm), wind speed (km/h), sunshine duration (h), altitude (m), longitude, and latitude. Crop-specific data such as crop coefficient (Kc), planting and harvesting dates, maximum rooting depth, length of growing period (lgp, days), critical depletion, and yield response factors were obtained from local farms, mainly Agrico Agricultural Development. Any missing data were obtained from the literature on the crops in the region and from the CROPWAT database. Essentially, CWR is the volume of water required by the crop to grow (CWR, mm). There are two factors influencing the CWR: the reference crop evapotranspiration (ETo, mm) and the crop coefficient (Kc) which are, in turn, influenced by climate, crop type, and its growth stages. ETo is the evapotranspiration rate from a reference surface that faces no shortage of water (reference surface is a hypothetical grass reference crop growing under optimal conditions), while Kc is the ratio of actual crop evapotranspiration in field to the reference crop evapotranspiration.
To calculate the CWR, Kc and ETo are multiplied. CWR is also equal to the actual crop evapotranspiration (ETc, mm) in the case of the perfect condition where no water loss or limitation to the growth of the crop occurs.
CWR = Kc × ETo
ETc = CWR
The daily green evapotranspiration (ETgreen, mm/day) also referred to as rainwater evapotranspiration is measured as the minimum total crop evapotranspiration (ETc, mm) when effective rainfall (Peff) is larger than ETc. However, when the Peff is smaller than ETc, ETgreen will be equal to Peff. The daily blue evapotranspiration (ETblue, mm/day) or field evapotranspiration is equal to the ETc subtracted by the Peff, but it is equal to zero when the Peff is larger than the ETc.
ETgreen = min (ETc, Peff)
ETblue = max (0, ETcPeff)
  • Livestock WF
Qatar livestock WF was estimated in previous research and was not significant compared to crop WF; therefore, livestock WF ( W F L i v e s t o c k , m 3 / y ) was obtained by multiplying the WF of Qatar local livestock production ( W F L i v e s t o c k , m 3 / t o n ) obtained from the literature ([39]) by production (ton) per category. Production data for the 4 categories of red meat, poultry meat, eggs, milk and dairy products were obtained from the Qatari Planning and Statistics Authority from 2010 to 2021 [36].
W F L i v e s t o c k ( m 3 / y ) = W F L i v e s t o c k   ( m 3 / t o n ) × Production   ( ton )

Urban WF

Urban supply WF was calculated following Wang et al. (2019) calculation of domestic WF [40]. Urban WF includes household, governmental, and commercial WF.
U W F = H W U + G W U + C W U + T U G W
where UWF refers to urban WF  ( m 3 / y ) ,  HWU refers to household water use ( m 3 / y ) , GWU refers to governmental water use ( m 3 / y ) , and CWU refers to commercial water use ( m 3 / y ) . Water use data (blue water) were obtained from the Qatari Planning and Statistics Authority from 2010 to 2021 [36]. The household, commercial, and governmental WFs were estimated from the UWF based on the percentage of water use for each subsector.
The total urban grey water ( T U G W , m 3 / y ) is the urban grey water (UGW, m 3 / y ) minus the treated sewage effluent for reuse  ( m 3 / y ) as requested from Ashghal.
T U G W = U G W T r e a t e d   s e w a g e   e f f l u e n t   f o r   r e   u s e
The UGW in ( m 3 / y ) was calculated as point source pollution using the following equation ([19,41]):
UGW = L C m a x C n a t
UGW = max   ( U G W C O D , U G W N H 4 N )
where L ( k g ) is the pollutant load obtained for the Qatari Planning and Statistics Authority [36], C m a x ( k g / m 3 ) is the maximum acceptable concentration of pollutant described in the governmental prequalification guidelines for the design of wastewater treatment works [42], and C n a t ( k g / m 3 ) is the natural pollutant concentration in the receiving water body obtained from the literature [43]. U G W C O D ( m 3 / y ) and U G W N H 4 N   ( m 3 / y ) , which are the grey WF for COD and NH4-N, respectively, were calculated and the pollutant with the largest amount of dilution water required was used to determine the UGW.

Industrial WF

According the Qatari Planning and Statistics Authority, economic activities in Qatar aggregated under the “industrial sector” category are as follows: (1) mining and quarrying (including oil and gas), (2) manufacturing, (3) electricity, gas, steam, and air conditioning supply, (4) water supply, sewerage, waste management, and remediation activities. These categories make up 83%, 16%, 1%, and 0.5% of the industrial production, respectively. Extraction of crude petroleum and natural gas make up 98% of the mining category [36]. Due to limitations of data, the industrial WF is calculated for mining and quarry (oil and gas) and electricity generation and extrapolated for the remaining categories.
To calculate the total industrial WF ( I W F , m 3 / y ) , the WF for oil extraction, natural gas extraction [44], and electricity generation [45] is obtained from the literature and multiplied by the annual production which is obtained from the U.S. Energy Information Administration (EIA) from 2006 to 2021 [46].
I W F   ( m 3 / y ) = I W F   ( m 3 / u n i t ) × Production

2.2.2. VW of Imports and Exports

VW was estimated for imports and exports for the years of 2012 to 2021. The Qatari Planning and Statistics Authority categorizes the imports and exports into 9 broad categories. Two main categories were identified: industrial and agricultural. The percentages of contribution of each import/export categories were determined and the WF was estimated for products that accounted for at least 80% of the total weight of all imports and exports [36]. Since Qatar has an extractive and producing industry rather than a transformative one, the re-exports were calculated together with the exports.
For the agricultural imports, 7 subcategories were obtained from the “food and live animals” category, in which cereal products, fruits and vegetables, and meat and poultry accounted for 81% of the total weight of agricultural imports. WF (m3/kg) of each subcategory was obtained from literature [47] and multiplied by its average contribution (%). The calculated sum was multiplied by the total weight of agricultural imports (81%) to obtain the weighted WF per kg for all imports. The Sum of agricultural imports (kg) was multiplied by the weighted WF per kg for all imports than extrapolated within the categories of “food and live animals” and within all categories of agricultural imports in order to obtain the WF (million m3/y). For the agricultural exports, 8 subcategories were obtained from the “food and live animals” and the “animal and vegetable oils, fats, and waxes” categories, in which cereal products and meat and poultry accounted for 90% of the total weight of agricultural exports. WF (million m3/y) was calculated similarly to agricultural import WF.
For the industrial imports, multiple subcategories were obtained from the “crude materials, incredible, except fuels” category, in which pebbles, gravel, broken or crushed stone, the macadam of slag, dross, etc., and iron ores and concentrates, including roasted iron pyrites accounted for 84% of the total weight of industrial imports. WF (m3/kg) of each subcategory was obtained from literature [48] and multiplied by its weight (kg), then extrapolated within the category of “crude materials, incredible, except fuels” and within all categories of industrial imports in order to obtain the WF (million m3/y). For the industrial exports, multiple subcategories were obtained from the “mineral fuels, lubricants, and related materials” category, in which petroleum oils, oils from bituminous minerals, etc., and petroleum gases and other gaseous hydrocarbons accounted for 83% of the total weight of industrial exports. WF (million m3/y) was calculated similarly to industrial import WF.
V W I   ( m 3 / y ) = Σ   I m p o r t s   ( k g / y e a r ) × W F   ( m 3 / k g )
V W E   ( m 3 / y ) = Σ   E x p o r t s   ( k g / y e a r ) × W F   ( m 3 / k g )
where V W I   ( m 3 / y ) and V W E ( m 3 / y ) refer to the VW of imports and the VW of exports, respectively, Σ   I m p o r t s ( kg / y ) is equal the to the sum of imported products in a year and Σ   E x p o r t s ( k g / y ) is equal the to the sum of exported products in a year. W F ( m 3 / k g ) is the WF of each product obtained from the literature [47,48,49], while import and export data were obtained from the Qatari Planning and Statistics Authority from 2012 to 2021 [36].
To calculate the net VW import (NVWI, m3/y), the V W E ( m 3 / y ) was subtracted from the V W I ( m 3 / y ) following [19].
V W I = V W I V W E
The VW budget ( V W B ,   m 3 / y ) is equal to the WF of national consumption ( W F C o n s , m3/y) plus the VW export ( V W E   m 3 / y ) [19].
V W B = W F C o n s + V W E

2.3. National Water Dependency

W F C o n s , e x t ( m 3 / y ) was calculated using the WF of national consumption, the WF of a delineated area ( W F A r e a , m3/y), and the VW import ( V W I , m 3 / y ) as follows:
W F C o n s ,       e x t = W F C o n s W F A r e a + V W I × V W I
W F C o n s , i n t ( m 3 / y ) was calculated using the WF of national consumption minus the WF of external national consumption WF ( W F C o n s , e x t , m 3 / y ) as follows:
W F C o n s ,       i n t = W F C o n s W F C o n s ,       e x t
The VW import dependency (WD%) is defined as the ratio external national consumption WF ( W F C o n s , e x t , m 3 / y ) to the total national consumption WF ( W F C o n s , m3/y) [19],
W D = W F C o n s ,       e x t W F C o n s × 100
The National water self-sufficiency (WSS%) is defined as the ratio of internal national consumption WF ( W F C o n s , e x t , m 3 / y ) to the total national consumption WF ( W F C o n s , m3/y) [19],
W S S = W F C o n s ,       i n t W F C o n s × 100
Water Export Fraction (WEF%) reflects how much a country exports virtual water abroad as follows [50]:
W E F = V W E W F A r e a + V W E × 100
Reliance on natural resources (RNR%) reflects how much a country relies on its available natural water resources (i.e., groundwater abstraction m 3 / y ) adapted from WEF calculation as follows:
R N R = G r o u n d w a t e r   A b s t r a c t i o n W F A r e a + V W E × 100

3. Results

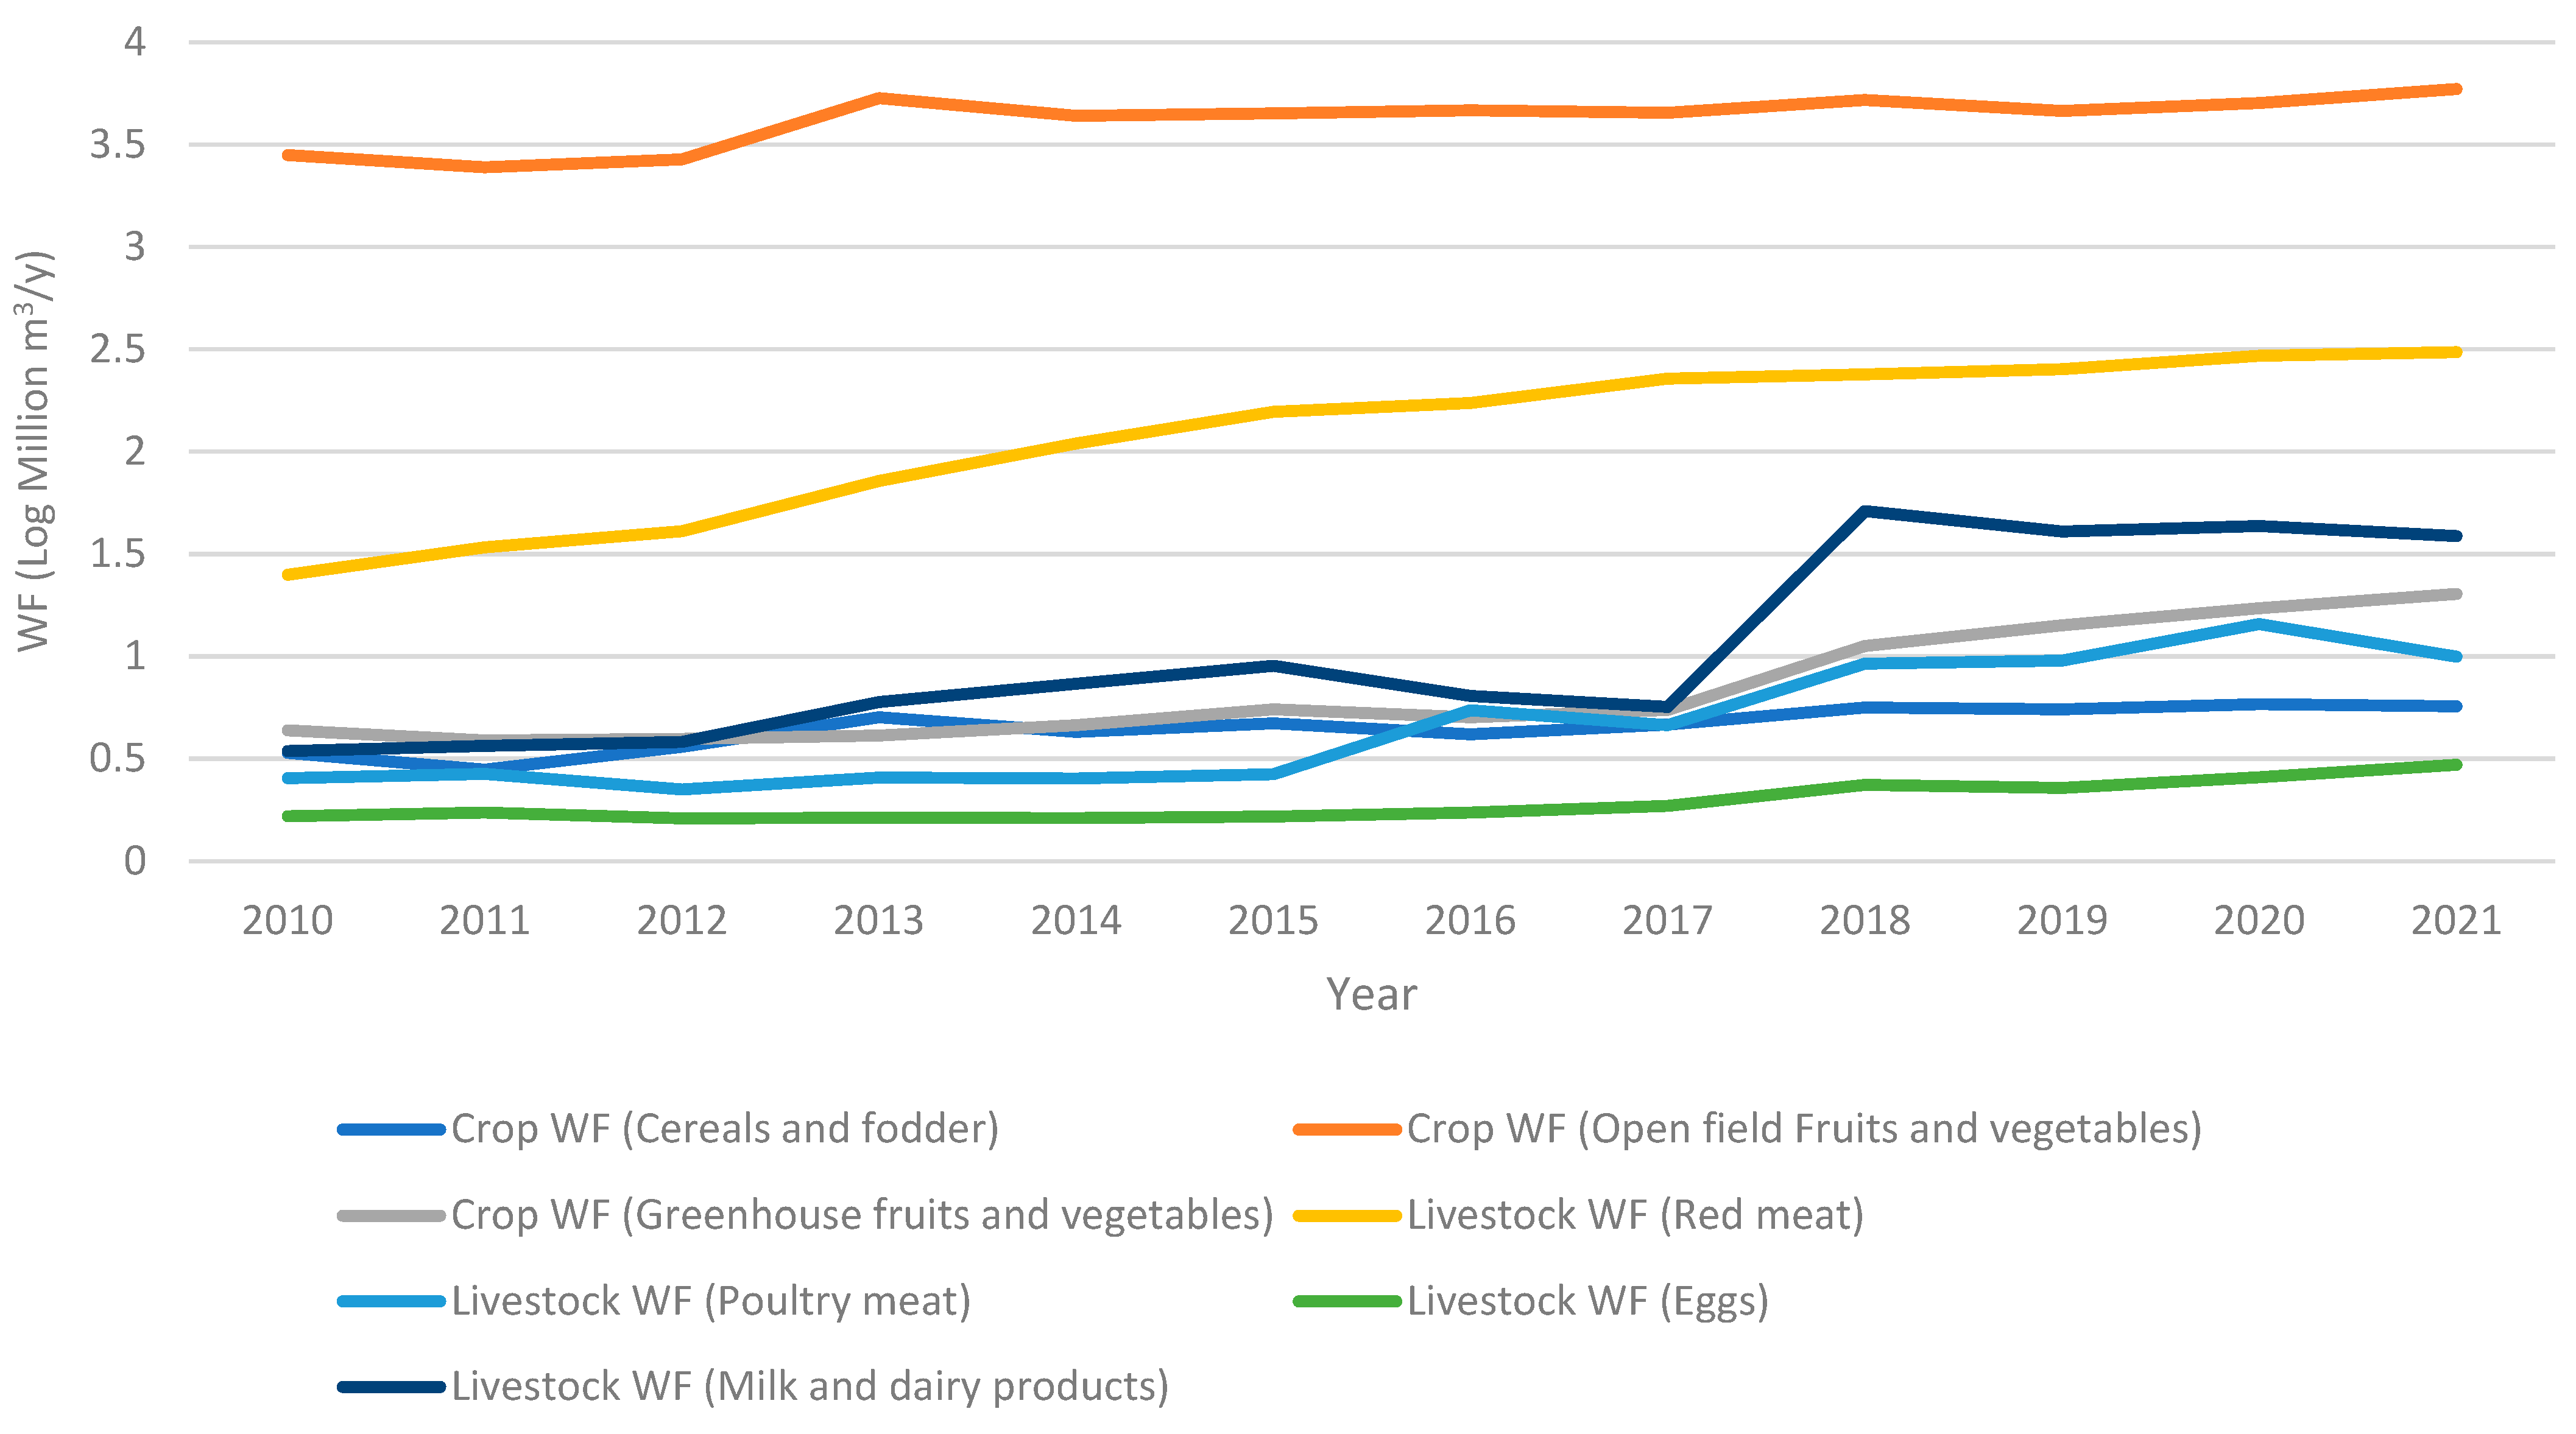
3.1. Agricultural WF
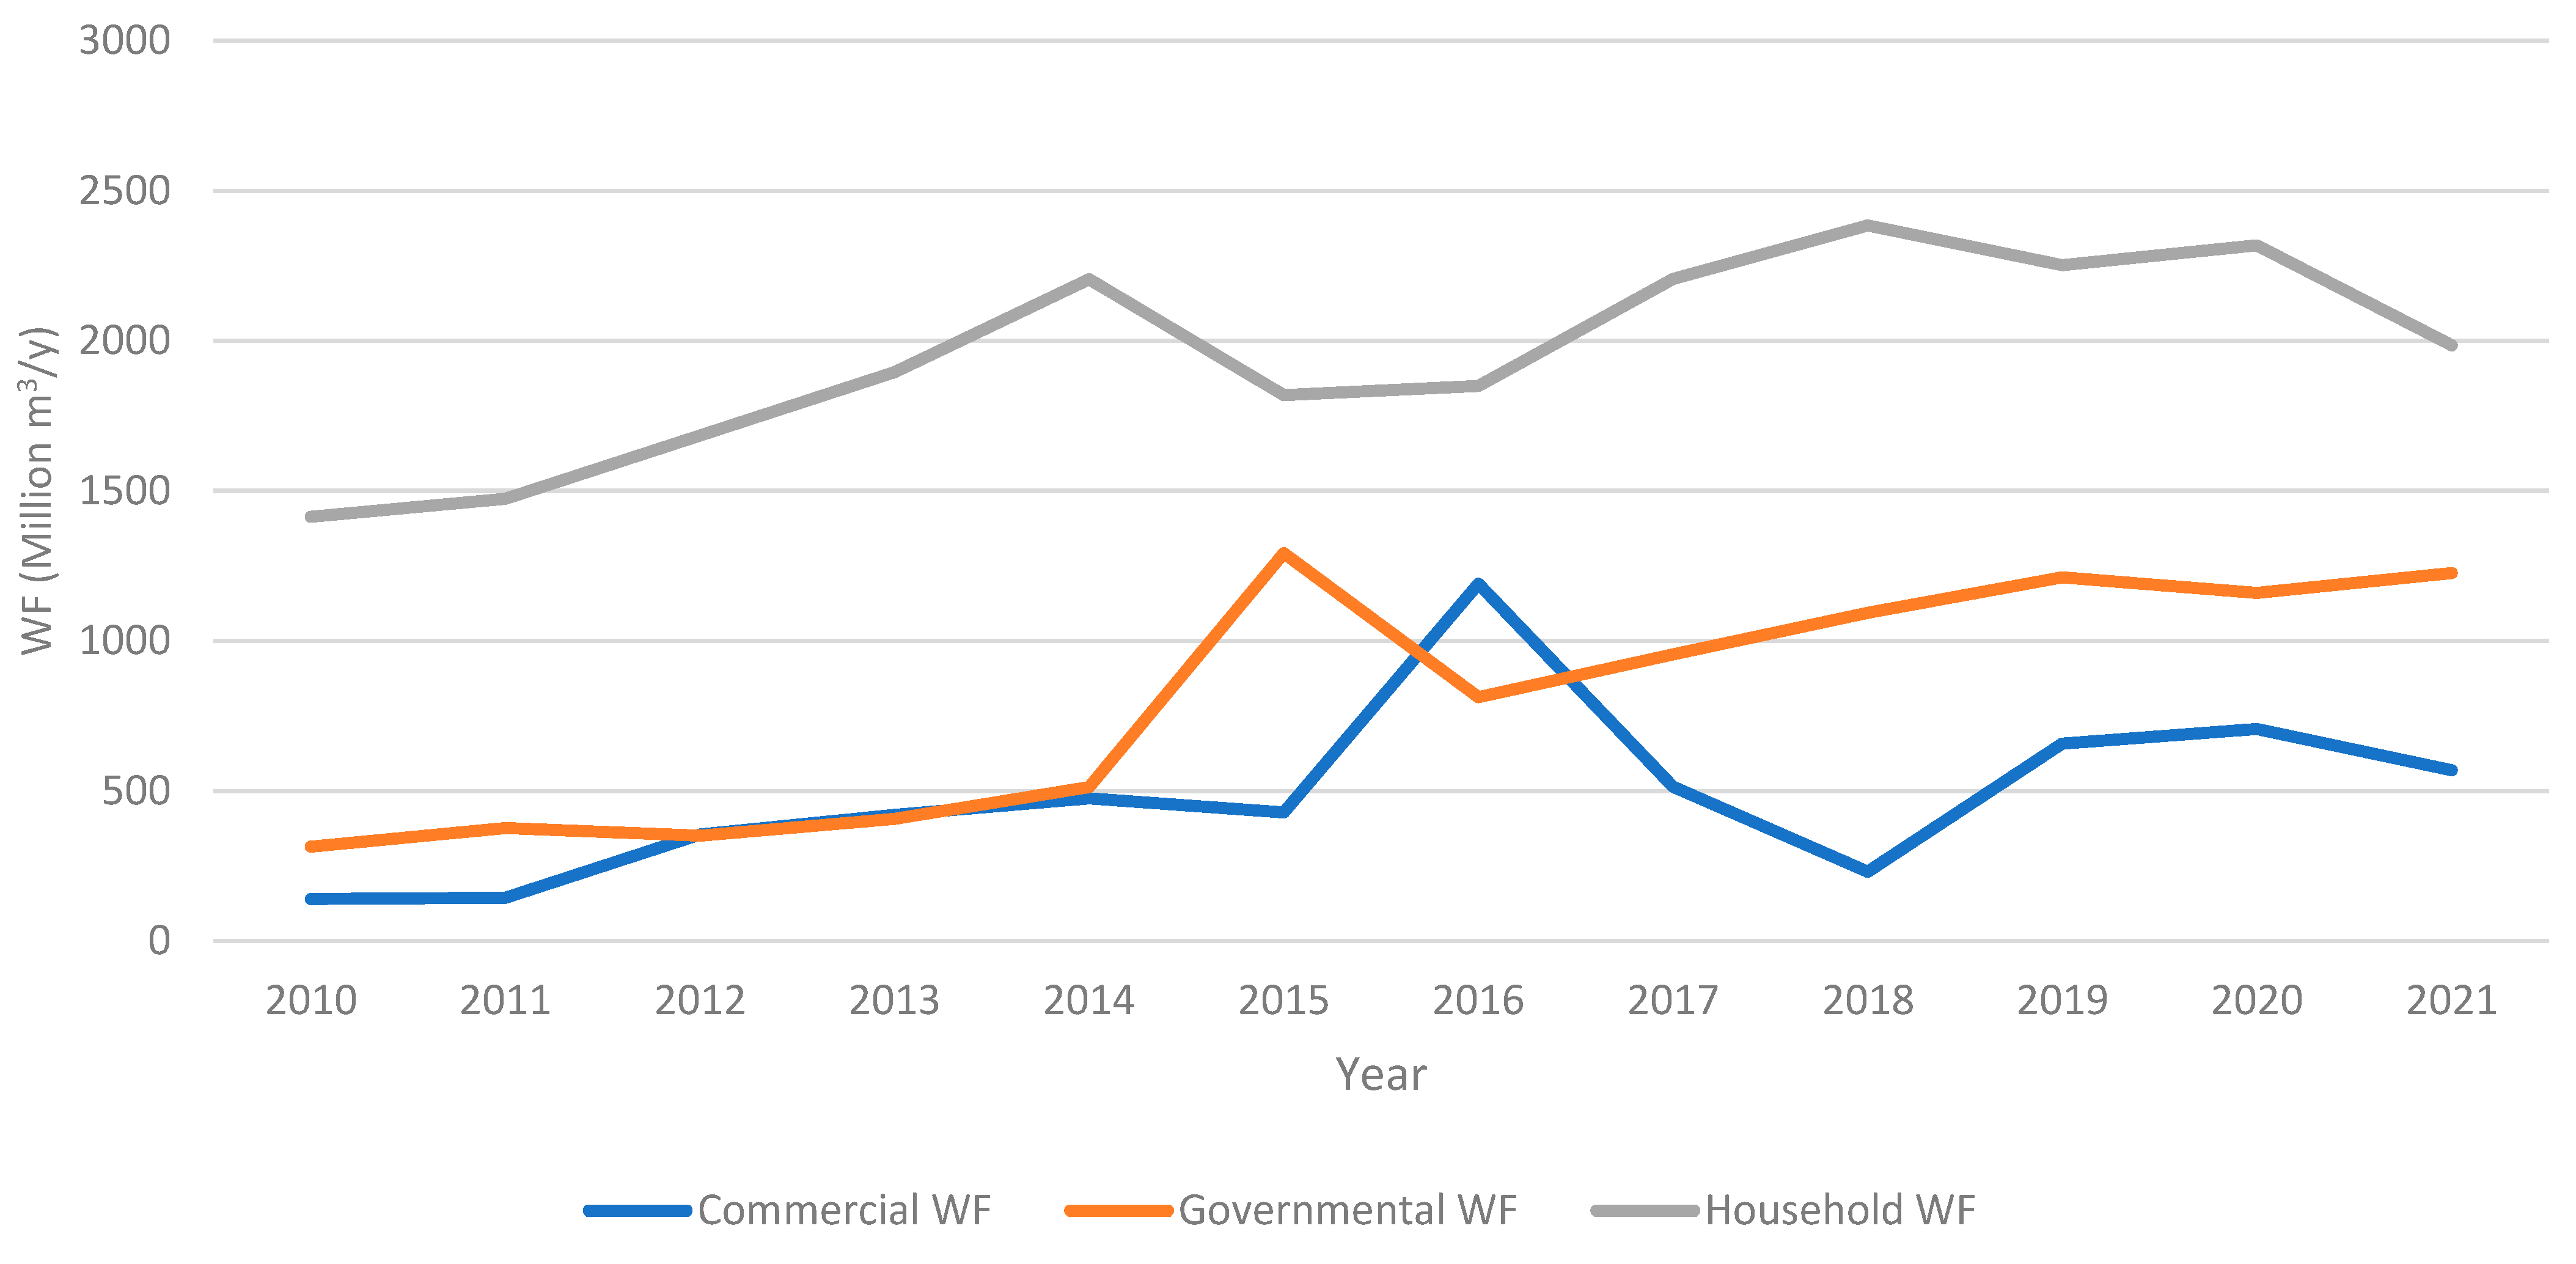
The agricultural WF comprises the crop and livestock WF. The annual average of the total agricultural WF was 50 million m3/y in Qatar from 2010 to 2021. Crop WF accounted for the majority of this WF; open field fruits and vegetables accounted for the highest WF followed by red meat and milk and dairy products with an annual average WF of 37, 8, and 2 million m3/y, respectively. Figure 2 shows the trends of agricultural WF categories from 2010 to 2021. A steady increase is observed for the most part; however, in 2018 a sharp increase was observed for some categories, mainly for milk and dairy products, which went from an annual average WF of 1 to 4.5 million m3/y. This corresponds to the blockade imposed on Qatar by neighboring countries in 2017, which drove Qatar to rely on local production rather than imports to cover its needs.
Looking at crop WF, the blue WF, CWU and ET were higher than its green counterpart across all categories given the arid nature of Qatar. As evident in Table 1, open field fruits and vegetables had the highest values. The highest WF was recorded for dates, followed by eggplants and pumpkins with WF values of 955, 320, and 196 m3/ton, respectively. Greenhouse fruits and vegetables showed a lower WF compared to those grown in open field systems; namely, cucumber had a WF value of 21 m3/ton. Tomatoes which were grown in both greenhouse and open field systems showed a WF of 136 m3/ton. Although cereals and fodder had the highest production compared to all other categories, it had the lowest WF. This is a result of the low water consumption of the system used for growing fodder which accounts for 99% of the total production of this category; its WF was 2 m3/ton.

3.2. Urban WF

The urban sector WF encompasses household, commercial, and governmental WF. The annual average of the total urban WF was 3250 million m3/y in Qatar from 2010 to 2021. Households showed the highest WF with an annual average of 1960 million m3/y followed by the governmental sector with an average annual WF of 810 million m3/y. The lowest annual average WF was recorded for the commercial sector, with 487 million m3/y. As shown in Figure 3, the trends of urban WF varied between sectors and overtime from 2010 to 2021, and households displayed the highest contribution to urban WF consistently overtime. In 2013, a jump was observed in the household WF with a WF value of 2210 million m3/y, followed a sharp decline and steady increase until the WF reached a maximum of 2380 million m3/y in 2018. The WFs for the governmental and commercial activities were comparable in the beginning of the decade until the governmental WF peaked in 2015 with an WF of 1290 million m3/y, while the commercial WF peaked in 2016 with an WF value of million 1190 m3/y. The governmental WF continued to increase compared to the commercial WF towards the end of the decade.

3.3. Industrial WF

The industrial sector comprises mining and quarrying WF—which includes oil, natural gas, and other mining activities, the electricity generation WF and the WF of other industrial activities. The annual average of the total industrial WF was 1650 million m3/y in Qatar from 2010 to 2021. Mining and quarrying displayed the highest WF with an annual average of 2160 million m3/y, of which natural gas made up the majority, followed by oil with an annual WF average of 993 and 677 million m3/y, respectively. Figure 4 shows the trend in the industrial WF in Qatar from 2006 to 2021. It is evident that the industrial WF remained stable through the years and steadily increased across all activities except for the oil WF, which reduced marginally in the past decade. Natural gas WF showed exponential growth until 2012; after that, it continued to steadily grow.
Overall, the combined WF of all sectors, otherwise known as the WF area, was equal to an annual average of 4960 million m3/y from 2010 to 2021 in Qatar. Table 2 shows all the studied sectors and subsectors of the WF within Qatar; it is apparent that the urban sector had the highest contribution to the WF consistently overtime, with a few notable fluctuations over the years. Industrial sector WF was comparable to that of the urban sector in the beginning of the decade; however, the urban sector grew drastically while the industrial sector showed a steady growth. The agricultural sector had the lowest contribution to the WF within Qatar compared to the other sector, yet it demonstrated a steady growth over the decade.

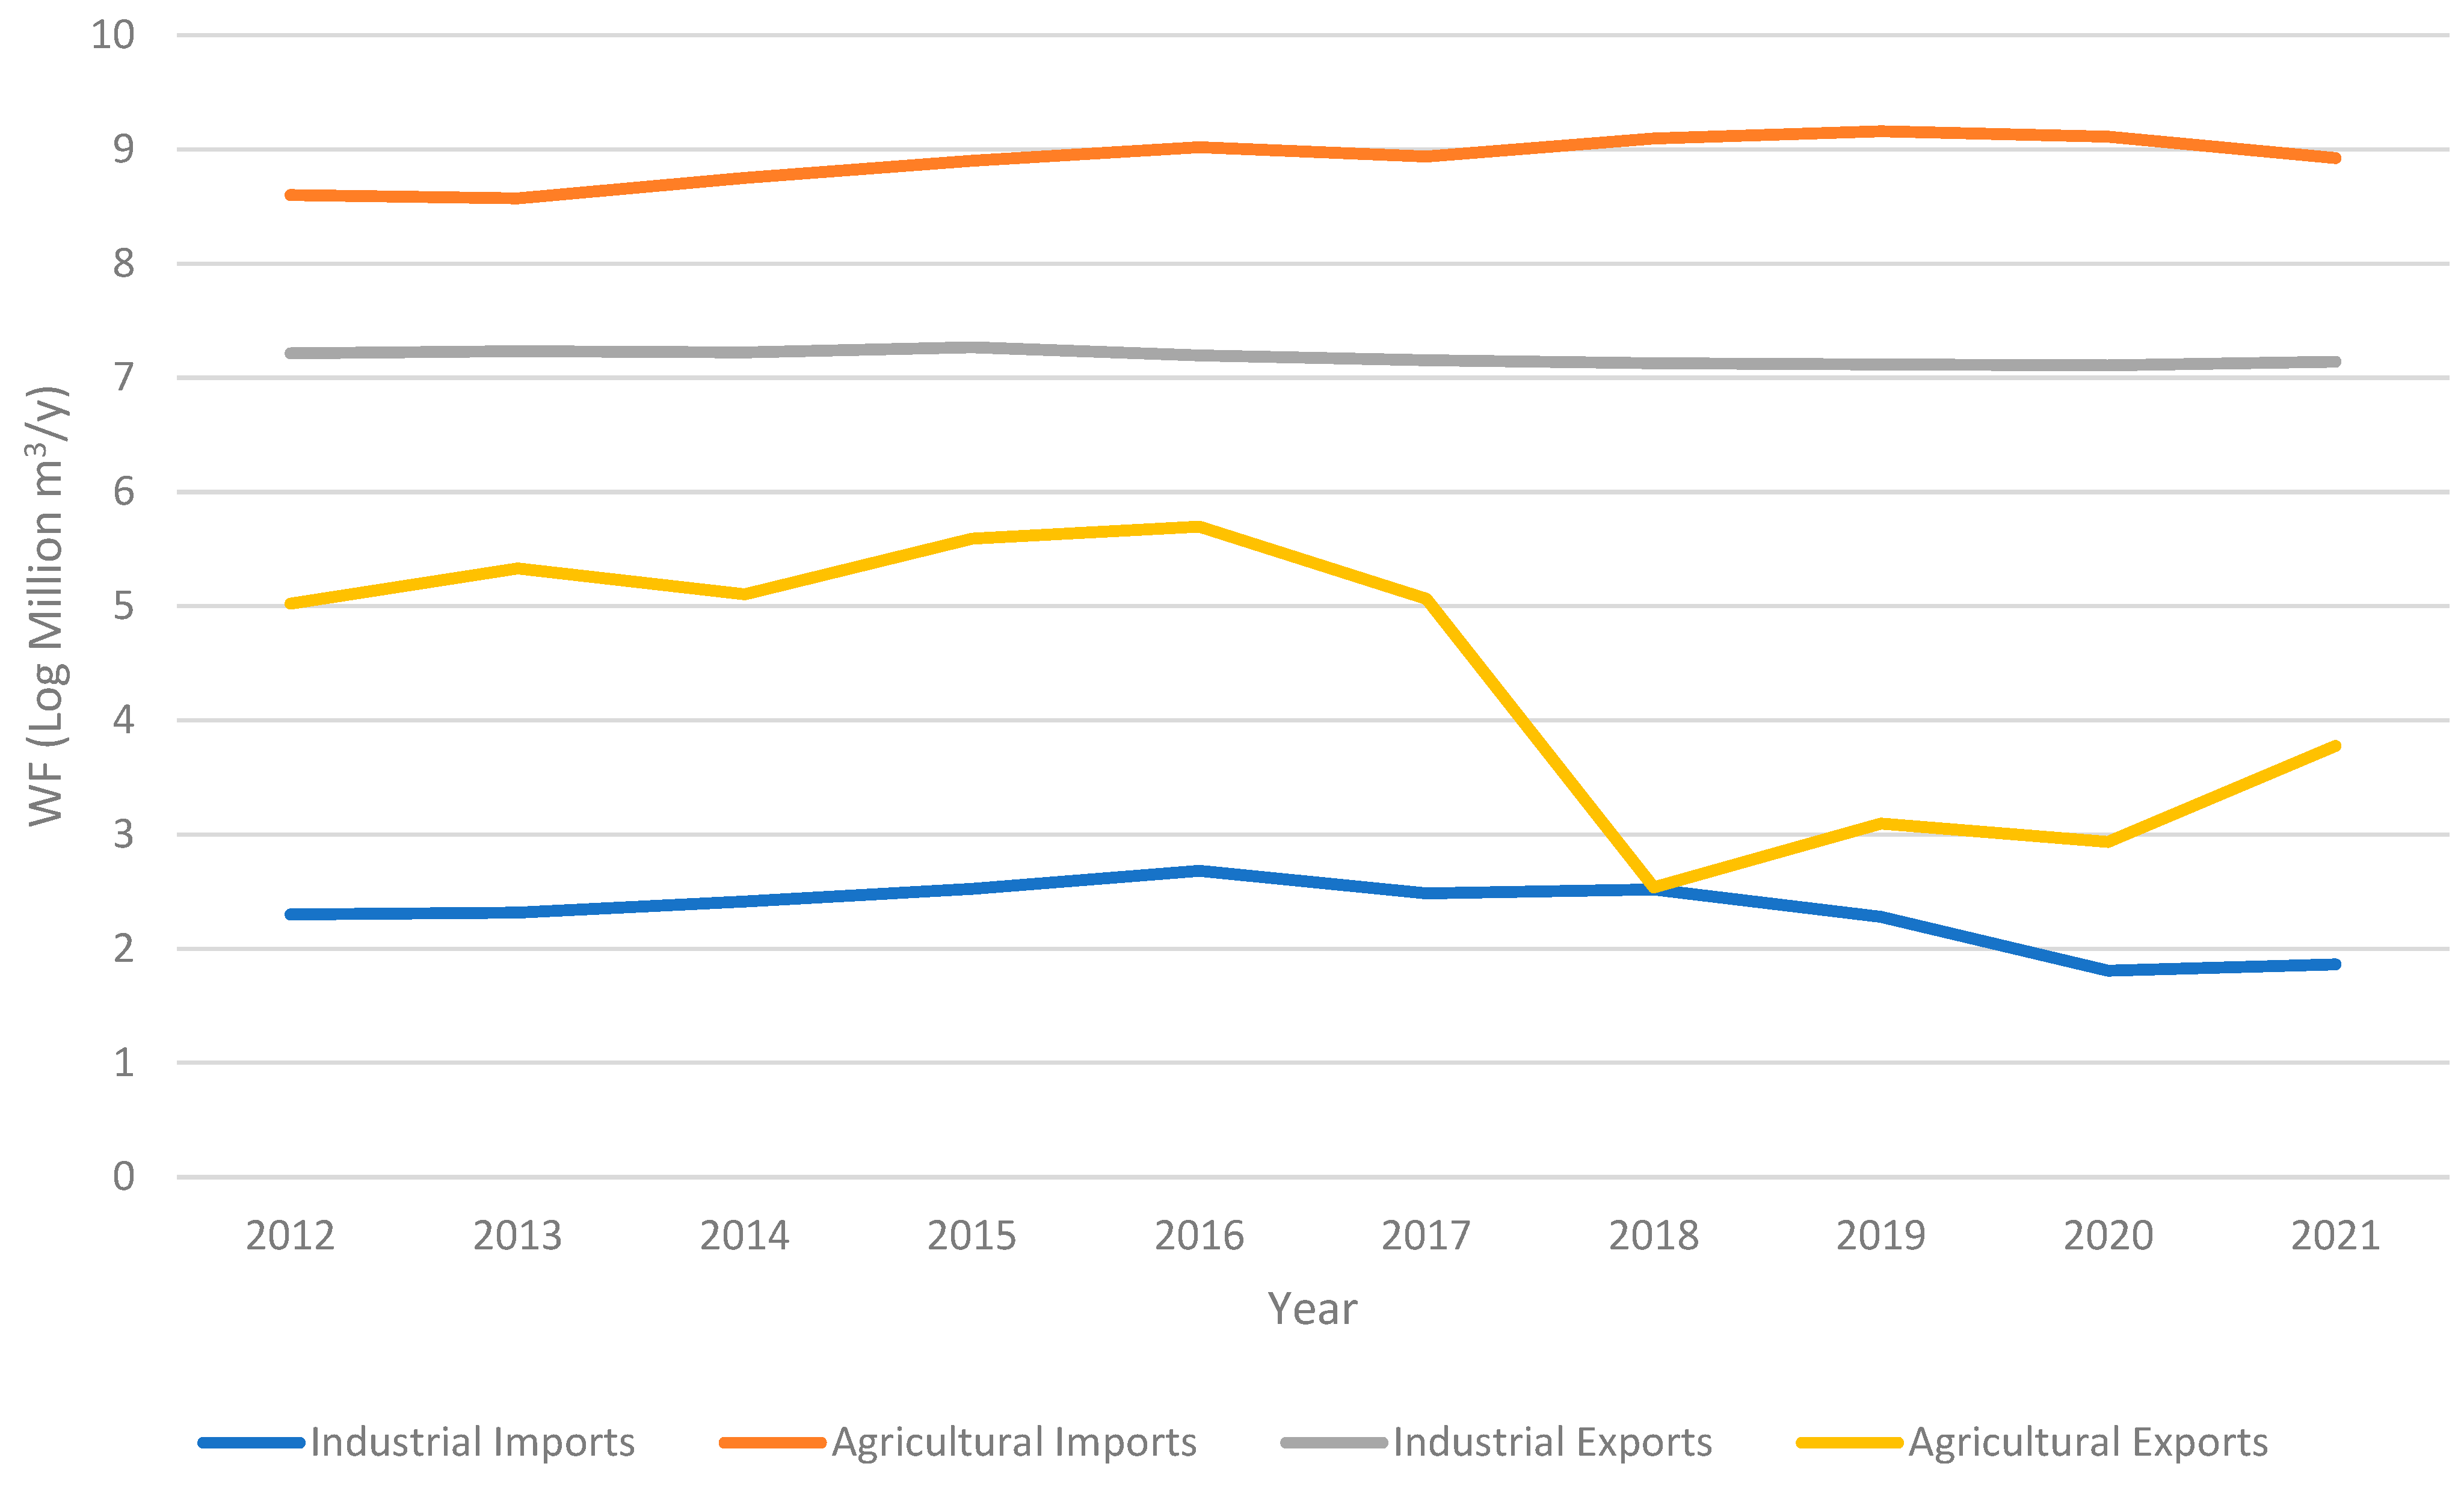
3.4. Virtual Water of Imports and Exports

Virtually all of Qatar’s exports are industrial, comprising 99.9% of total exports, with minimal agricultural exports. The vast majority of exports belong to the mineral fuels, lubricants, and related materials category, accounting for nearly 90% of all exports. Within this category, petroleum gases and petroleum oils dominate. Similarly, industrial imports make up approximately 96% of all imports, with agricultural imports constituting only 4%. Qatar imports significant quantities of crude materials (excluding fuel), with over 80% of imports consisting of construction materials crucial for ongoing development, including pebbles, gravel, broken/crushed stone, and iron ores and concentrates. Regarding agricultural imports, the highest weight was recorded for fruits and vegetables, followed by cereal products and meat and poultry.
The annual average WF for imports stands at 7530 million m3/y, substantially higher than the annual average WF for exports, which is 1450 million m3/y. Despite the agricultural sector’s lower contribution to total imports, its WF is notably higher than that of the industrial sector. The annual average WF for agricultural imports is 7520 million m3/y, whereas for industrial imports, it is 11 million m3/y. Conversely, industrial exports have a much higher WF compared to agricultural exports, with annual average WF figures of 1310 million m3/y and 13 million m3/y, respectively.
Figure 5 illustrates fluctuations in virtual water imports over the years, with substantial increases observed in 2016 and 2019 followed by a notable decrease in 2021. In contrast, the export of virtual water peaked in 2015, followed by a continuous downward trend. However, in 2021, there was a slight upturn in virtual water exports.

3.5. WF of National Conumption of Qatar

As detailed in Table 3, the WF area, which is the sum of all sectorial WFs within Qatar, stands at an annual average of 5780 million m3/y. The country imports a significant amount of virtual water compared to its exports, resulting in a net virtual water import of an annual average of 6090 million m3/y. The total WF consumption is measured at an annual average of 11,900 million m3/y, with an annual average of 6720 million m3/y being consumed externally and an annual average of 5150 million m3/y consumed internally. Qatar’s virtual water budget is calculated at an annual average of 13,300 million m3/y. In terms of water dependency, Qatar relies on external sources for an annual average of 56% of its water needs, indicating a water self-sufficiency rate of an annual average of 44%. Additionally, an annual average of 20% of Qatar’s virtual water is exported. Qatar has a low reliance on natural resources, with only an annual average of 3% of its water consumption originating from natural sources. The annual average per capita WF is equal to 2150 million m3/y.

4. Discussion

Qatar’s economy has undergone a significant transformation driven by its strategic geographical position and abundant natural resources, predominantly oil and natural gas. As a key player in the global energy market, Qatar stands out as a leading exporter of liquefied natural gas (LNG), contributing significantly to its economic growth [51]. This economic expansion has resulted in significant agricultural, urban, and industrial development, as well as initiatives aimed at economic diversification [52]. However, Qatar faces critical water stress, primarily attributed to its arid climate and limited natural water resources; therefore, the country heavily relies on nonconventional water sources, including desalination, and significantly depends on food imports to meet its nutritional needs [14,16,25]. This situation is further intensified by the ongoing developmental activities and the elevated per-capita water consumption, facilitated by the country’s wealth derived from its oil and gas economy, in turn contributing to the silent yet substantial strain on available water resources. The relationship that exists between the energy-driven economy of Qatar and the increasing demand for water resources in the agricultural, urban, and industrial sectors highlights the need for a holistic analysis to advise strategic planning and sustainable water management practices.
Qatar’s average water footprint consumption is 11,900 million m3/y, which includes both internal and external consumption. It utilizes internal water resources, such as desalination and groundwater extraction, with an average internal WF consumption totaling 5150 million m3/y. This alone is insufficient to meet the country’s water needs. Therefore, it heavily relies on imports, with an average external WF consumption of 6720 million m3/y. Qatar’s WF consumption is relatively lower compared to that of Egypt (69,000 million m3/y) due to its smaller population and limited freshwater resources. However, Egypt’s WF is primarily driven by its large population, reliance on the Nile River, and an extensive agricultural sector, which includes irrigation for crops, mainly cotton and rice [53,54]. The Netherlands is a small country and has a high WF consumption (20,000 million m3/y) compared to Qatar due to its intensive agriculture, industrial activities, and dense population [54,55]. Another example is Australia, Australia’s WF is approximately 27,000 million m3/y; this high WF is largely driven by large land area of the country utilized for its agricultural sector [12,54]. All three countries face unique challenges in water management. Additionally, Qatar’s per-capita WF is among the highest in the studied countries, nearly twice as high as that of the neighboring Saudi Arabia and quite similar to those of countries such as Portugal, Spain, and USA, which are among the highest contributors [23].
Qatar’s water footprint profile reflects the country’s complex water management challenges and reliance on external water resources. With a high annual average virtual water import of 7530 million m3/y, Qatar depends significantly on importing water-intensive goods and services to meet domestic demands, given its arid climate and limited freshwater availability. Qatar’s virtual agricultural imports make up 7520 million m3/y, which accounts for the majority of the virtual water imports. The agricultural sector faces many challenges due to the country’s harsh climate, limited arable land, and limited water resources [56]. Additionally, the agricultural sector is the most water-demanding sector [12]; therefore, Qatar relies heavily on food imports (mainly food and live animals, including fruits and vegetables and meat and poultry) to meet the needs of its population. According to the new National Food Security Strategy 2024–2030, Qatar aims to improve food security by sustaining its investments in technology, research, and innovation in the agricultural sector [57]. Within the industrial sector, Qatar imports crude materials (excluding fuels) comprising about 90% of all imports over the past decade, predominantly in the form of construction materials. This trend was largely driven by the construction boom in anticipation of the FIFA World Cup 2022 [50]. The majority of these virtual water imports were thus channeled into the construction sector. The production of construction materials like aggregates is highly water-intensive in Qatar, with a water footprint of up to 468.60 L/ton [51]. Consequently, importing these materials represents a more sustainable approach for the country’s construction industry.
On the contrary, the main industrial exports of Qatar fall under mineral fuels, lubricants, and related materials, making up nearly 90% of all exports. The great majority of that is petroleum gases followed by petroleum oils. Within this category, petroleum gases and other gaseous hydrocarbons represent 76%, and petroleum oils, oils from bituminous minerals, etc. (crude), represent 7%. It is therefore no surprise that substantial amounts of water are used for oil and gas exports. In 2021, Qatar was the third largest natural gas exporter and the second largest exporter of LNG [53]. Qatar’s agricultural exports are very limited compared to those of other countries [17]. As per this study, agricultural export WF is approximately 134 million m3/y, with the main virtual water exports being cereal products and meat and poultry.
According to the results, Qatar was a net virtual water importer with an average of 6090 million m3/y from 2012 to 2021. It had a high volume of imports compared to exports, and the main contributions were derived from the contribution of the agricultural sector. A previous study also indicates that Qatar was a net virtual water importer with an average of 1350 million m3/y from 1998 to 2015 [8] since it heavily relied on virtual water imports to meet agricultural needs. Despite Qatar having a high virtual water of exports (oil and natural gas), its virtual water import (mainly agricultural) still outweighs its massive exports, making the country a net virtual water importer. Similarly, some of the major oil and gas exporting countries such as the UK, Russia, Nigeria, Mexico, and Colombia are net virtual water-importing countries [58]. This indicates a situation similar to that in Qatar’s booming oil and gas industry. These countries manage to balance out their intense water consumption by importing large quantities of water that compensate for the exported quantities. It is important to mention that these countries are much larger than Qatar, with a drastically larger population. Given the small size and population of Qatar, the country is in a unique position in terms of its virtual water.
Qatar’s water dependency underscores its significant reliance on external water sources to meet domestic demand, making it vulnerable to changes in global water trade patterns. An example of this was apparent during the 2017 blockade. Achieving higher water self-sufficiency would enhance Qatar’s resilience to external water supply disruptions. Comparatively, Qatar’s water import dependency and self-sufficiency percentages reveal notable differences and similarities among Qatar and other studied countries such as Egypt [59]. Although Egypt faces water scarcity issues similarly to Qatar, it presents a starkly different scenario, with a significantly higher water import dependency of 81% and a lower self-sufficiency of 19%. This stark contrast underscores the diverse water management challenges faced by nations with varying geographic and climatic conditions. On the contrary, countries such Germany and Italy, although very different from Qatar in terms of climate, water resources and economy, demonstrate similar levels of reliance on imported water as Qatar, with water import dependency percentages of 53% and 51%, respectively [59].
For a water-scarce country such as Qatar, a water export fraction of 20% is significant and reflecting Qatar’s involvement in exporting water-intensive products, mainly oil and gas. This, coupled with low reliance on internal natural water sources at only 3%, highlights the lack of natural means to accommodate the water demand of Qatar’s major industries. Consequently, this demand is met through desalination, an expensive and intensive nonconventional water resource enabled by the booming oil and gas industry. Overreliance on desalination can lead to complacency in water conservation efforts and exacerbate water scarcity in the long term [60]. This reflects a level of dependency on oil and gas that thwarts efforts for water resource sustainability for Qatar. To ensure long-term water security and sustainability, Qatar can channel efforts into enhancing its water management practices in this regard. One strategy involves reducing the virtual water exported, particularly from the oil and gas industry operations, through increased efficiency measures and sustainable practices. Additionally, Qatar can strategically increase its imports in areas that consume large amounts of water within the agricultural and industrial sectors, thereby optimizing resource allocation and promoting water sustainability. By implementing these measures, Qatar can strengthen its resilience to water challenges and contribute to regional water security efforts. Further elaboration on sector-specific analyses and initiatives addressing these aspects is provided in subsequent sections.
The agricultural sector in Qatar has expanded in recent years, spurred by economic growth and rapid population increase. The 2017 blockade, imposed by neighboring countries, significantly impacted Qatar’s food production [17,52]. Prior to the blockade, Qatar relied heavily on food imports from Saudi Arabia and the UAE. However, the blockade catalyzed a surge in national food production, with production of perishables like vegetables and milk nearly tripling, and self-sufficiency in dairy and poultry markedly increasing [17]. As a result, the water footprint (WF) of Qatar’s agricultural sector rose by 15% in the year following the blockade.
Qatar’s extreme environmental conditions, such as scarce rainfall and high evaporation rates [59], render open field systems particularly water-intensive, further contributing to the sector’s WF. Qatar can decrease water resource overexploitation in the agricultural sector by focusing on introducing efficient irrigation systems in farms. Several farms have begun using technologies such as hydroponics, brackish water treatment systems, and greenhouses to some extent [53]. The use of water-efficient technologies, as this study indicates, could significantly reduce the WF in agriculture. For instance, open field systems, despite being the second highest in production, account for over 90% of the crop WF. Identifying crops with the highest WF in Qatar (like dates, eggplants, and pumpkins) can aid in strategic decisions about local cultivation versus overseas agricultural investments or long-term food import plans.
In 2021, direct water use in agriculture, as supplied by KAHRAMAA, accounted for nearly 35% of the country’s total [60]. Although this represents a substantial sectoral water use, Treated Sewage Effluent (TSE) constituted about three quarters of the water used in agricultural activities. Comparatively, Qatar’s agricultural WF is small on a global scale; for instance, the crop production WF in the US is 826 Gm3/y, while the global total stands at 7404 Gm3/y [53]. In terms of livestock and animal product WF, Qatar is among the countries with the lowest WF in the MENA region [37].
In conclusion, while Qatar’s agricultural WF is relatively low, it places significant strain on the nation’s limited water resources. An integrated approach that combines judicious crop selection, the utilization of TSE, and investment in water-efficient technologies could reduce the agricultural WF. This approach would support Qatar’s goals of self-sufficiency and national food security without exacerbating the scarcity of water resources.
The urban sector showed the highest contribution the WF within Qatar. This is different from other countries such as the US, China, and Japan, where the agricultural and industrial WF values were higher than those of domestic consumption [23]. Additionally, the domestic or urban WF was comparable to that of the neighboring Saudi Arabia, which was equal to 1.6 Gm3/y, and higher than that of Switzerland, which was equal to 0.45 Gm3/y, as an example of a studied country with a similar population and area [23]. The per-capita urban WF for Qatar as determined in this study (2150 m3/cap/y) was higher than the global average of 57 m3/cap/y [23]. It is well established that Qatar has one of the highest per-capita consumption rates in the world [14]; however, Qatar is making efforts to reduce its urban water consumption. The Qatar National Vision 2030 is specifically focusing on decreasing consumption, enhancing conservation, and promoting circular water economy. This includes providing infrastructure to utilize more of the TSE and reducing water losses [52]. In fact, TSE generation has increased more than 3.5 times over the past decade, where up to 99.7% of the total wastewater is being treated as of 2021 [51,54]. It is critical that water conservation initiatives are implemented in Qatar to decrease water resource overexploitation by focusing on the reduction in domestic demand, reducing network leakage, and applying resilient water policies [12]. In 2012, KAHRAMAA initiated the Tarsheed National Campaign for Water and Electricity Conservation with the objective of educating the community in Qatar on energy and water conservation, sustainability, and environmental awareness. The goal is to encourage behavioral changes and promote practices that align with environmentally friendly habits and lifestyles [52]. Also, KAHRAMAA has initiated fines for water usage violations, such as washing cars or courtyards, with fines reaching up to 20,000 QAR [12]. In 2009, Qatar created a 30-year master plan that covers massive investments (over USD 5 billion between 2010 and 2015) in wastewater treatment plants, desalination plants, and other water infrastructure projects [53]. Moreover, Qatar could benefit from incentivize conservation; this could be achieved by implementing a tiered water pricing system where consumers are charged progressively based on their water usage. Additionally, water subsidies can be reviewed and reformed to discourage wasteful consumption. Subsidies can be gradually phased off or redirected toward water-efficient technologies. Similar approaches were used in Australia; for example, a reform of water pricing was based on the principles of consumption-based pricing, full cost recovery, and removal of cross-subsidies. This resulted in successful outcomes and promoted efficient and sustainable use of water resources and assets [56]. Qatar should continue to grow its efforts in changing public behavior with regard to water in addition to expanding its use of the available TSE.
Although the industrial direct water uses were much lower than those of the other two sectors, industrial WF was the second highest WF within Qatar. Industrial WF within Qatar was comparable to that of Switzerland, 1.387 Gm3 /y, while it was higher than that of neighboring Saudi Arabia (0.191 Gm3/y) and lower than that of the US (214 Gm3/y), which is another major natural gas-exporting country [23]. Oil and gas production processes are water-intensive, producing large amounts of wastewater. Volumes can reach 0.4–1.6 times the amount of crude oil produced [57]. Wastewater from oil and gas processes includes produced water, desalter effluent, stripped sour water, tank bottom water, spent caustic effluent, condensate blowdown, cooling water blowdown, and ballast water. Qatar oil and gas wastewater is characterized by very high concentrations of COD, BOD, TDS, and TSS [57]. Therefore, it is critical for Qatar to strategically implement process wastewater treatment for the industry’s effluents in order to reuse and repurpose water. Process wastewater can be reused in industries for a variety of processes such as cooling towers, fire suppression, and fracturing operations or for other purposes such as irrigation, aquaculture growth, and dust control. Different purposes require different levels of treatment; for example, reusing process wastewater for industrial processes and irrigation requires a low or mild level of treatment, whereas reusing it for aquaculture requires a relatively strict level of treatment [58]. Furthermore, development of water use flow diagrams and footprints for all operations can lead to water conservation. In 2022, a water use survey was carried out by Qatar Energy to assess the volume and quality of all water streams—including potable, wastewater, and sanitary water—across its activities in order to identify reduction options for its processes [61]. Reducing and recycling process wastewater in addition to monitoring and assessing sustainability of the process is crucial for reducing industrial sector WF.

5. Conclusions

This study elucidates the complex interplay of factors influencing Qatar’s water footprint (WF) and virtual water trade. It underscores the nation’s unique position as a net virtual water importer, largely due to its food imports combined with a significant export fraction and low reliance on natural water resources. The agricultural sector, though small on a global scale, has seen significant growth and faces challenges due to Qatar’s arid conditions and the need for water-efficient technologies. Urban water consumption remains high, but initiatives under Qatar National Vision 2030 and the Tarsheed campaign reflect a strong commitment to reducing this footprint through conservation and optimized use of Treated Sewage Effluent (TSE).
The findings from Qatar’s case offer valuable insights for water-scarce countries, demonstrating the effectiveness of strategic sectoral analysis in water management. The methodologies applied here provide a framework for other nations, especially those in arid regions, to evaluate and manage their water resources more sustainably. This research contributes to the broader understanding of water use efficiency and conservation, emphasizing the critical need for integrated approaches that balance economic growth, environmental sustainability, and resource optimization. Ultimately, the lessons drawn from Qatar’s experience can guide policy development and implementation in similarly situated regions, fostering global efforts towards sustainable water management.

Author Contributions

Conceptualization, R.B.H.; methodology, All authors; validation, R.B.H.; formal analysis, all; resources, R.B.H.; data curation, N.H. and S.M.; writing—original draft preparation, N.H., R.K., A.S., S.A.-S., H.H., S.W., R.A., L.Z. and M.S.M.; writing—review and editing, N.H., S.M. and R.B.H.; supervision, R.B.H.; funding acquisition, R.B.H. All authors have read and agreed to the published version of the manuscript.

Funding

This research received internal funding from Qatar University through Indirect Cost (IDC-RBH).

Data Availability Statement

Datasets analyzed or generated during the study supporting reported results can be found at https://shorturl.at/diW38.

Acknowledgments

The authors acknowledge support and data provision from Ministry of Environment and Climate Change; ASHGHAL and Planning and Statistics Authority from the State of Qatar. The authors thank the reviewers for their insightful comments and suggestions which helped to improve the quality of this manuscript.

Conflicts of Interest

The authors declare no conflicts of interest.

References

  1. Mekonnen, M.M.; Hoekstra, A.Y. Four billion people facing severe water scarcity. Sci. Adv. 2016, 2, e1500323. [Google Scholar] [CrossRef] [PubMed]
  2. Schlosser, C.A.; Strzepek, K.; Gao, X.; Fant, C.; Blanc, É.; Paltsev, S.; Jacoby, H.; Reilly, J.; Gueneau, A. The future of global water stress: An integrated assessment. Earth’s Future 2014, 2, 341–361. [Google Scholar] [CrossRef]
  3. UN-Water. Summary Progress Update 2021: SDG 6—Water and Sanitation for All; UN-Water: Geneva, Switzerland, 2021; Available online: https://www.unwater.org/app/uploads/2021/12/SDG-6-Summary-Progress-Update-2021_Version-July-2021a.pdf (accessed on 23 August 2022).
  4. Al Rabadi, S. Problematic of the Water Issue in International Relations. 2021. Available online: https://russiancouncil.ru/en/blogs/salam_alrabadi-en/problematic-of-the-water-issue-in-international-relations/ (accessed on 25 August 2022).
  5. World Economic Forum. The Global Risks Report 2021, 16th ed.; World Economic Forum: Cologny, Switzerland, 2021. [Google Scholar]
  6. Bari, A. Assessment of Plant Genetic Resources for Water-Use Efficiency (WUE): Managing Water Scarcity. 2007. 83 p. ISBN: 978-92-9043-748-2. Available online: https://cgspace.cgiar.org/items/52862930-28b3-42e8-82e9-01c0b466a448 (accessed on 23 August 2022).
  7. Kemp, G.; Hagberg, L. Water Crises, Security and Climate Change. 2018, p. 172. Available online: https://cftni.org/publications/water-crises-security-and-climate-change/ (accessed on 23 August 2022).
  8. Mohammed, S.; Darwish, M. Water footprint and virtual water trade in Qatar. Desalination Water Treat. 2017, 66, 117–132. [Google Scholar] [CrossRef]
  9. Qureshi, A.S. Challenges and Prospects of Using Treated Wastewater to Manage Water Scarcity Crises in the Gulf Cooperation Council (GCC) Countries. Water 2020, 12, 1971. [Google Scholar] [CrossRef]
  10. Abdulrahman, S.A. Water shortage in GCC countries: Transferring water from Iraqi Kurdistan Region. Int. J. Environ. Stud. 2019, 77, 191–207. [Google Scholar] [CrossRef]
  11. Hofste, R.W.; Reig, P.; Schleifer, L. 17 Countries, Home to One-Quarter of the World’s Population, Face Extremely High Water Stress. August 2019. Available online: https://www.wri.org/insights/17-countries-home-one-quarter-worlds-population-face-extremely-high-water-stress (accessed on 21 April 2022).
  12. Alhaj, M.A.; Mohammed, S.; Darwish, M.; Hassan, A.; Al-Ghamdi, S.G. A review of Qatar’s water resources, consumption and virtual water trade. Desalination Water Treat. 2017, 90, 70–85. [Google Scholar] [CrossRef]
  13. Baalousha, H.M. Groundwater vulnerability mapping of Qatar aquifers. J. Afr. Earth Sci. 2016, 124, 75–93. [Google Scholar] [CrossRef]
  14. Ismail, H. Food and Water Security in Qatar: Part 2—Water Resources; Future Directions International Pty Ltd.: Perth, Australia, 2015; p. 5. [Google Scholar]
  15. Hussein, H.; Lambert, L.A. A Rentier State under Blockade: Qatar’s Water-Energy-Food Predicament from Energy Abundance and Food Insecurity to a Silent Water Crisis. Water 2020, 12, 1051. [Google Scholar] [CrossRef]
  16. Ismail, H. Food and Water Security in Qatar: Part 1—Food Production; Future Directions International Pty Ltd.: Perth, Australia, 2015; p. 6. [Google Scholar]
  17. Karanisa, T.; Amato, A.; Richer, R.; Majid, S.A.; Skelhorn, C.; Sayadi, S. Agricultural Production in Qatar’s Hot Arid Climate. Sustainability 2021, 13, 4059. [Google Scholar] [CrossRef]
  18. Hogeboom, R.J. The Water Footprint Concept and Water’s Grand Environmental Challenges. One Earth 2020, 2, 218–222. [Google Scholar] [CrossRef]
  19. Aldaya, M.M.; Chapagain, A.K.; Hoekstra, A.Y.; Mekonnen, M.M. The Water Footprint Assessment Manual; Earthscan: England, UK; Washington, DC, USA, 2011. [Google Scholar] [CrossRef]
  20. Zhuo, L.; Feng, B.; Wu, P. Water Footprint Study Review for Understanding and Resolving Water Issues in China. Water 2020, 12, 2988. [Google Scholar] [CrossRef]
  21. Zhang, Y.; Chen, Y.; Huang, M. Water Footprint and Virtual Water Accounting for China Using a Multi-Regional Input-Output Model. Water 2018, 11, 34. [Google Scholar] [CrossRef]
  22. Hoekstra, A.Y.; Mekonnen, M.M. The water footprint of humanity. Proc. Natl. Acad. Sci. USA 2012, 109, 3232–3237. [Google Scholar] [CrossRef] [PubMed]
  23. Chapagain, A.; Hoekstra, A. Water Footprints of Nations; Value of Water Research Report Series; IHE Delft Institute for Water Education: Delft, The Netherlands, 2004; No. 16; Volume 1. [Google Scholar]
  24. Mali, S.; Singh, D.K. The water footprint: Concept, applications and assessments. Agric. Food e-Newsl. 2019, 1, 380–383. [Google Scholar]
  25. Frenken, K. Irrigation in the Middle East Region in Figures: AQUAST Survey–2008; FAO: Rome, Italy, 2009. [Google Scholar]
  26. World Bank. Qatar|Data. Available online: https://data.worldbank.org/country/qatar (accessed on 1 May 2020).
  27. KAHRAMAA. Annual Statistics Report 2020. Qatar. 2021. Available online: https://www.km.com.qa/MediaCenter/Publications/Annual%20Statistics%20Report%202020%20English.pdf (accessed on 25 August 2022).
  28. Planning and Statistics Authority. Water Statistics In the State of Qatar 2019; Planning and Statistics Authority: Doha, Qatar, 2021.
  29. Planning and Statistics Authority. Water Statistics In the State of Qatar 2017; Planning and Statistics Authority: Doha, Qatar, 2018.
  30. Zaidi, S.J.; Rahman, H. Desalination in Qatar: Present Status and Future Prospects. Civ. Eng. Res. J. 2018, 6, 555700. [Google Scholar] [CrossRef]
  31. Jasim, S.Y.; Saththasivam, J.; Loganathan, K.; Ogunbiyi, O.O.; Sarp, S. Reuse of Treated Sewage Effluent (TSE) in Qatar. J. Water Process. Eng. 2016, 11, 174–182. [Google Scholar] [CrossRef]
  32. Fanack Water. Water Resources in Qatar. Available online: https://water.fanack.com/qatar/water-resources-in-qatar/ (accessed on 18 April 2022).
  33. Kheir, R.B.; Greve, M.; Greve, M.; Peng, Y.; Shomar, B. A Comparative GIS tree-pollution analysis between arsenic, chromium, mercury, and uranium contents in soils of urban and industrial regions in Qatar. Euro-Mediterr. J. Environ. Integr. 2019, 4, 10. [Google Scholar] [CrossRef]
  34. Ajjur, S.B.; Al-Ghamdi, S.G. Exploring urban growth–climate change–flood risk nexus in fast growing cities. Sci. Rep. 2022, 12, 12265. [Google Scholar] [CrossRef] [PubMed]
  35. Ewaid, S.H.; Abed, S.A.; Al-Ansari, N. Water Footprint of Wheat in Iraq. Water 2019, 11, 535. [Google Scholar] [CrossRef]
  36. Planning and Statistics Authority—State of Qatar. Qatar Monthly Statistics. 2020. Available online: https://www.psa.gov.qa/en/pages/default.aspx (accessed on 26 May 2020).
  37. Smith, M. CROPWAT: A Computer Program for Irrigation Planning and Management; Version 5.7; Food and Agriculture Organization of the United Nations: Rome, Italy, 1992; Available online: https://search.library.wisc.edu/catalog/999699092102121 (accessed on 20 April 2022).
  38. Allen. FAO Irrigation and Drainage Paper; FAO: Rome, Italy, 1998; p. 326. [Google Scholar]
  39. Mourad, R.; Jaafar, H.H.; Daghir, N. New estimates of water footprint for animal products in fifteen countries of the Middle East and North Africa (2010–2016). Water Resour. Ind. 2019, 22, 100113. [Google Scholar] [CrossRef]
  40. Wang, J.; Qin, L.; He, H. Assessing Temporal and Spatial Inequality of Water Footprint Based on Socioeconomic and Environmental Factors in Jilin Province, China. Water 2019, 11, 521. [Google Scholar] [CrossRef]
  41. Meng, X.; Lu, J.; Wu, J.; Zhang, Z.; Chen, L. Quantification and Evaluation of Grey Water Footprint in Yantai. Water 2022, 14, 1893. [Google Scholar] [CrossRef]
  42. Public Works Authority (Ashghal). Prequalification Document for Design, Build, Operate and Maintain (Dbom) Contract for Integrated Industrial Wastewater Treatment Works-CP798. Qatar. 2018. Available online: https://www.ashghal.gov.qa/en/Tenders/Lists/PrequalificationLibrary/02%20PQD%20IIWWTW-CP798%20-Part%201%20and%202.pdf (accessed on 22 August 2022).
  43. Jain, S.K.; Singh, V.P. (Eds.) Chapter 13—Water Quality Modeling. In Developments in Water Science; Water Resources Systems Planning and Management; Elsevier: Amsterdam, The Netherlands, 2003; Volume 51, pp. 743–786. [Google Scholar] [CrossRef]
  44. Zhu, Y.; Wang, J.; He, G.; Liu, H.; Jiang, S.; Su, J.; Zhao, Y.; Yang, Q.; Fu, T. Water use characteristics and water footprints of China’s oil and gas production. Resour. Conserv. Recycl. 2022, 184, 106428. [Google Scholar] [CrossRef]
  45. Mekonnen, M.M.; Gerbens-Leenes, P.W.; Hoekstra, A.Y. The consumptive water footprint of electricity and heat: A global assessment. Environ. Sci. Water Res. Technol. 2015, 1, 285–297. [Google Scholar] [CrossRef]
  46. U.S. Energy Information Administration (EIA). Qatar Energy Statistics. Available online: https://www.eia.gov/international/data/country/QAT (accessed on 18 August 2023).
  47. Gerbens-Leenes, P.; Hoekstra, A.; van der Meer, T. The water footprint of energy from biomass: A quantitative assessment and consequences of an increasing share of bio-energy in energy supply. Ecol. Econ. 2008, 68, 1052–1060. [Google Scholar] [CrossRef]
  48. Ding, C.; Dong, W.; Zhang, A.; Wang, Z.; Zhao, N.; Chen, R.; Fu, H. Life cycle water footprint assessment of concrete production in Northwest China. Water Policy 2021, 23, 1211–1229. [Google Scholar] [CrossRef]
  49. Nezamoleslami, R.; Hosseinian, S.M. Data needed for assessing water footprint of steel production. Data Brief 2020, 30, 105461. [Google Scholar] [CrossRef] [PubMed]
  50. Wang, H.; Yang, Y. Trends and Consumption Structures of China’s Blue and Grey Water Footprint. Water 2018, 10, 494. [Google Scholar] [CrossRef]
  51. Meza, A.; Koç, M.; Al-Sada, M.S. Perspectives and strategies for LNG expansion in Qatar: A SWOT analysis. Resour. Policy 2022, 76, 102633. [Google Scholar] [CrossRef]
  52. Baalousha, H.M.; Ouda, O.K.M. Domestic water demand challenges in Qatar. Arab. J. Geosci. 2017, 10, 537. [Google Scholar] [CrossRef]
  53. Lawler, J.; Mazzoni, A.; Shannak, S. The Domestic Water Sector in Qatar. In Sustainable Qatar: Social, Political and Environmental Perspectives; Cochrane, L., Al-Hababi, R., Eds.; Gulf Studies; Springer Nature: Singapore, 2023; pp. 193–209. [Google Scholar] [CrossRef]
  54. Planning and Statistics Authority. Water Statistics In the State of Qatar 2021; Planning and Statistics Authority: Doha, Qatar, 2021. Available online: https://www.psa.gov.qa/en/statistics/Statistical%20Releases/Environmental/Water/2021/Water_Statistics_2021_EN.pdf (accessed on 20 June 2023).
  55. Loganathan, K.; Saththasivam, J.; Ogunbiyi, O.; Farzaneh, H.; Mckay, G.; El Jack, Z. Challenges and Solutions for Treated Sewage Effluent Reuse. In Proceedings of the Qatar Foundation Annual Research Conference Proceedings, Doha, Qatar, 19–20 March 2018; Hamad bin Khalifa University Press (HBKU Press): Ar Rayyan, Qatar, 2018; Volume 2018, p. EEPP120. [Google Scholar] [CrossRef]
  56. Australian Water Partnership. The Australian Water Reform Journey: An Overview of Three Decades of Policy, Management and Institutional Transformation. 2016. Available online: https://waterpartnership.org.au/wp-content/uploads/2016/08/AWN-Australian-Water-Reform-Journey.pdf (accessed on 18 December 2023).
  57. Eldos, H.I.; Khan, M.; Zouari, N.; Saeed, S.; Al-Ghouti, M.A. Characterization and assessment of process water from oil and gas production: A case study of process wastewater in Qatar. Case Stud. Chem. Environ. Eng. 2022, 6, 100210. [Google Scholar] [CrossRef]
  58. Shahbaz, M.; Rashid, N.; Saleem, J.; Mackey, H.; McKay, G.; Al-Ansari, T. A review of waste management approaches to maximise sustainable value of waste from the oil and gas industry and potential for the State of Qatar. Fuel 2023, 332, 126220. [Google Scholar] [CrossRef]
  59. Chapagain, A.K.; Hoekstra, A.Y. The global component of freshwater demand and supply: An assessment of virtual water flows between nations as a result of trade in agricultural and industrial products. Water Int. 2008, 33, 19–32. [Google Scholar] [CrossRef]
  60. Gleick, P.H.; Palaniappan, M. Peak water limits to freshwater withdrawal and use. Proc. Natl. Acad. Sci. USA 2010, 107, 11155–11162. [Google Scholar] [CrossRef] [PubMed]
  61. Qatar Energy. Qatar Energy 2022 Sustainability Report; Qatar Energy: Doha, Qatar, 2022; Available online: https://www.qatarenergy.qa/en/MediaCenter/Publications/QatarEnergy%202022%20Sustainability%20Report.pdf (accessed on 18 December 2023).
Figure 1. Map of Qatar showing the agricultural lands, urban areas, major industrial cities, and boundaries of groundwater basins adapted from [32,33,34] and google maps.
Water 16 01185 g001
Figure 2. Water footprint (WF) trends in the agricultural sector of Qatar from 2010 to 2021, showing breakdown into crop WF (including cereals and fodder, greenhouse fruits and vegetables, and open field fruits and vegetables) and livestock WF (including red meat, poultry meat, milk and dairy products, and eggs).
Water 16 01185 g002
Figure 3. Water footprint (WF) trends in the urban sector of Qatar from 2010 to 2021, encompassing the commercial, governmental, and household sector WFs.
Water 16 01185 g003
Figure 4. Water footprint (WF) trends in the industrial sector of Qatar from 2006 to 2021, covering the mining sector (oil and natural gas), electricity generation, and other industrial activities.
Water 16 01185 g004
Figure 5. The water footprint (WF) and virtual water of import (VWI) and export (VWE) trends in Qatar from 2012 to 2021.
Water 16 01185 g005
Table 1. Results for green and blue evapotranspiration (ET), green and blue crop water use (CWU), green and blue water footprint (WF), and the average WF for the period of 2010 to 2020 in Qatar. * Tomatoes are grown in both open filed and greenhouse systems and are accounted for in both categories.
CropET Green (mm)ET Blue (mm)CWU Green (m3/ha)CWU Blue (m3/ha)Average Yield (ton/ha)WF Green (m3/ton)WF Blue (m3/ton)Average Production (ton/y)Average WF (m3/ton)
Cereals and Fodder
Fodder11314130820.22515,0002
Greenhouse Fruits and Vegetables
Cucumber25183247183010121813,70021
Tomatoes *26578259578044613017,100136
Open Field Fruits and Vegetables
Pumpkins26366259366020131833430196
Marrows25187247187016151174320133
Eggplant26773260773025103093990320
Sugar Melons25174247174011231641270187
Dates629986229980115690026,300955
Table 2. The total water footprint (WF) within Qatar from 2010 to 2021 covering the agricultural, urban, and industrial sectors.
Groups Total WF (Million m3/y)
201020112012201320142015201620172018201920202021
Agricultural WF373537494850515259576163
Crop WF323031423940404043414346
Livestock WF5567910111216161817
Urban WF186619922387272831983539385336803701411841873779
Commercial WF1411453564204754291190515231658707569
Governmental WF31537735140851312908139551090121011601230
Household WF141014701680190022101820185022102380225023201980
Industrial WF172620182199225721962204221822032220220121962251
Mining and Quarrying WF138016201760181017501750176017401750173017301770
Electricity Generation WF 63687877869395102107111106113
Other283330361370360361363361363360360368
Total WF Area362940454623503454425793612259355980637664446093
Table 3. The WF area, virtual water of imports (VWI) and exports (VWE), net virtual water import (NVWI), the WF of national consumption, the external WF consumption, the internal WF consumption, the virtual water budget (VWB), the water dependency %, water self-sufficiency %, water export fraction %, and reliance on natural resources % in Qatar from 2012 to 2021.
Groups Total WF (Million m3/y)
2012201320142015201620172018201920202021
WF Area4623503454425793612259355980637664446093
Virtual Water Import5440529063307350826076308930952090607520
Virtual Water Export1510159015301700163014401260125012401300
Net Virtual Water Import3940370048005650663061907670827078206220
WF Consumption8570872010,20011,40012,80012,10013,70014,60014,30012,300
External WF Consumption4630447055006400732068208180877083306800
Internal WF Consumption3940425047305050543053005480588059305510
Virtual Water Budget10,10010,30011,80013,10014,40013,60014,90015,90015,50013,600
Water Dependency % 54515456575660605855
Water Self Sufficiency %46494644434440404245
Water Export Fraction %25242223212017161618
Reliance on Natural Resources %4443333333
Disclaimer/Publisher’s Note: The statements, opinions and data contained in all publications are solely those of the individual author(s) and contributor(s) and not of MDPI and/or the editor(s). MDPI and/or the editor(s) disclaim responsibility for any injury to people or property resulting from any ideas, methods, instructions or products referred to in the content.

